Abstract
This study aims at designing and developing a new technique to harvest solar energy from asphalt pavements. The proposed energy harvester system consists of a pavement solar box with a transparent polycarbonate sample and a thin-film solar panel. This device mechanism can store energy in a battery charged over daytime and later convert it into electric power as per demand. A wide range of polycarbonate samples containing different thicknesses, elastic moduli, and light transmission properties were tested to select the most efficient materials for the energy harvester system. Transmittance Spectroscopy was conducted to determine the percent light transmission property of the polycarbonate samples at different wavelengths in the visible spectrum. Finite Element Analysis modeling of the pavement–tire load system was conducted to design the optimal energy harvester system under static load. It was followed by the collection of data on the generated power under different weather conditions. The energy harvesters were also subjected to vehicular loads in the field. The results suggest that the proposed pavement solar box can generate an average of 23.7 watts per square meter continuously over 6 h a day under sunny conditions for the weather circumstances encountered in South Texas while providing a slightly smaller power output in other weather circumstances. It is a promising self-powered and low-cost installation technique that can be implemented at pedestrian crossings and intersections to alert distracted drivers at the time of pedestrian crossing, which is likely to improve pedestrian safety.
1. Introduction
Sustainable energy is considered a principle of exploiting energy sources to satisfy the present generation’s needs without adversely affecting future generations’ ability to meet their needs [1]. The rapid industrial development and population growth worldwide demand the search for sustainable energy sources. A considerable amount of research and innovation have been performed to discover and develop energy harvesting technologies. Energy harvesting is the technique of accumulating and storing energy from a system and converting it into electrical energy [2]. Energy harvesting sources can be categorized into two major groups: macro and micro energy harvesting sources. Large-scale energy harvesting sources are referred to as macro energy harvesting sources and include solar, hydro, and wind energy. Micro energy harvesting is associated with small-scale energy harvesting sources, which comprise electromagnetic, electrostatic, mechanical, and geothermal variations [3,4,5,6]. As roadway infrastructures are continuously exposed to solar radiation, mechanical loading and vibration, geothermal energy, and wind energy, they can be used as a source of sustainable energy to extract energy using specific technologies [7,8,9,10]. Energy harvesting from transportation infrastructures has the potential to achieve sustainable transportation infrastructure systems.
Current energy harvesting systems used for energy harvesting from roadways consist of two main types, i.e., thermal- and mechanical-based systems. The first type converts solar energy from asphalt pavements into electrical energy using solar radiation and thermal gradients. The thermal gradient system involves a thermoelectric generator (TEG) and an asphalt solar collector (ASC), while the solar radiation system generates electrical energy by incorporating photovoltaic techniques [11,12,13]. Solar photovoltaic techniques include solar panel roads and solar-powered noise barriers [14,15]. Solar panel roads comprise three basic layers: (a) a pavement surface layer; (b) an electrical layer; and (c) a base layer [7]. They have approximately 85% efficiency in comparison with the ideal angle with the sun [16]. The mechanical-based energy harvesters include piezoelectric harvesters and electromagnetic systems, including hydraulic, electromechanical, and micro-electro-mechanical systems [17,18,19,20].
The world’s first solar bike path was installed in the Netherlands in 2014 [21]. This 70 m bicycle lane, named SolaRoad, was built in Krommenie by implementing solar collectors on a bicycle path [5,15]. In 2016, the route was expanded to 100 m because of its satisfactory performance. Solar collectors were applied to 118 square meters of the bicycle path in 2014 and extended to 144 square meters in 2016 [16,22]. This pilot project was constructed by incorporating a prefabricated panel technology developed by an association of the Netherlands Organization for Applied Scientific Research (TNO), Imtech (Dynniq), Ooms Civiel, and the province of Noord Holland [21,22]. SolaRoad consists of concrete modules of 2.5 by 3.5 m. These concrete modules have been used in the bottom layer to replace the top surface of the standard asphalt pavement [15,16]. Transparent tempered glass with a rough and transparent coating was used as the top layer. About 1 cm thick, the top layer is skid-resistant and strong enough to act as a safe road surface. Within these two layers, there are crystalline silicon solar cells [5,23]. It produces 70 kWh per square meter yearly, and the construction cost was USD 1.21 per square meter [16].
Later, in 2016, France opened the world’s first solar road in the region of Normandy. It is a 1-km-long road containing 2800 square meters of photovoltaic panels [24]. The produced power was exclusively used to run the street lighting of the village [16]. Colas introduced this pilot project. They partnered with the French National Solar Energy Institute (INES) to develop this solar road tech, known as Wattway [21,23]. Wattway’s panel contains a very thin film of polycrystalline silicon. These panels are only a few millimeters thick with a coating of multilayer substrate containing resins and polymers, transparent enough to pass sunlight and resistant enough to carry traffic loads. They are extremely sturdy. The main advantage of these heavy-duty, skid-resistant photovoltaic panels is they can be directly applied to existing roads and highways [16,21]. This road produces 99 kWh per square meter annually and the expense was USD 2.16 per square meter [16].
China opened the world’s first solar highway in Jinan. This 1-km-long stretch of expressway has two lanes with the addition of an emergency lane. This highway contains 5875 square meters of photovoltaic cells and can produce up to 1 million kWh annually, enough to power 800 Chinese homes [23,24]. It has three layers. The top layer consists of transparent (translucent) concrete with comparable structural properties to standard asphalt. Light optical elements are embedded inside the transparent concrete, which allows it to transmit sunlight to the photovoltaic cells underneath [23,25]. The central layer is comprised of photovoltaic panels. These panels are coated with a special silicon film that enables them to withstand the traffic loads. There is insulation material in the bottom layer that separates the solar panels from the damp earth underneath [16,23]. This highway can produce 170 kWh annually per square meter, and the production cost was USD 481.86 per square meter [16].
The advent of new energy harvesting technologies promises improvements in safety that reduce the number of transportation fatalities. In the United States alone, 33,654 fatal motor vehicle traffic crashes were reported in 2018, and this resulted in 36,560 traffic cash fatalities [26]. Although high design speeds are desired for automobile safety, higher vehicle speeds increase the number of pedestrian and bicyclist crashes [27,28]. As pedestrians are given fewer considerations during roadway design, they are more susceptible to traffic crashes, especially where traffic laws are not adequately enforced [29]. This susceptibility causes over 270,000 pedestrian fatalities every year all over the world [30]. According to the 2018 Traffic Safety Facts report, one pedestrian was killed every 84 min on average in a traffic crash in the United States. This report also shows that 6283 pedestrian fatalities occurred in the same year (17% of the total number of traffic fatalities) [31]. As pedestrians are provided with less protection than drivers, pedestrian-vehicle conflicts are common at intersections [32]. Approximately 25% of pedestrian fatalities occur at intersections [33]. A recent study in San Antonio, Texas, found that from 2013 to 2017, a total of 1371 pedestrian crashes occurred at intersections, which is 31% of the total number of pedestrian crashes in the city [34]. A lack of illumination and distracted drivers are two of the primary reasons for these crashes at intersections [35,36].
This study aims at developing a new technique to reduce pedestrian crashes at intersections by implementing energy harvesting technologies. While this is a very promising research arena, very little work has been done to implement this concept. As asphalt pavements are exposed to a great amount of solar radiation for most of the daytime, it could be possible to harness this energy by utilizing energy harvesting principles. The objective is to use the pavement infrastructure to develop a sustainable energy system that can alert the approaching drivers of crossing pedestrians. This work focuses on developing a new approach that ensures optimal use of energy resources and can produce clean energy continuously and improve pedestrian safety at intersections.
2. Objective
This study attempts to enhance pedestrian safety at intersections by providing self-powered illumination to alert the approaching drivers of crossing pedestrians with an addition of a pavement solar box. This pavement solar box utilizes the energy harvesting technique by using solar radiation. The objectives of this study are:
- to design and develop an energy harvester system that utilizes sunlight imposed on the pavement and improves pedestrians’ safety at intersections;
- to carry out finite element analysis to develop an optimum structural configuration for the solar box;
- to determine the power generated by this designed energy harvester module both under laboratory and outdoor conditions;
- to evaluate the performance of this technology under vehicular loads;
- to assess the power generation of the energy harvester under solar irradiance and illuminance; and
- to perform an economic analysis of the implementation of this system.
3. Design and Fabrication
3.1. Conceptual Design
The design concept consists of constructing a pavement solar box that harvests energy using the solar radiation imposed on pavements. It is comprised of three layers as illustrated in Figure 1a. Each layer must fulfill specific purposes.
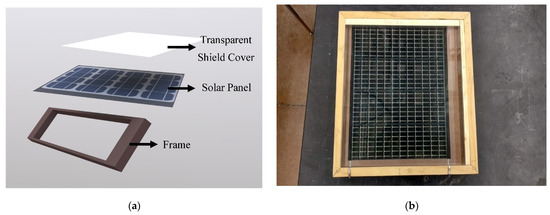
Figure 1.
(a) Schematic diagram of the pavement solar box; (b) pavement solar box after assembly.
3.1.1. Top Layer
The top layer needs to be strong enough to withstand the traffic loads and vehicular impacts. The top layer material must provide adequate protection for the optical layer. It should not be deflected over the optical layer as it may lead to the transmission of traffic loads to the solar panels directly. It must be transparent to transmit the sunlight to the optical layer to facilitate power generation. The top layer material must have a wide operating temperature range to perform properly under scorching heat and bitterly cold conditions. As water leakage and pollutant penetration can degrade solar panels’ performance underneath, the top layer must be frost- and moisture-resistant and sealed enough to resist water infiltration. Major and minor rehabilitation techniques should also be considered to ensure a convenient maintenance method for replacing the top layer.
3.1.2. Optical Layer
This layer is the most important segment of the pavement solar box. It will contain photovoltaic cells to convert solar radiation into electrical energy. As these cells will be exposed to outdoor conditions for a long time, they should effectively handle high temperatures.
3.1.3. Bottom Layer
This layer will separate the photovoltaic panels from the base material. It needs to be strong enough to support the entire structure and it will transmit the vehicular loads to the soil layer underneath.
3.2. Material Selection
3.2.1. Top Layer
A transparent polycarbonate sheet was selected as the top layer material for the pavement solar box. Polycarbonate (PC) is a high-performance thermoplastic with transparency and higher ductility, shear strength, and impact resistance [37]. PC materials possess an almost 250 times higher impact resistance than standard glass, which makes PC a very strong polymer [38]. Due to the extreme sheer strength of the sheets, PC is considered to be virtually unbreakable. This high impact resistance and sheer strength allow it to resist the huge loads exerted on it. Hence, it will be resilient enough to withstand traffic loads for extended periods. Since cracks do not propagate significantly on polycarbonate, it will not break easily. As polycarbonate holds a wide range of operating temperatures, it will operate properly under harsh conditions [39].
Three different PC samples containing different thicknesses, light transmittances, and strength attributes were considered options for the pavement solar box’s top layer in terms of power generation and durability. PC sample I is a machine-grade polycarbonate sheet that is manufactured by Quadrant EPP USA and commercially known as “PC 1000”. It is made with resin that meets ASTM D3935 [40]. PC sample II is a three-ply Lexan polycarbonate and acrylic laminate primarily developed for security protection. It is manufactured by Global Security Glazing, meets the inspection criteria set forth in ASTM C1349, and is commercially known as “Lexgard MP 750”. Lexgard MP 750 laminate with a Margard surface combines dependable ballistics protection and exceptional abrasion resistance [41]. PC sample III combines the impact strength of a Lexan polycarbonate sheet with a proprietary abrasion-resistant surface that approaches glass in performance. It is manufactured by Sabic IP US LLC and commercially known as “Lexan MR 10” [42]. Table 1 presents a comparison of the properties of the PC samples. These samples’ skid resistance properties were not available since polycarbonate materials are not commercially manufactured for pavement infrastructure. As PC sample I is a machine-grade polycarbonate and is not optically clear, a transparency test was not carried out on it. Hence, industrial data regarding the light transmission rate for PC sample I are not available.

Table 1.
Comparison of properties among polycarbonate samples.
3.2.2. Optical Layer
A thin-film solar panel was used in the optical layer due to its advantage over traditional crystalline solar panels for this particular application. Thin-film solar panels can be used under outdoor conditions for a more extended period as they are less affected by high temperatures compared with the traditional crystalline solar panels [43]. Due to their unique cell layout, thin-film solar cells exhibit better performance under partial shading conditions than first-generation solar panels [44]. Vehicles will move over the pavement solar boxes at irregular intervals or stay on top of them if traffic congestion occurs. These circumstances may result in partial shading conditions for solar panels and thin-film solar panels are best suited to handle this situation. As thin-film solar cells are flexible and lightweight, they can more effectively handle traffic loads and impacts than conventional crystalline solar cells. A 3.08 W–15.4 V thin-film solar panel was used in the optical layer of the pavement solar box.
3.2.3. Bottom Layer
Since pine wood is lightweight, holds a great deal of stiffness and resistance to shock, and is readily available worldwide, it was selected as the base material to support the entire pavement solar box system.
3.3. Fabrication
Stiffeners were provided to the bottom layer to facilitate the load distribution mechanism. Tempered hardboard was placed horizontally atop stiffeners to resist the sagging of thin-film solar panels. A thin-film solar panel and a PC sample were placed on the top of the bottom layer to complete the assembly of the pavement solar box as shown in Figure 1b. The pavement solar box needs to be completely sealed to prevent water and pollutant infiltration from rainfall or runoff that may lead to the disruption of power production. In this prototype, a simple platform enclosure that is easy to fabricate was proposed to demonstrate the concept of the pavement solar box. Other materials of better resistance to moisture and a higher bearing capacity to traffic loading will be utilized in future development.
4. Transmittance Spectroscopy
4.1. Background
Spectroscopy is the means of studying the interaction between particles and electromagnetic radiation [45]. It includes a visible light spectrum, X-ray, gamma, and UV rays, and involves any interaction between light and matter, covering transmittance, absorption, reflection, and many others. When a sample is exposed to electromagnetic radiation, it can absorb some frequencies and transmit the rest. A portion of the radiation can also be reflected in the source. This absorbed and transmitted spectra can be evaluated to gather information about the sample. Transmittance spectroscopy works with the radiation that transmits through the sample. This test was carried out on the PC samples to determine their transmittance percentage at different wavelengths in the visible light range. The visible spectrum is the range of electromagnetic wavelengths that are visible to the human eye. Visible wavelengths fall in the range of 380 to 750 nm [46].
4.2. Test Setup
A fiber-optic tungsten halogen light was used as the light source, which can generate wavelengths in the range of 360 to 2400 nm. It has a 6.7 mW power output when attached to a 600 μm fiber cable. Collimating lenses with a diameter of 6 mm and a confocal length of 8.7 mm were used to convert the divergent light beams into a parallel light beam. The lenses were positioned in parallel for the transmission of light. The distance between the lenses was kept to 76.2 mm throughout the test. The halogen light source transmits a light beam through the optical fiber cable to the collimating lenses in a free light beam path to begin the test. The transmitted light’s collection and the sample illumination were performed through the optical fibers as depicted in Figure 2a. Transmitted light travels through the optic fiber to the spectrometer and the spectrometer compares the transmitted light from the source and measures the transmittance percentage at each wavelength.
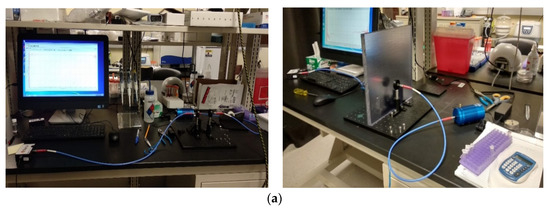
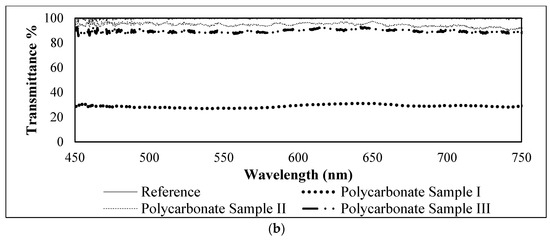
Figure 2.
(a) Test setup of transmittance spectroscopy; (b) comparison of observed transmittance among the polycarbonate samples.
4.3. Comparison of Observed Transmittance among the Polycarbonate Samples
We considered 100% transmittance to be the reference. It was achieved by keeping no object between the collimating lenses, which ensures a free light beam path between the lenses. Throughout this spectroscopy process, a 450 nm to 750 nm wavelength range was considered. PC samples were placed between the collimating lenses to observe the percentage transmittance. Transmittance spectroscopy was conducted at three different points for each polycarbonate sample and then the average was taken at each wavelength containing the transmittance percentage measured by the spectrometer. Figure 2b illustrates the comparison of percentage transmittance at each wavelength in the visible light range among the polycarbonate samples. A total of 29% transmittance was observed for PC sample I, while PC samples II and III exhibited 95% and 90% transmittance, respectively [23].
5. Finite Element Analysis
Three polycarbonate samples were considered in the three different pavement solar boxes modeled in this study. The boxes were labeled Pavement Solar Box I, Pavement Solar Box II, and Pavement Solar Box III, containing polycarbonate samples I, II, and III, respectively. Finite element analyses were conducted to analyze the response of these pavement solar boxes under vehicular load and determine their optimal design configuration. The commercial software Abaqus was used to construct 3D pavement models in which the pavement solar box was placed on the top of a typical pavement infrastructure. The resulting stress and deformation fields were compared to the generated stress and deformation of a typical pavement structure considering asphalt, base, sub-base, and subgrade layers.
5.1. Pavement Model Dimensions and Material Properties
The analyzed pavement structure had a length of 304.8 mm and a width of 304.8 mm, which are the dimensions selected for the pavement solar box and were kept constant throughout this study. The material properties of the pavement infrastructure and solar box were assumed to be linearly elastic for the static analysis. Pine wood is one of the most abundant softwoods grown in the United States. They cover an extensive range of Young’s modulus values due to the availability of many species [47]. For the simplicity of the model, the pine wood’s Young’s modulus was considered an average of 9000 MPa. Typical values of Poisson’s ratio were considered for each layer [48]. The layer thickness, Young’s modulus (E), and Poisson’s ratio (ν) values used for the static analysis are listed in Table 2. The Young’s modulus for the asphalt layer used in the finite element was chosen at the temperature of 25 °C.
Table 2.
Material properties for the static structural analysis.
5.2. Assumptions for the Loading Conditions, Boundary Conditions, and Finite Element Mesh
A 445/50R22.5 tire was assumed to be on top of the pavement structure. According to Moazami et al. (2011), this tire creates a 201 mm footprint length and a 376 mm footprint width at a tire inflation pressure of 725 kPa (105 psi) [49]. The tire pressure was presumed to act at the center of the considered tire imprint area. The boundary conditions were defined to capture the response of an actual pavement infrastructure. The lower surface of each layer was assumed to deform freely. As the pavement will entirely support the solar box, the vertical surfaces were considered to endure no displacement in the lateral, axial, and longitudinal directions. Non-slip tie constraints were considered among the layers of the pavement infrastructure. The finite element mesh was finer near the pavement model’s top surface to offer higher resolution around the pavement solar box and the top layer (Figure 3). The mesh was coarsened away from the top surface. A total of 7046 elements and 10,213 nodes were used in the analysis.
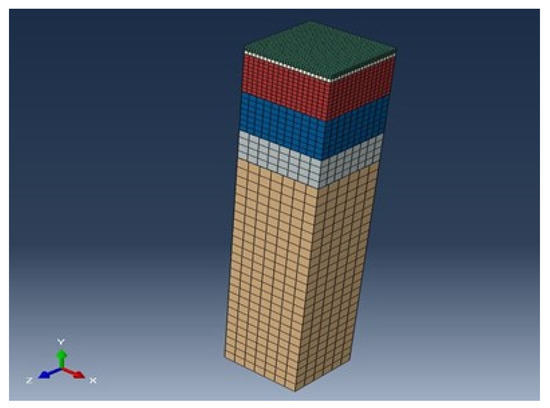
Figure 3.
Finite element mesh between layers of the pavement model.
5.3. Observed Data from Finite Element Analysis
Finite element analyses were conducted on a model representing the typical pavement structure and the models containing each of the pavement solar boxes. The temperature in the finite element analysis was selected to be 25 °C. The typical pavement model developed a 0.686 MPa vertical stress and 29.14 microns under the applied load (Figure 4a), while the model with pavement solar box I (228.6 mm) had a 0.691 MPa vertical stress and a vertical deformation of 29.03 microns (Figure 4b). Table 3 describes the comparison of the observed data from the simulation of the remaining pavement solar boxes. The table shows that any of the three designed pavement solar boxes can replace the top layer of a pavement surface without causing any structural failure or major alteration [23].
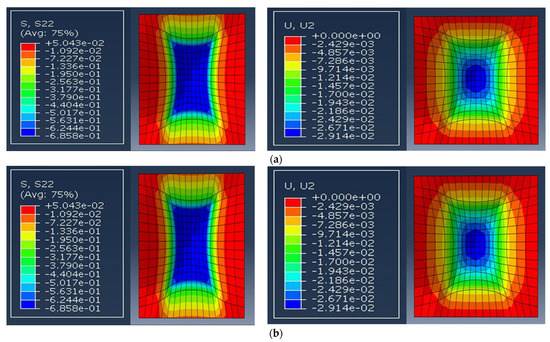
Figure 4.
Vertical stress (S) and deformation (U) for (a) typical asphalt pavement; (b) Pavement Solar Box I.
Table 3.
Comparison of observed data from the Finite Element Analysis.
6. Power Generation under Laboratory and Outdoor Conditions
Power generation data were collected simultaneously for each pavement solar box to analyze and compare among them. A multichannel data logger was used to collect and store data for this purpose.
6.1. Power Generation in the Laboratory
A wide range of resistance values, from 50 Ω to 50,000 Ω, was used in the laboratory environment to generate a load profile. The I-V curve and Power (mW) vs. Resistance (Ω) graphs were plotted for each pavement solar box to obtain a preliminary idea of the power generation capability of these boxes. A control solar panel without any protective polycarbonate cover was considered to compare the power generation from the pavement solar boxes. Figure 5 compares the I-V and Power vs. Resistance graphs among the pavement solar boxes. A small noise was observed in I-V curves when the voltage value was less than 0.5 V for pavement solar boxes. While Pavement Solar Box I generated maximum power at 15,000 Ω, Pavement Solar Boxes II and III along with the control solar panel produced maximum power at 10,000 Ω. Since this data collection was performed in the laboratory under ambient light condition and solar panels need solar energy to generate expected power, the produced power was very low. It can be observed from the graphs that all of them produced comparable voltage, current, and power under laboratory conditions. Though all these graphs were analogous in certain respects, some power drop was observed for the pavement solar boxes as none of them are 100% transparent. Pavement Solar Boxes I, II, and III generated 53%, 81%, and 78% peak power, respectively, in comparison with the control solar panel.
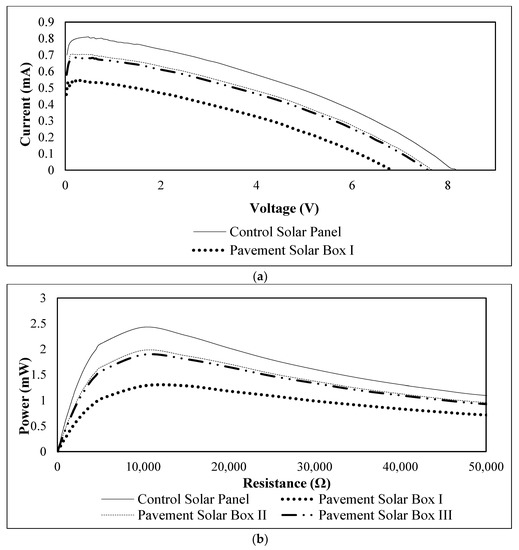
Figure 5.
Comparison of (a) I–V curves and (b) Power vs. Resistance Curves among the pavement solar boxes in the laboratory.
6.2. Power Generation under Outdoor Conditions
Power generation data under outdoor conditions was collected using variable and single resistor. Variable resistor was used to obtain an optimal resistance value that would work for all three pavement solar boxes under any weather condition and then this resistance value was used throughout the data collection period. The data were collected from April 2019 to May 2019 for this phase. All the data were collected from one location so that the angle of the sun for the location remained constant. The site was selected so that there would be no traffic interruption during the data collection period as well as it would have adequate sunlight throughout the data acquisition time. This place was near the Biotechnology Sciences and Engineering (BSE) Building of UTSA. The latitude and longitude of the selected site are 29.581° N and 98.618° W, respectively. Figure 6a shows the outdoor condition’s data collection setup. Power generation of pavement solar boxes was analyzed with respect to the control solar panel and within themselves to compare their power generation. Figure 6b–d illustrate the comparison of the power generation of pavement solar boxes I, II, and III, respectively, in comparison with the control solar panel. Power against each resistance was calculated as an average, which was collected over a period of time. These three graphs follow a similar pattern. Power generation decreased with the increment of resistance. Each of them produced maximum power at 100 Ω. Though the polycarbonate sample used in Pavement Solar Box I contains only a 29% light transmission attribute, it was observed from Figure 6b that beyond 100 Ω of resistance, it generated almost the same amount of power as the control solar panel. Since polycarbonate has very good heat resistance, the solar panel underneath the polycarbonate sample did not get warmer too easily. Hence, it maintained its power generation property effectively. On the other hand, since the solar panel was exposed to outdoor conditions for a long time, it got warmer. The efficiency of solar cells dropped when panels got warmer. Pavement Solar Boxes II and III also behaved in a similar manner as illustrated in Figure 6e. All these data were collected under sunny conditions over a 20-min period. Since the expected power was produced under sunny conditions and the pavement solar boxes provided maximum power at 100 Ω, which is more than 2.3 W in each case, this resistance value was used for the remainder of the data collection process.


Figure 6.
(a) Data collection under outdoor conditions. Comparison of (b) control solar panel (CSP) vs. Pavement Solar Box I (PSB I); (c) CSP vs. PSB II; (d) CSP vs. PSB III; (e) PSB II vs. PSB III power generation under outdoor conditions.
The pavement solar boxes along with the control solar panel generated a steady amount of power, when the optimal resistance was used as illustrated in Figure 7a–c. The power generation gap between them was almost equal throughout the power generation time. All these data were collected under sunny conditions over a 40-min period. The pavement solar boxes behaved comparably with the control solar panel throughout the data collection process. It can be observed from Figure 7d that Pavement Solar Box II and III generated power in such an equal quantity that it was hard to distinguish their respective power generation curves. As the weather was cloudy and sunny with intermittent clouds, these curves show sudden drops and peaks which depicts the solar shading. All the pavement solar boxes and the control solar panel behaved and produced power in a similar manner throughout the data collection period. The pavement solar boxes generated power continuously throughout the data collection periods, which also shows their continual power generation capability.
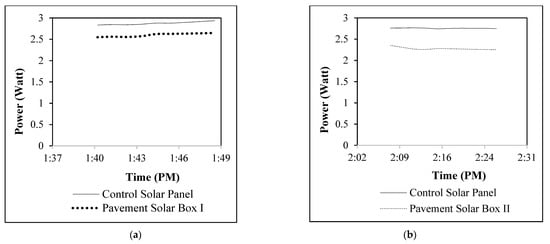

Figure 7.
Comparison of (a) CSP vs. PSB I; (b) CSP vs. PSB II; (c) CSP vs. PSB III; (d) PSB II vs. PSB III using the optimal resistance (100 Ω).
During the data acquisition phase, it was observed that the pavement solar boxes experienced some ups and downs in power production when certain weather changes occurred. Data were collected to find out how significantly weather changes throughout the day could affect these boxes’ power generation patterns. Figure 8 illustrates the power generation of Pavement Solar Boxes I and II throughout the day. Pavement Solar Boxes II and III faced a gradual reduction from 12 p.m. to 5 p.m. They produced more than 2 W until 5 p.m. After 5 p.m., a sharp decline in power generation was observed, which was reduced to only 0.05 W around 7–8 p.m. No shading occurred during that time and the weather conditions remained sunny. Since pavement solar boxes are laid flat on the top of a pavement surface, their position remained constant throughout the time. However, as both the Earth and the sun rotate on their axis, the angle of the sun to the pavement solar box changes as the day passes, which results in a gradual decrease in sunlight intensity and the power generation.
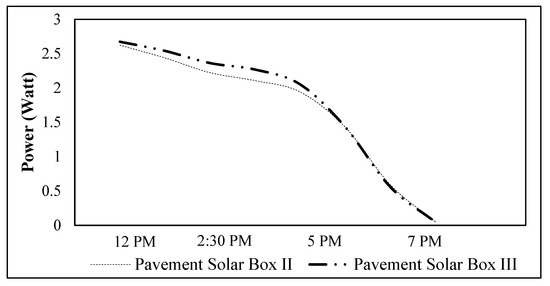
Figure 8.
Pavement Solar Box I and II power generation throughout the day.
6.3. Summary of Power Generation of Pavement Solar Boxes
Figure 9 provides a summary of the power generation of the pavement solar boxes. A wide range of data were collected from March 2019 to July 2019 to analyze the pavement solar boxes’ performance according to the time of the day and weather conditions. Weather conditions were categorized into three categories: sunny, cloudy, and afternoon.

Figure 9.
Summary of the power generation of the pavement solar boxes.
The pavement solar boxes produced the maximum power during the time frame of 11 a.m. to 5 p.m., while the productivity of the solar panels went down after 5 p.m. as the solar intensity goes down. While Pavement Solar Boxes I, II, and III produced an average of 2.13 W, 2.25 W, and 2.26 W, respectively, from 11 a.m. to 5 p.m., they generated an average of 1.03 W, 1 W, and 0.89 W, respectively, under the cloudy condition on the same time period. Pavement Solar Boxes I, II, and III produced an average of 0.32 W, 0.68 W, and 0.67 W, respectively, after 5 p.m. as illustrated in Figure 9 [23].
6.4. Relation of Power Generation to Solar Irradiance and Illuminance
After a comprehensive analysis of power generation in the laboratory and under outdoor conditions, the next phase of this study was focused on a performance evaluation of the power generation of the pavement solar boxes with respect to solar irradiance and illuminance.
6.4.1. Background
As the maximum solar irradiance on a horizontal surface at ground level could achieve 1120 W/m2 in a typical cloudless atmosphere in summer seasons, the solar irradiance meter was selected to meet this criterion [50]. The selected solar irradiance meter is commercially known as TES 132 and it can detect solar irradiation from 200 W/m2 to 2000 W/m2 [51].
Since the solar illuminance is 128 kLux for the Earth, an illuminance meter was selected to cover this range [52]. It is commercially known as HD450 and it can detect illumination up to 400 kLux, which covers the required range [53]. While Figure 10a shows the setup of the solar irradiance and illuminance meter with a multichannel data logger and a computer, Figure 10b indicates the sensors of these devices used to measure solar irradiation and illumination.
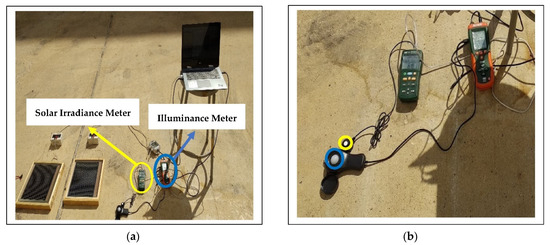
Figure 10.
(a) Solar irradiance and illuminance meter setup; (b) solar irradiance measuring sensor (yellow colored) and illuminance measuring sensor (blue colored).
6.4.2. Observation
Figure 11a illustrates the comparison of the power generation of Pavement Solar Boxes I, II, and III with respect to solar irradiance. The power generation behavior of these boxes can be observed and compared from this illustration. The boxes’ common behavior was that the power generation increased for each energy harvester with the increment of solar irradiance. The comparison of power generation of the pavement solar boxes with respect to illuminance is illustrated in Figure 11b. An increase in power generation with the increase of illuminance behavior was commonly observed for each pavement solar box.
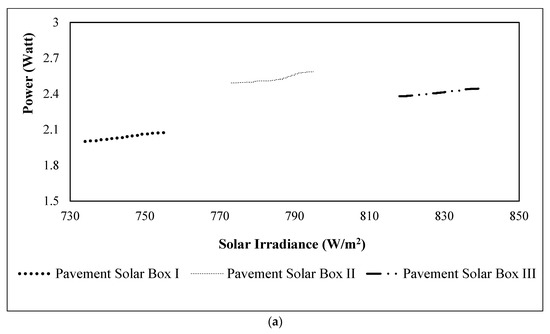
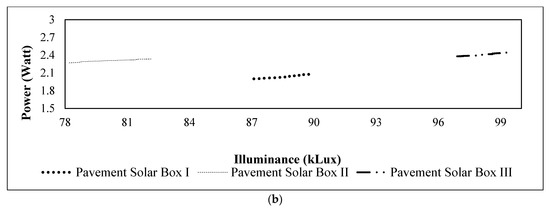
Figure 11.
Comparison of power generation with (a) solar irradiance; and (b) illuminance.
6.5. Power Generation during Shading
Shading can significantly decrease a solar panel’s efficiency and it can affect the productivity of pavement solar boxes [54]. Because of their unique cell layout, thin-film solar cells perform effectively under shading conditions. They do not lose their efficiency abruptly under shading conditions; rather, they lose productivity in a gradual manner.
6.5.1. Outdoor Condition
The data collection was carried out to evaluate the performance of the pavement solar boxes under shading conditions. Pavement Solar Box I was considered to evaluate the impact of shading on these boxes. Time and place were selected in such a way that it went through a complete shading process throughout the data collection period. It can be observed from Figure 12 that Pavement Solar Box I generated 1.28 W before the shading factor affected its productivity. When the whole box was fully shaded, its productivity went down to only 0.08 W. This sharp reduction from 1.28 W to 0.08 W occurred over a period of 4 min. It can be observed from the graph that when the box was completely shaded, its production rate was very low throughout that portion of the time. As the power production of pavement solar boxes is very low in shaded areas, they should be placed in a place where they will get a good amount of sunlight throughout the daytime.
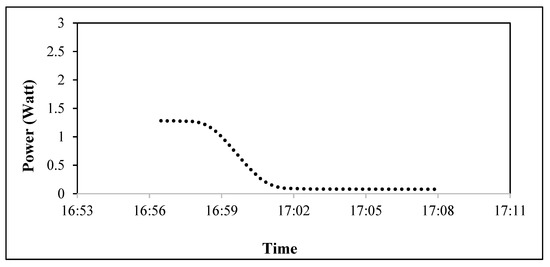
Figure 12.
Power generation of Pavement Solar Box I under shading conditions.
6.5.2. Performance based on Solar Irradiance and Illuminance
Pavement Solar Box III was picked to determine the relationship of power generation and solar irradiance under shading conditions. Figure 13a illustrates the performance evaluation of Pavement Solar Box III with respect to solar irradiance. Pavement Solar Box I experienced a major decline under shading conditions. A sharp decline in solar irradiance was also observed during this phase. The solar irradiance intensity slumped from 573 W/m2 to 149 W/m2 throughout this shading condition, while the power production reduced from 1.99 W to 0.75 W within a period of 5 min. The Power vs. Solar Irradiance curve follows a smooth decline throughout this shading condition. Figure 13b depicts the performance of Pavement Solar Box III with illuminance. This graph behaved comparably with the previous one. The illumination decreased during the shading condition, and the power production was reduced throughout this process. Hence, it can be observed from the graph that both the illuminance level and the power generation went through a significant decline during the shading condition. While the illuminance value went down from 70 kLux to 19 kLux, the power production of Pavement Solar Box III dropped from 1.99 W to 0.54 W.
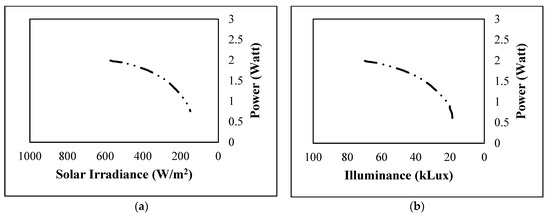
Figure 13.
(a) Power vs. Solar Irradiance; (b) Power vs. Illuminance graph for PSB III under shading conditions.
7. Field Test and Concept Implementation
Field tests were carried out in three different times during the same timeframe of the day to analyze the system performance of this technology under vehicular loads. This evaluation was conducted in three major phases. Figure 14 demonstrates the setup of the field test. Initially, the pavement solar boxes were subjected to vehicular loads. During each field test, the power output was observed. It was followed by transmittance spectroscopy after every field test. After the completion of all three field tests, the power generation of the pavement solar boxes was compared with a new pavement solar box that was not tested under a moving wheel.

Figure 14.
Field Test Setup.
7.1. Vehicle and Tire Specs
The same vehicle was used in all three field tests for the uniformity and simplicity of the evaluation process. The vehicle and tire specs are listed here:
- Vehicle model: 2005 Honda Accord EX V-6 Sedan 3.0 L; and
- Tire specs: P205/60R16.
7.2. Power Output of Pavement Solar Boxes during the Field Test
In each field test, the same amount of wheel drive, two front wheel drive, and two rear wheel drive was carried out on the top of the pavement solar boxes. Figure 15a–c illustrate the power output throughout the initial field test. It can be deduced from the graphs that these solar boxes only faced a sharp decline in power generation on that instant when the vehicle went over them. To verify the durability of the boxes, sometimes the vehicle stayed on the top of the pavement solar boxes for some time, which resulted in a power reduction because the positioning of the vehicle was blocking the sunlight and, hence, the productivity in that instant went down. The second and third field tests also exhibited a similar pattern. No pavement solar box faced any disruption in power production during the field tests.
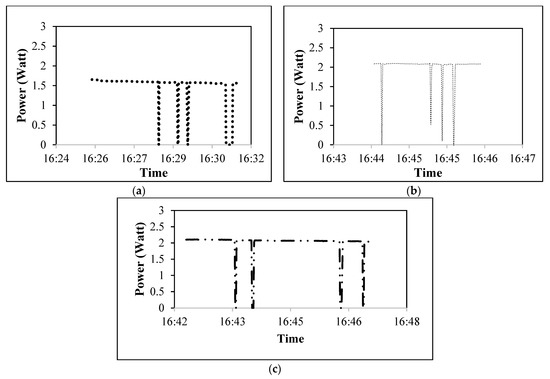
Figure 15.
Power output of (a) Pavement Solar Box I; (b) Pavement Solar Box II; and (c) Pavement Solar Box III during the field tests.
7.3. Transparency of Pavement Solar Boxes after Field Tests
After each field test, transmittance spectroscopy was conducted on the polycarbonate samples to determine their percent transmittance. At this time, four points were selected to do the spectroscopy analysis. Figure 16 demonstrates the observed percent transmittance among the PC samples after Field Test 1. This test shows that the transparency of PC sample I drops to 26% from 29% while PC sample II drops to 85% from 95% and PC sample III drops to 83% from 90% transmittance. Test results from Field Tests 2 and 3 also exhibited comparable results. Table 4 illustrates that the transparency of each PC sample dropped to some extent throughout the field test phase.
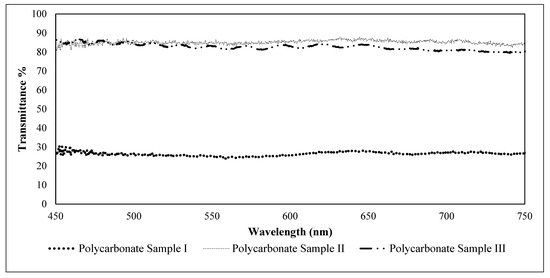
Figure 16.
Comparison of observed transmittance among the PC samples after field tests.
Table 4.
Percent transmittance of the polycarbonate samples after field tests.
7.4. Comparison of Power Generation of Pavement Solar Boxes after Field Tests
In this stage, the pavement solar boxes’ power output was compared to a new box that did not experience any experiment on it to obtain a comprehensive analysis. Figure 17a demonstrates that although the transmittance percentage of polycarbonate sample I drops to 22% from 29%, the power productivity remained almost equal. During this data collection period, old PSB I produced 98% of the power of new PSB I. The average power generation of old PSB I was 1.8 W, while the new one had an average of 1.84 W throughout this process. Although the transparency dropped due to field tests and material handling issues, there were no significant drops in power generation. This could be due to the fact that these scratches that reduced the transparency could not block the sunlight completely. As a result, sunlight can get through the thin-film solar cells through the polycarbonate sample using various angles of incident. The same comparable power output was observed for the remaining polycarbonate samples. Old PSB II and PSB III produced 99.7% and 99.3% of the power generation of the new PSB II and PSB III. A comparison of the power generation of Pavement Solar Boxes II and III after field tests is illustrated in Figure 17b,c.
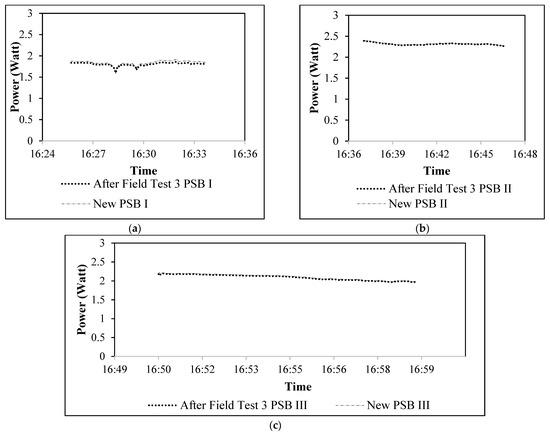
Figure 17.
Comparison of the power generation of (a) Pavement Solar Box I; (b) Pavement Solar Box II; and (c) Pavement Solar Box III after field tests.
7.5. Concept Implementation
The proposed solution aims at reforming the way the traditional road network system works. This solution, a pavement solar box, can harness solar energy by incorporating the concept of power generation from a solar panel with the exposed solar radiation on the pavement surface. This power can be stored in a battery charged over the daytime and it can later be converted into electrical energy as per demand. This methodology intends to take advantage of these pavement solar boxes that can be easily installed on pavement surfaces. They can be used to power light-emitting diode (LED)-embedded warning signage and highlight the crosswalks and pedestrian zones by providing self-powered LED illumination. Once a pedestrian crosses the intersection, they will be detected by the embedded sensors and the pavement (crossing marks) will be fully illuminated in both directions with the help of the embedded LED strip on the pavement solar box. This illumination improves the visibility of pedestrians to approaching vehicles. Figure 18 demonstrates the schematic diagram of implementing this technique at intersections.

Figure 18.
Schematic diagram of the implementation of pavement solar boxes at intersections.
8. Economic Analysis
The following materials were required throughout the fabrication process of each pavement solar box:
- a polycarbonate sample;
- a thin-film solar panel;
- pine wood;
- tempered hardboard;
- wire nails; and
- silicone caulking tools.
Though the prices of polycarbonate samples are different for pavement solar boxes, the other material prices are common for all of them. The cost summary and cost per energy unit for each pavement solar box are described in Table 5. It takes USD 20.4 per kWh of generation using Pavement Solar Box III, which is the minimum cost per energy unit among the pavement solar boxes.
Table 5.
Comparison of cost per energy unit among the pavement solar boxes [23].
Table 6 illustrates the expected cost per year of service life for each pavement solar box. The estimated total service life is 20 years for the pavement solar boxes. The replacement of solar panels is expected to occur every 10 years and the replacement of the polycarbonate sheet is estimated to occur every 4 years. The enclosure is expected to be permanent throughout its service life.
Table 6.
Expected cost per year of service life for the pavement polar boxes.
9. Summary and Conclusions
This study aspired to develop a new methodology to harvest solar energy from asphalt roadway pavement by utilizing a combination of thin-film solar cells and polycarbonate samples as the protection shield. Finite Element Analysis and field tests were carried out to design the optimal configuration and evaluate the performance of the system. Key findings of this study are summarized below:
- FEA demonstrates that the designed pavement solar boxes can replace a typical pavement surface’s top layer without causing any structural failure or major alteration.
- Pavement solar boxes were subjected to vehicular loads during the field test. These boxes as well as the control solar panel generated power in a similar pattern throughout the daytime. The variation in weather conditions did not affect their comparable performance.
- Pavement solar boxes along with the control solar panel experienced a gradual and abrupt reduction in the last phase of daytime due to the continuous change in the angle of the sun. However, it did not interrupt the continuous power production of pavement solar boxes.
- The pavement solar boxes sustained no significant damage or power drop throughout the field test. Later, a comparison of the power generation of these boxes showed that they produce approximately the same amount of power. This result shows that these pavement solar boxes can be implemented at intersections for a longer time. No abrupt power drops were observed, indicating that these boxes will not require frequent maintenance throughout their service life.
- Pavement Solar Boxes I, II, and III generated an average of 2.13 W, 2.25 W, and 2.26 W, respectively, from 11 a.m. to 5 p.m. It can be summarized from the collected data samples that the pavement solar boxes can produce an average of 2.2 W per square ft, equivalent to 23.7 W per square meter, continuously over a period of 6 h a day under sunny conditions for the weather circumstances encountered in South Texas while offering a lesser power output under other weather conditions. Pavement Solar Boxes I, II, and III can generate approximately 52 kWh, 63 kWh, and 62 kWh, respectively, per square meter annually considering 9 months of sunny conditions.
Since solar power does not emit any pollution when it is produced or consumed, these boxes can help reduce CO2 and other air pollutant emissions associated with conventional energy generation methods. A large-scale implementation of this technique has great potential for mitigating global warming and the urban heat island effect by reducing greenhouse gas emissions.
The longevity of these pavement solar boxes is limited by the inefficiency of the solar film and the deterioration of the polycarbonate sheet, whichever occurs first. Further long-term testing is suggested to determine the effective life span of these solar boxes. As these boxes are not likely to provide enough skid resistance with the pavement surface, they will be kept in the middle of the lane. It is anticipated that the size of these pavement solar boxes will be comparatively small with respect to the contact area of tire–pavement. Moreover, a smaller-size pavement solar box could also be smaller than a pedestrian’s footprint. Therefore, it is anticipated that the quality of surface friction will not be critical to the performance of the pavement solar box and its impact on the pavement. These boxes can be deployed at pedestrian crossings and intersections to alert distracted drivers when a pedestrian is crossing the crosswalk by providing an embedded self-powered LED strip on these boxes. It may reduce the number of crashes in conflict zones where pedestrians and drivers do not see each other. These boxes can improve the pedestrians’ visibility, particularly at rural and uncongested intersections lacking access to the utility grid and proper illumination. The advantage of implementing this technology at intersections is that it will be embedded in the pavement’s surface and not take up any public space. It is self-powered and requires a low-cost installation. This system can also be installed at non-intersection zones (school zones or highly populated zones) to improve pedestrian safety.
Author Contributions
Conceptualization, M.F.T.H. and S.D.; methodology, M.F.T.H., A.B.B. and D.F.; software, M.F.T.H., A.B.B. and D.F.; validation, M.F.T.H., A.B.B. and A.M.; formal analysis, M.F.T.H. and S.D.; investigation, M.F.T.H. and S.D.; resources, S.D.; data curation, M.F.T.H. and S.D.; writing—original draft preparation, M.F.T.H.; writing—review and editing, M.F.T.H., S.D., A.M. and A.B.B.; visualization, M.F.T.H. and S.D.; supervision, S.D. and A.M.; project administration, S.D.; funding acquisition, S.D. All authors have read and agreed to the published version of the manuscript.
Funding
The authors would like to acknowledge the financial support of CPS Energy (Grant No. SAT0000397) and Tran-SET (Transportation Consortium of South-Central States) (Grant No. PO-0000032407) for this work.
Conflicts of Interest
The authors declare no conflict of interest.
Abbreviations
The following abbreviations are used in this manuscript:
| ASC | Asphalt Solar Collector |
| CSP | Control Solar Panel |
| FEA | Finite Element Analysis |
| LED | Light Emitting Diode |
| PC | Polycarbonate |
| PSB | Pavement Solar Box |
| TEG | Thermoelectric Generator |
| UV | Ultraviolet |
Nomenclature
| ν | Poisson’s ratio |
| Ω | ohm |
| $ | dollar |
| E | Young’s Modulus |
| μ | micro |
| F | Fahrenheit |
| h | hour |
| k | kilo |
| Lux | luminous flux |
| m | meter |
| m | milli |
| M | mega |
| n | nano |
| Pa | Pascal |
| V | volt |
| W | watt |
References
- Lemaire, X. Glossary of Terms in Sustainable Energy Regulation; Renewable Energy and Efficiency Partnership, Centre for Management under Regulation, Warwick Business School, University of Warwick: Coventry, UK, 2004. [Google Scholar]
- Sodano, H.A.; Inman, D.J.; Park, G. A review of power harvesting from vibration using piezoelectric materials. Shock. Vib. Dig. 2004, 36, 197–206. [Google Scholar] [CrossRef] [Green Version]
- Harb, A. Energy harvesting: State-of-the-art. Renew. Energy 2011, 36, 2641–2654. [Google Scholar] [CrossRef]
- Khaligh, A.; Onar, O.C. Energy Harvesting: Solar, Wind, and Ocean Energy Conversion Systems; CRC Press: Boca Raton, FL, USA, 2017. [Google Scholar] [CrossRef]
- Duarte, F.; Ferreira, A. Energy harvesting on road pavements: State of the art. Proc. Inst. Civ. Eng.-Energy 2016, 169, 79–90. [Google Scholar] [CrossRef]
- Yildiz, F. Potential Ambient Energy-Harvesting Sources and Techniques. J. Technol. Stud. 2009, 35, 40–48. [Google Scholar] [CrossRef]
- Ahmad, S.; Abdul, M.M.; Farooqi, M.A. Energy harvesting from pavements and roadways: A comprehensive review of technologies, materials, and challenges. Int. J. Energy Res. 2019, 43, 1974–2015. [Google Scholar] [CrossRef]
- Dawson, A.; Mallick, R.; Hernandez, A.G.; Dehdezi, P.K. Energy harvesting from pavements. In Climate Change, Energy, Sustainability and Pavements; Springer: Berlin/Heidelberg, Germany, 2014; pp. 481–517. [Google Scholar] [CrossRef]
- Symeoni, A. A review on energy harvesting from roads. In MSc Environmental Engineering & Sustainable Infrastructure; KTH Royal Institute of Technology: Stockholm, Sweden, 2012. [Google Scholar]
- Morbiato, T.; Borri, C.; Vitaliani, R. Wind energy harvesting from transport systems: A resource estimation assessment. Appl. Energy 2014, 133, 152–168. [Google Scholar] [CrossRef]
- Datta, U.; Dessouky, S.; Papagiannakis, A.T. Harvesting thermoelectric energy from asphalt pavements. Transp. Res. Rec. 2017, 2628, 12–22. [Google Scholar] [CrossRef]
- Bobes-Jesus, V.; Pascual-Muñoz, P.; Castro-Fresno, D.; Rodriguez-Hernandez, J. Asphalt solar collectors: A literature review. Appl. Energy 2013, 102, 962–970. [Google Scholar] [CrossRef]
- Efthymiou, C.; Santamouris, M.; Kolokotsa, D.; Koras, A. Development and testing of photovoltaic pavement for heat island mitigation. Sol. Energy 2016, 130, 148–160. [Google Scholar] [CrossRef]
- Dezfooli, A.S.; Nejad, F.M.; Zakeri, H.; Kazemifard, S. Solar pavement: A new emerging technology. Sol. Energy 2017, 149, 272–284. [Google Scholar] [CrossRef]
- Jiang, H.F.; Cen, Y.Q.; Zha, X.D.; Zhang, Q.S. Current Situation and Development Trend of Solar Pavement Technology. In DEStech Transactions on Environment; Energy and Earth Sciences (EPE): Beijing, China, 2018. [Google Scholar] [CrossRef]
- Vossebeld, J.A. The Asphalt Collector and Solar Road on the A58: Research into the Potential of Applying the Asphalt Collector and Solar Road on the A58. Bachelor’s Thesis, University of Twente, Enschede, The Netherlands, 2018. [Google Scholar]
- Chen, Y.; Zhang, H.; Zhang, Y.; Li, C.; Yang, Q.; Zheng, H.; Lü, C. Mechanical energy harvesting from road pavements under vehicular load using embedded piezoelectric elements. J. Appl. Mech. 2016, 83, 081001. [Google Scholar] [CrossRef]
- Roshani, H.; Dessouky, S.; Montoya, A.; Papagiannakis, A.T. Energy harvesting from asphalt pavement roadways vehicle-induced stresses: A feasibility study. Appl. Energy 2016, 182, 210–218. [Google Scholar] [CrossRef]
- Li, Z.; Zuo, L.; Luhrs, G.; Lin, L.; Qin, Y.X. Electromagnetic energy-harvesting shock absorbers: Design, modeling, and road tests. IEEE Trans. Veh. Technol. 2012, 62, 1065–1074. [Google Scholar] [CrossRef]
- Zorlu, Ö.; Külah, H. A MEMS-based energy harvester for generating energy from non-resonant environmental vibrations. Sens. Actuators A Phys. 2013, 202, 124–134. [Google Scholar] [CrossRef]
- Johnston, A.; Riessner, M.; Luo, C. Some Recent Environmental Pavement Technologies-Fact or Fiction. In Proceedings of the TAC 2017: Investing in Transportation: Building Canada’s Economy—2017 Conference and Exhibition of the Transportation Association of Canada, St. John’s, NL, Canada, 24–27 September 2017. [Google Scholar]
- Moskvitch, K. News Briefing: In Num6ers-Sola Road. Eng. Technol. 2016, 11, 12–13. [Google Scholar] [CrossRef]
- Hossain, M.F.T. Feasibility Study of a Pavement Solar Box for Intersections. Doctoral Dissertation, The University of Texas at San Antonio, San Antonio, TX, USA, 2019. [Google Scholar]
- Wu, L.; Yuan, Y.; Wu, H. Solar Road Power Generation Assessment Based on Coupled Transportation and Power Distribution Systems. J. Phys. Conf. Ser. IOP Publ. 2020, 1659, 012041. [Google Scholar] [CrossRef]
- Gaurao, S.P.; Swapnal, V.P. Light Transmitting Concrete—A New Innovation. Int. J. Eng. Res. Gen. Sci. 2015, 3 Pt 2, 83–99. [Google Scholar]
- Fatality Analysis Reporting System (FARS)—NHTSA. Available online: https://www-fars.nhtsa.dot.gov/Main/index.aspx (accessed on 28 February 2021).
- Dumbaugh, E.; Li, W. Designing for the safety of pedestrians, cyclists, and motorists in urban environments. J. Am. Plan. Assoc. 2010, 77, 69–88. [Google Scholar] [CrossRef]
- Gårder, P.E. The impact of speed and other variables on pedestrian safety in Maine. Accid. Anal. Prev. 2004, 36, 533–542. [Google Scholar] [CrossRef]
- Gårder, P. Pedestrian safety at traffic signals: A study carried out with the help of a traffic conflicts technique. Accid. Anal. Prev. 1989, 21, 435–444. [Google Scholar] [CrossRef]
- Grise, E. A Spatial Analysis of Pedestrian Injury in the City of Toronto. Doctoral dissertation, University of Toronto, Toronto, ON, Canada, 2015. [Google Scholar]
- Traffic Safety Facts 2018 Data—NHTSA. Available online: https://crashstats.nhtsa.dot.gov/Api/Public/ViewPublication/812850 (accessed on 28 February 2021).
- Alhajyaseen, W.K.; Asano, M.; Nakamura, H. Estimation of left-turning vehicle maneuvers for the assessment of pedestrian safety at intersections. IATSS Res. 2012, 36, 66–74. [Google Scholar] [CrossRef] [Green Version]
- Retting, R.; Schwartz Consulting, S. Pedestrian Traffic Fatalities by State 2019 Preliminary Data; Spotlight on Highway Safety; Governors Highway Safety Association: Washington, DC, USA, 2019; pp. 1–44. [Google Scholar]
- Billah, K.A. Pedestrian Crash Analysis for San Antonio. Doctoral Dissertation, The University of Texas at San Antonio, San Antonio, TX, USA, 2018. [Google Scholar]
- Bullough, J.D.; Donnell, E.T.; Rea, M.S. To illuminate or not to illuminate: Roadway lighting as it affects traffic safety at intersections. Accid. Anal. Prev. 2013, 53, 65–77. [Google Scholar] [CrossRef] [PubMed]
- Stutts, J.C.; Reinfurt, D.W.; Staplin, L.; Rodgman, E. The Role of Driver Distraction in Traffic Crashes; AAA Foundation for Traffic Safety: Washington, DC, USA, 2001. [Google Scholar] [CrossRef] [Green Version]
- De la Colina Martínez, A.L.; Barrera, G.M.; Díaz, C.E.; Córdoba, L.I.; Núñez, F.U.; Hernández, D.J. Recycled polycarbonate from electronic waste and its use in concrete: Effect of irradiation. Constr. Build. Mater. 2019, 201, 778–785. [Google Scholar] [CrossRef]
- AcmePlatics.com: Acrylic vs. Polycarbonate. Available online: https://www.acmeplastics.com/Acrylic-Vs-Polycarbonate (accessed on 20 July 2020).
- Legrand, D.G.; Bendler, J.T. Handbook of Polycarbonate Science and Technology; CRC Press: Boca Raton, FL, USA, 2000. [Google Scholar] [CrossRef]
- TechPlasty—Engineering Plastics: PC 1000—Machine Grade Polycarbonate. Available online: https://www.techplasty.com/material/polykarbonat/pc1000-machine-grade-polycarbonate (accessed on 9 November 2021).
- Insulgard Security Products: Lexgard MP 750 Laminate. Available online: https://www.insulgard.com/wp-content/uploads/Insulgard_DS175_Lexgard_MP750_Laminate-1.pdf (accessed on 9 November 2021).
- SABIC: Lexan Margard MR 10 Sheet. Available online: https://sfs.sabic.eu/wp-content/uploads/resource_pdf/1612426959-35386025-LEXAN-MARGARD-MR10-Datasheet-US-2021.pdf (accessed on 9 November 2021).
- Fathi, M.; Abderrezek, M.; Djahli, F.; Ayad, M. Study of thin film solar cells in high temperature condition. Energy Procedia 2015, 74, 1410–1417. [Google Scholar] [CrossRef] [Green Version]
- Tzikas, C.; Gómez, G.; van den Donker, M.; Bakker, K.; Smets, A.H.; Folkerts, W. Do thin film PV modules offer an advantage under partial shading conditions. In Proceedings of the 33rd European Photovoltaic Solar Energy Conference and Exhibition, Amsterdam, The Netherlands, 25–29 September 2017; pp. 1593–1596. [Google Scholar]
- Herrmann, R.; Onkelinx, C. Quantities and units in clinical chemistry: Nebulizer and flame properties in flame emission and absorption spectrometry. Pure Appl. Chem. 1986, 58, 1737–1742. [Google Scholar] [CrossRef]
- Bourlai, T.; Hornak, L.A. Face recognition outside the visible spectrum. Image Vis. Comput. 2016, 55, 14–17. [Google Scholar] [CrossRef] [Green Version]
- Green, D.W.; Winandy, J.E.; Kretschmann, D.E. Mechanical properties of wood. In Wood Handbook: Wood as an Engineering Material, Centennial ed.; Ross, R.J., Ed.; Forest Products Laboratory: Madison, WI, USA, 2010. [Google Scholar]
- Beltrán, G.; Romo, M. Analysis of Poisson’s Ratio Effect on Pavement Layer Moduli Estimation—A Neural Network Based Approach from Non-destructive Testing. In Ibero-American Conference on Artificial Intelligence; Springer: Berlin/Heidelberg, Germany, 2012; pp. 371–380. [Google Scholar] [CrossRef]
- Moazami, D.; Muni, R.; Hamid, H.; Yusoff, Z.M. Effect of tire footprint area in pavement response studies. Int. J. Phys. Sci. 2011, 6, 5040–5047. [Google Scholar]
- Newport Corporation: Introduction to Solar Radiation. Available online: https://www.newport.com/t/introduction-to-solar-radiation (accessed on 20 July 2020).
- TES 132 Solar Power Meter. Available online: http://www.tes.com.tw/en/product_detail.asp?seq=284 (accessed on 17 May 2019).
- Wikipedia: Sunlight. Available online: https://en.wikipedia.org/wiki/Sunlight (accessed on 17 July 2020).
- Extech HD450: Datalogging Heavy Duty Light Meter. Available online: http://www.extech.com/products/HD450 (accessed on 17 July 2019).
- Ramaprabha, R.; Mathur, B.L. Impact of partial shading on solar PV module containing series connected cells. Int. J. Recent Trends Eng. 2009, 2, 56. [Google Scholar]
Publisher’s Note: MDPI stays neutral with regard to jurisdictional claims in published maps and institutional affiliations. |
© 2021 by the authors. Licensee MDPI, Basel, Switzerland. This article is an open access article distributed under the terms and conditions of the Creative Commons Attribution (CC BY) license (https://creativecommons.org/licenses/by/4.0/).