
Green Coalescent Synthesis Based on the Design for Environment (DfE) Principles: Brazilian Experience


Abstract
:1. Introduction
2. Backgrounds
3. Materials and Methods
3.1. Modeling Standard Coalescent and Green Coalescent Production Processes and Developing Paint Preparation
3.1.1. Standard Coalescent Synthesis (StC)
3.1.2. Green Coalescent (GrC) Synthesis
3.1.3. Building Paint Preparation
3.2. Life Cycle Modeling
Life Cycle Inventory (LCI)
4. Results and Discussion
Environmental Analysis
5. Alternative Green Coalescent (AGrC) Design and Performance Evaluation
5.1. AGrC Molecule Redesign
5.2. Comparison of Environmental Performance of StC vs. GrC vs. AGrC
5.2.1. Life Cycle Modeling and LCI
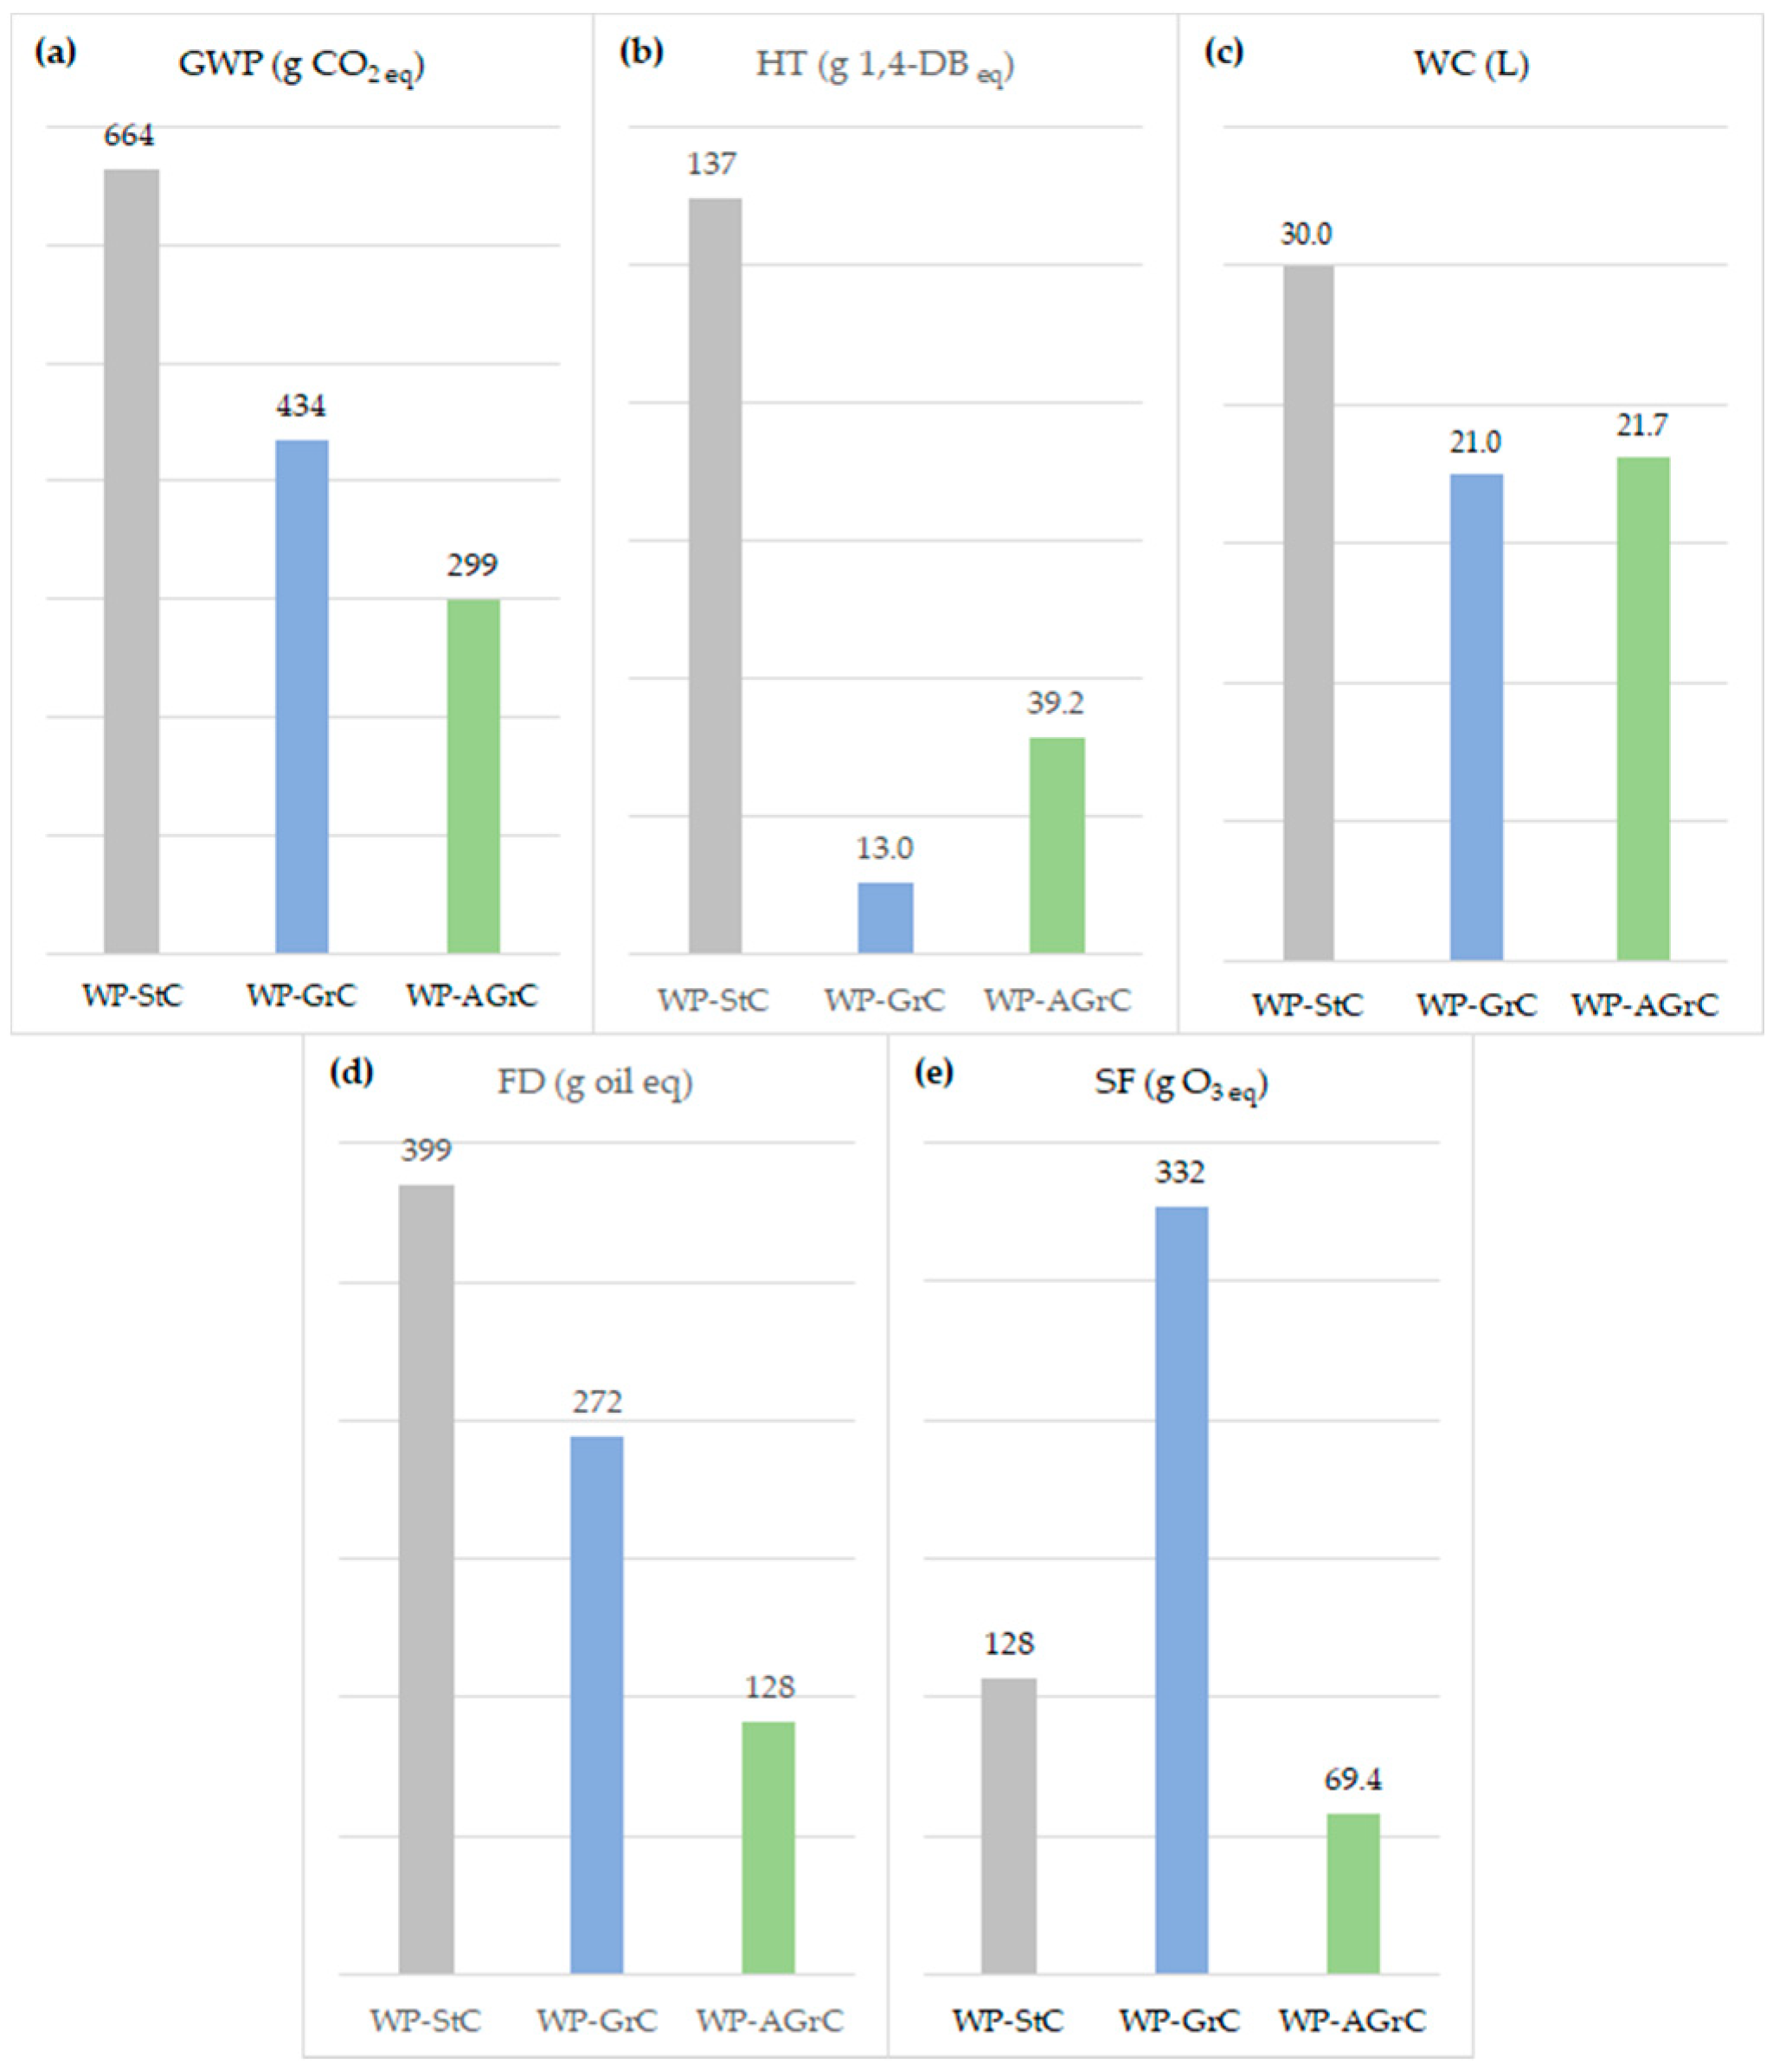
5.2.2. Comparison of Environmental Performance
5.2.3. Economic Analysis
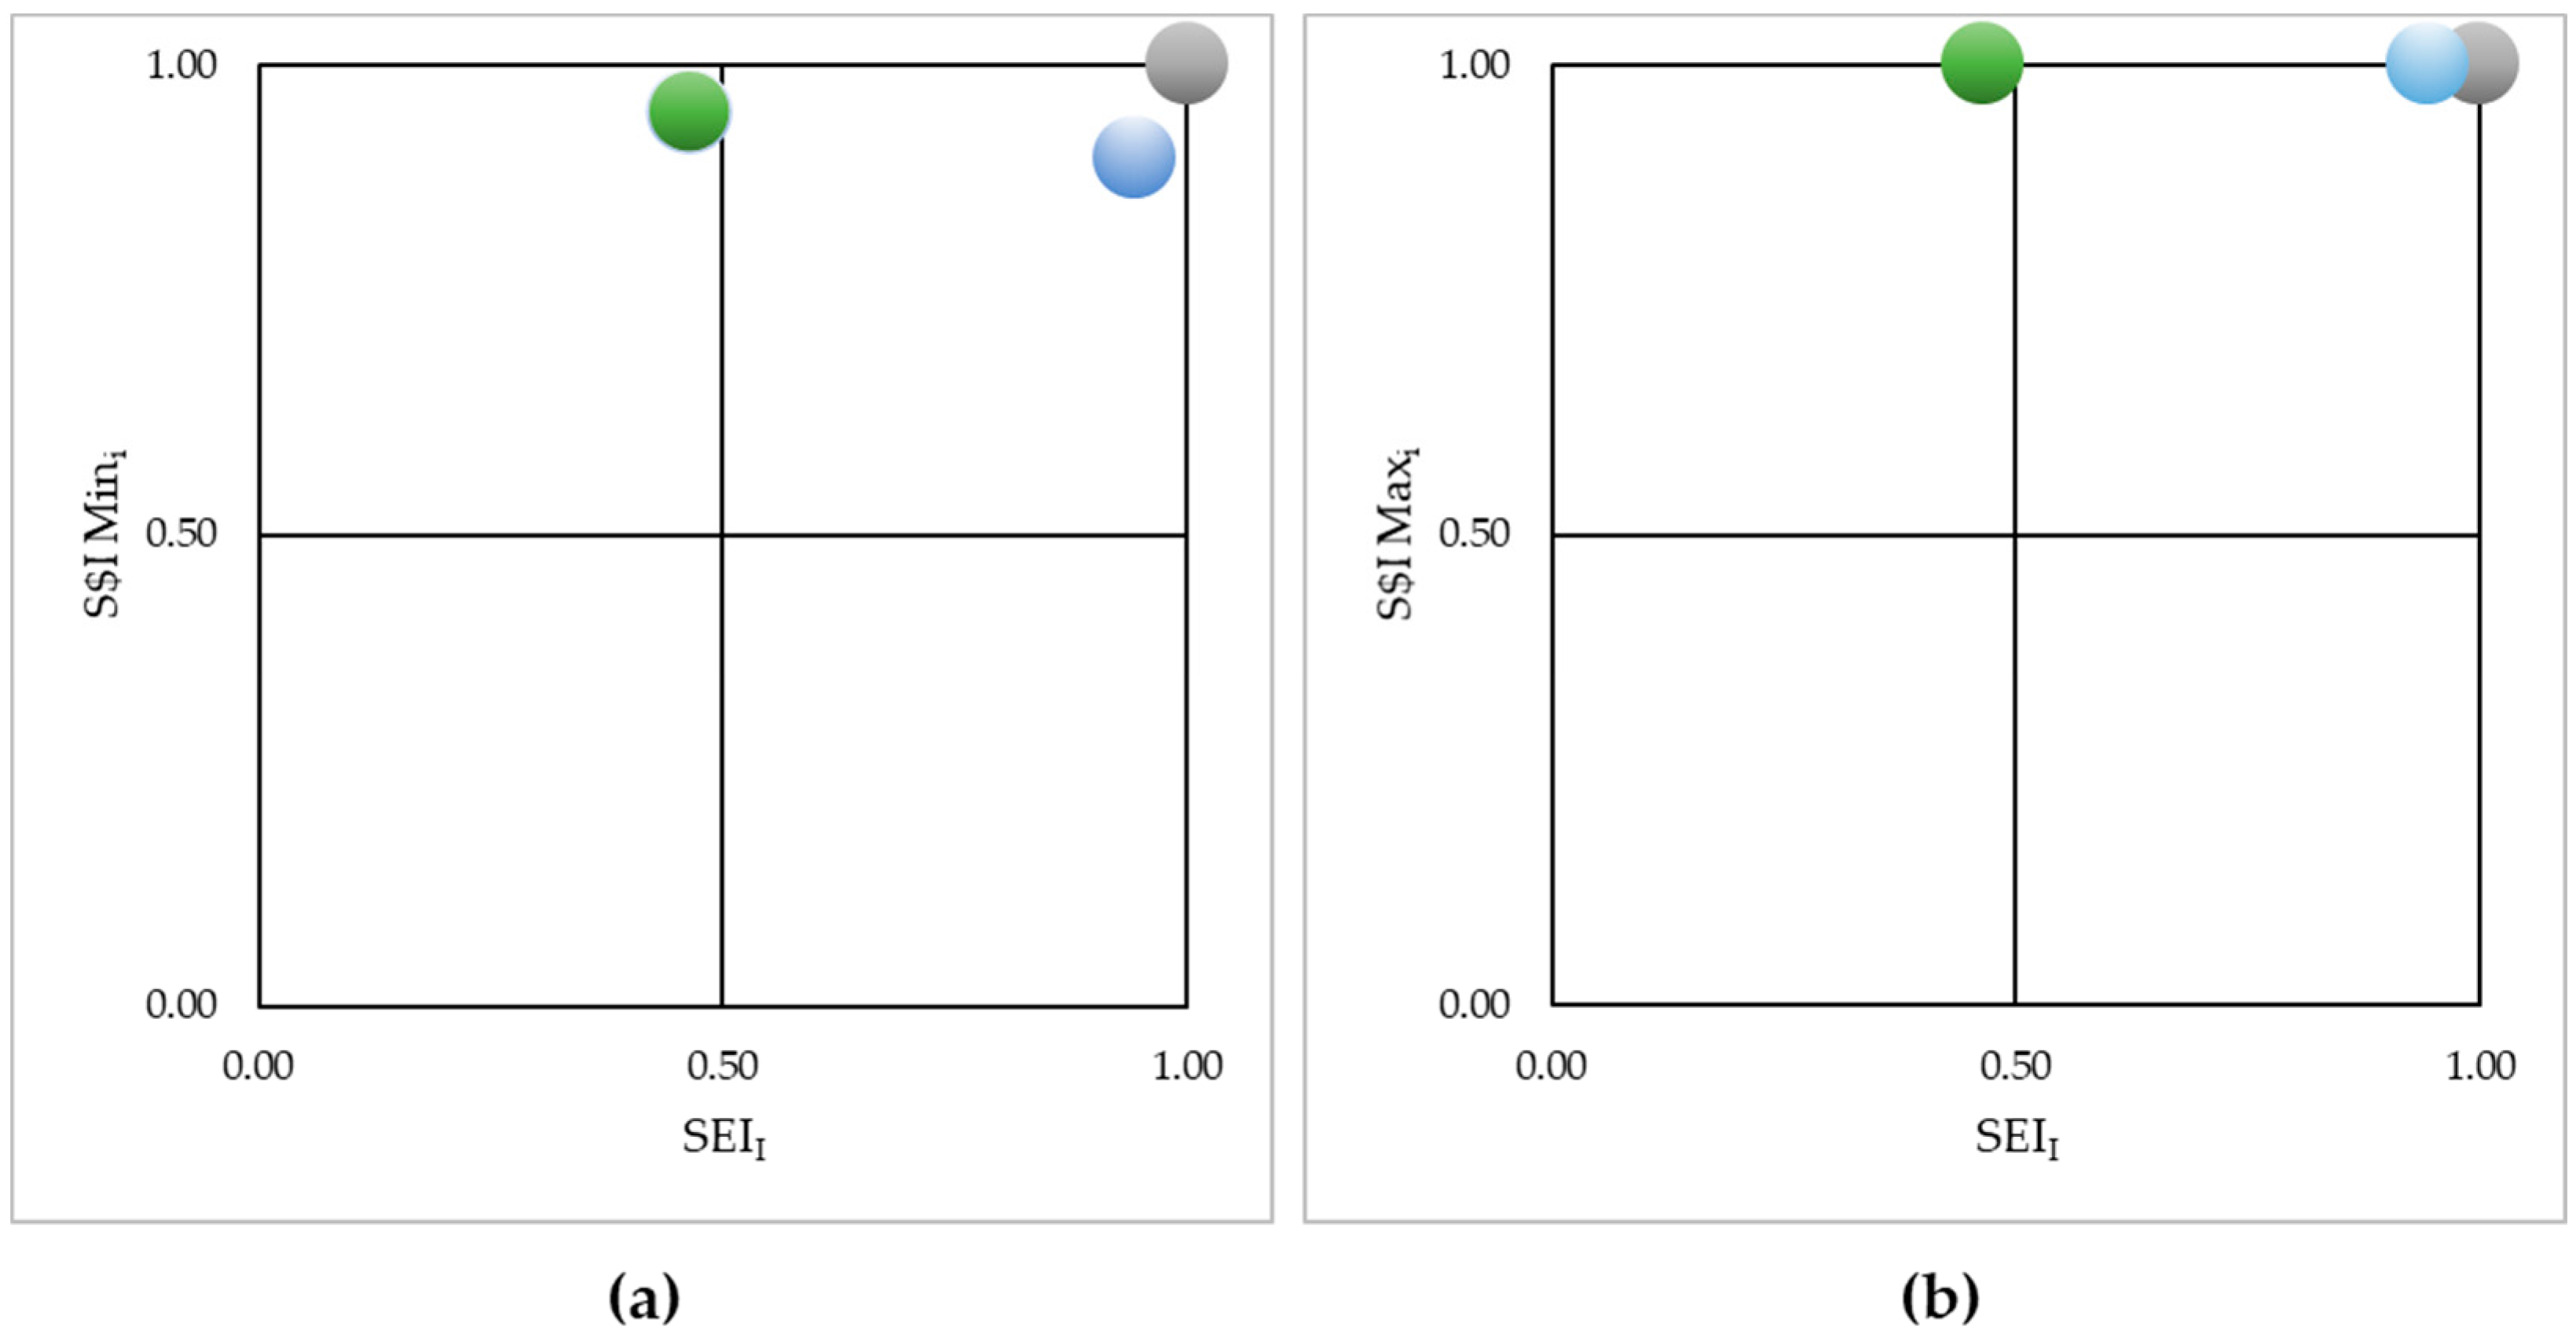
5.2.4. Ecoefficiency Analysis (EEA)
6. Conclusions
Author Contributions
Funding
Data Availability Statement
Acknowledgments
Conflicts of Interest
References
- Levchenko, Y.; Sverdlovsk, O.; Chervakov, D.; Chervakov, O. Development of Coalescents for Paints and Varnishes Based on Ionic Liquids—The Products of Diethanolamine and Inorganic Acids Interaction. East.-Eur. J. Enterp. Technol. 2021, 110, 21–29. [Google Scholar] [CrossRef]
- Dehan, V.; Bourgeat-Lami, E.; D’Agosto, F.; Duffy, B.; Fortini, A.; Hilton, S.; Krassa, K.; Keddie, J.K.; Koh, M.L.; Lansalot, M.; et al. High-performance water-based barrier coatings for the corrosion protection of structural steel. Steel Constr. 2017, 10, 254–259. [Google Scholar] [CrossRef]
- Kaur, J.; Krishnan, R.; Ramalingam, B.; Jana, S. Hydroxyethyl sulfone based reactive coalescing agents for low-VOC waterborne coatings. RSC Adv. 2020, 10, 17171–17179. [Google Scholar] [CrossRef]
- Global Coalescing Agent Report: History, Present and Future (from 2015 to 2025); Prof Research: Portland, OR, USA, 2020; 131p.
- Santos, J.P.; Nakashima, F.F.; Rosa, F.; Armelin, N.A.; Da Silva AL, C.; Silva, G.A. Green Coalescent Agent Composition Containing Mixtures of Monoesters and Diesters. U.S. Patent No. 9,926,430, 27 March 2018. [Google Scholar]
- Taylor, J.W. Acid-Containing Polymers as Coalescing Agents for Latexes. U.S. Patent No. 10,563,084, 18 February 2018. [Google Scholar]
- Eastman Chemical Company. Eastman Products for Coating and Ink Formulation. 2021. Available online: https://www.eastman.com/Literature_Center/A/ADDCOAT021.pdf (accessed on 4 November 2021).
- Berce, P.; Skale, S.; Razborsek, T.; Slemnik, M. Influence of coalescing aids on the latex properties and film formation of waterborne coatings. J. Appl. Polym. Sci. 2017, 134, 45142. [Google Scholar] [CrossRef]
- Klähn, M.; Krishnan, R.; Phang, J.M.; Lim, F.C.H.; Van Herk, A.M.; Jana, S. Effect of external and internal plasticization on the glass transition temperature of (Meth)acrylate polymers studied with molecular dynamics simulations and calorimetry. Polymer 2019, 179, 121635. [Google Scholar] [CrossRef]
- Colonetti, E.; Rovani, R.; Westrup, J.L.; Cercená, R.; Cargnin, M.; Peterson, M.; Dal-Bó, A.G. Effects of resin/curing agent stoichiometry and coalescence of emulsion particles on the properties of waterborne epoxy coatings upon accelerated weathering. Mater. Chem. Phys. 2022, 275, 125228. [Google Scholar] [CrossRef]
- Dedoussi, I.C.; Eastham, S.D.; Monier, E.; Barrett, S.R.H. Premature mortality related to United States cross-state air pollution. Nature 2020, 578, 261–265. [Google Scholar] [CrossRef]
- Hanif, N.M.; Hawari, N.S.S.L.; Othman, M.; Hamid, H.H.A.; Ahamad, F.; Uning, R.; Ooi, M.C.G.; Wahab, M.I.A.; Sahani, M.; Latif, M.T. Ambient volatile organic compounds in tropical environments: Potential sources, composition, and impacts—A review. Chemosphere 2021, 285, 131355. [Google Scholar] [CrossRef]
- Suzuki, N.; Nakaoka, H.; Hanazato, M.; Nakayama, Y.; Takaya, K.; Mori, C. Emission rates of substances from low-volatile-organic-compound paints. Int. J. Environ. Sci. Technol. 2019, 16, 4543–4550. [Google Scholar] [CrossRef] [Green Version]
- Limousin, E.; Martinez-Tong, D.E.; Ballard, N.; Asua, J.M. Cure-dependent morphology of acrylic/alkyd hybrid latex films via nanomechanical mapping. ACS Appl. Polym. Mater. 2019, 1, 2213–2223. [Google Scholar] [CrossRef]
- International Organization for Standardization (ISO). Environmental Management-Life Cycle Assessment-Principles and Framework, 2nd ed.; ISO 14040:2006; ISO: Geneva, Switzerland, 2006. [Google Scholar]
- International Organization for Standardization (ISO). Environmental Management-Life Cycle Assessment-Requirements and Guidelines, 1st ed.; ISO 14044:2006; ISO: Geneva, Switzerland, 2006. [Google Scholar]
- Paiano, A.; Gallucci, T.; Pontrandolfo, A.; Lagioia, G.; Piccinno, P.; Lacalamita, A. Sustainable options for paints through a life cycle assessment method. J. Clean. Prod. 2021, 295, 126464. [Google Scholar] [CrossRef]
- Upadhyayula, V.K.K.; Meyer, D.E.; Gadhamshetty, V.; Koratkar, N. Screening-level life cycle assessment of graphene-poly (ether imide) coatings protecting unalloyed steel from severe atmospheric corrosion. ACS Sustain. Chem. Eng. 2017, 5, 2656–2667. [Google Scholar] [CrossRef]
- Montazeri, M.; Eckelman, M.J. Life cycle assessment of UV-Curable bio-based wood flooring coatings. J. Clean. Prod. 2018, 192, 932–939. [Google Scholar] [CrossRef]
- Rossini, P.; Napolano, L.; Matteucci, G. Biotoxicity and life cycle assessment of two commercial antifouling coatings in marine systems. Chemosphere 2019, 237, 124475. [Google Scholar] [CrossRef]
- Klug, V.; Schöggl, J.; Dallinger, D.; Hiebler, K. Comparative life cycle assessment of different production processes for waterborne polyurethane dispersions. ACS Sustain. Chem. Eng. 2021, 9, 8980–8989. [Google Scholar] [CrossRef]
- Evangelista, P.P.A.; Kiperstok, A.; Torres, E.A.; Gonçalves, J.P. Environmental performance analysis of residential buildings in Brazil using life cycle assessment (LCA). Constr. Build. Mater. 2018, 169, 748–761. [Google Scholar] [CrossRef]
- Ansah, M.K.; Chen, X.; Yang, H.; Lu, L.; Lam, P.T.I. An integrated life cycle assessment of different façade systems for a typical residential building in Ghana. Sustain. Cities Soc. 2020, 53, 101974. [Google Scholar] [CrossRef]
- Dominguez-Delgado, A.; Domínguez-Torres, H.; Domínguez-Torres, C.-A. Energy and economic life cycle assessment of cool roofs applied to the refurbishment of social housing in southern Spain. Sustainability 2020, 12, 5602. [Google Scholar] [CrossRef]
- Trovato, M.R.; Nocera, F.; Giuffrida, S. Life-cycle assessment and monetary measurements for the carbon footprint reduction of public buildings. Sustainability 2020, 12, 3460. [Google Scholar] [CrossRef] [Green Version]
- Cherubini, E.; Ribeiro, P.T. Diálogos Setoriais Brasil e União Europeia: Desafios e soluções Para o fortalecimento da ACV no Brasil; Instituto Brasileiro de Informação em Ciência e Tecnologia (IBICT): Brasília, Brazil, 2015. [Google Scholar]
- Hansen, A.P.; Silva, G.A.; Kulay, L. Evaluation of the environmental performance of alternatives for polystyrene production in Brazil. Sci. Total Environ. 2015, 532, 655–668. [Google Scholar] [CrossRef]
- De Léis, C.M.; Nogueira, A.R.; Kulay, L.; Tadini, C.C. Environmental and energy analysis of biopolymer film based on cassava starch in Brazil. J. Clean. Prod. 2017, 143, 76–89. [Google Scholar] [CrossRef]
- Souza, C.G.; Barbastefano, R.G.; Teixeira, R.C. Life cycle assessment research in Brazil: Characteristics, interdisciplinarity and applications. Int. J. Life Cycle Assess. 2017, 22, 266–276. [Google Scholar] [CrossRef]
- Moore, C.C.S.; Nogueira, A.R.; Kulay, L. Environmental and energy assessment of the substitution of chemical fertilizers for industrial wastes of ethanol production in sugarcane cultivation in Brazil. Int. J. Life Cycle Assess. 2017, 22, 628–643. [Google Scholar] [CrossRef]
- Moore, C.C.S.; Rego, E.; Kulay, L. The Brazilian electricity supply for 2030: A projection based on economic, environmental and technical criteria. Environ. Nat. Resour. J. 2017, 7, 4. [Google Scholar] [CrossRef]
- Donke, A.; Nogueira, A.; Matai, P.; Kulay, L. Environmental and energy performance of ethanol production from the integration of sugarcane, corn and grain sorghum in a multipurpose plant. Resources 2017, 6, 1. [Google Scholar] [CrossRef] [Green Version]
- Guerra, J.P.; Cardoso, F.H.; Nogueira, A.; Kulay, L. Thermodynamic and environmental analysis of scaling up cogeneration units driven by sugarcane biomass to enhance power exports. Energies 2018, 11, 73. [Google Scholar] [CrossRef] [Green Version]
- Nogueira, A.R.; Popi, M.G.C.B.; Moore, C.C.S.; Kulay, L. Environmental and energetic effects of cleaner production scenarios on the sodium lauyl ether sulfate production chain. J. Clean. Prod. 2019, 240, 118203. [Google Scholar] [CrossRef]
- Moraes, F.B.M.; Lopes, L.C.; Kulay, L. Proposals for the redesign of mouthwash production chain based on environmental performance indicator. J. Clean. Prod. 2021, 311, 127679. [Google Scholar] [CrossRef]
- Ultrafilm® 260 LV. Informações Técnicas. Coalescentes. Oxiteno SA (In Portuguese). Available online: https://oxiteno.com/br/pt-br/product/ultrafilm-260-lv/ (accessed on 1 September 2021).
- Li, Y.; Luo, C.-X.; Qian, C.; Chen, X. Trimerization of aldehydes with one α-hydrogen catalyzed by sodium hydroxide. Chem. Pap. 2014, 68, 422–426. [Google Scholar] [CrossRef]
- Aspen Plus® v 9.0. Aspen Technology Inc. Bedford, MA, USA. Aspentech. 2021. Available online: https://www.aspentech.com/en/products/engineering/aspen-plus (accessed on 12 February 2021).
- Peng, D.-Y.; Robinson, D.B. A New Two-Constant Equation of State. Ind. Eng. Chem. Fundam. 1976, 15, 59–64. [Google Scholar] [CrossRef]
- Klein, S.; Nellis, G. Thermodynamics, 1st ed.; Cambridge University Press: New York, NY, USA, 2011; pp. 651–776. [Google Scholar]
- Swan, P. An introduction to coalescing aids and Eastman film forming technologies. In Proceedings of the 36th International Conference on Coatings Technology, University of Pardubice, Pardubice, Czech Republic, 23–25 May 2005. [Google Scholar]
- Gallagher, M.; Dalton, P.; Sitvarin, L.; Preti, G. Sensory and analytical evaluations of paints with and without texanol. Environ. Sci. Technol. 2008, 42, 243–248. [Google Scholar] [CrossRef]
- Paes, M.X.; Medeiros, G.A.; Mancini, S.D.; Bortoleto, A.P.; Oliveira, J.A.P.; Kulay, L. Municipal solid waste management: Integrated analysis of environmental and economic indicators based on life cycle assessment. J. Clean. Prod. 2020, 254, 119848. [Google Scholar] [CrossRef]
- SimaPro. SimaPRO 9.1.1. What’s New? PRé Sustainability. Available online: https://simapro.com/wp-content/uploads/2020/10/SimaPro911WhatIsNew.pdf (accessed on 11 September 2021).
- Greenhouse Gas Protocol. Available online: https://ghgprotocol.org/ (accessed on 11 September 2021).
- International Organization for Standardization (ISO). Greenhouse Gases—Carbon Footprint of Products: Requirements and Guidelines for Quantification, 1st ed.; ISO 14067:2018; ISO: Geneva, Switzerland, 2006. [Google Scholar]
- Publicly Available Specification (PAS). Specification for the Assessment of the Life Cycle Greenhouse Gas Emissions of Goods and Services PAS 2050:2008; British Standards Institution: London, UK, 2008; Available online: http://www.carbonconstruct.com/pdf/pas_2050.pdf (accessed on 15 September 2021).
- National Institute for Public Health and the Environment. LCIA: The ReCiPe Model. Available online: https://www.rivm.nl/en/life-cycle-assessment-lca/recipe (accessed on 11 September 2021).
- Bare, J.; Gloria, T.; Norris, G. Development of the method an U. S. normalization database for life cycle impact assessment and sustainability metrics. Environ. Sci. Technol. 2006, 40, 5108–5115. [Google Scholar] [CrossRef]
- Bare, J.C.; Norris, G.; Pennington, D.W.; McKone, T.E. TRACI: The tool for the reduction and assessment of chemical and other environmental impacts. J. Ind. Ecol. 2002, 6, 49–79. [Google Scholar] [CrossRef]
- Kumar, A.; Phillips, K.R.; Thiel, G.; Schröder, U.; Lienhard, J.H. Direct Electrosynthesis of Sodium Hydroxide and Hydrochloric Acid from Brine Streams. Nat. Catal. 2019, 2, 106–113. [Google Scholar] [CrossRef]
- International Energy Agency (IEA). Energy Balances of OECD Countries 2015; OECD Publishing: Paris, France, 2015. [Google Scholar] [CrossRef]
- Eastman Chemical Company. Standing the Test of Time—Eastman EATM Ester Alcohol: The Premier Coalescent. 2011. Available online: https://www.eastman.com/Literature_Center/M/M329.pdf (accessed on 11 September 2021).
- Lee, B.; Naito, H.; Nagao, M.; Hibino, T. Alternating-current electrolysis for the production of phenol from benzene. Angew. Chem. Int. Ed. 2012, 51, 6961–6965. [Google Scholar] [CrossRef]
- Tudor, R.; Ashley, M. Enhancement of industrial hydroformylation processes by the adoption of rhodium-based catalyst: Part I. Platin. Met. Rev. 2007, 51, 116–126. [Google Scholar] [CrossRef]
- Tuţă, E.-F.; Bozga, G. Kinetics of propylene hydroformylation in the presence of modified rhodium triphenylphosphine catalyst. UPB Sci. Bull. Ser. B 2012, 74, 77–86. [Google Scholar]
- Zimmermann, H.; Walz, R. Ullmann’s Encyclopedia of Industrial Chemistry; Ethylene; Wiley-VCH: Weinheim, Germany, 2008. [Google Scholar] [CrossRef]
- Uhlman, B.; Saling, P. The BASF eco-efficiency toolbox: Holistic evaluation of sustainable solutions. In Encyclopedia of Sustainable Technologies, 1st ed.; Abraham, M.A., Ed.; Elsevier Inc.: Amsterdam, The Netherlands, 2017; pp. 133–141. [Google Scholar]
- Sakamoto, H.; Ronquim, F.M.; Seckler, M.M.; Kulay, L. Environmental performance of effluent conditioning systems for reuse in oil refining plants: A case study in Brazil. Energies 2019, 12, 326. [Google Scholar] [CrossRef] [Green Version]
- Ronquim, F.M.; Sakamoto, H.; Mierzwa, J.C.; Kulay, L.; Seckler, M.M. Eco-efficiency analysis of desalination by precipitation integrated with reverse osmosis for zero liquid discharge in oil refineries. J. Clean. Prod. 2020, 250, 119547. [Google Scholar] [CrossRef]
- Pithon, M.L.; Mierzwa, J.C.; Kulay, L. An environmental performance analysis of upgraded and integrated treatment techniques for drinking water production through reclamation. J. Sustain. Dev. Energy Water Environ. Syst. 2021, 10, 1090393. [Google Scholar] [CrossRef]
- Florindo, T.J.; Florindo, G.I.B.M.; Talamini, E.; Costa, J.S.; de Léis, C.M.; Tang, W.Z.; Schultz, G.; Kulay, L.; Pinto, A.T.; Ruviaro, C.F. Application of the multiple criteria decision-making (MCDM) approach in the identification of carbon footprint reduction actions in the Brazilian beef production chain. J. Clean. Prod. 2018, 196, 1379–1389. [Google Scholar] [CrossRef]
- Moore, C.C.S.; Kulay, L. Effect of the implementation of carbon capture systems on the environmental, energy and economic performance of the Brazilian electricity matrix. Energies 2019, 12, 331. [Google Scholar] [CrossRef] [Green Version]
 : material flows;
  : utility flows (material and energy);
  : complete life cycle of raw materials and inputs;
  : complete utility life cycle;
  : transport operation.
: material flows; : utility flows (material and energy); : complete life cycle of raw materials and inputs; : complete utility life cycle; : transport operation.
: transport operation.
: material flows; : utility flows (material and energy); : complete life cycle of raw materials and inputs; : complete utility life cycle; : transport operation.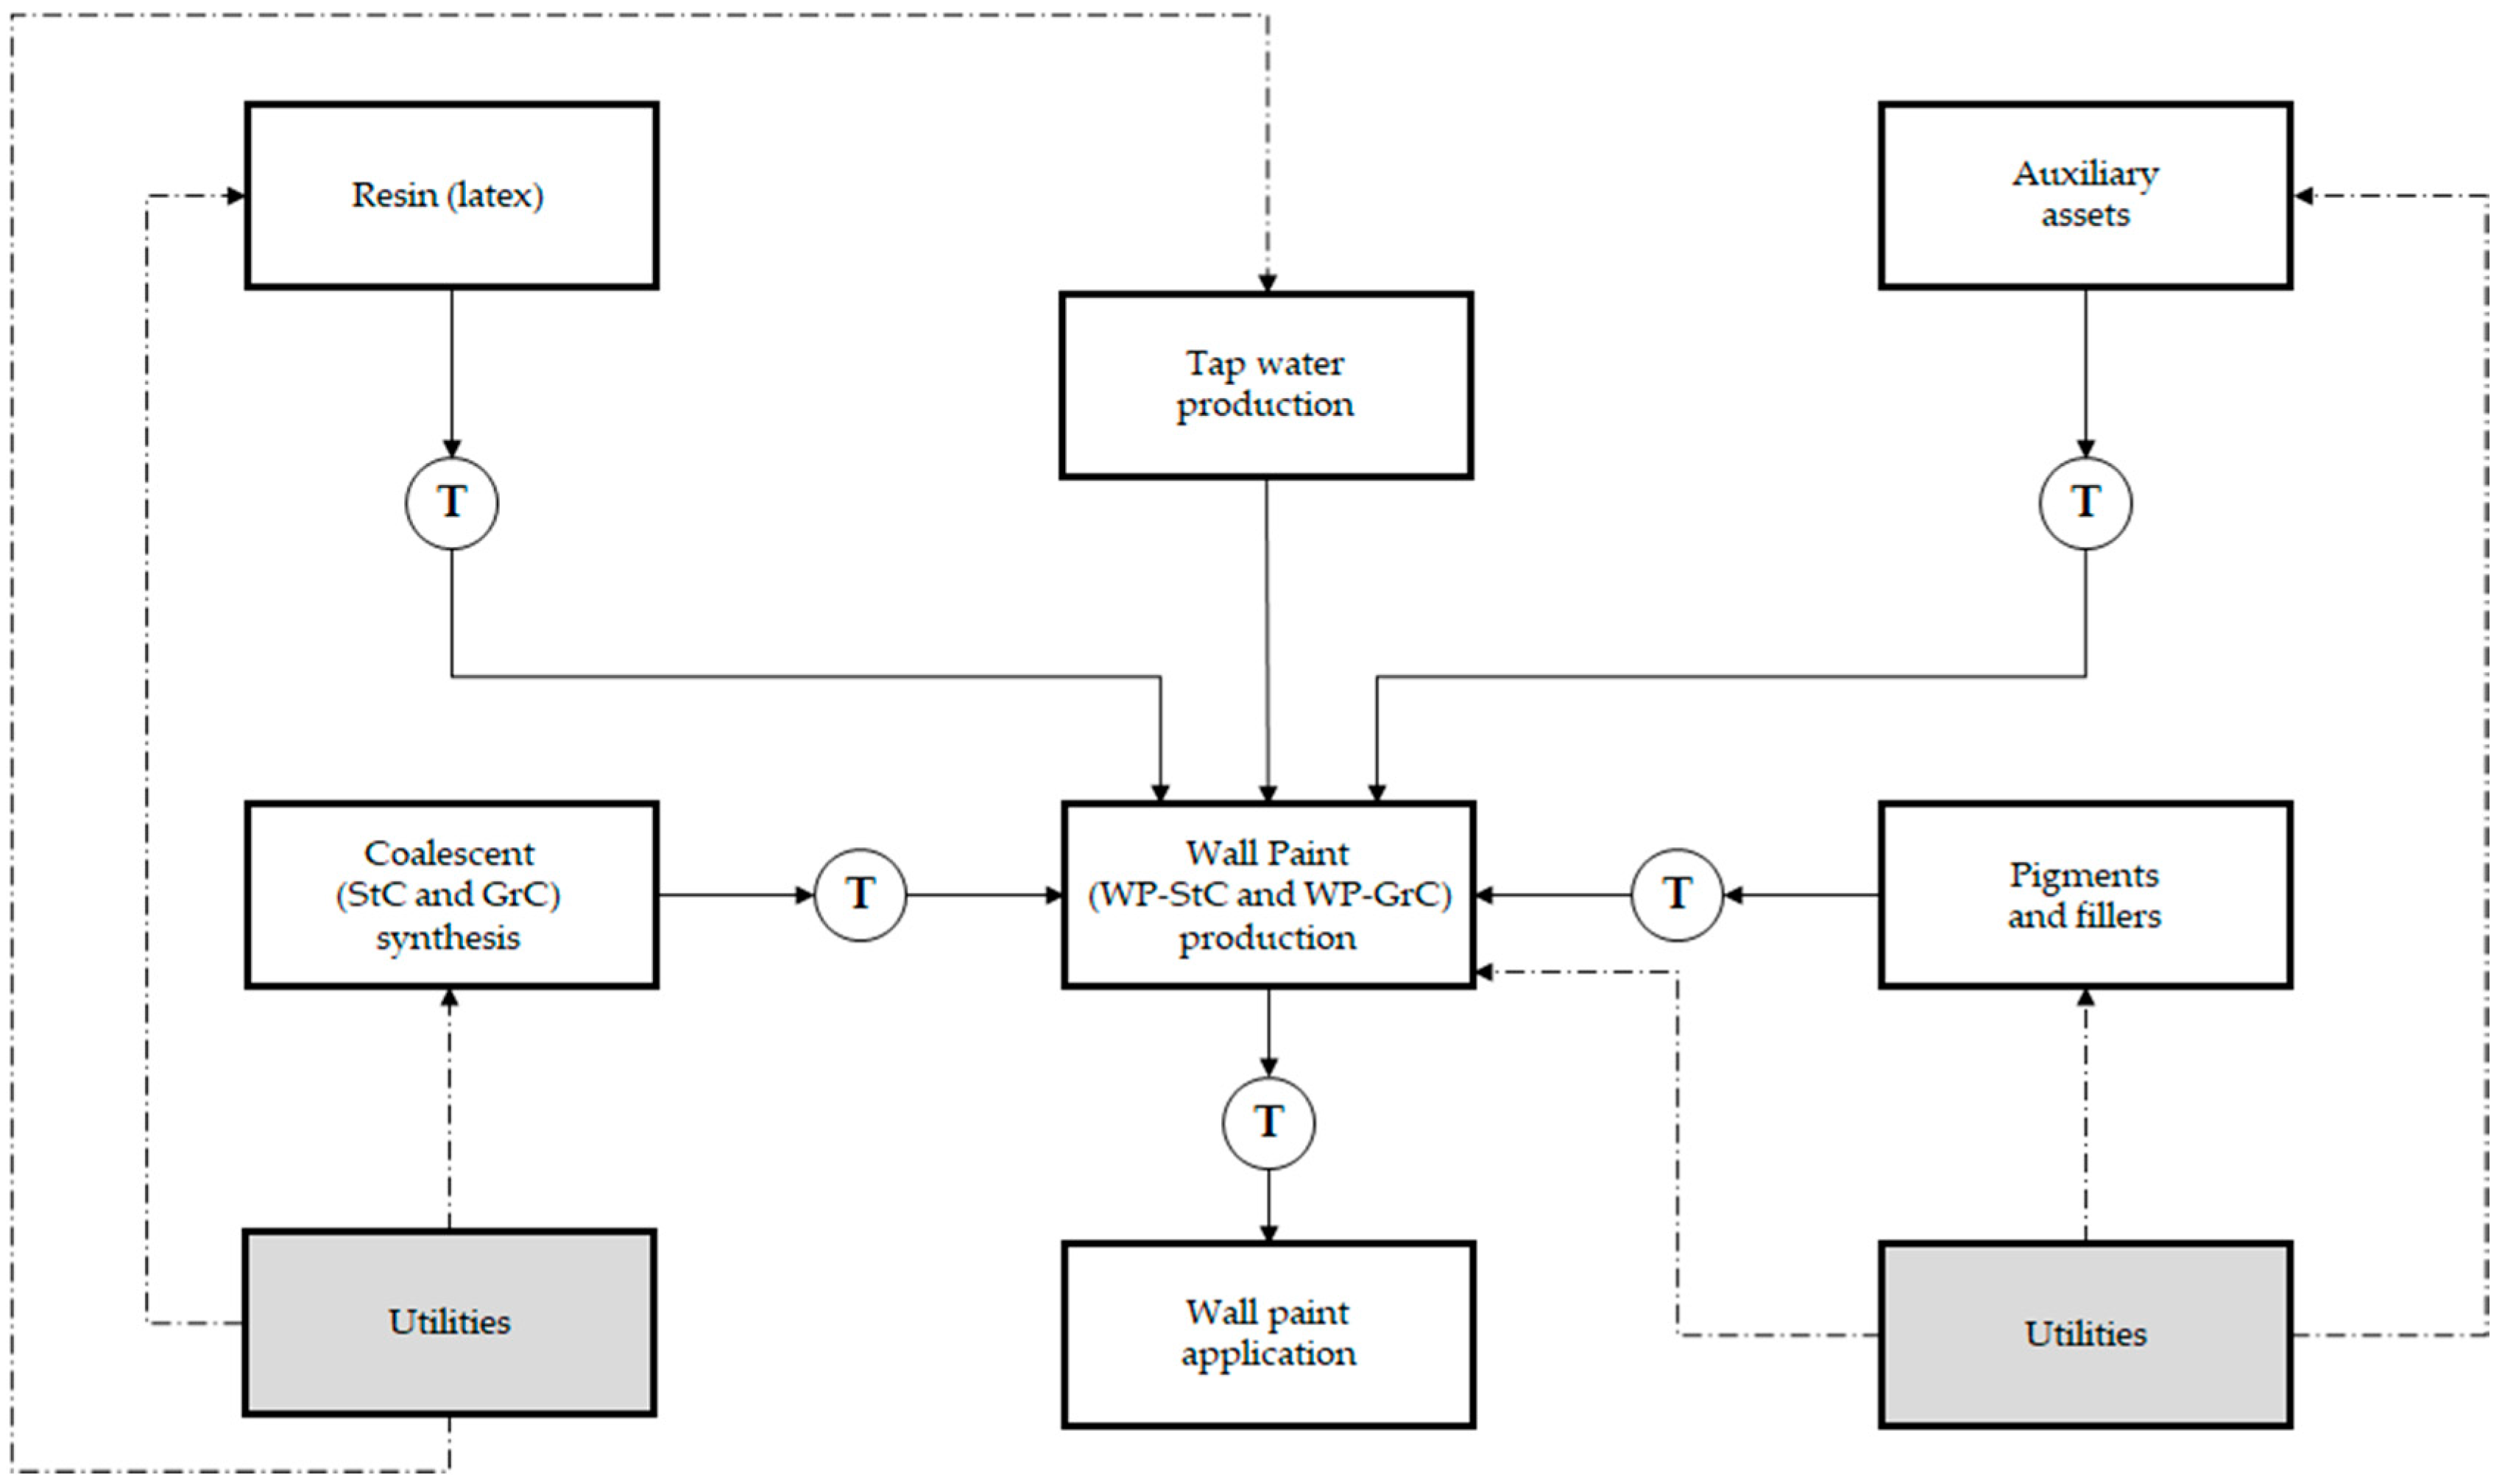


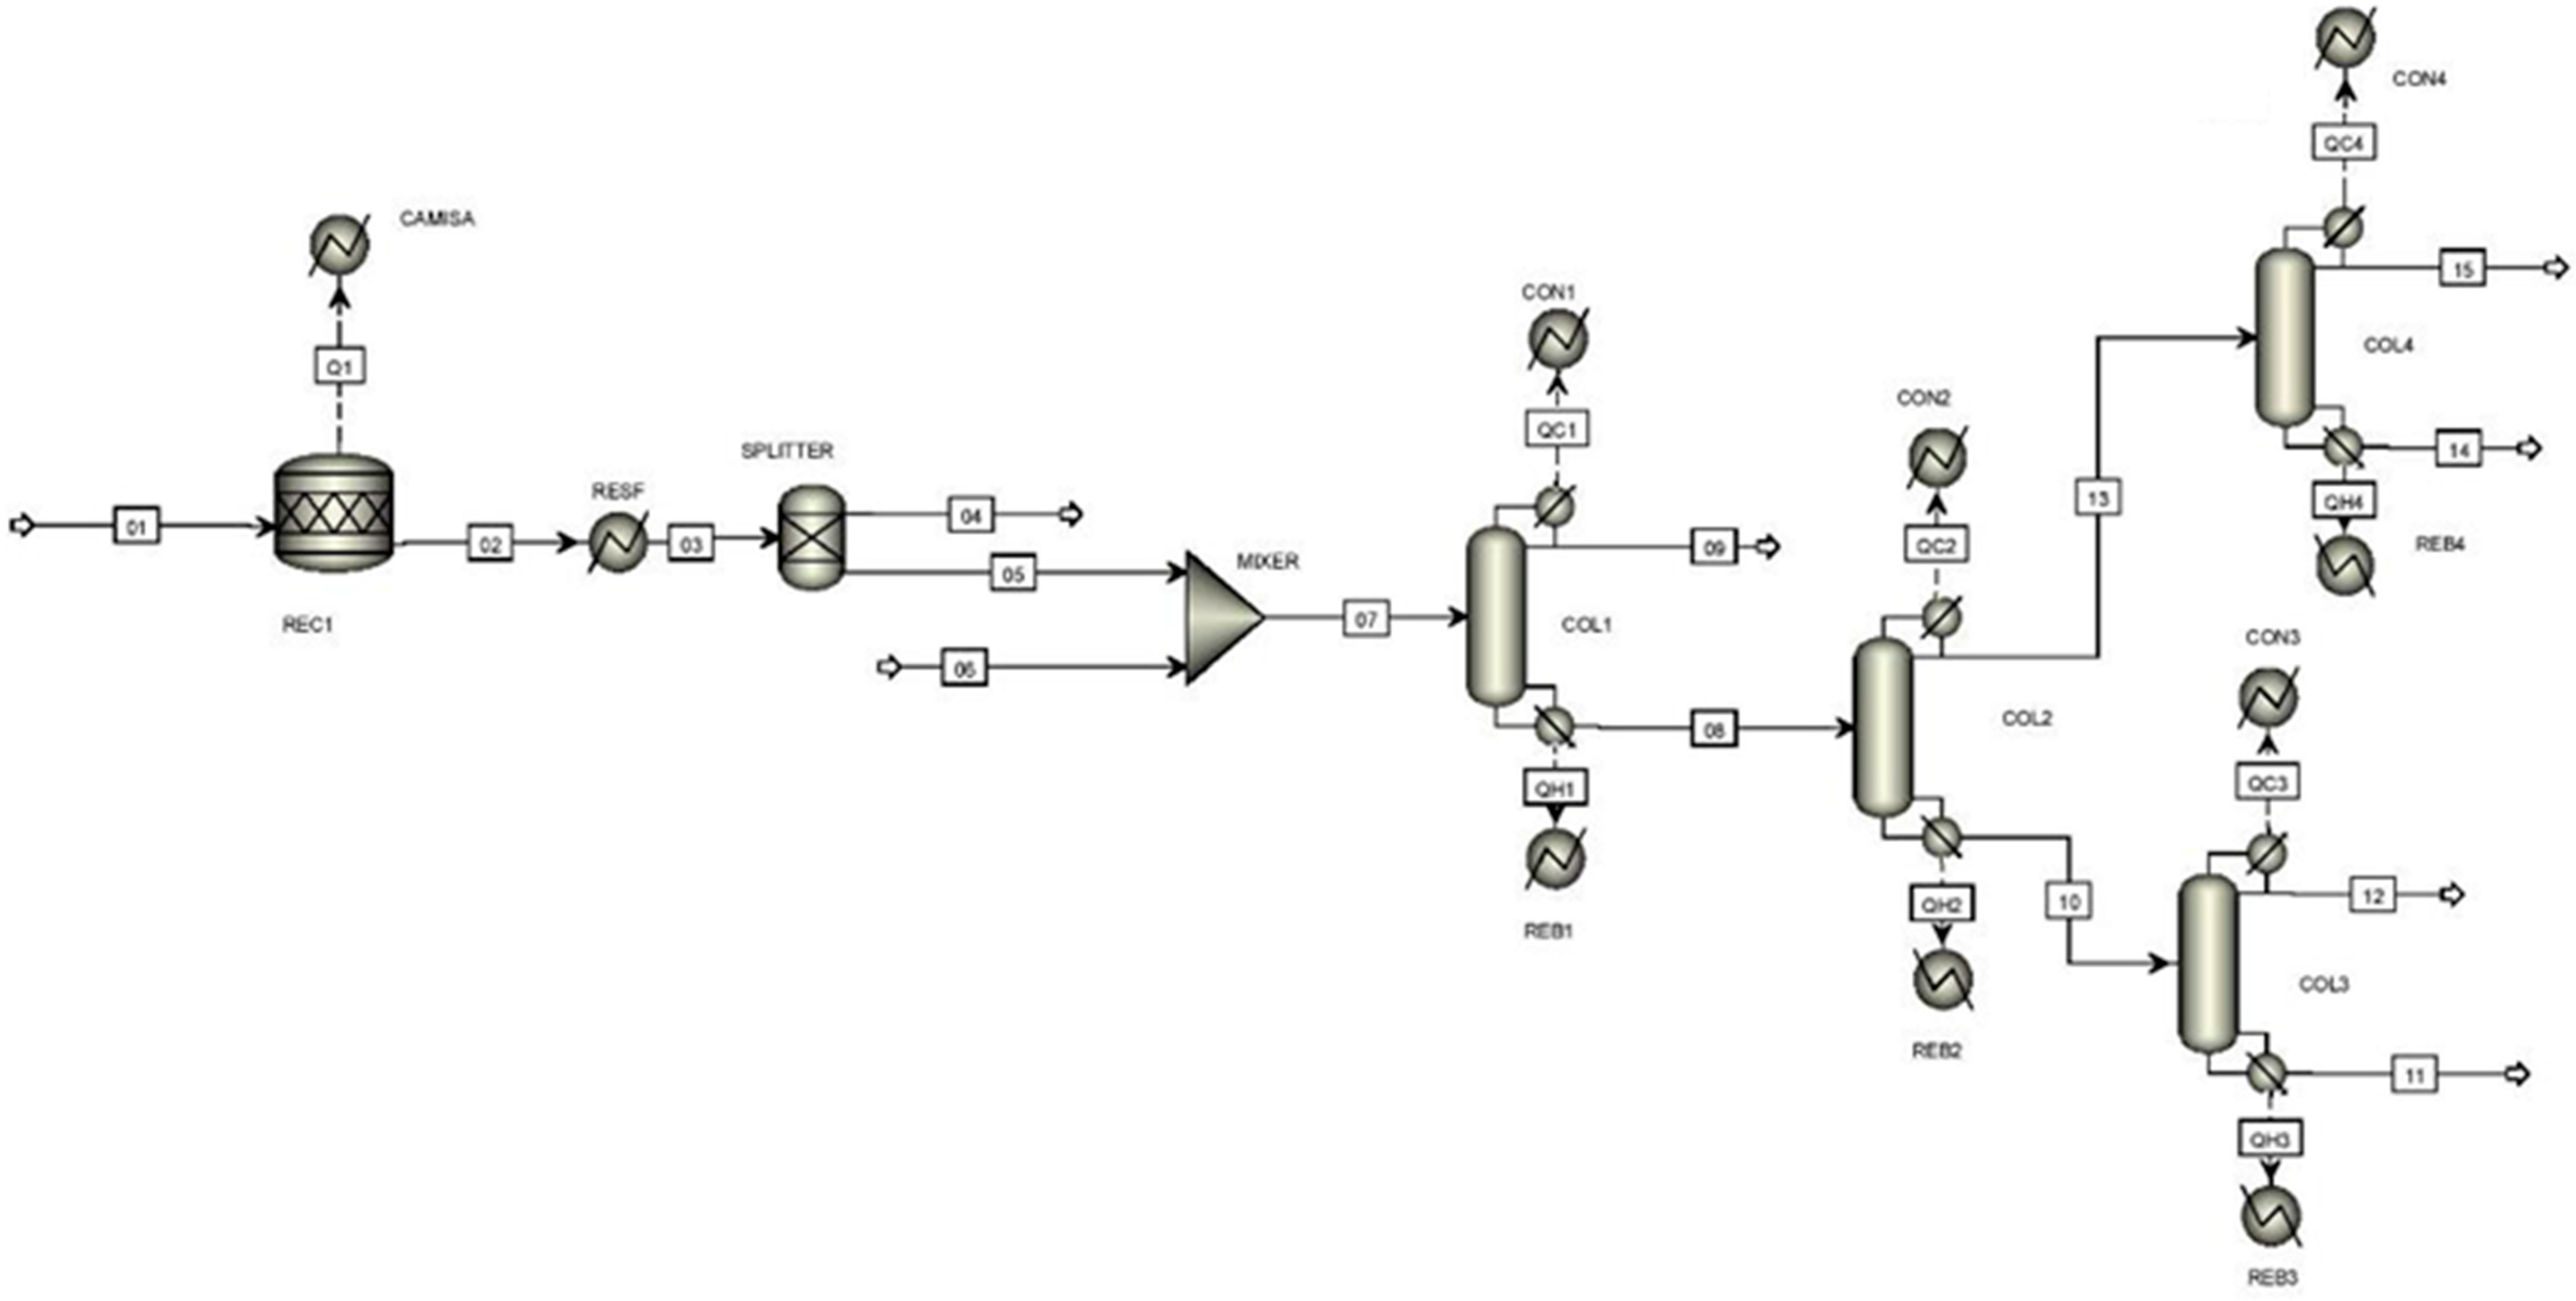
| Equipment | Mass Flow (kg h−1) | Utility | |
|---|---|---|---|
| Reactor | 170 | cold | |
| Condenser | 148 | cold | |
| 285 | cold | ||
| 25.0 | cold | ||
| 92.5 | cold | ||
| Reboiler | 51.0 | hot | |
| 27.5 | hot | ||
| 4.00 | hot | ||
| 16.0 | hot | ||
| Process Step | Equipment/Parameter | Specification/Average Value |
|---|---|---|
| Reaction | reaction vessel | Batch (transient state) |
| cooling system | indirect | |
| cooling fluid | water | |
| T (°C) | 150–170 | |
| P (bar) | 2.0–15 | |
| η (%) | 90+ | |
| Deodorizing | T (°C) | 100–120 |
| P (bar) | 1.0 | |
| Separation | Filtration | basket filter |
| T (°C) | <70 | |
| P (bar) | 1.0 |
| Input | Relative Contribution (%w/w) |
|---|---|
| Tap water | 37.5 |
| Resin (latex) | 31.0 |
| Pigments and fillers | 25.0 |
| Coalescent | 1.20 |
| Auxiliary assets | 5.30 |
| Inputs | |
| Material Inputs | Amount |
| Isobutyraldehyde, C4H8O (kg) | 1.42 |
| Sodium hydroxide, NaOH (g) | 45.0 |
| Hydrochloric acid, HCl (g) | 49.0 |
| Cooling water (kg) | 1.43 |
| Energy Inputs | Amount |
| Steam sat. (40 bar, 250 °C) (kg) | 4.65 |
| Outputs | |
| Material Outputs | Amount |
| Coalescent StC (98.5%w/w) (kg) | 1.00 |
| Inputs | |
| Material Inputs | Amount |
| Potassium hydroxide, KOH (sol. 50%w/w) (g) | 1.25–3.75 |
| Glacial acetic acid, C2H4O2 (g) | 1.00–4.00 |
| Ethylene oxide, C2H4O (g) | 100–500 |
| Nitrogen, N2 (g) | 5.00–10.0 |
| Phenol, C6H6O (g) | 450–750 |
| Cooling water (g) | 500–750 |
| Energy Inputs | Amount |
| Steam (kg) | 0.25–0.60 |
| Electricity (kWh) | 0.05–0.30 |
| Outputs | |
| Material Outputs | Amount |
| Coalescent GrC (98.5%w/w) (kg) | 1.00 |
| Process Step | Equipment/Parameter | Specification/Average Value |
|---|---|---|
| Reaction | reaction vessel | Batch (transient state) |
| cooling system | indirect | |
| cooling fluid | water | |
| T (°C) | 110–140 | |
| P (bar) | 1.0–2.0 | |
| η (%) | 70+ | |
| Separation | filtration | filter bed |
| T (°C) | 120 (max.) | |
| Finishing | T (°C) | <50 |
| Inputs | |
| Material Inputs | Amount |
| Phosphorus oxyacid (g) | 1.00–4.00 |
| Dicarboxylic acid (g) | 300–500 |
| Branched alcohol (g) | 700–900 |
| Magnesium silicate (g) | 10.0–19.0 |
| Organic sulfonic acid (g) | 1.00–3.00 |
| Cooling water, make-up (g) | 1.00–2.00 |
| Energy Inputs | Amount |
| Steam (kg) | 0.30–1.50 |
| Electricity (kWh) | 0.10–0.50 |
| Outputs | |
| Material Outputs | Amount |
| Coalescent AGrC (98.5%w/w) (kg) | 1.00 |
| Coalescent | Minimum Specific Price (USD/kg−1) | Maximum Specific Price (USD/kg−1) |
|---|---|---|
| StC | 1.80 | 1.98 |
| GrC | 1.62 | 1.98 |
| AGrC | 1.71 | 1.98 |
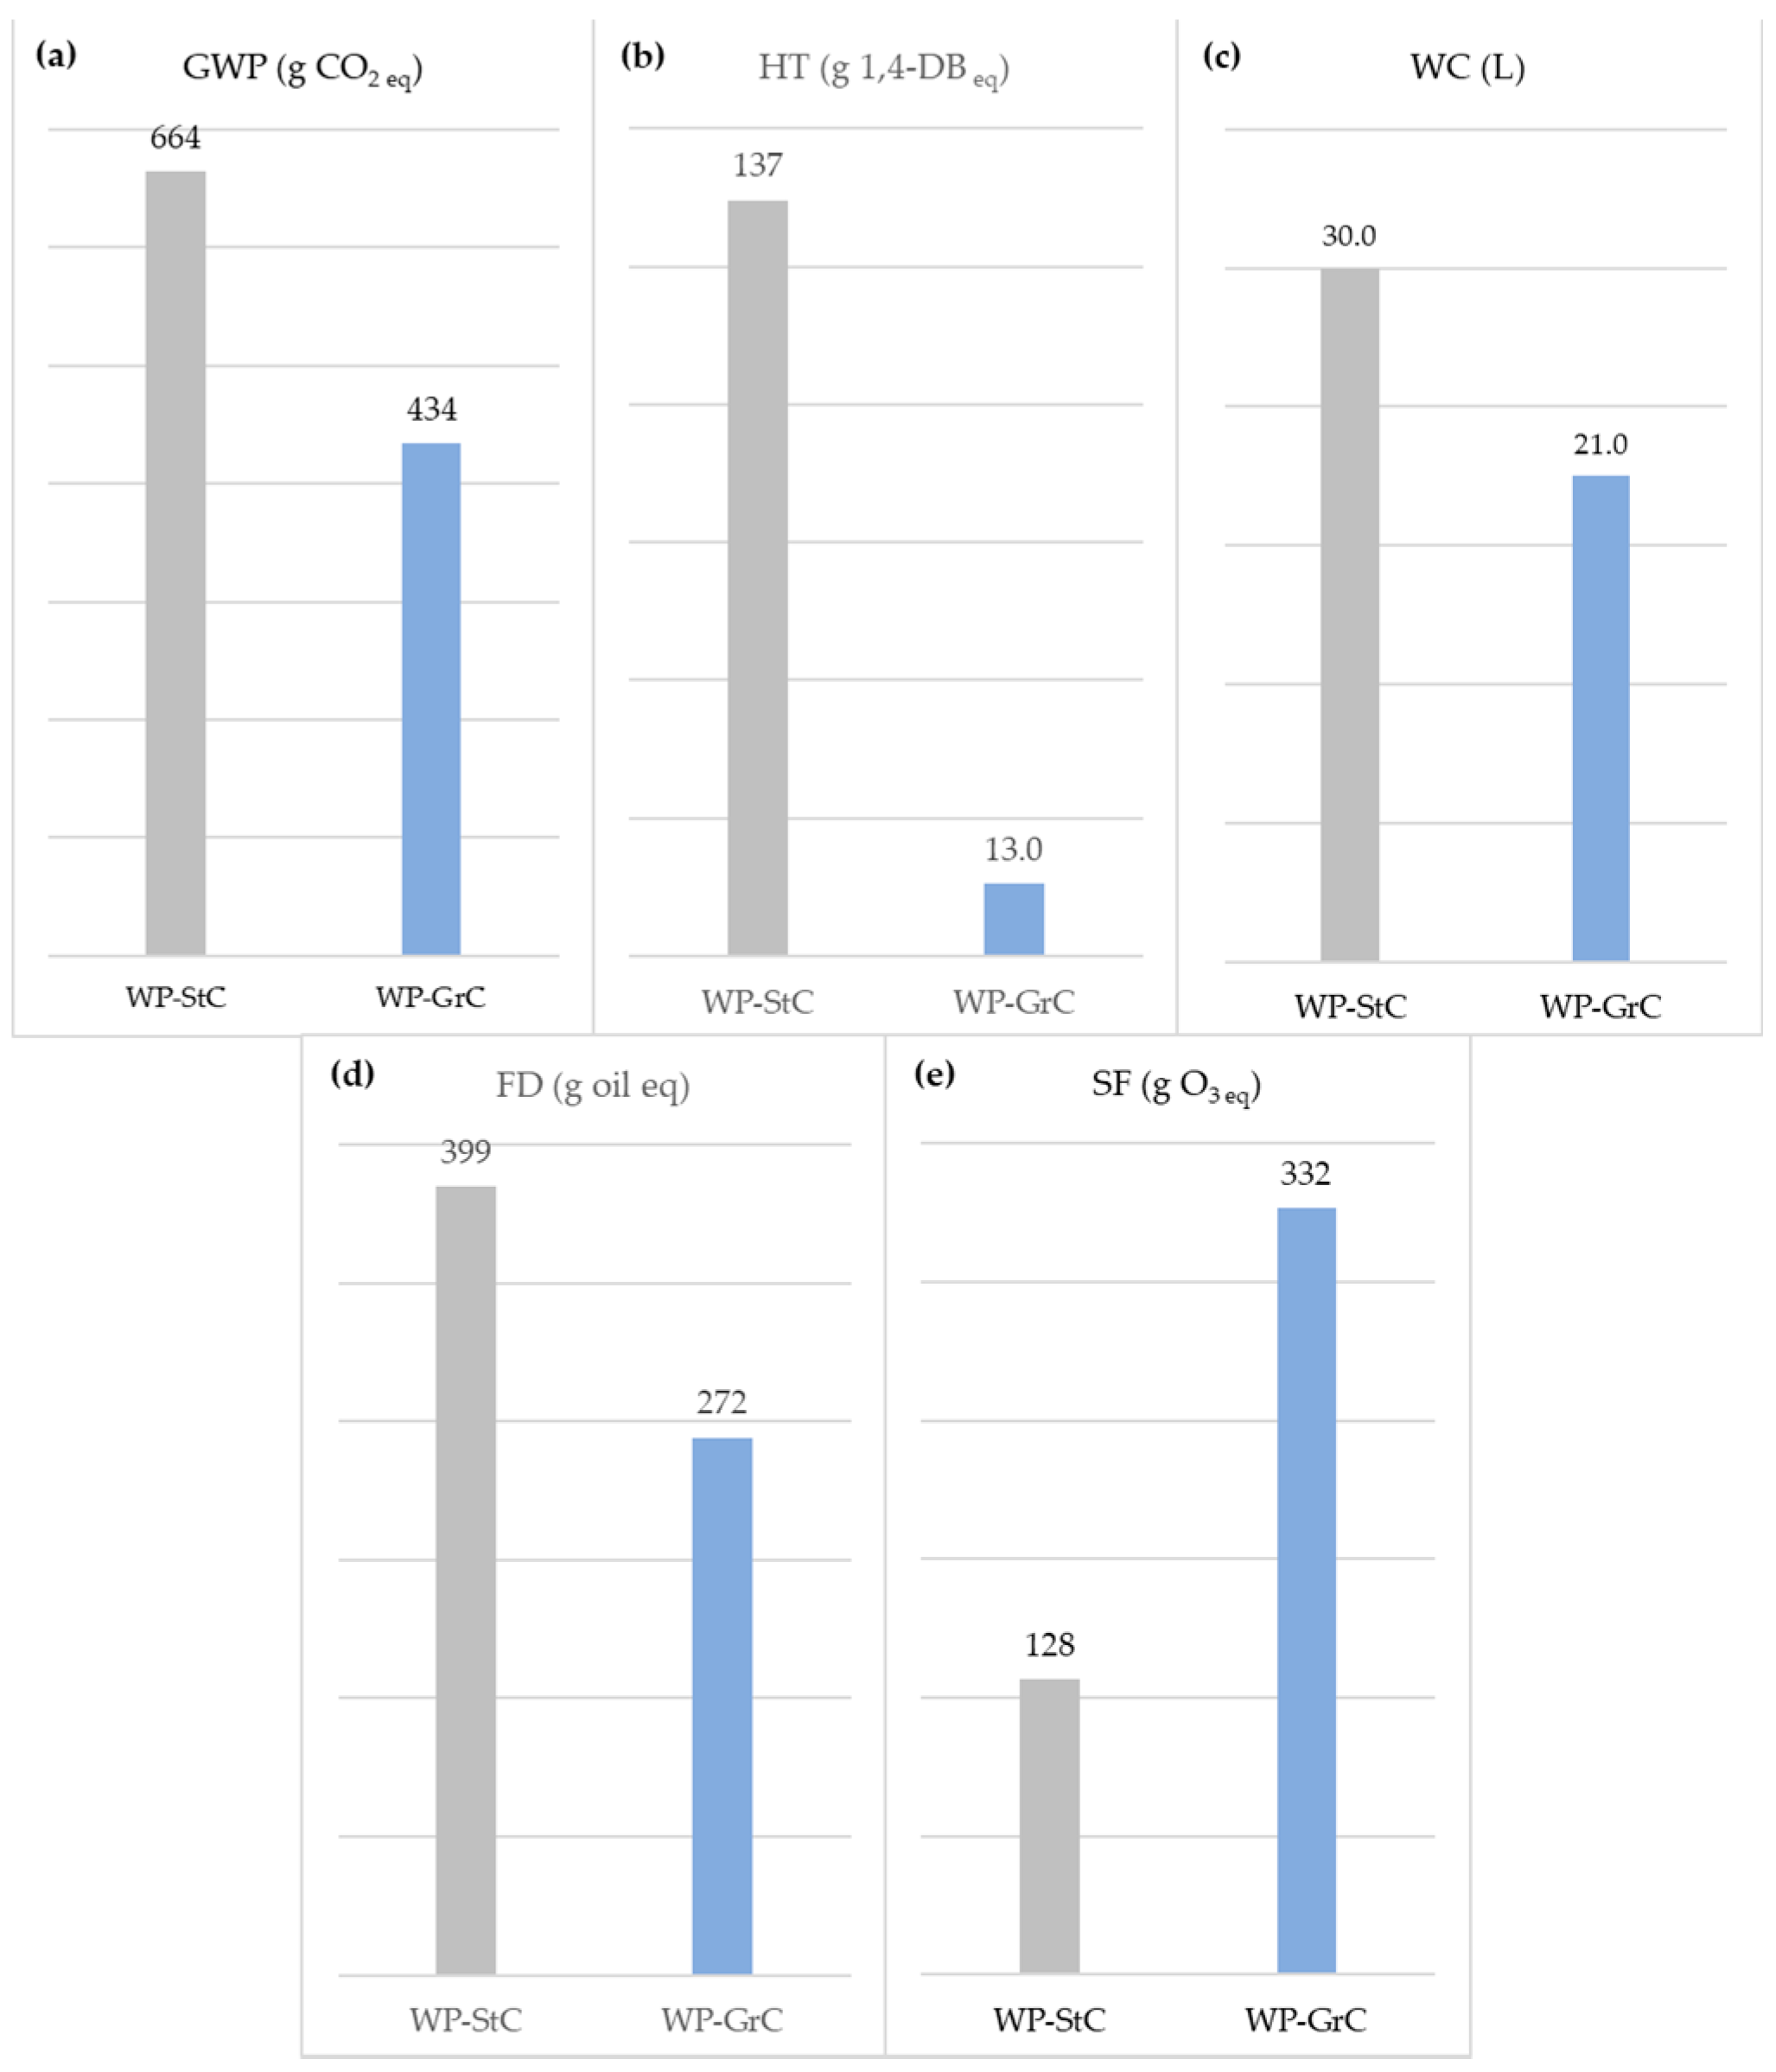
| Standardized Environmental Performance Indicator (SEIi) | ||||
| Impact Category | Unit (/RF) | StC | GrC | AGrC |
| GWP | g CO2 eq | 664 | 434 | 299 |
| HT | g 1,4-DB eq | 137 | 13 | 39.2 |
| WC | L | 30 | 21 | 21.7 |
| FD | g oil eq | 399 | 272 | 128 |
| SF | g O3 eq | 128 | 332 | 69.4 |
| Impact Category | Unit | StC | GrC | AGrC |
| NGWP | – | 1.00 | 0.65 | 0.45 |
| NHT | – | 1.00 | 0.09 | 0.29 |
| NWC | – | 1.00 | 0.70 | 0.72 |
| SFD | – | 1.00 | 0.68 | 0.32 |
| SSF | – | 1.00 | 2.59 | 0.54 |
| EIi | – | 5.00 | 4.72 | 2.32 |
| SEIi | – | 1.00 | 0.94 | 0.46 |
| Standardized Economic Performance Indicator (S$Ii) | ||||
| Price | Unit (/RF) | StC | GrC | AGrC |
| $IMini | USD | 0.23 | 0.21 | 0.22 |
| S$IMini | – | 1.00 | 0.90 | 0.95 |
| $IMaxi | USD | 0.26 | 0.26 | 0.26 |
| S$IMaxi | – | 1.00 | 1.00 | 1.00 |
Publisher’s Note: MDPI stays neutral with regard to jurisdictional claims in published maps and institutional affiliations. |
© 2021 by the authors. Licensee MDPI, Basel, Switzerland. This article is an open access article distributed under the terms and conditions of the Creative Commons Attribution (CC BY) license (https://creativecommons.org/licenses/by/4.0/).
Share and Cite
Cunha, I.L.C.; Rosa, F.; Kulay, L. Green Coalescent Synthesis Based on the Design for Environment (DfE) Principles: Brazilian Experience. Sustainability 2021, 13, 12802. https://doi.org/10.3390/su132212802
Cunha ILC, Rosa F, Kulay L. Green Coalescent Synthesis Based on the Design for Environment (DfE) Principles: Brazilian Experience. Sustainability. 2021; 13(22):12802. https://doi.org/10.3390/su132212802
Chicago/Turabian StyleCunha, Isadora Luiza Climaco, Fábio Rosa, and Luiz Kulay. 2021. "Green Coalescent Synthesis Based on the Design for Environment (DfE) Principles: Brazilian Experience" Sustainability 13, no. 22: 12802. https://doi.org/10.3390/su132212802
APA StyleCunha, I. L. C., Rosa, F., & Kulay, L. (2021). Green Coalescent Synthesis Based on the Design for Environment (DfE) Principles: Brazilian Experience. Sustainability, 13(22), 12802. https://doi.org/10.3390/su132212802