Abstract
Electric automated vehicles are zero-emission, energy-saving, and environmentally friendly vehicles, and testing and verification is an important means to ensure their safety. Because of the scarcity of dangerous scenarios in natural driving roads, it is required to conduct accelerated tests and evaluations for electric automated vehicles. According to the scenario data of the natural road in cut-in conditions, we used the kernel density estimation method to calculate the probability distribution of the scenario parameters. Additionally, we used the Metropolis–Hastings algorithm to sample based on the probability distribution of the parameters, and the Euclidean distance was combined with the paired combination to accelerate the simulation test process. The critical scenarios were screened out by the safety indicator, and the feature distribution of the critical scenario parameters was analyzed based on the Euclidean distance clustering method, so as to design importance sampling parameters and carry out importance sampling. The study obtained the distribution characteristics of critical scenario parameters under cut-in conditions and found that the importance sampling method can accelerate the test under the condition of ensuring that the relative error is small, and the improved accelerated simulation method makes the overall calculation amount smaller.
1. Introduction
In recent years, electric automated vehicle technology has developed rapidly. It is an important measure to ensure the safety of electric automated vehicles by functional verification and certification. Due to the complexity and diversity of the natural traffic environments and driving tasks, it has brought great challenges to the testing, verification, and certification for electric automated vehicles. Most of the scenarios encountered during vehicle driving are safe, natural scenarios, with few dangerous scenarios and a low probability of accidents. It requires hundreds of millions of kilometers of driving mileage to test and verify the safety of automated vehicles on natural driving roads, which have a long test period and a high test cost. How to reduce the workload of test and verification and conduct efficient test verification and certification of the safety of automated vehicles has become an important issue that needs to be resolved.
Scenario-based verification is a promising method for the safety verification of highly automated driving systems [1]. Erdogan et al. think that a scenario is a description of the continuous state of actions performed by multiple vehicles, and they proposed a parameterized architecture that generates scenarios from various databases [2]. Rocklage et al. proposed to combine scenario elements with parameters and combine them with trajectory planning to generate an effective set of test scenarios with variable coverage [3]. Menzel et al. analyzed the development process of a scenario-based method for an automated vehicle test verification system according to the ISO 26262 standard [4]. Klück et al. used the ontology of the environment that the autopilot system under testing interacts with and converted the ontology into an input model for combined testing to generate test cases [5]. Wu et al. used the modified driving reliability and error analysis method to analyze the inducing factors of dangerous rear-end-collision conditions of Chinese natural driving and constructed the logic diagram of the inducing factors under different scenario subdivision types [6]. Xia et al. selected cut-in dangerous-condition samples from natural driving data and analyzed the samples of the first type of cut-in hazardous conditions in which the AEB system plays a role by the clustering method; they obtained six types of hazardous scenarios [7]. Zhao et al. used deep learning and graph model theory to achieve cluster analysis and mining of test scenarios based on the reconstruction method of fuzzy matching the test scenario [8]. Hu et al. used the hierarchical clustering method to cluster analysis on 419 collision accident cases and designed the test scenario by combining the original parameter characteristics and the derived parameter characteristics [9]. Xia et al. used the analytic hierarchy process to determine the index of the complexity of test cases, and used the complexity index to evaluate the effectiveness of test cases to guide the generation of more effective test cases [10].
How to reduce the number of test cases and find critical test cases to improve test efficiency is a current research focus. Mullins et al. proposed an adaptive search technique to discover the performance boundary of system and introduced a technique to determine the performance boundary through unsupervised clustering and adjacency testing [11]. For the test set composed of traffic data mined from real traffic scenarios, in order to enable it to cover enough critical situations, Wolschke et al. considered improving test efficiency and achieved these goals by creating the smallest test set [12]. Klischat et al. proposed a scheme based on minimizing the solution space of vehicles under testing through scenario parameterization and automatic generation of the range of scenario parameters to optimize complex critical scenarios [13].
Due to the randomness of the scenario parameters of vehicles, accelerated testing techniques have been developed for the rarity of critical cases on actual roads and the unlimited number of traffic scenarios. Zhao et al. proposed a method to accelerate evaluation of automated vehicles using importance sampling (IS), and they used this method in lane-change scenarios. The cross-entropy method is used to obtain the distribution model of IS. Compared with the natural driving test using Monte Carlo simulation, a higher confidence level can be obtained with fewer simulation times [14]. Huang et al. proposed an IS distribution model of segmented mixed distribution and evaluated the collision probability of a single lane change. The acceleration effect obtained was 1.57 times that of the IS distribution model of a single distribution and 7000 times that of the Monte Carlo simulation test [15]. On this basis, they proposed the use of a Gaussian mixture model to construct the importance sampling distribution model [16] and later proposed the use of the kernel function method to construct the IS distribution model [17]. Studies have shown that these methods can greatly shorten the evaluation time.
In summary, it is an important development trend to find critical scenarios and conduct accelerated tests in the evaluation research of automated vehicles. Based on the cut-in driving scenario data on China’s natural roads, the kernel density estimation method was used to calculate the probability distribution of the scenario parameters. We used the Metropolis–Hastings sampling algorithm to obtain a large number of common test cases. The traditional simulation test method was improved by using the Euclidean distance combined with the pairwise combination, and the test method with improved calculation amount was applied to the simulation test of the automated vehicle at cut-in conditions. According to the simulation results of common test cases, Euclidean clustering was used to obtain critical test cases and to estimate the distributions of importance sampling. The accelerated evaluation was achieved by Monte Carlo simulation based on importance sampling.
2. Research Methods
Since the distribution of parameters in many driving scenarios cannot be predicted, a non-parametric method was used to estimate the distribution of parameters. Because the probability density function on the histogram is not continuous, and kernel density estimation can solve the problem of discontinuity, the information in the neighborhood of the sample point was used to obtain a more continuous probability density. Therefore, the kernel density estimation method in non-parametric estimation was used to estimate the distribution density function of the scenario parameters of the vehicle in cut-in driving conditions.
The formula for kernel density estimation is:
where is the estimated distribution density function; K(x) is the kernel function, and the Gaussian kernel function is selected; Nk is the sample number of the distribution to be estimated; x is the random variable; xi is the sample; and h is the bandwidth, h > 0.
The Monte Carlo method is a stochastic simulation method that uses random sampling to estimate numerical results, which can be used for automated vehicle simulation tests to ensure the coverage of test scenarios and to save test costs. The Monte Carlo sampling is used to calculate the expected value of a random variable. Suppose that X represents a random variable, obeys the probability distribution p(x), sample xi from p(x), and averages the function f(xi) of these samples:
where Êp(f(x)) is the mathematical expectation of f(x) estimated through sample sampling, f(xi) is the function value of the sample, and n is the number of samples.
For all possible events, Ω represents the sample space, ε represents a rare but relatively critical event, and . The function describing whether the event ε occurs is defined as:
To estimate the probability of occurrence of an event is to calculate .
After obtaining the parameter probability distributions of the scenarios in cut-in conditions, the Metropolis–Hastings (MH) sampling algorithm in the Markov Chain Monte Carlo method (MCMC) was used for sampling. The MH sampling algorithm can sample complex probability distributions. However, the acceptance rate α(x,y) of the MH sampling algorithm is too small, which leads to too small of a sampling acceptance rate, and the speed of convergence to a stable distribution p(x) is too slow; so, the acceptance rate needs to be improved.
Assuming that the acceptance rate α (i, j) = 0.1 and α (j, i) = 0.2, if we want to meet the meticulous and stable conditions at this time, then:
where Q is the transition probability matrix.
Extend both sides of the above Formula (4) by five times, and rewrite it as
In this way, the acceptance rate is increased without breaking the meticulous and stable conditions. Therefore, when α (i, j) and α (j, i) are enlarged in the same proportion, the largest number among them is enlarged to 1 to increase the acceptance rate; so, the acceptable acceptance rate is:
By increasing the acceptance rate, the MH sampling algorithm obtained is shown in Table 1.

Table 1.
Metropolis–Hasting sampling algorithm.
The sample values of each scenario parameter were obtained according to the MH sampling algorithm, and the combinations of the sample values were the randomized common test cases. According to the simulation results of all randomized common test cases, the probability of the occurrence of critical events was estimated by Formula (2). The relative error of the estimation result is:
where er_MH is the relative error of the estimation result.
3. Results
3.1. Probability Density Function Estimation of Scenario Parameters
The natural driving scenarios in the cut-in driving conditions were parameterized. Three independent scenario parameters were selected: the distance Lc between the ego-vehicle and the interfering vehicle at the initial cut-in moment, the speed Ve of the ego-vehicle at the initial cut-in moment, and the speed ratio Rfe of the front vehicle and ego-vehicle at the initial cut-in moment.
Based on the 1187 natural driving data scenarios of cut-in conditions measured on a city road in China, the probability density distributions of the three scenario parameters of cut-in conditions can be obtained through kernel density estimation, as shown in Figure 1.
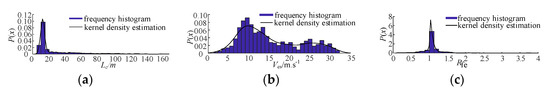
Figure 1.
Probability density distributions of fitted cut-in scenario parameters. (a) Probability density distribution of Lc. (b) Probability density distribution of Ves. (c) Probability density distribution of Rfe.
3.2. Monte Carlo Simulation Based on Euclidean Clustering
The Monte Carlo simulation results were obtained according to the natural driving data distribution sampling, and the critical test cases were obtained according to the critical scenario metric. Because of the repetition or similarity between these critical test cases, we used the Euclidean distance method to cluster and delete duplicate or similar test cases and provided a basis for the next step in the selection of importance sampling parameters.
Euclidean distance is defined as:
where I = (xi1, xi2, …, xif) and J = (xj1, xj2, …, xjf) are two f-dimensional data objects.
The dimensions of the three independent variables that reflect the cut-in conditions are all different, and the data need to be standardized before calculation. Range standardization was used for processing:
where xij* is the standardized variable, i = 1, 2, …, N, j = 1, 2, …, M, xij is the variable to be clustered, Nc is the number of scenarios to be clustered, N is the number of scenarios, and M is the number of scenario variables to be clustered.
The MH sampling algorithm was used to randomly sample from the probability density distribution of the parameters of the cut-in conditions. Ten thousand points were sampled from each distribution, and a total of ten thousand common test cases were generated.
It was assumed that the automated ego-vehicle was driving in a constant-speed cruise mode on a straight road. When a vehicle in the adjacent lane cuts into the front of the ego-vehicle, the ego-vehicle switches to the following cruise mode and follows the movement of the preceding vehicle to prevent collisions. The motion planning and control algorithm of the ego-vehicle adopt the model predictive control algorithm developed by us [18].
Common critical scenario metrics include time-to-collision (TTC), braking time, expected deceleration, and so on. We selected TTC to define the critical events. The condition with a TTC less than or equal to 0 the collision condition. The condition with a TTC less than 0.5 and greater than 0 was the pre-collision condition. The conditions with a TTC less than 2.5 and greater than 0.5 were dangerous conditions. Other conditions were safe conditions.
where TTC is the collision time, da is the distance between the ego-vehicle and the preceding vehicle, and ΔV is the relative speed of the ego-vehicle and the preceding vehicle.
We used PreScan software to build a road scenario model, MATLAB/Simulink software to build a control simulation model for the automated ego-vehicle, and co-simulation technology to perform Monte Carlo simulation on the generated test cases to estimate the probability of critical events.
In the simulation test, the sampling parameters of the cut-in scenarios were 10,000 sets, which result in an extremely time-consuming sampling cycle. In order to ensure the estimation accuracy, the number of sampling cycles cannot be significantly reduced. We optimized the simulation operation within each sampling cycle to reduce the amount of calculation. The inner and outer two-layer loops were adopted in the simulation. The test cases of the inner loop were combined test cases using pairwise independent combinatorial testing (PICT), and the test cases of the outer loop were ordinary test cases after sampling. When starting the outer loop, Equations (8) and (9) were used to search for test cases similar to ordinary test cases from the inner loop test cases. If the Euclidean distance between an inner loop test case and an ordinary test case was less than the threshold of 0.1, the inner loop test cases were simulated such that the simulation result was regarded as the test result of the ordinary test case. The test case did not need to be simulated. If there was no corresponding inner loop test case that met the requirements, the common test case needed to be simulated again. This calculation process was repeated until the simulations of all ordinary test cases were over.
The PICT combination test cases were obtained through the sample value distributions of the scenario parameter and were based on the PICT combination test case generation toolbox developed by Microsoft. From the MH sampling of the probability distribution of the parameters of the cut-in scenario, the main change interval of the distance Lc between the ego-vehicles and the interfering vehicle at the initial time was 1.7–85 m, and the main change interval of the ego-vehicle speed Ves at the initial time was 0–38 m/s. The main change range of the vehicle speed ratio Rfe between the preceding vehicle and the ego-vehicle at the initial time was 0.01–2.4. We discretized the above-mentioned change intervals, and we used the PICT combination test case generation tool and the paired combination coverage standard to generate 1134 test cases.
Taking 500 test cases as an example for analysis, the comparison of simulation results before and after the improvement of simulation calculation is shown in Figure 2 and Figure 3. Table 2 shows the comparison between the estimated probabilities of event occurrence and the simulation calculation amount before and after the improved simulation calculation amount. It can be seen from Table 2 that the probabilities of occurrence of each event was basically the same before and after the improved simulation calculation amount. The number of joint simulations was significantly reduced after the improved simulation calculation amount, and the calculation amount was smaller. Therefore, the improved algorithm accelerates the simulation test.
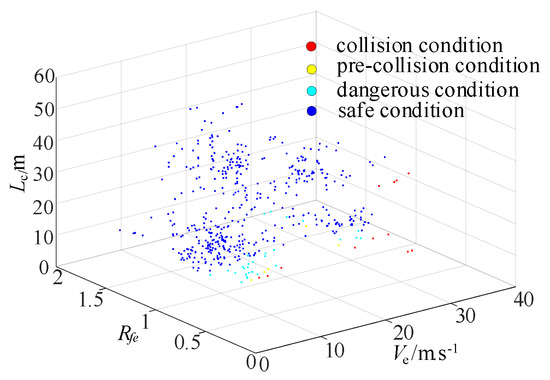
Figure 2.
Results before MH improvement.

Figure 3.
Results after MH improvement.
Table 2.
Comparisons of simulation results before and after improved algorithm.
Using the simulation test method that improves the amount of simulation test calculations, the simulation results of 10,000 test cases were obtained through the 601 times of inner and outer loop simulations as shown in Figure 4, where each point represents the simulation result of a test case. It can be seen from Figure 4 that dangerous conditions, pre-collision conditions, and collision conditions were mainly distributed in places where the distance between the ego-vehicle and the interfering vehicle was small and the speed of the ego-vehicle was relatively high at the initial moment of the cut-in condition.
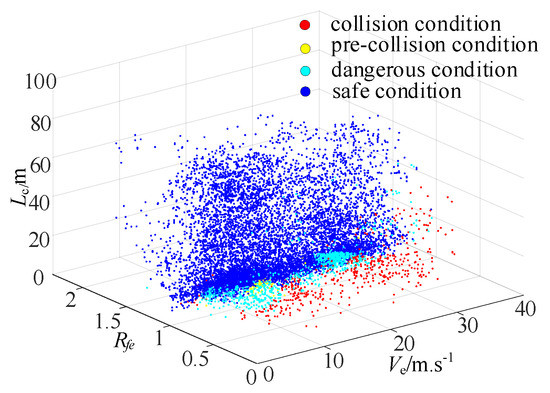
Figure 4.
Simulation results of common test cases.
According to Equations (1) and (7), the estimated probabilities of occurrence of pre-collision and dangerous conditions in the critical events and the error of the estimated probability relative to the real situation were calculated as shown in Table 3. It can be seen from Table 3 that the relative error of the estimated probability of occurrence of pre-collision conditions under Monte Carlo sampling was relatively large.
Table 3.
Estimated probability and relative error.
4. Discussion
4.1. Importance Sampling to Generate Critical Test Cases
The test cases generated in Section 2 conform to the probability distribution of natural driving scenarios, but the critical test cases were relatively rare. Automated vehicle evaluation mainly focuses on the performance of automated driving systems under critical test cases.
We used the Monte Carlo method to randomly sample the original distribution p(x), and the mathematical expectation was estimated by Equation (2). Equation (1) can also be expressed as:
If the samples conforming to the distribution of p(x) are not well generated, then another distribution q(x) that is easy to sample is introduced so that:
A necessary condition for the establishment of Formula (13) is to ensure the absolute continuity of p(x) and q(x), namely:
Then, the unbiased estimate based on importance sampling is:
Let w(x) = p(x)/q(x) be the likelihood ratio, where both p(x) and f(x) are determined, and what needs to be determined is the distribution q(x). Normally, the smaller the variance of the sample, the faster the expected convergence rate. Therefore, the smaller the variance of f(x)w(x) the better; so, where f(x)p(x) is large, q(x) should also be large. A good distribution q(x) should have a high probability of distribution in the area of f(x) = 1; that is, samples sampled from q(x) should have a higher probability of collision events.
The critical test cases that usually lead to extreme conditions are most likely to be located at both ends of the original distribution p(x). If the probability of a critical event is estimated based on the original distribution sampling, a large number of test cases need to be generated to reduce the estimated variance, which leads to calculation overload. Therefore, importance sampling is used to generate more critical test cases, which can reduce the variance of . This sampling method uses a different distribution q(x) to generate test cases, and a larger probability function value q(x) is used where the probability density function value p(x) is smaller to increase the probability of critical events.
The following formula can be used to calculate the relative error of the importance sampling estimation results.
4.2. Importance Sampling Simulation Results
By analyzing Figure 3, it can be seen that the pre-collision events and dangerous conditions mainly appeared at the two ends of the probability density distribution of cut-in scenario parameters, that is, the low probability interval. Therefore, there were fewer critical events obtained through sampling, resulting in excessive error in the estimation results of critical events. Therefore, importance sampling was adopted, and the probability distribution q(x) that is easy to sample was used to amplify the low-value probability sample interval and increase the probability of occurrence of critical events.
We used the clustering extraction method of the test case based on Euclidean distance clustering to obtain several sets of critical test cases under pre-collision conditions and dangerous conditions, as shown in Table 4.
Table 4.
Cluster extraction of critical test cases.
From the results extracted from the critical test cases in Table 4, the occurrence of pre-collision and dangerous events was concentrated in the vicinity of Lc = 12, Ves = 8, and Rfe = 0.75. Therefore, the probability distribution of the above three parameters was replaced by the easy-to-sample normal distribution q(x); then, the substitution distribution of Lc was selected as q1(x)~N(12, 2), the substitution distribution of Ves was selected as q2(x)~N(8, 1.5), and the substitution distribution of Rfe was selected as q3(x)~N(0.75, 0.08). The variance of the parameters was determined by trial and error. These three parameters were sampled by importance sampling according to the normal distribution, and the virtual simulation test using the method of improved calculation amount in the Section 3.2 was performed. The inner and outer loop simulations were 431 times, and the 10,000 simulation results obtained are shown in Figure 5. We used Equations (13) and (14) to restore the probability of critical events occurring in natural driving scenarios and estimated the relative error of the estimation, obtaining the estimation results shown in Table 5.
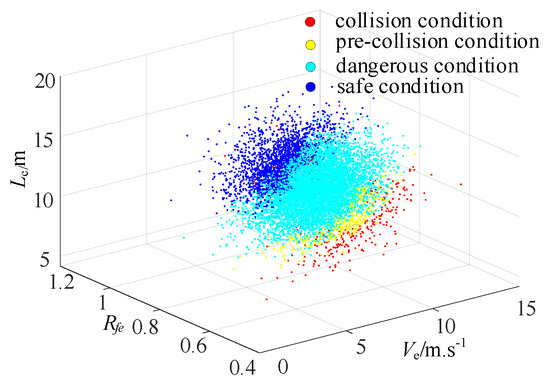
Figure 5.
Simulation results of importance sampling.
Table 5.
Estimated probability and relative error.
From the comparison of Table 3 and Table 5, it can be seen that the estimation results of the two critical events of pre-collision and hazard were roughly the same, but the estimation results obtained by the simulation test using importance sampling had smaller relative errors. Additionally, the convergence of critical events was better and easier to sample with less computation.
5. Conclusions
According to the natural driving data of the ego-vehicle and interfering vehicle in the cut-in conditions, the MH algorithm was used to sample the probability distribution of the scenario parameters to generate randomized ordinary test cases. Euclidean distance and pairwise combination methods were used to improve the computational amount of simulation methods to improve test efficiency. According to the critical scenario safety indicator, Euclidean distance clustering was used to obtain critical test cases. The distribution characteristics of critical scenario parameters under the cut-in conditions were obtained.
Based on the simulation results of ordinary test cases and the distribution characteristics of critical scenario parameters under the cut-in conditions, the distribution estimation of importance sampling was carried out. Importance sampling was used to generate a large number of randomized critical test cases, and simulation tests were conducted by using the method of improving the calculation amount. Research shows that compared with Monte Carlo sampling, the importance sampling method can speed up the test while ensuring that the relative error is small, and the improved accelerated simulation method makes the overall calculation amount smaller.
The number of natural scenarios used in this study needs to be further increased. In the future, we will improve the sampling method based on the acquisition of a large amount of natural scenario data and conduct simulation tests and extract critical test cases to increase the confidence of accelerated test results. For cut-in conditions, the calculation method of the critical evaluation index TTC of the scenario was not very accurate. In the future, we will study a more accurate TTC calculation formula. Excessive deceleration of the ego-vehicle will affect ride comfort and safety, and the maximum deceleration of the ego-vehicle will also be included in the critical evaluation indexes of the cut-in scenarios.
Author Contributions
Conceptualization, Q.X., Y.C., H.L. and H.S.; methodology, Q.X., Y.C., H.L. and H.S.; formal analysis, Q.X., Y.C., H.L. and H.S.; investigation, Q.X. and H.L.; resources, Q.X.; data curation, Q.X. and H.L.; writing—original draft preparation, Q.X., Y.C., H.L. and H.S.; writing—review and editing, Q.X., Y.C., H.L. and H.S.; visualization, Q.X.; supervision, Y.C.; project administration, Y.C. and H.S.; funding acquisition, Y.C. and H.S. All authors have read and agreed to the published version of the manuscript.
Funding
This research was funded by Chongqing Technology Innovation and Application Development Special Major Theme Special Project, Chongqing Science and Technology Bureau, grant number cstc2019jscx-zdztzxX0039.
Institutional Review Board Statement
Not applicable.
Informed Consent Statement
Not applicable.
Data Availability Statement
Data available on request due to privacy restrictions.
Conflicts of Interest
The authors declare no conflict of interest. The funders had no role in the design of the study; in the collection, analyses, or interpretation of data; in the writing of the manuscript; or in the decision to publish the results.
References
- Krajewski, R.; Moers, T.; Nerger, D.; Eckstein, L. Data-Driven Maneuver Modeling Using Generative Adversarial Networks and Variational Auto encoders for Safety Validation of Highly Automated Vehicles. In Proceedings of the 21st International Conference on Intelligent Transportation Systems (ITSC), Maui, HI, USA, 4–7 November 2018; pp. 2383–2390. [Google Scholar]
- Erdogan, A.; Kaplan, E.; Leitner, A.; Nager, M. Parametrized End-to-End Scenario Generation Architecture for Automated Vehicles. In Proceedings of the 6th International Conference on Control Engineering & Information Technology, Istanbul, Turkey, 25–27 October 2018. [Google Scholar]
- Rocklage, E.; Kraft, H.; Karatas, A.; Seewig, J. Automated Scenario Generation for Regression Testing of Automated Vehicles. In Proceedings of the IEEE 20th International Conference on Intelligent Transportation Systems: Workshop, Yokohama, Japan, 16–19 October 2017; pp. 476–483. [Google Scholar]
- Menzel, T.; Bagschik, G.; Maurer, M. Scenarios for Development, Test and Validation of Automated Vehicles. In Proceedings of the 2018 IEEE Intelligent Vehicles Symposium, Changshu, Suzhou, China, 26–30 June 2018; pp. 1821–1827. [Google Scholar]
- Klück, F.; Li, Y.; Nico, M.; Tao, J.; Wotawa, F. Using Ontologies for Test Suites Generation for Automated and Automated Driving Functions. In Proceedings of the 2018 IEEE International Symposium on Software Reliability Engineering: Workshops, Memphis, TN, USA, 15–18 October 2018; pp. 118–123. [Google Scholar]
- WU, B.; Zhu, X.C.; Shen, J.P.; Sun, X.Y. Analysis of causation of rear-Eed incidents based on naturalistic driving study. J. Tongji Univ. (Natl. Sci.) 2018, 46, 1253–1260. [Google Scholar]
- Xia, L.; Zhu, X.C.; Ma, Z.X. AEB Test Scenarios under Cut-in Dangerous Condition. In Proceedings of the 14th International Forum of Automotive Traffic Safety, Changsha, China, 1 December 2017; pp. 184–197. [Google Scholar]
- Zhao, X.M.; Cheng, J.J.; Xu, Z.G.; Wang, W.W.; Wang, R.M.; Wang, G.Q.; Zhu, Y.; Wang, G.P.; Zhou, Y.; Chen, N.F. An indoor rapid-testing platform for autonomous vehicle based on vehicle-in-the-loop simulation. China J. Highw. Trans. 2019, 32, 124–136. [Google Scholar]
- Hu, L.; Yi, P.; Huang, J.; Zhang, X.; Lei, Z.B. A research on test scenes of two-wheeled vehicles for automatic emergency braking system based on real accident cases. Automot. Eng. 2018, 40, 1435–1446. [Google Scholar]
- Xia, Q.; Duan, J.L.; Gao, F.; Chen, T.; Yang, C. Automatic Generation Method of Test Scenario for ADAS Based on Complexity. In Proceedings of the Intelligent and Connected Vehicles Symposium, Kunshan, China, 23 September 2017. [Google Scholar]
- Mullins, G.E.; Stankiewicz, P.G.; Gupta, S.K. Automated Generation of Diverse and Challenging Scenarios for Test and Evaluation of Automated Vehicles. In Proceedings of the 2017 IEEE International Conference on Robotics and Automation, Singapore, 29 May–3 June 2017; pp. 1443–1450. [Google Scholar]
- Wolschke, C.; Rombach, D.; Liggesmeyer, P.; Kuhn, T. Observation Based Creation of Minimal Test Suites for Automated Vehicles. In Proceedings of the 2017 IEEE International Symposium on Software Reliability Engineering Workshops, Toulouse, France, 23–26 October 2017; pp. 294–301. [Google Scholar]
- Klischat, M.; Althoff, M. Generating Critical Test Scenarios for Automated Vehicles with Evolutionary Algorithms. In Proceedings of the 2019 IEEE Intelligent Vehicles Symposium (IV), Paris, France, 9–12 June 2019; pp. 2352–2358. [Google Scholar]
- Zhao, D.; Lam, H.; Peng, H.; Bao, S.; LeBlanc, D.J.; Nobukawa, K.; Pan, C.S. Accelerated evaluation of automated vehicles safety in lane-change scenarios based on importance sampling techniques. IEEE Trans. Intell. Trans. Syst. 2017, 18, 595–607. [Google Scholar] [CrossRef] [PubMed] [Green Version]
- Huang, Z.; Zhao, D.; Lam, H.; LeBlanc, D.J.; Peng, H. Evaluation of Automated Vehicles in the Frontal Cut-in Scenario—An Enhanced Approach using Piecewise Mixture Models. In Proceedings of the 2017 IEEE International Conference on Robotics and Automation, Singapore, 29 May–3 June 2017; pp. 197–202. [Google Scholar]
- Huang, Z.; Lam, H.; Zhao, D. An Accelerated Testing Approach for Automated Vehicles with Background Traffic Described by Joint Distributions. In Proceedings of the 20th International Conference on Intelligent Transportation Systems: Workshop, Yokohama, Japan, 16–19 October 2017; pp. 933–938. [Google Scholar]
- Huang, Z.; Guo, Y.; Lam, H.; Zhao, D. A Versatile Approach to Evaluating and Testing Automated Vehicles based on Kernel Methods. In Proceedings of the 2018 Annual American Control Conference, Milwaukee, WI, USA, 27–29 June 2018. [Google Scholar]
- Yuan, K.; Shu, H.; Huang, Y.J.; Zhang, Y.B.; Khajepour, A.; Zhang, L. Mixed local motion planning and tracking control framework for autonomous vehicles based on model predictive control. IET Intell. Trans. Syst. 2019, 13, 950–959. [Google Scholar] [CrossRef]
Publisher’s Note: MDPI stays neutral with regard to jurisdictional claims in published maps and institutional affiliations. |
© 2021 by the authors. Licensee MDPI, Basel, Switzerland. This article is an open access article distributed under the terms and conditions of the Creative Commons Attribution (CC BY) license (https://creativecommons.org/licenses/by/4.0/).