
Can the “VUCA Meter” Augment the Traditional Project Risk Identification Process? A Case Study

 ,
,
Abstract
:1. Introduction
2. Literature Review
3. The Case Study
4. Methodology
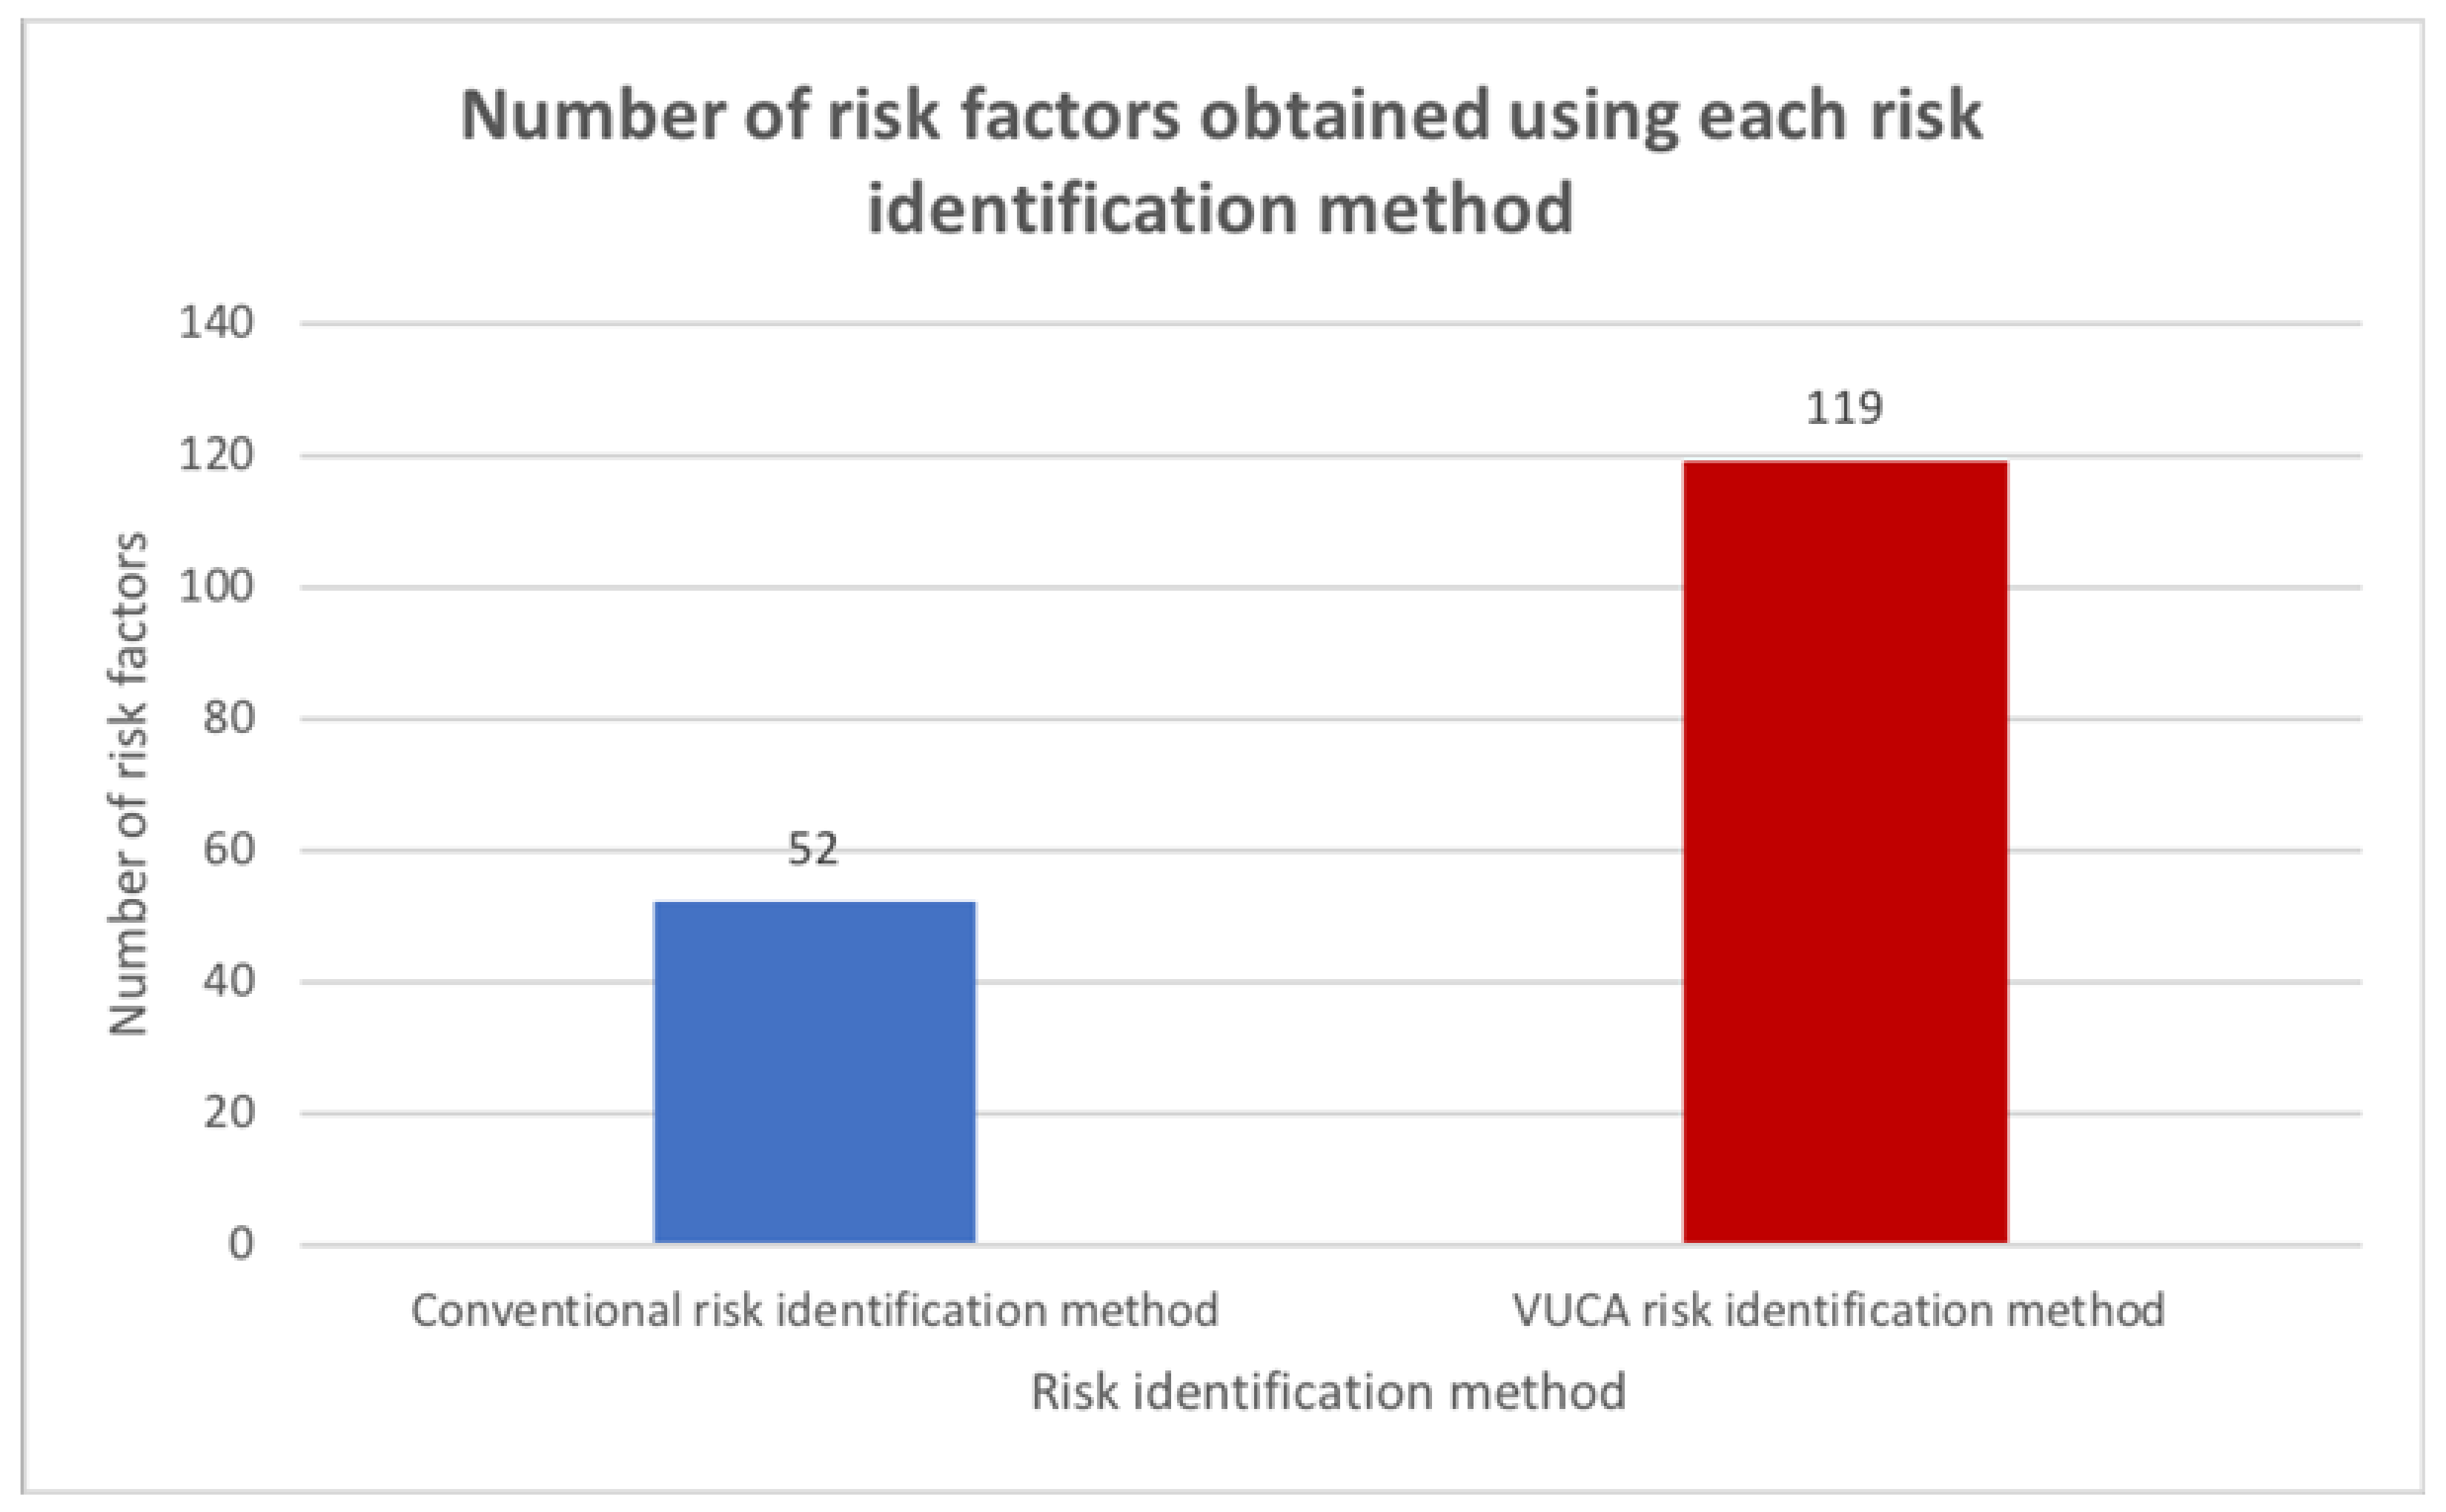
5. Results
5.1. Workshops
5.2. Delphi Surveys
- Overheating in the construction industry creates problems
- Legal decision related to infrastructure taken, but operation is not catered for
- The sponsor pushing towards down-scaling to achieve more for the same budget
- Major disruption during construction—affecting the construction time
- Unexpected natural disasters, such as eruption, global warming, and climate
- Changes in direction at the operator
- A financial crisis which results in higher costs of project component
- Unfavorable development of different fuel options
- Overheating in the construction industry creates problems
- Major disruption during construction—affecting the construction time
- Unexpected natural disasters, such as eruption, global warming, and climate
- Changes in direction at the operator
- A financial crisis which results in higher costs of project component
6. Discussion
7. Conclusions
Author Contributions
Funding
Institutional Review Board Statement
Informed Consent Statement
Data Availability Statement
Conflicts of Interest
Appendix A. The VUCA Meter
| Criteria | Compliance Weights | Avg. Score | Statement Score Range | ||||
| Volatility | 1 | 2 | 3 | 4 | 5 | ||
| Simple in planning (straightforward/sequential execution) | |||||||
| Resource needs are known and accessible | |||||||
| Adequate timeframe with good slack in schedule | |||||||
| Solid contracts throughout project duration | |||||||
| Known, well defined objectives | |||||||
| Average score: | |||||||
| Project score range: | |||||||
| Uncertainty | 1 | 2 | 3 | 4 | 5 | ||
| Uses few and proven technology components | |||||||
| Stakeholders are few, with few time zones/cultural differences | |||||||
| Information is easy to obtain | |||||||
| Scope is well defined and approved | |||||||
| Risk management is well defined | |||||||
| Average score: | |||||||
| Project score range: | |||||||
| Complexity | 1 | 2 | 3 | 4 | 5 | ||
| Few and simple regulatory or political environments | |||||||
| Few subcontractors, organizational departments, and cultural differences | |||||||
| Few interfaces with other technologies, projects or operations | |||||||
| Has been done many times before | |||||||
| Clear governance, straightforward decision-making | |||||||
| Average score: | |||||||
| Project score range: | |||||||
| Ambiguity | 1 | 2 | 3 | 4 | 5 | ||
| Deliverables are well defined, no “unknowns unknowns” | |||||||
| Connections between tasks are clear | |||||||
| Risk factors are well known and documented | |||||||
| No “hidden agenda” | |||||||
| All stakeholders and their relationship are recognized | |||||||
| Average score: | |||||||
| Project score range: | |||||||
Appendix B. Pictures from the Workshops
References
- Vaðlaheiðarganga, Saga. Available online: https://www.vadlaheidi.is/is/sagan (accessed on 18 October 2021).
- Heidarson, J.T. Vaðlaheiðargöng—Mat á Þjóðhagslegri Arðsemi, January 2006. Available online: https://www.rha.is/static/files/Rannsoknir/2006/Skyrsla_loka.pdf (accessed on 18 October 2021).
- Kjarninn. Available online: https://kjarninn.is/frettir/2018-03-12-let-reikna-kostnad-vid-vadlaheidargong-i-samraemi-vid-log-um-rikisabyrgdir/ (accessed on 18 October 2021).
- DV. Available online: https://www.dv.is/frettir/2019/07/15/tekjur-vadlaheidarganga-65-70-minni-en-aaetlad-var (accessed on 18 October 2021).
- Fridgeirsson, T.; Ingason, H.; Jonasson, H.; Kristjansdottir, B. The VUCAlity of Projects: A New Approach to Assess a Project Risk in a Complex World. Sustainability 2021, 13, 3808. [Google Scholar] [CrossRef]
- Bennett, N.; Lemoine, G.J. What a difference a word makes: Understanding threats to performance in a VUCA world. Bus. Horiz. 2014, 57, 311–317. [Google Scholar] [CrossRef]
- Thamhain, H. Managing Risks in Complex Projects. Proj. Manag. J. 2013, 44, 20–35. [Google Scholar] [CrossRef]
- PMI. Project Management Institute, The Standard for Risk Management in Portfolios, Programs, and Projects; PMI: Newtown Square, PA, USA, 2019. [Google Scholar]
- Ackermann, F.; Eden, C.; Williams, T.; Howick, S. Systemic risk assessment: A case study. J. Oper. Res. Soc. 2007, 58, 39–51. [Google Scholar] [CrossRef]
- Kahneman, D.; Tversky, A. Prospect Theory: An Analysis of Decision under Risk. Econometrica 1979, 47, 263–291. [Google Scholar] [CrossRef] [Green Version]
- Flyvbjerg, B.; Glenting, C.; Rønnest, A. Procedures for Dealing with Optimism Bias in Transport Planning; The British Department for Transport, Guidance Document: London, UK, 2004. [Google Scholar]
- The Black Swan: The Impact of the Highly Improbable: With a New Section: “On Robustness and Fragility” (Incerto) Paperback—11 May, 2nd ed.; Random House Publishing Group: New York, NY, USA, 2007.
- Cirillo, P.; Taleb, N.N. Tail risk of contagious diseases. Nat. Phys. 2020, 16, 606–613. [Google Scholar] [CrossRef]
- Ward, S.C.; Chapman, C.B. Risk-management perspective on the project lifecycle. Int. J. Proj. Manag. 1995, 13, 145–149. [Google Scholar] [CrossRef]
- Morris, P.W.G.; Pinto, J.; Söderlund, J. Introduction: Towards the Third Wave of Project Management; Oxford University Press: Oxford, UK, 2011. [Google Scholar]
- Rodrigues-Da-Silva, L.H.; Crispim, J. The Project Risk Management Process, a Preliminary Study. Procedia Technol. 2014, 16, 943–949. [Google Scholar] [CrossRef] [Green Version]
- PMI. Foundational Standards; PMI: Newtown Square, PA, USA, 2017. [Google Scholar]
- Nieto-Morote, A.; Ruz-Vila, F. A fuzzy approach to construction project risk assessment. Int. J. Proj. Manag. 2011, 29, 220–231. [Google Scholar] [CrossRef] [Green Version]
- Geraldi, J.; Maylor, H.; Williams, T. Now, let’s make it really complex (complicated). Int. J. Oper. Prod. Manag. 2011, 31, 966–990. [Google Scholar] [CrossRef]
- Linehan, C.; Kavanagh, D. From Project Ontologies to Communities of Virtue; Department of Management & Marketing University College Cork, National University of Ireland: Cork, Ireland, 2004. [Google Scholar]
- Green, N. Keys to Success in Managing a Black Swan Event [White Paper], AON Corporation. Available online: http://www.aon.com/attachments/risk-services/Manage_Black_Swan_Even_Whitepaper_31811.pdf (accessed on 9 October 2021).
- Szpitter, A.; Sadkowska, J. Using VUCA matrix for the assessment of project environment risk. Zarzadzanie Finans. 2016, 14, 401–413. [Google Scholar]
- Ocicka, B.; Jolanta, T. “Supply Chain Sustainability Risk Management in a Digitally VUCA Changing World”. In The Economics of Sustainable Transformation; Routledge: New York, NY, USA, 2021; pp. 167–190. [Google Scholar]
- Gao, Y.; Feng, Z.; Zhang, S. Managing supply chain resilience in the era of VUCA. Front. Eng. Manag. 2021, 8, 465–470. [Google Scholar] [CrossRef]
- Etikan, I.; Musa, S.A.; Alkassim, R.S. Comparison of Convenience Sampling and Purposive Sampling. Am. J. Theor. Appl. Stat. 2016, 5, 1–4. [Google Scholar] [CrossRef] [Green Version]
- Ørngreen, R.; Levinsen, K. “Workshops as a Research Methodology”. Electron. J. E-Learn. 2017, 15, 70–81. [Google Scholar]
- Qin, J.; Xi, Y.; Witold, P. Failure mode and effects analysis (FMEA) for risk assessment based on interval type-2 fuzzy evidential reasoning meth-od. Appl. Soft Comput. 2020, 89, 106134. [Google Scholar] [CrossRef]
- Titko, M.; Ristvej, J.; Zamiar, Z. Population preparedness for disasters and extreme weather events as a predictor of building a resilient society: The Slovak Republic. Int. J. Environ. Res. Public Health 2021, 18, 2311. [Google Scholar] [CrossRef] [PubMed]
- Kahneman, D. Thinking, Fast and Slow; Macmillan: New York, NY, USA, 2011. [Google Scholar]

| Emergency response to the problem and fixing the problem are different aspects. |
| A solution to the problem is unknown and must be created under dismal circumstances. |
| Public relations issues can be massive, putting pressure on reputation, credibility, and perception of the public. |
| Governmental and regulatory agencies may demand response. |
| Productivity and cash flow may be affected negatively, liquidity could become uncertain, and asset prices disturbed. |
| Despite the problem, the day-to-day operation must continue. |
| Delays in other infrastructure (neighboring projects) |
| Overheating in the construction market |
| Failing to implement measures and incentives that will fulfil the project objectives |
| Currency fluctuation |
| Loss of reputation due to rights of construction personnel not followed |
| The new infrastructure will not give enough priority for the vehicles |
| Legal decision related to infrastructure, but operation is not catered for |
| Complicated interaction between design, planning, and EIA |
| The project not being able to bring expected urban qualities |
| Difficulties in getting good placing for a depot |
| Illegal size of fleet |
| Failures in branding the project will not draw new users |
| The project operation affected by delay in the system |
| Uncertainties in volumes calculations |
| Issues when obtaining land |
| Problems with EIA laws |
| Constantly needing reaffirming the ground/decision for the project |
| No ultimate decision maker that can give final answer |
| Decision on investment cost vs. maintenance cost (different budget) |
| Some part of the projects is forgotten/not delivered |
| The budget in manifesto will not be accepted every year by the government |
| The sponsor pushing towards downscaling to achieve more for the same budget |
| Change in key decision-makers |
| Complexities due to the current setup/ownerships of the project |
| Project scope is not clearly defined |
| Relatively short construction period per phase |
| Too much workload burns on the system |
| Facts are not clear enough for decision making |
| Uncertainty about who will run/operate part of the infrastructure |
| Major disruption during construction—affecting the construction time |
| Unexpected natural disasters, such as eruption, global warming, and climate |
| Complexities due to neighboring large project 1 |
| Complexities due to neighboring large project 2 |
| Not clear what is included in the project—not clear project definition |
| Ambiguity in toll discussion and policymaking |
| Responsibilities are not clearly defined |
| The municipalities pushing towards a larger scope—shifting the scope to manifesto |
| Timelines for different part of the project are not clear |
| Changes in direction at the operator |
| Different rhythm between organizations |
| Lack of commitment to the project PMO |
| Change of board members at the sponsor |
| Public vs. private cost |
| Mistakes in risk assessment |
| Pressure from construction development companies |
| Ambiguity in fleet type decision |
| Ambiguity in the ownership of the infrastructure |
| Human resource changes |
| An increase in inhabitants that is more than what was expected |
| Complex to integrate many modes of transport |
| The nature of the project and its linked to current situation and project in manifesto |
| Technical specification of solution unclear |
| Lack of interest |
| A financial crisis which results in higher costs of project components |
| Increased need to participate in dialog, public, media, and social |
| Expectation management |
| New transport/mobility solutions |
| Complex to phase the implementation of the route network |
| The size—large compared to Icelandic construction project |
| Things idealized/beautified |
| Unpredictable weather in Iceland |
| Unfavorable development of different fuel options |
| Market fluctuation |
| Population increase |
| Change in location of major workers/offices |
| New CO2 agreements—more reduction in emissions required |
Publisher’s Note: MDPI stays neutral with regard to jurisdictional claims in published maps and institutional affiliations. |
© 2021 by the authors. Licensee MDPI, Basel, Switzerland. This article is an open access article distributed under the terms and conditions of the Creative Commons Attribution (CC BY) license (https://creativecommons.org/licenses/by/4.0/).
Share and Cite
Fridgeirsson, T.V.; Ingason, H.T.; Björnsdottir, S.H.; Gunnarsdottir, A.Y. Can the “VUCA Meter” Augment the Traditional Project Risk Identification Process? A Case Study. Sustainability 2021, 13, 12769. https://doi.org/10.3390/su132212769
Fridgeirsson TV, Ingason HT, Björnsdottir SH, Gunnarsdottir AY. Can the “VUCA Meter” Augment the Traditional Project Risk Identification Process? A Case Study. Sustainability. 2021; 13(22):12769. https://doi.org/10.3390/su132212769
Chicago/Turabian StyleFridgeirsson, Thordur Vikingur, Helgi Thor Ingason, Svana Helen Björnsdottir, and Agnes Yr Gunnarsdottir. 2021. "Can the “VUCA Meter” Augment the Traditional Project Risk Identification Process? A Case Study" Sustainability 13, no. 22: 12769. https://doi.org/10.3390/su132212769
APA StyleFridgeirsson, T. V., Ingason, H. T., Björnsdottir, S. H., & Gunnarsdottir, A. Y. (2021). Can the “VUCA Meter” Augment the Traditional Project Risk Identification Process? A Case Study. Sustainability, 13(22), 12769. https://doi.org/10.3390/su132212769