1. Introduction
Unexpectedly, various concerns regarding economic growth or sustainability have recently been raised over the prolonged economic slump spreading worldwide. Many companies consider technology development a driving force, or sometimes an indispensable requisite, in a firm’s sustainable growth. Hence, they have been making all-out efforts to attract R&D investment. Technologies developed therein serve as a key factor in determining a company’s competitive superiority, contributing to the company’s revenue generation in various ways, including technology purchasing or transactions, spot investment, attracting funds for commercialization, and M&A [
1]. As new business models using technologies held by the companies appear and get advanced, the significance of estimating the economic value of the technology in question is also being highlighted [
2,
3].
Table 1 shows in detail purpose or usages of technology valuation.
To estimate the economic value of a technology, specific and professional estimates must be applied to guarantee the reliability or objectivity of the results, such as the economic life of the technology, the estimation of cash flows of the entity that will carry out the commercialization, and the conversion towards its present value, most of which are produced through direct estimates by experts or indirect reference information-based ones estimates. Since the valuation process involves long-term valuation time and high costs, there often exist a few challenges or limitations for technology holders to use as immediate decision-making criteria for economic activities. In Korea, to overcome the limitations, KIBO’s (Korea Technology Finance Corporation) KPAS I (KIBO Patent Appraisal System I) [
4], KISTI’s (Korea Institute of Science and Technology Information) STAR (Science and Technology Information Analysis for R&D Decision-making)-Value [
5] and KIPA’s (Korean Invention Promotion Association) SMART (System to Measure, Analyze and Rate Patent Technology) [
6] are in operation. However, since many indicators remain to be directly estimated and input by evaluators, and the value of technology is determined through grading rather than calculating a clear value, it is unlikely that the valuation system has been realized as a complete intelligent valuation system reflecting the needs of users. Therefore, we would like to develop and introduce a novel intelligent technology valuation system, referred to as KPAS II (KIBO Patent Appraisal System II) of KIBO, which minimizes the direct intervention of evaluators and enables data-driven direct calculation of the technology value.
The formation of this paper is as follows.
Section 2 analyzes and describes preceding studies about technology valuation and existing intelligent technology valuation systems.
Section 3 introduces the database and system configuration applied in this research.
Section 4 concerns the results of estimating major factors in the technology valuation system and the web-based valuation method applied with this system. Finally,
Section 5 discusses the implications of the proposed KPAS-II, and
Section 6 is closed with the conclusions and limitations of this study.
2. Related Research
2.1. Technology Valuation
Since the 2000s, many-sided active research on technology valuation methodology has been performed, particularly in Korea. In contrast, while the concept of business or project valuation has already been concretized, centering around North America or European countries. In the R&D support and consulting service industry using technology valuation, it is necessary to comprehensively induce the economic value in the intellectual property or technology capital market, which must be approximated to actual transactions from round table technology negotiation by reflecting the market and business environmental situations.
The typical methodologies for evaluating the economic value of technology include the income approach, cost approach, and market approach [
7]. First, the income approach is the evaluation concept that focuses on predicting the economic value of the technology, which is in a high likelihood anticipated to occur in the future. It ultimately provides the present value of gross business revenues calculated by applying the discount rate to annual cash flows that can be generated in the future if the technology is substantiated to a physical product or business model service and then commercialized [
8]. The valuation techniques most frequently used in terms of the income approach are the discounted cash flow (DCF) and income capitalization methods. And Black-Scholes method or option decision tree method using option theories is now and then introduced in a specific valuation environment with probabilistic occurrence considered. However, estimating future cash flows of a technology-applied product or service and technology contribution to them, such as the income approach, could often be, somewhat inaccurate. It is difficult to derive objective and reliable valuation results due to the evaluator’s subjective perspective or opinion.
Market approach refers to one in which technology is valued based on the technology transaction cases already occurred and databased in the relevant industry classification which the subject technology is categorized into [
9]. Cases-based or reference information-based methods such as relief-from-royalty (RFR), industry standards, auction, etc., are well-known in the market approach. It is internationally guided that evaluators would prioritize applying to RFR or technology transactions comparison methods in the market approach if any similar transaction cases exist.
The cost approach refers to the methodology that utilizes the R&D and commercialization preparation cost database from the perspective of the replacement cost for technology development and pilot production to overcome the limitations of the income approach. In other words, the value of a technology is estimated based on the cost of reproducing the technology at present or developing an alternative technology similar to the subject technology [
10]. Historic cost trends, replacement cost, and reproduction cost methods lie in the cost approach. It could be applied when there is no reference information for the market approach or evaluators could not infer the input variables directly for future cash flows calculation.
In Korea, technology transactions data are not publicly announced nor easily accessible, and there exists no evaluation agency which systematically manages or is entirely responsible for them. It is not easy to apply to a market approach-based transactions method except for using royalty databases. Therefore, many technology valuation cases are performed by applying to income approach [
11]. As mentioned before, the income approach is the process of estimating future cash flows which might occur from a technology’s commercialized product. Thus, it is necessary to ensure reliable data or evidence for objective valuation at the evaluator’s best.
The formula for the DCF method that is commonly used in the income approach is as follows:
In Equation (1), the technology value is calculated from the economic life of a technology (n), free cash flows at the t-th year over n, discount rate (r), and technology factor (or technology contribution ratio). The essential of the DCF method is to assume a commercialization entity’s technology, market, business feasibility, etc., calculate future cash flows associated with a lot of financial items and ratios, and refine the intermediate value by reflecting qualitative evaluation factors of the business entity. Then, as much more detailed market and business information are input, the reliability of the model’s valuation results gets much higher.
2.2. Data-Driven Intelligent System for Technology Valuation
Recently, in Korea, many-sided attempts to develop an automated information system for estimating a technology’s economic value have been made based on the volume of technology valuation cases data accumulated over the years, where technology evaluation agencies such as KIBO, KISTI, and KIPA form principal axis. In the case of KIBO, a patent grade evaluation model developed by expanding and advancing KTRS (KIBO Technology Rating System) based on experts’ qualitative evaluation, referred as to KPAS I [
4], has been proposed to promote IP guarantee strategy at low evaluation cost. KPAS I is the fast patent ranking model. The relative excellence to the entire patent sets is graded by utilizing artificial intelligence (AI) learning over accumulated domestic applications and registered patents data. It is judged as the model in which an objective technology value from data-driven relative excellence can be expeditiously estimated compared to other methodologies. However, the model of KPAS I does not allow direct application to guarantee business, and it is only regarded as an auxiliary means which leads to identifying the relative grade or rank of technology due to limitations in providing quantitative information regarding the economic value of a technology, and in considering the commercialization entity’s qualitative business ability. An example of the grade evaluation result of KPAS I is shown in
Figure 1.
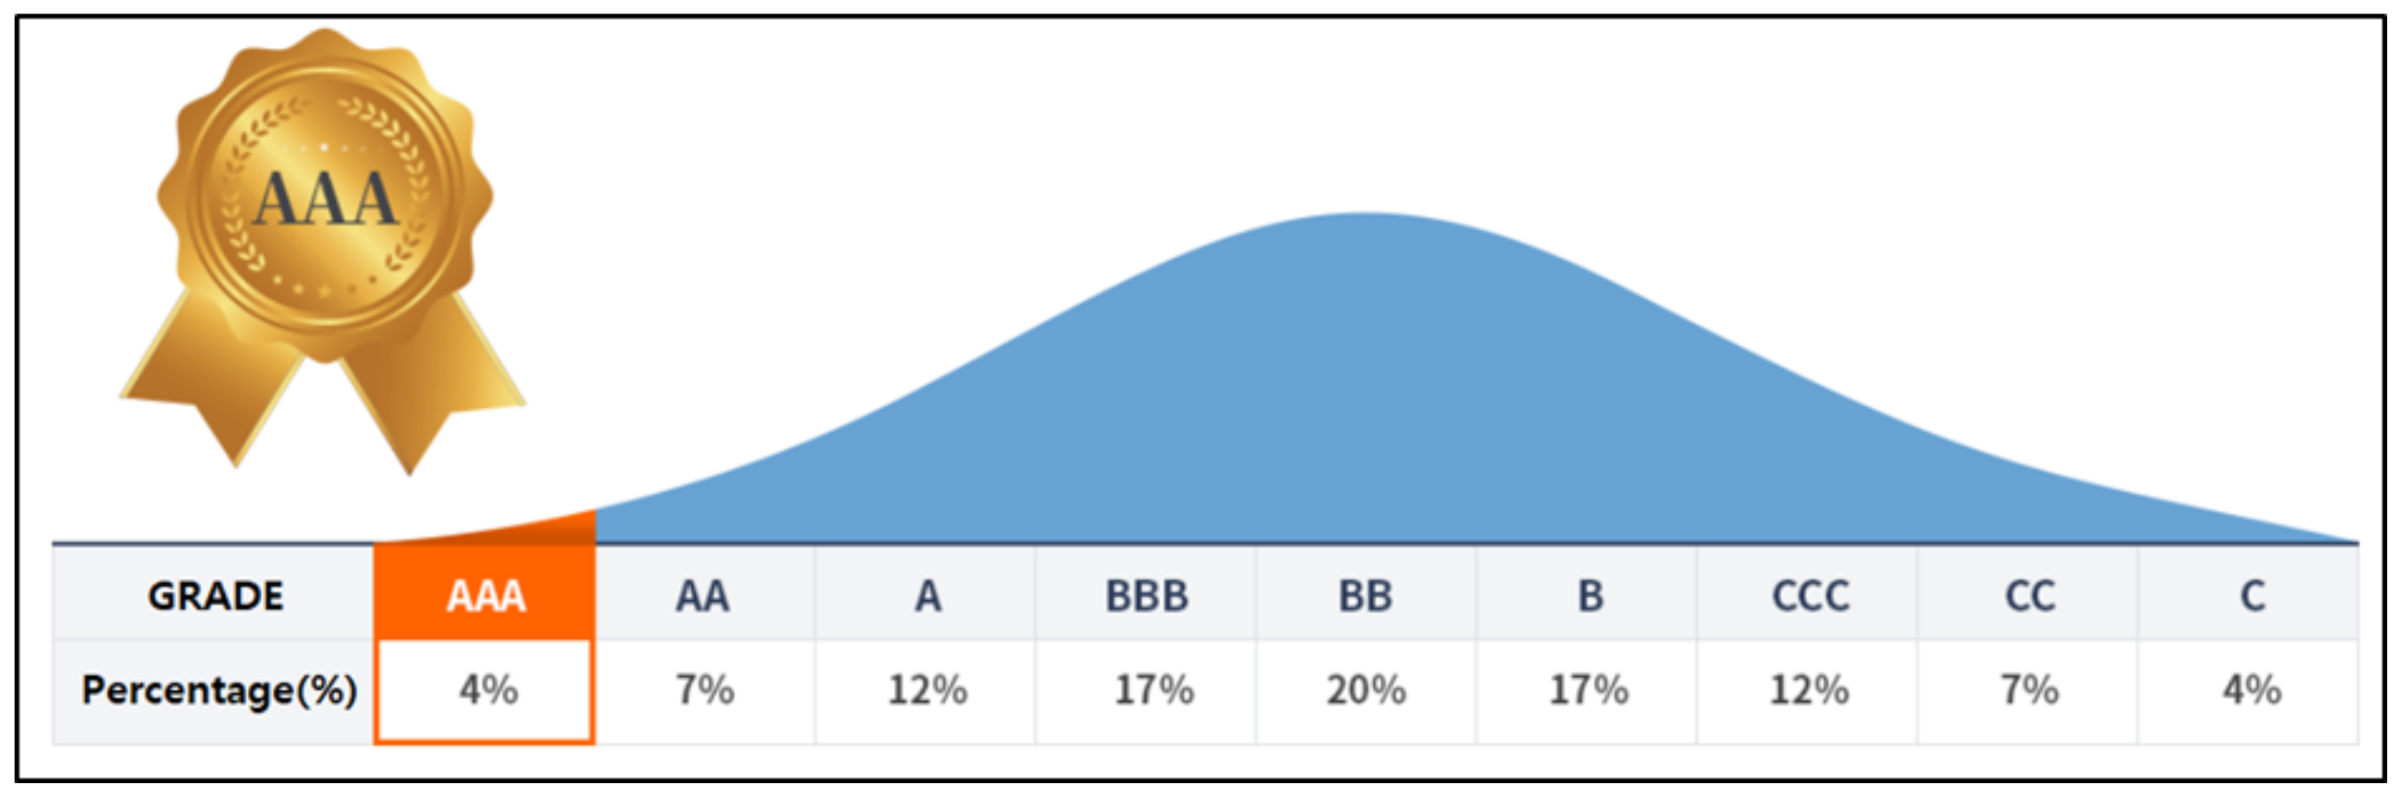
KIPA’s SMART 3 system [
6] quantifies patent indicators representing rights, technicality, and usability. It classifies them into patents’ ranks from AAA to C corresponding to their relative excellences after assessing them by the afore-mentioned criteria indicators. Although the model of SMART 3 has more or fewer similarities with KIBO’s KPAS I model, there exist distinct differences in composition techniques, including the use of keywords extracted through text mining-based computational or linguistic analysis in addition to numerical information of patents [
12]. SMART 3 also utilizes structural equations rather than artificial intelligence learning in intra structure of evaluation models. The detailed structure of SMART3 is shown in
Table 2.
It primarily depends on a score-sensitive grade of technology assessment, such as applying text data from patents to determine the relative rank of technology according to the aggregate sum of feature scores. Still, there exists the limitation that the utilization of the analysis results is somewhat limited without providing the quantitative estimates for the economic value of a technology.
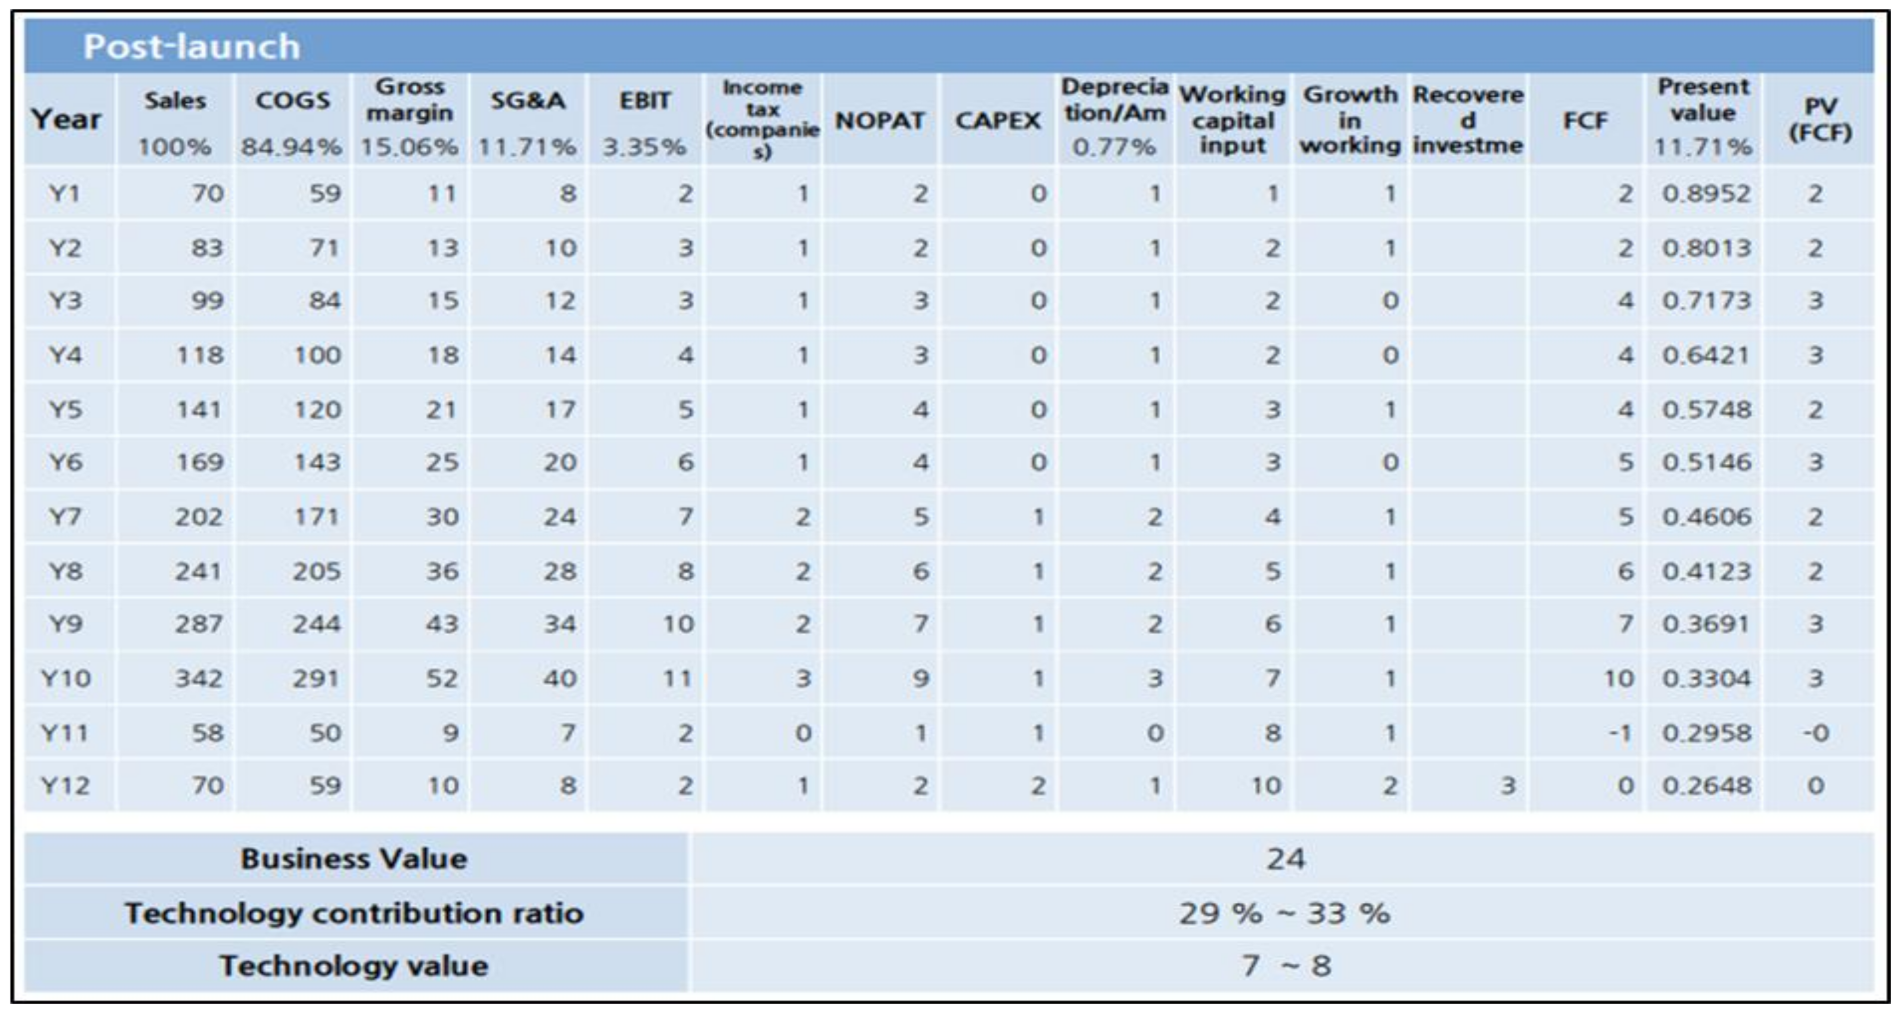
KISTI’s STAR-Value system [
5] is one that automatically calculates the quantitative value of a technology based on patent information and financial data, which is most similar to KPAS II’s internal operation principles proposed in this study. STAR-Value system extracts a data-driven query from well-structured data such as patents, financial items, etc. The intelligent technology valuation model brings its associated databases (DBs) established in the form of patent-based or company-based financial formulas in advance. In addition to the fundamental income approach-based DCF method, STAR-value system introduces various evaluation techniques such as relief from royalty (RFR), transactions comparison method, value-by-a-profit-split (VPS) method in market approach and market replacement cost method, SW development pricing decision method, etc., in the cost approach. The intelligent STAR-Value aims to secure the accuracy of the estimation by subdividing the estimation procedure into a series of sequential, associated steps, and for this reason, it is evaluated as one of the most practical and commonly used models among available web-based technology valuation systems in Korea [
13]. The DCF method’s internal evaluation logic in the STAR-Value system inquires the evaluator’s direct input or the relevant information through the pre-built DB. It calculates the value of a technology based on the patent information of the subject technology and financial information of the company, i.e., the commercialization entity. The economic life of technology can be directly input according to the experts’ group agreement or, in many cases, determined by adjusting the quantitative value of feasible revenue term estimates by the TCT (Technology Cycle Time) database [
14]. Then, annual sales predictions over the entire economic life of technology for calculating the free cash flow are performed by considering the estimates of market size and market share of the commercialization entity in Korean Standard Industry Classification (KSIC) regarding the technology-applied products. In case that it is difficult to obtain highly accurate information about the company’s financial items and business achievements in the past or the business strategies for commercialization, any of the descriptive statistics such as the average financial ratio of a similar business entity composed of one or more firms, sometimes that of the representative industry classification is utilized as a proxy value, and the estimation for annual free cash flows over the entire economic life of technology is also applied similarly. The evaluator directly estimates the discount rate and technology contribution ratio, or the standard values corresponding to the same industry classification in the pre-built DB are applied. An example of STAR-Value’s technology valuation is shown in
Figure 2.
The STAR-Value system has emphasized its advantages in overcoming the limitations of high cost and long-term requirements of typical technology valuation methods. It holds the characteristics of efficiently delivering the reasonable market value of technology and potentially maximizing the economic effects of R&D [
15]. However, we observe the constraints of the STAR-Value system as follows. First, many items or influence factors still exist that a professional evaluator should directly estimate, although we can utilize the automated input from the pre-built databases (DBs). For example, the technology commercialization risk premium factor applied to the discount rate calculation is not easy for non-experts to determine because even the evaluation professionals often experience difficulty catching comprehensive aspects of the technological features, rights, marketability, and business ability for the valuation of technology. Second, there is a tendency to be less realistic about estimates for each factor. Among them, in the case of sales estimation, despite the main factors that have a great influence on the estimation of the value of technology, it is estimated that all companies will increase their sales across the economic life of technology at the same rate based on CAGR (Compounded Annual Grow Rate) by industry. Very few companies would represent the above revenue stream, and this estimation could be seen as a significant factor that could undermine the reliability of the evaluation.
Unlike other countries that utilize valuation systems using software developed and sold by consulting firms, Korea has developed a valuation system by national institutions to encourage companies to develop technology-based commercialization strategies and revitalize the technology market at a relatively low cost. While this national orientation may promote technology-based industrial growth, the reality is that many of the limitations inherent in current valuation systems, as mentioned, are weakening their effectiveness.
The intelligent technology valuation system, KPAS II presented in this study focuses on solving the limitations of previous systems. First, proposed KPAS II system provides quantitative value of technology as an amount. It will be able to resolve the limitations of its usability in the technology financial market, which was implied by rating systems such as KPAS I and SMART 3. Second, the limitations on the reliability of the estimation methods and minimization direct expert estimation contain in STAR-Value would be resolved using data-driven approach based on deep learning algorithm. In addition, by applying an optimal automatic estimation model for each evaluation sequence of the DCF method, it was intended to derive a model that matched the purpose of the intelligent technology valuation system by making it easier for ordinary people to calculate the exact value of the technology.
3. Structure of Proposed System
3.1. Database
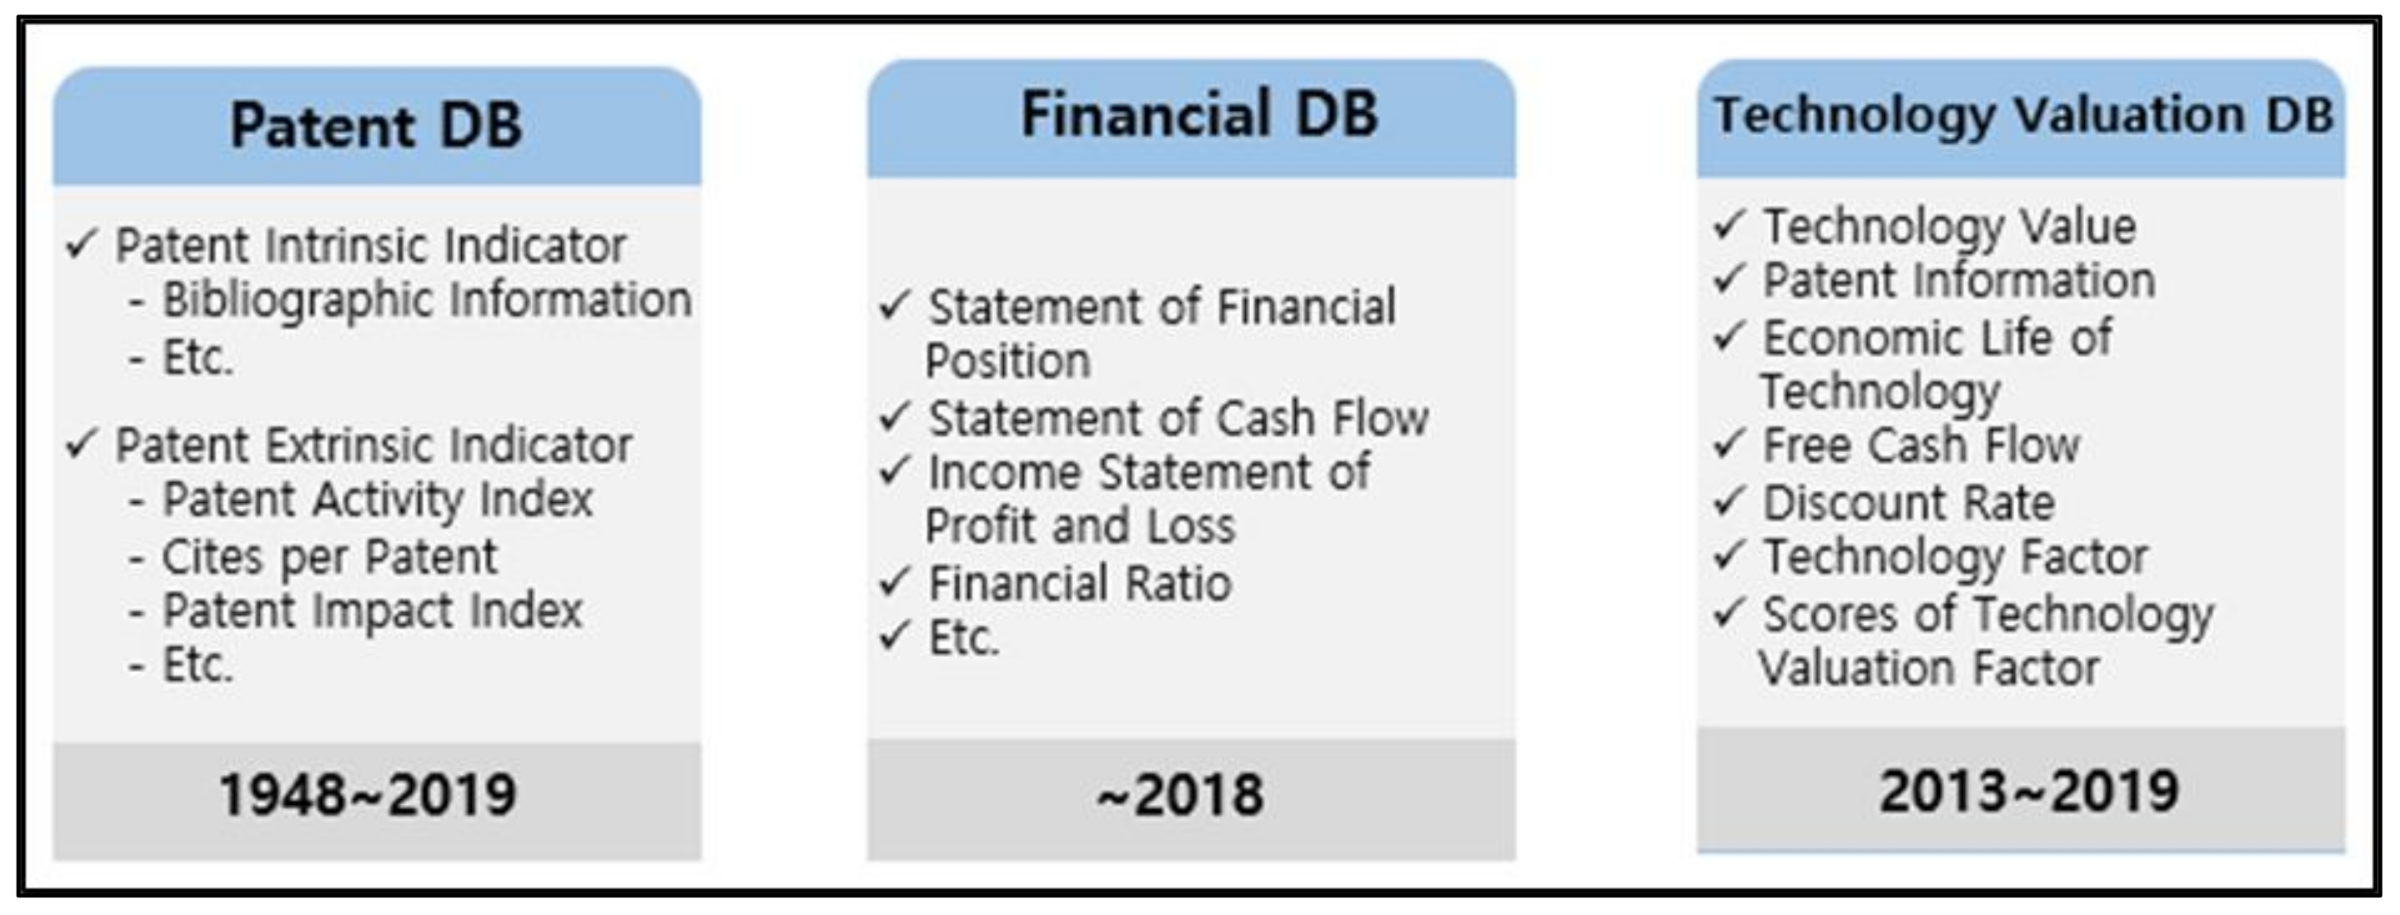
The KPAS II system that we propose in this study utilizes the fundamental items of patent and company financial data. The automatic calculation of key valuation factors is performed in association with the pre-built DBs shown in
Figure 3. They generally consist of patent DB, financial DB, and technology valuation DB.
First, patent DB retrieves bulk data updated and linked in real-time by KIPRIS (Korea Intellectual Property Rights Information Service) [
16]. The DB is composed of the information of about 4 million Korean patents applied or registered since 1948. It involves the intrinsic information of patents, including patent bibliographic information and patent specifications, abstract, registration and administrative information, etc. In addition, the extrinsic indicators [
17,
18] that can reflect the characteristics of both technology environment and ecosystem which a patent belongs to, where it is difficult to quantify the extrinsic influence factors in terms of intrinsic indicators, has been appended to enable diverse interpretations of patents subject to evaluation. Each data is pre-built in the itemized table by customizing the source databases (DBs). Information about the patents to be assessed is extracted from the external DB server in real-time and applied to the selected valuation models.
Second, financial DB utilizes about 330,000 firms received from KED (Korea Enterprise Data). As of 2019, the financial DB established by KIBO has been organized to enable real-time access to financial information on an annual basis, such as the current status of individual companies, statements of financial position, cash flow statements, income statements, and financial ratios.
Third, technology valuation DB consists of about 5000 valuation report cases that KIBO experts have performed until 2019. In the KPAS II system proposed herein, deep learning-based estimation is applied to automatically input the scores of technology valuation factors, which will be described later in
Section 3.2.6. Based on the technology valuation factors evaluated directly by experts, the deep learning model in neural network topology estimates the scores necessary for each qualitative factor. Technology valuation DB is used in the learning and validation process of deep learning models, a novel application of the most popular, cutting-edge AI technology.
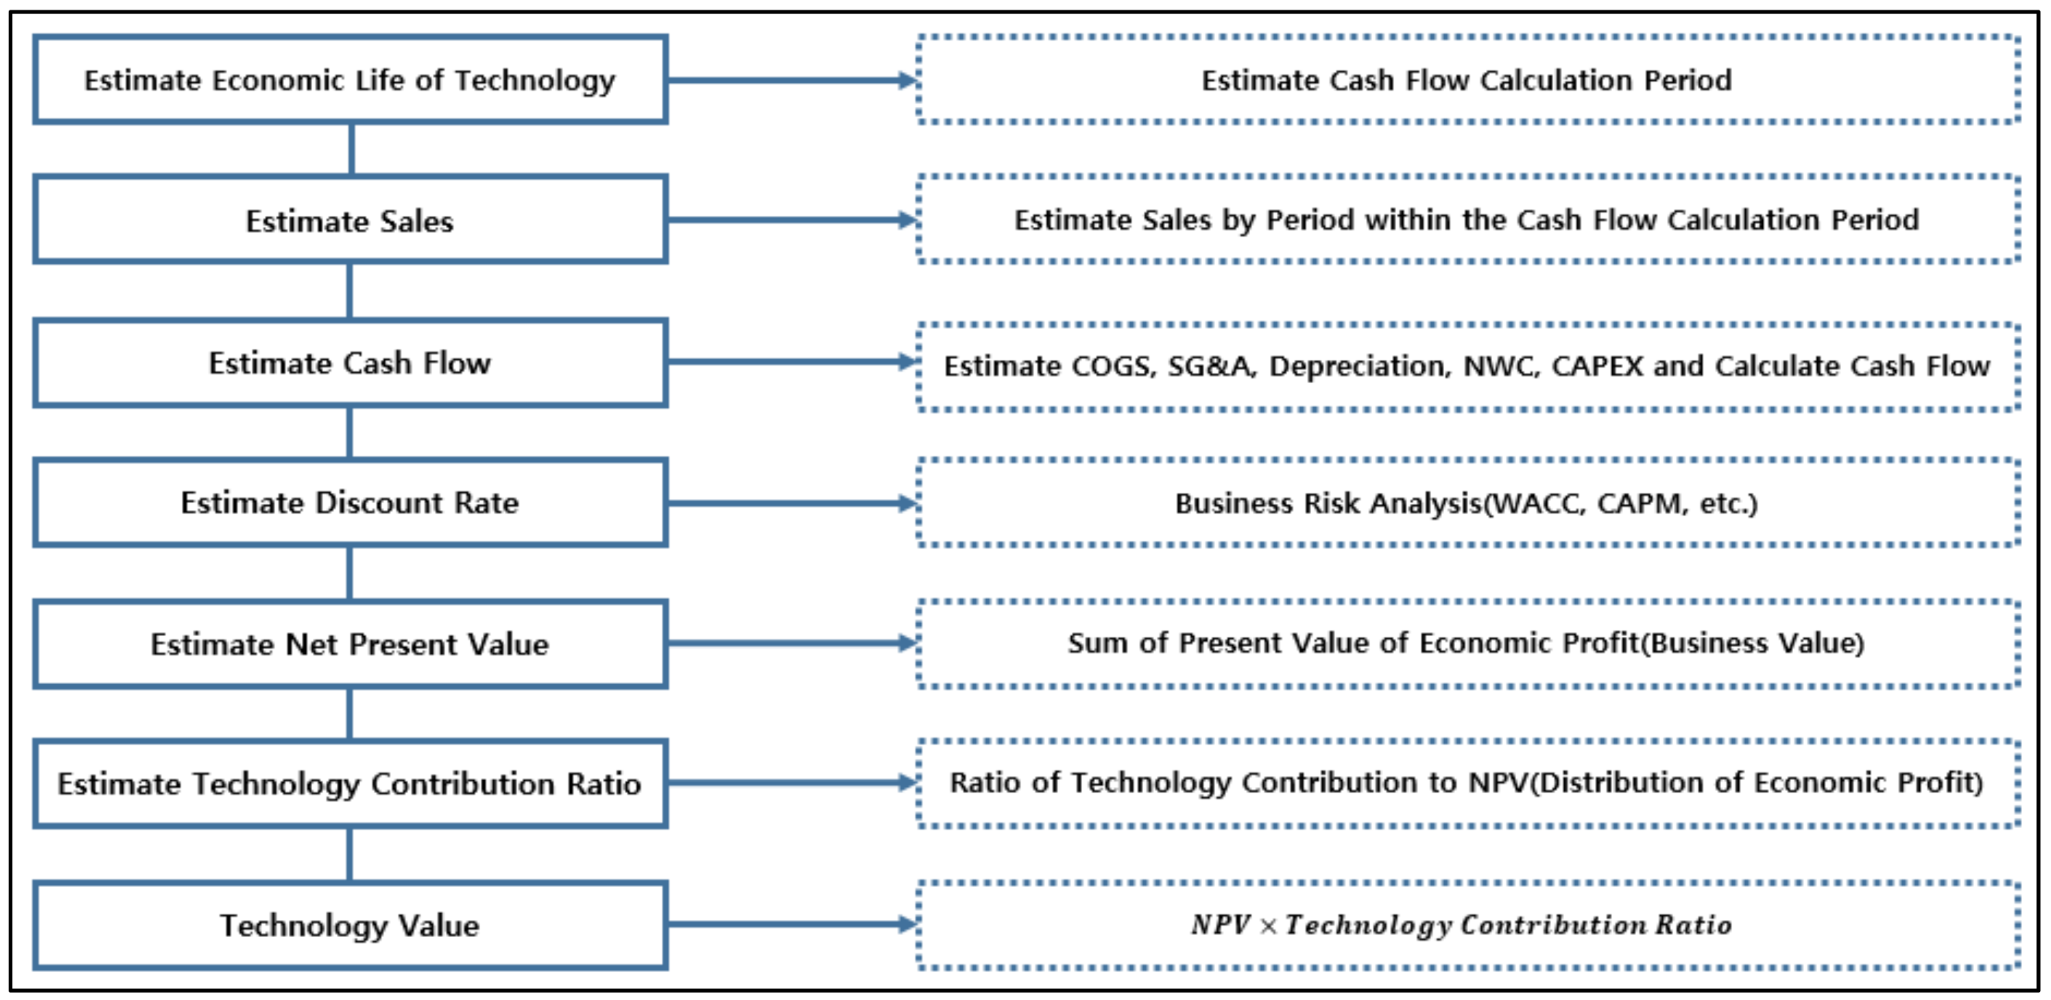
3.2. DCF Method and Principal Variables for Technology Valuation
As mentioned before, the proposed KPAS II system performs the web-based valuation to estimate the value of technology by selecting the DCF method, which might most effectively reflect the aspects of financial and business feasibility, in addition to possible revenue structure expected in the future. This section describes the detailed, itemized estimation steps of the DCF method mounted on KPAS II. In detailed steps of DCF method in KPAS II is shown in
Figure 4.
3.2.1. Economic Life of Technology
Estimating the economic life of technology is essential in the technology valuation of DCF and RFR methods. It is determined according to how long the technology-applied product or service will bring economic profit. It refers to a year-based period when negative influence factors on commercialization using a specific technology asset arise and the technology asset loses its competitive advantage in the market. Then, the period during which a technology-based business maintains competitive advantage can be defined as the economic life of technology. We classify the concept of the economic life of technology with the legal protections period, the durable life of a product and the residual period of a patent, and we need to consider all environmental factors associated with a technology’s utilization for estimating the economic life of technology.
In general, the income approach estimates the economic life of technology based on the TCT (Technology Cycle Time) statistics that exhibit the rate of change in a specific technology-classified group to which the patent belongs by utilizing the citation frequency of individual patents within the same patent classification group. TCT DB includes the statistics information of the citation period between forward and backward citations of patents by IPC (International Patent Classification). It becomes an indirect index that reflects the rate of change in the technology group to which the patent belongs to [
19]. The formula of TCT is as follows:
A TCT calculated as Equation (2) can produce statistical data such as mean, Q1, Q2, and Q3 per IPC subclass. Considering that it is common for TCT to show asymmetric distribution with positive skewness, Q2 (median) is used as a sign value for TCT [
20].
The TCT extracted above provides approximate estimates regarding the technology life of each IPC subclass. In practice, individual patents may have the ultimate economic life that is adjusted from these TCTs. For example, the economic life may fluctuate depending on the industry conditions, economic situation, and the possibility of emerging competitive technologies. That is, there may be many extrinsic characteristics that are difficult to calculate with other general statistics. To compensate for the limitation of the direct utilization of TCT, valuation experts in Korea directly and qualitatively evaluate extrinsic factors that may affect the economic life of the subject technology and integrate them with the TCT for the adjusted economic life of technology [
21,
22,
23]. The qualitative scores in which the evaluator directly judges individual life characteristics of the patent is referred to as technology life factor, and detailed evaluation factors are shown in
Table 3 [
23]. Suppose the estimated economic life of technology is extracted shorter than the legal protection residual period of the patent right. In that case, the former one is, in often cases, applied as the ultimate economic life of technology.
The formula of the economic life of technology, which comprehensively reflects both the TCT and scored sum of technology life factors (TLF) is as follows [
22,
23]:
The KPAS II system proposed in this study applies the results of the intelligent qualitative factor estimation modules described in
Section 3.2.6 to Equation (3), which enables automatic scorings for the economic life of technology without the intervention of the evaluator’s subjective input.
3.2.2. Sales Estimation
In technology valuation, estimating feasible sales revenue with high accuracy is one of the most important evaluation factors. The estimated size of future sales expected is a dominant factor in determining the approximate economic value of the technology [
24]. Hence, the estimation for sales should be applied to comprehensively reviewing the understanding of the technology and various situations surrounding it, industry trends, and market size based on objective data. One of the traditional methods used to estimate sales in income approach is the market share method that takes into account the sales capabilities potential of the business entity in the market, and the other is the demand estimation methods that apply past sales records to the expected sales patterns of the company or similar companies [
22,
23].
In the case of the market share method, it is necessary to subdivide or specify the market for the technology-applied product, and evaluators can calculate the estimates by multiplying the expected share to the target market size if objective data such as market report, past sales record or growth rate information, etc., can be accessed or attainable. However, there exist difficulties in estimating the actual market size for the product when it is not activated yet or when the technology-applied product is ambiguous in technology’s stake in the commercialized product [
25].
The demand estimation method can be divided into qualitative and quantitative techniques. The qualitative estimation depends on the evaluator’s subjective judgement. It is mainly applied when it is impossible to secure the associated demand information, i.e., the market release situation of new products that do not exist in the existing market. On the other hand, quantitative estimation can provide a relatively clear basis for sales estimation, by applying quantitative sales records in the past from business entities or similar companies to the estimation model. Since the KPAS II system introduced herein focuses on minimizing the input items that valuators should evaluate for the subject technology and on designing a reliable data-driven intelligent valuation system, where sales growth rates in the past for the business entity or similar companies are applied to sales estimation in consecutive years [
26].
The formula of sales over the economic life of technology is as follows:
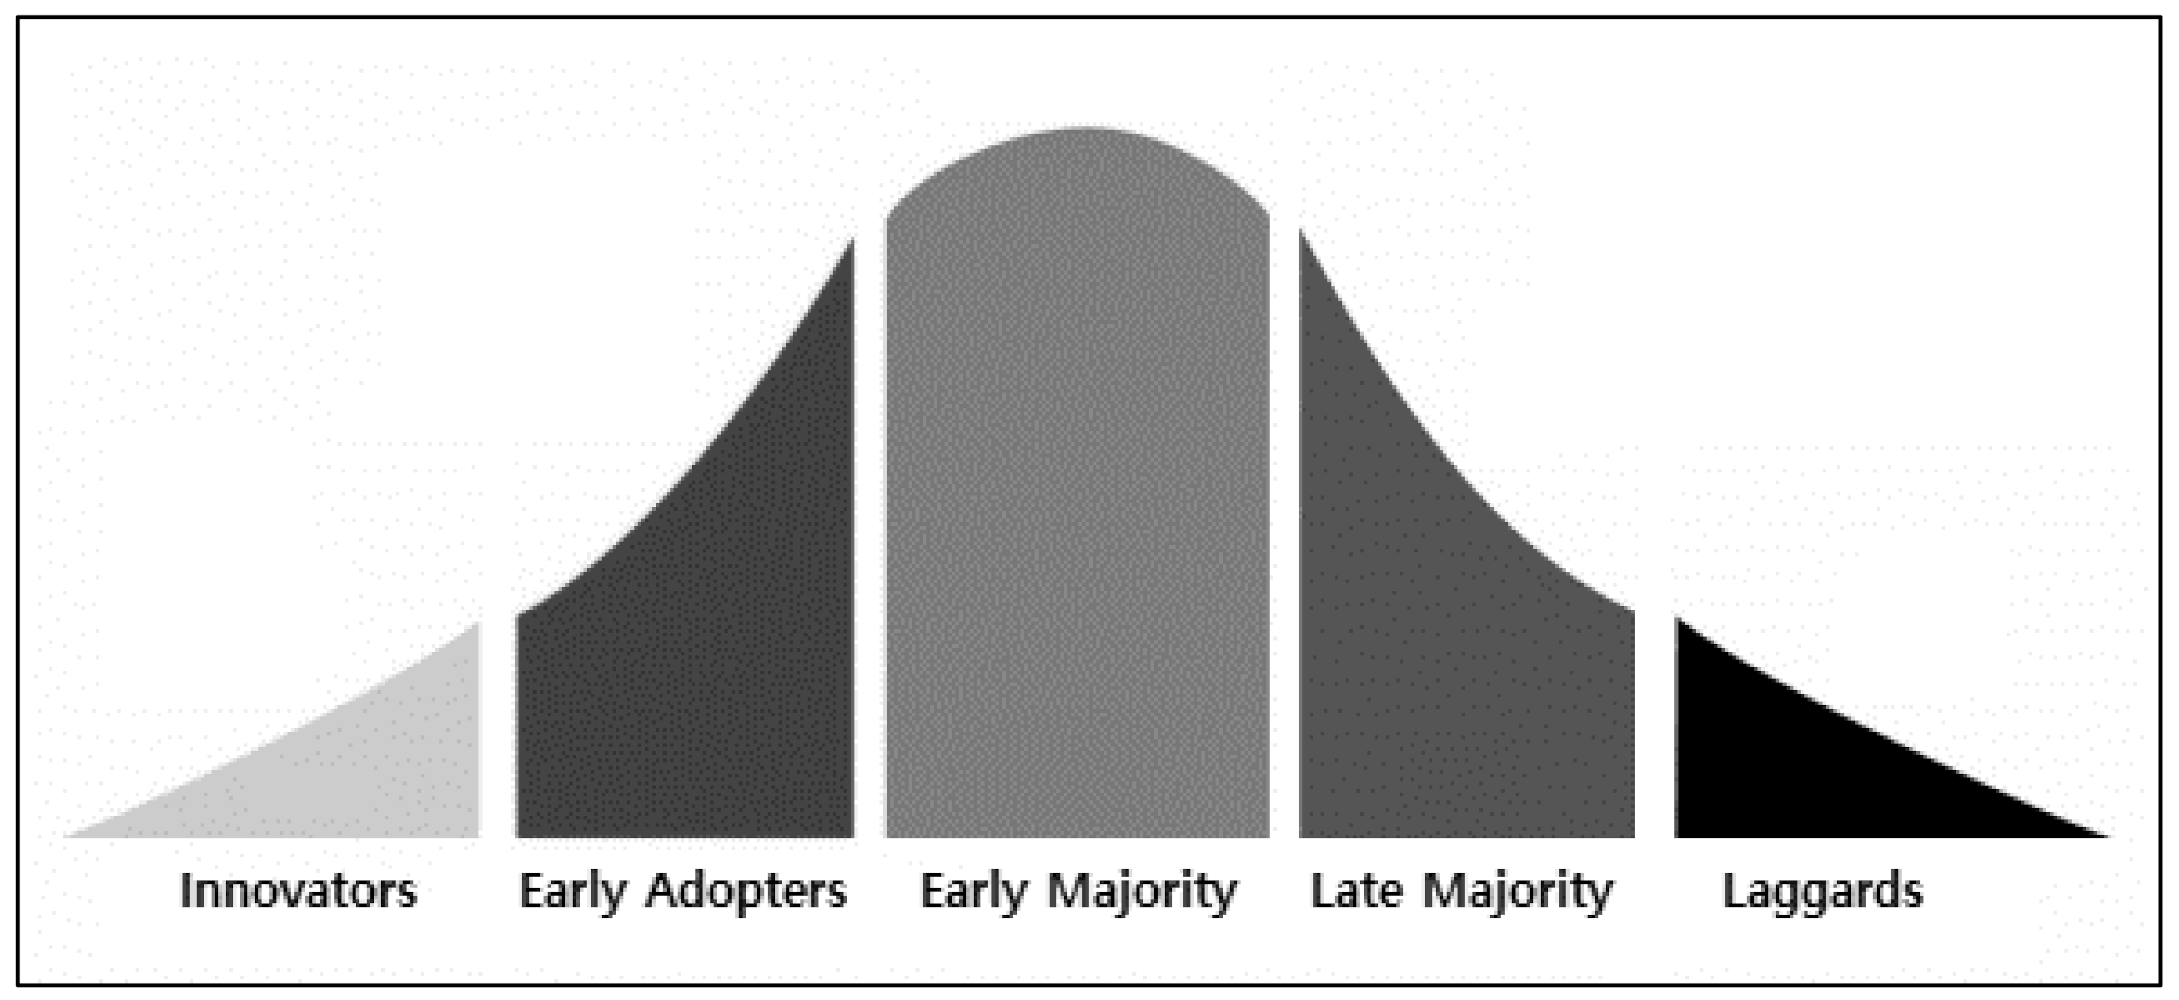
First, Equation (4), which is applied to the sales estimation for embedding to the KPAS II system, is divided into two distinct sales increases and falling segment intervals. From the preceding studies, we explored that applying the inclined S-curve type of technology adoption life cycle (TALC) [
27,
28,
29] to the proposed model well explains 5-staged adoption rates of technology in
Figure 5. The expected adoption rate is likely to follow the timing or adoption rate in which the consumer accepts a technology or product.
In Equation (4), the percentage of sales growth (PSG) is generally calculated by 2-digits KSIC (Korea Standard Industry Classification) after comprehensively analyzing the free cash flow data of technology valuation DB.
Next, the data from the PSG in Equation (5) are applied to the compound annual growth rate (CAGR) for the last five years in sales increase segments by industry of the pre-built financial DB. Depending on whether to select 3 to 5 similar companies in the same industry or whether to include large, small-and-medium firms or startups for the candidates of similar company, the size or type of the firm can be an influencing factor for the sales growth rate [
30,
31], and we make them as a control variable. Based on it, sales growth rates for each size of the firm have been calculated for each industry.
Finally, to sophisticatedly estimate the sales over the economic life of technology, we can reflect the investment plans at the early stages of technology commercialization. Hence, the sales estimates of the early three years corresponding to the innovator phase of the technology adoption life cycle (TALC) must be directly input by evaluators in the KPAS II system while taking into account the step-by-step characteristics of the technology commercialization.
3.2.3. Free Cash Flows
The DCF method in the income approach refers to the present value of the technology being evaluated by adjusting the economic cash flows generated in the future at an appropriate discount rate. Cash flows refer to net values after subtracting total cash outflows from total cash inflows, in other words, the available cash amount that the company is free to use while maintaining or expanding its business. The factors to consider for calculating annual free cash flows consists of NOPAT (Net Operating Profit After Tax), depreciation, CAPEX (Capital Expenditure), and NWC (Net Working Capital) [
32,
33,
34]. The formula of free cash flow is as follows:
Equation (6), which is the commonly-known formula for FCF calculations, has obvious limitations in utilizing itemized estimates unless a business entity or company concretely specifies detailed investment plans over the entire economic life of technology. In addition, to establish an intelligent web-based valuation system that minimizes the valuation expert’s direct estimation, it is not useful to leave the determination of the detailed items above to the evaluator. Hence, we intend to focus on the evaluator’s usability and convenience for automatic estimation of FCF detailed items by referring to the financial ratio table of the financial DB that was already pre-built. The data in financial ratio table was calculated based on 2-digits KSIC. The characteristics of the industry into which the technology is categorized are properly considered in the FCF estimations.
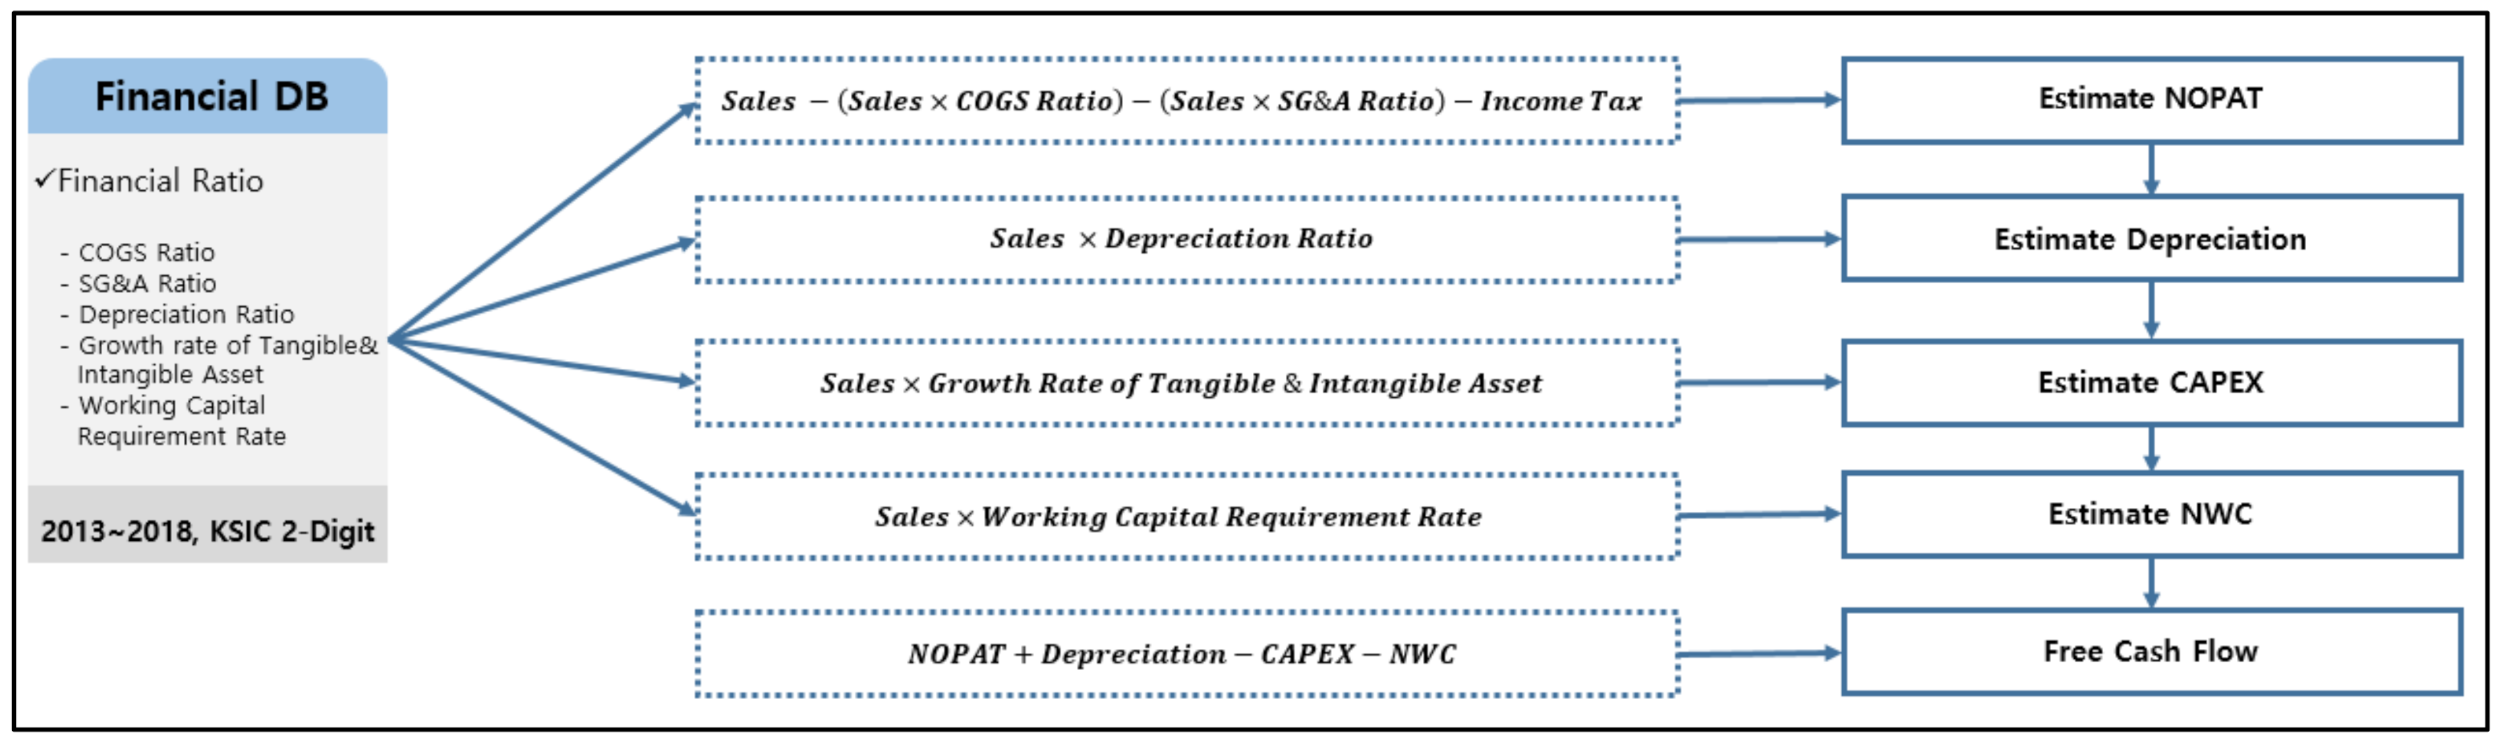
When tax law in Korea is applied, we consider the following sequential steps for calculating the FCF in
Figure 6. First, NOPAT is calculated by annual sales estimates, which are in turn subtracted by COGS (Cost of Goods Sold), SG&A (Selling, General & Administrative expense), and corporate tax (residence tax included). COGS is calculated by extracting the COGS ratio compared to sales by industry from the financial ratio table and multiplying it by sales. SG&A is also calculated by extracting the SG&A ratio compared to sales by industry from the financial table and multiplying it by sales. Corporate tax is determined by referring to the comprehensive corporate tax rate revised and announced in 2019 in Korea, and it accompanies residence tax in 10% of corporate tax. Second, depreciation is calculated by multiplying annual sales estimates by the depreciation ratio compared to the financial ratio table sales. Third, CAPEX is calculated by adding the net increments in both tangible and intangible assets between the previous and current year from the financial ratio table by the depreciation at the current year, which can be derived in the preceding step for depreciation. From the financial ratio table multiplying annual sales estimates by extracting the growth rate of the aggregate sum of both tangible and intangible assets compared to sales by industry from the financial ratio table. Fourth, NWC is calculated by multiplying the net increments in sales by the working capital requirement rate over the entire economic life of technology.
Finally, the FCF is calculated by compensating the residual value in terms of CAPEX and NWC, which means the aggregate sum of both the undepreciated balance for CAPEX and the unrecovered balance in working capital in the last year of the commercialization when the economic life of technology is terminated [
22,
23].
In
Figure 6, KPAS II enables reliable automatic estimation over the entire economic life of technology without the intervention of evaluators through data-driven item calculations using financial data by industry based on 2-digits KSIC.
3.2.4. Discount Rate
The discount rate in technology valuation refers to the conversion rate to calculate the feasible annual free cash flows in the future for the present value of the patent undervaluation, by considering the risk-adjusted discount rate that poses the various types of risk inherent in the process of technology commercialization. However, the limitation exists to quantitatively calculate the technology risk, market risk, and business risk that the patent encounters in the commercialization process. In general, the risk-adjusted discount rate is calculated by applying an additional risk premium to the standardized WACC (Weighted Average of Cost of Capital) [
35,
36,
37]. The formula for WACC is as follows:
The risk-adjusted discount rate calculated based on Equation (7) reflects all possible kinds of risk that may occur during the whole procedure for technology commercialization. The risks mentioned above are sub-divided into size risks arising from the firm’s size, extrinsic risks arising in market conditions, and comprehensive risks in technology commercialization. First, since the cost of equity capital is limited to objective estimation, it introduces the typically known financial theory of capital asset pricing model (CAPM). It applies the values obtained from the observed information in the capital market as a proxy. Considering the risk inherent in the size of the firm, additional consideration is taken into the firm size risk premium for an unlisted company in the relatively small scale of assets or sales records. The formula for the cost of equity capital is as follows:
The formula for CAPM in Equation (8) is as follows:
The technology commercialization risk premium (
Rc) applied to Equation (8) is the item that valuation experts directly evaluate the risks in the technology, market, and business environments. For the evaluation factors shown in
Table 4, the evaluator quantitatively calculates the technology commercialization risk premium factors for a total of 10 items. It is then represented in the natural log, as in Equation (10) and converted into the risk premium to calculate the technology commercialization risk premium [
22,
23].
The cost of debt capital can be regarded as the interest rate of return required by investors for debt capital and calculated by specific industries by aggregating interest paid, discount fees, and corporate bond interest in the income statement in the pre-built financial DB. In this case, considering the firm size risk, particularly for unlisted SMEs, additional risk spreads are appended. The formula for the cost of debt capital is as follows:
Lastly, for the equity capital composition ratio and debt capital composition ratio, the arithmetic mean of the interest-paying financial debt ratio by industry (2-digits KSIC) is therein applied.
The risk-adjusted discount rate calculated by the sequential steps above has the advantage of reflecting the risks that may occur during technology commercialization in various aspects. The proposed KPAS II system aims to apply intelligent automation, which involves the technology factor estimation modules described in
Section 3.2.6 later on with the formula and the pre-built databases (DBs).
3.2.5. Technology Contribution Ratio
In the technology valuation, technology contribution ratio refers to the relative proportion that the patent or technology in intangible asset contributed to triggering the net present value from free cash flows in the future when the R&D accomplishment has been commercialized. It is reasonable that calculating low economic value of technology if the contribution of technology is small, no matter how excellent the entity generates profits in the process of commercialization. Therefore, the estimation of clear technology contribution ratio in technology valuation is considered a key factor in enhancing evaluation reliability in that it directly affects the calculation of net present value. In general, in practical fields of technology valuation, valuation experts can directly calculate the contribution ratio of the relevant patents if there exists an explainable objective basis for it. In other cases, the industry factor is often applied according to the pre-built database by the 2-digits KSIC. The formula for industry factor is as follows:
The industry factor calculated as in Equation (12) refers to the maximal ratio of the contribution of a company’s intangible assets to a company’s economic value by 2-digits KSIC. However, depending on the characteristics of the patent, the contribution ratio of a technology may not reflect the characteristics of the industry. Therefore, to consider the individual characteristics of the patent in the technology contribution ratio, the evaluators directly conduct the qualitative evaluation of the technology and business feasibility regarding the subject patent and then quantify it for calculating industry factor. The qualitative scores in which the evaluator directly judges the individual characteristics of the patent is referred to as technology rating factor, and detailed evaluation factors are shown in
Table 5 [
23].
The formula for the technology contribution ratio after applying both industry and technology rating factor is as follows:
The KPAS II system includes the calculation module for technology contribution ratio by utilizing the updated industry factor by 2-digits KSIC and by applying the web-based module of technology factor estimation described in
Section 3.2.6, and we present a reliable method for technology contribution calculation in Equation (13), involving both the pre-built DB and the evaluator’s qualitative judgement.
3.2.6. DNN-Based Scoring Module for Technology Valuation Factors
The principal technology valuation factors (i.e., technology life factor, technology commercialization risk premium factor, technology rating factor) for technology valuation of KPAS II described above can comprehensively reflect explicit conditions such as the current situation of the industry to which the technology is applied to. Still, there is a disadvantage in that it reflects the hassle that evaluation experts have to make direct estimates and the subjectivity of individuals by the evaluator. It can act as a limitation in estimating the objective value. In particular, the intelligent qualitative assessment module for determining the three factors has the limitation that it is much more useful for only valuation experts who can conduct direct estimation results in high accuracy and high reliability. In addition, ordinary evaluators or non-experts who are not adept at technology valuation might not properly produce the truth-worthy judgement for qualitative factors, dropping the utilization of the existing KPAS II that was originally established to active technology finance.
In order to cope with the limitations of the existing qualitative assessment system, this study proposes to automatically extract the scores of technology valuation factors from the completed technology valuation cases in technology valuation DB collected by KIBO, and to intelligently input these factors by running deep learning algorithms. Thanks to the rapid advancement in computing power and simplicity of securing big data, the spread of machine learning and deep learning, which are widely applied regardless of any specific industry, has been improving the efficiency of productivity in a way that machine learn diversified tasks performed by humans so far while partitioning the human and machine’s role respectively [
38,
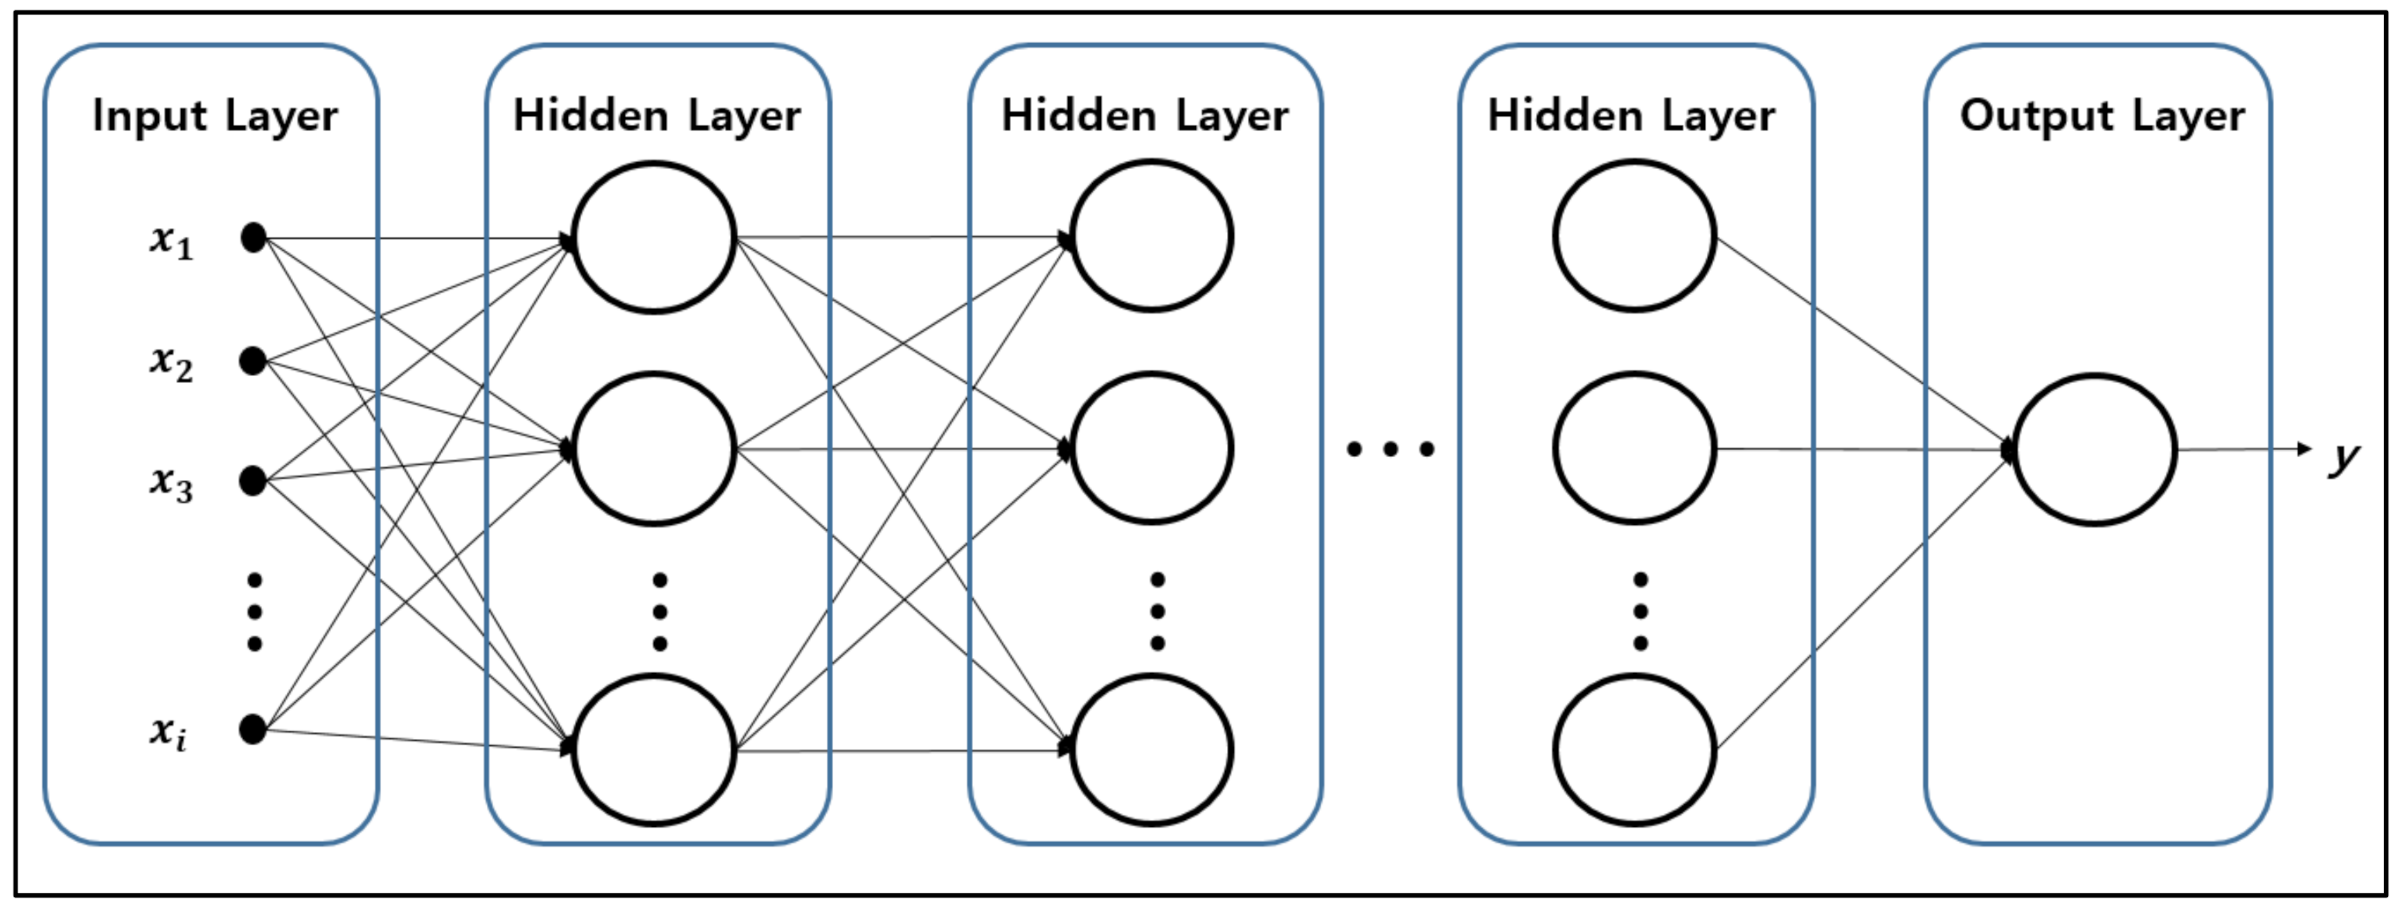
39]. In artificial intelligence and its application, many new algorithms suitable for extensive types of data or goals of learning (i.e., classification or prediction) are being developed and released to keep pace with these industrial needs. The module proposed in this section aims to intelligently predict the scores of technology valuation factors by learning the structured, labeled data in the pre-built technology valuation DB. It is necessary to find an optimized model in hyper-parameters that most resembles and learns the evaluator’s evaluation patterns. In reality, evaluators may input scores considering various circumstances and entity abilities that may occur in the commercialization of technology. Thus we intend to predict the scores of technology valuation factors by one of the widely-known AI techniques, DNN (Deep Neural Networks), which can learn nonlinear patterns similar to those of real-world problems. DNN is constructed by calculating the weights between nodes in several hidden layers. The input variable xi applied to the input layer is linked to the intermediate output variable in the next level of the hidden layer with the specific weight. The DNN model updates the inside of the consecutive weighted matrix in how the prediction performance becomes improved with hyper-parameter tunings as the learning gets processed. Unlike typical linear regression, nodes of each hidden layer interact in a complex form and update weights intelligently, enabling sophisticated estimations for the prediction target. The internal structure of DNN is shown in
Figure 7.
In this section, the prediction module with the characteristics of DNN is proposed to get to advanced a novel ensemble algorithm in hybrid type to build a more stable learning model considering the characteristics of the financial industry in which the system is utilized. An ensemble model is a form that has been applied to many machine learning achievements to enhance the performance and stability in the fields of artificial intelligence for decades [
40,
41,
42]. It adopts the method of predicting the target and making the final decision by the aggregated result of multiple models. The rake decision is made either by majority rule or averaging technique. The predicted value, which is concluded by integrating each result of multiple models, is differently calculated depending on the type of the learning target.
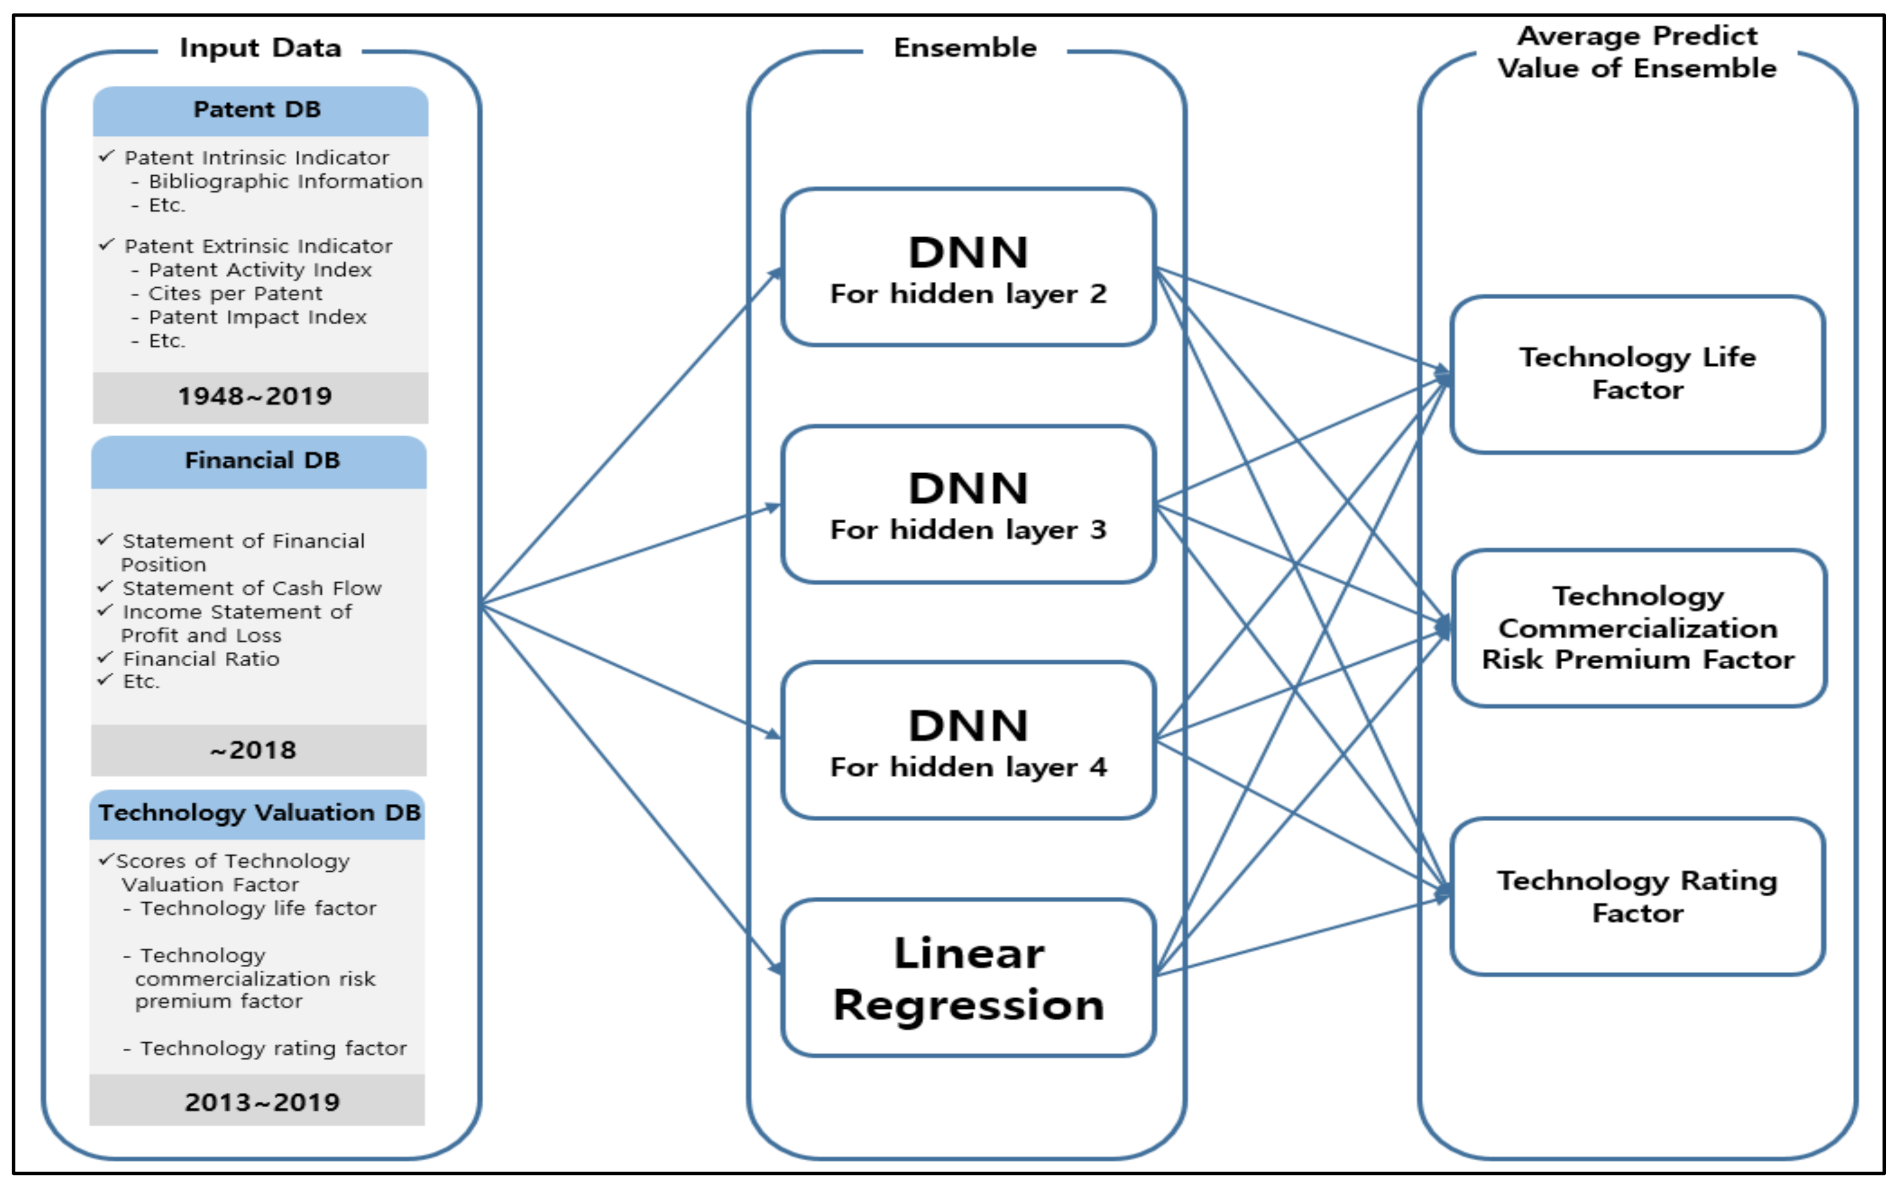
The learning target of the proposed ensemble model is a set of scores for the three technology valuation factors, which are positioned at the output layer. The ensemble model averages the scores that each model estimated and displays the finalized score for each technology valuation factor. It reflects both the nonlinear and linear patterns in the evaluation data in atypical combination and aims to secure consistency in the evaluation results by using many similar models. Therefore, the ultimate proposed model is shown in
Figure 8. The ensemble model collectively estimates three scores of technology valuation factors by hiring distinct DNN models with the different hidden layers of 2 to 4 and a linear regression model.
The KPAS II system in
Figure 8 proposes the ensemble model to solve the limitations of other evaluation methods that must involve direct judging and scoring by the evaluation experts. In addition, the DNN-based ensemble model has the advantage of being able to immediately derive reliable scores for each factor by minimizing the subjective bias, which might happen when valuation experts have different standpoints for the same factor given.
4. Results
This section numerically verifies the performance evaluation and system application results of KPAS II, which is the intelligent technology valuation system described in
Section 3. First, estimating the scores of technology valuation factors, which has been regarded as barriers for intelligently automating the existing technology valuation, is numerically analyzed, and verified for the proposed ensemble model. Next, we delve into the system application results of the constructed KPAS II system by sequence and verify the validity of the technology value finally extracted.
4.1. Performance Evaluation of Technology Valuation Factors Using Ensemble Model
In this study, the train and validation data set for learning the model in
Figure 8 consists of about 5000 actual valuation cases completed since 2013 in the structured DB. For each variable in the train data set, both patent intrinsic and extrinsic indicators that can be quantified in the patent DB have been extracted by taking into account
Table 3 through
Table 5 used by evaluators to calculate the scores of technology factors. Financial data of the subject company corresponding to each valuation case were extracted and databased. After being compared with the associated variables’ potential in preceding studies, a total of 36 variables related to technology, market, and business factors have been used as the input variables
xi of the train data, and the actual scores of three technology valuation factors (i.e., technology life factor, technology commercialization risk premium factor, technology rating factor) for each valuation case have been set up as the target variable
yi to construct the final train set. In addition, the Z-score normalization is taken to unify different scales among variables for the input variables.
The three types of DNNs embedded in the ensemble model are neural network-structured models with different hidden layers. All models perform the learning at default value of 6000 epochs. If the decrease in loss is significantly reduced, the technique of early stopping in machine learning is applied to find the epochs optimized for each model automatically. In addition, drop-out technique is applied to prevent the over-fitting phenomenon of the model; thus, specific nodes in each hidden layer are excluded during learning. The model is initialized to the learning rate of 0.001, assuming a complex correlation among all variables by each evaluation case, and the ADAM optimizer is chosen and fed to the model. For the loss function, we apply the widely used metric of mean absolute error (MAE), which enables the model to observe the model performance immediately, even during learning.
For linear regression (LR) in the ensemble model, the configuration of variables in LR is distinguished from that of the three types of DNNs. DNN is a nonlinear model in which both the influence and significance among variables are reflected by automatically adjusting the weights between nodes of the hidden layer during training. Meanwhile, in the case of linear regression, if too many variables are involved in the model, the over-fitting issue such as the automatic increase in
R2 may occur, and the intended target estimation might be physically difficult [
43]. In this study, a total of 36 variables in
xi, which are applied to DNN models, performs linear regression for each of the three technology valuation factors. Then, we apply the method of automatically extracting only significant variables at the 5%-significance level and utilizing them for estimation.
Table 6 shows the performance evaluation results for each detailed technology valuation factor of the ensemble model, consisting of the four estimation models. The two metrics of Mean squared error (MSE), and mean absolute percentage error (MAPE) as well as MAE, which was already introduced above, are utilized to measure the performance evaluation factors of the ensemble model. Because the maximum possible score for the technology life factor and technology rating factor is 100, and the one for technology commercialization risk premium factor is 50, we reach the proposition that the performance evaluation results from the ensemble model-based prediction are much similar to those evaluated by evaluators in practical valuation fields.
4.2. User Interface of Technology Valuation
The evaluation sequence of the intelligent technology valuation system (KPAS II) described in
Section 3 was implemented on the web-based and user-friendly interface for the utilization convenience in the financial industry. This section introduces the simulation results of the system in the user interface (UI) sequence.
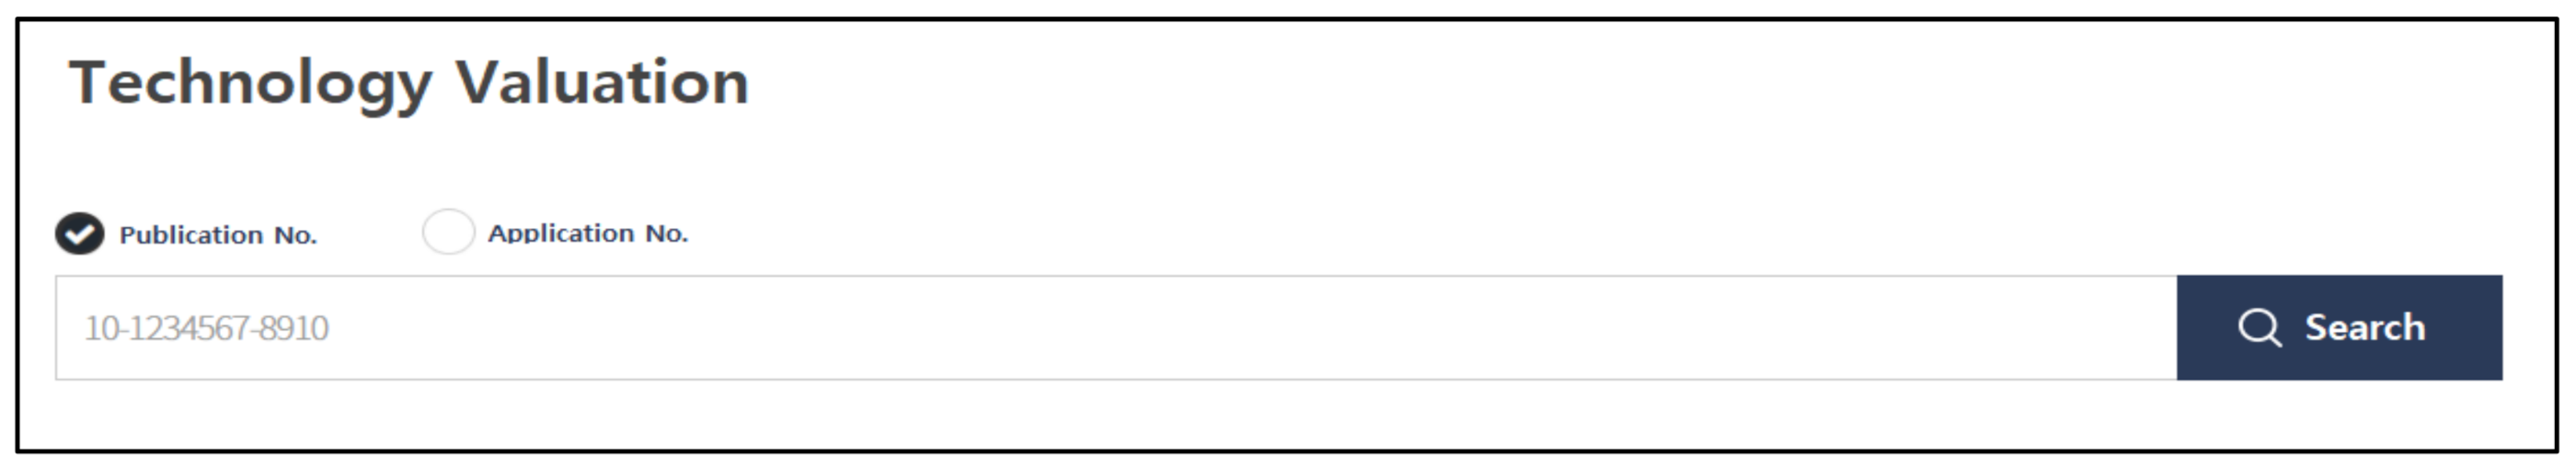
4.2.1. Input Screen of Patent Information
The input of patent information in
Figure 9 is implemented as the screen in which an evaluator or system user enters either publication or application number of the patent to be evaluated. The number entered by the evaluator is automatically converted or corrected by the input format of the patent number in case the evaluator does not ensure it or when we aim to promote the convenience of extraction from the patent DB.
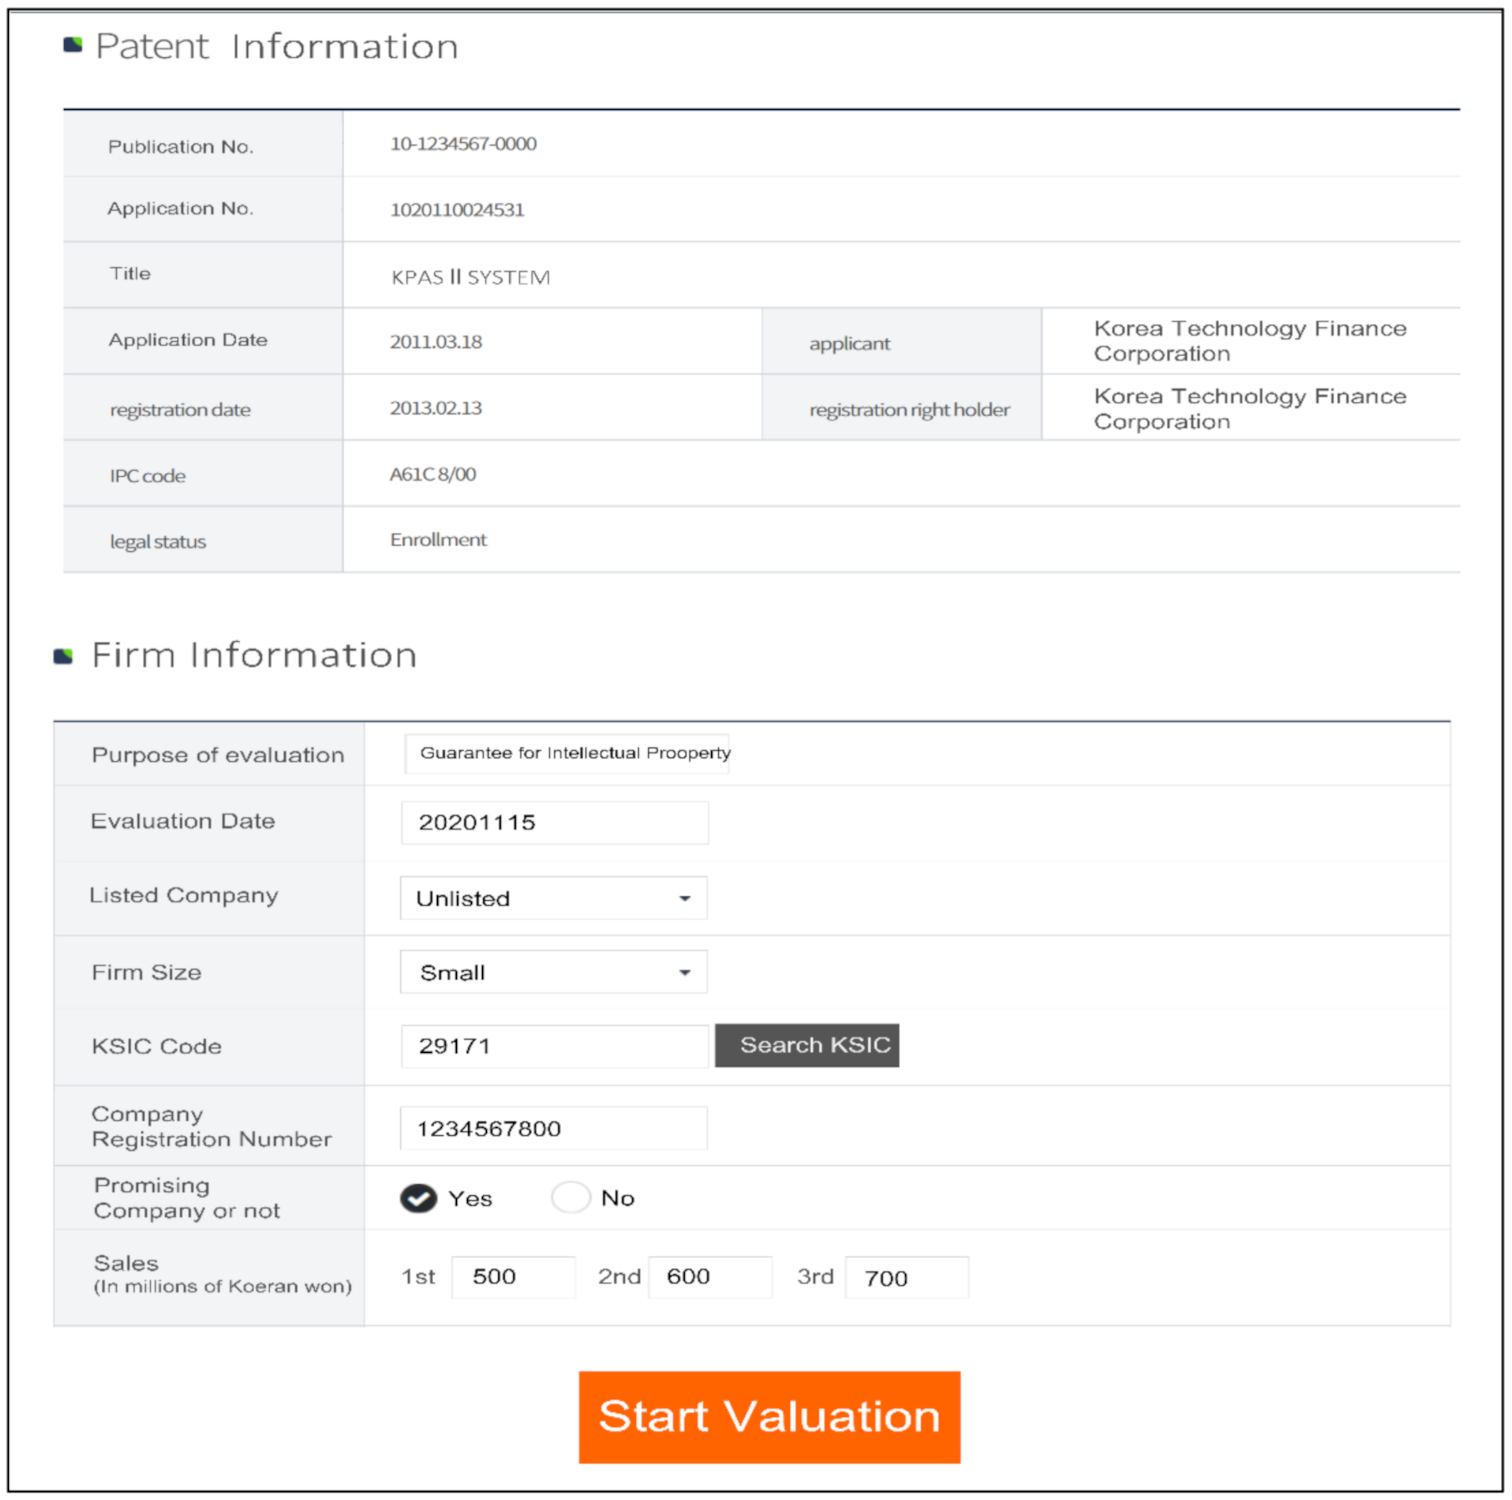
4.2.2. Input Screen of Firm Information
Input screen of firm information is implemented as the screen that brings and exhibits bibliographic information of the patent based on the patent number entered by the evaluator, where overview information for the subject company such as sales, KSIC code, firm size, company registration number, etc., are visualized in the screen.
As shown in
Figure 9, the bibliographic information of the patent is automatically extracted from the pre-built patent DB based on the input number of patent, and the information is automatically output to the patent information.
In the input item of firm information, the size and listing status of the commercialization entity, KSIC code, and company registration number are directly input. In case that the evaluator cannot properly categorize the subject industry into the KSIC code, it is implemented so that the KSIC code can be directly searched and selected by the ‘Search KSIC’ button. In addition, the evaluators directly input sales for the first three years of commercialization to reflect the phased characteristics of technology commercialization, followed by the sales estimation over the economic life of technology, which will be derived later on.
The firm information screen in
Figure 10 is the step for which the evaluator’s direct input is required. The KPAS II system proposed is implemented in a precise, simplistic manner so that evaluators can rapidly calculate the estimate of a technology’s economic value even if they are not well-versed in the entire sequence or procedure for technology valuation.
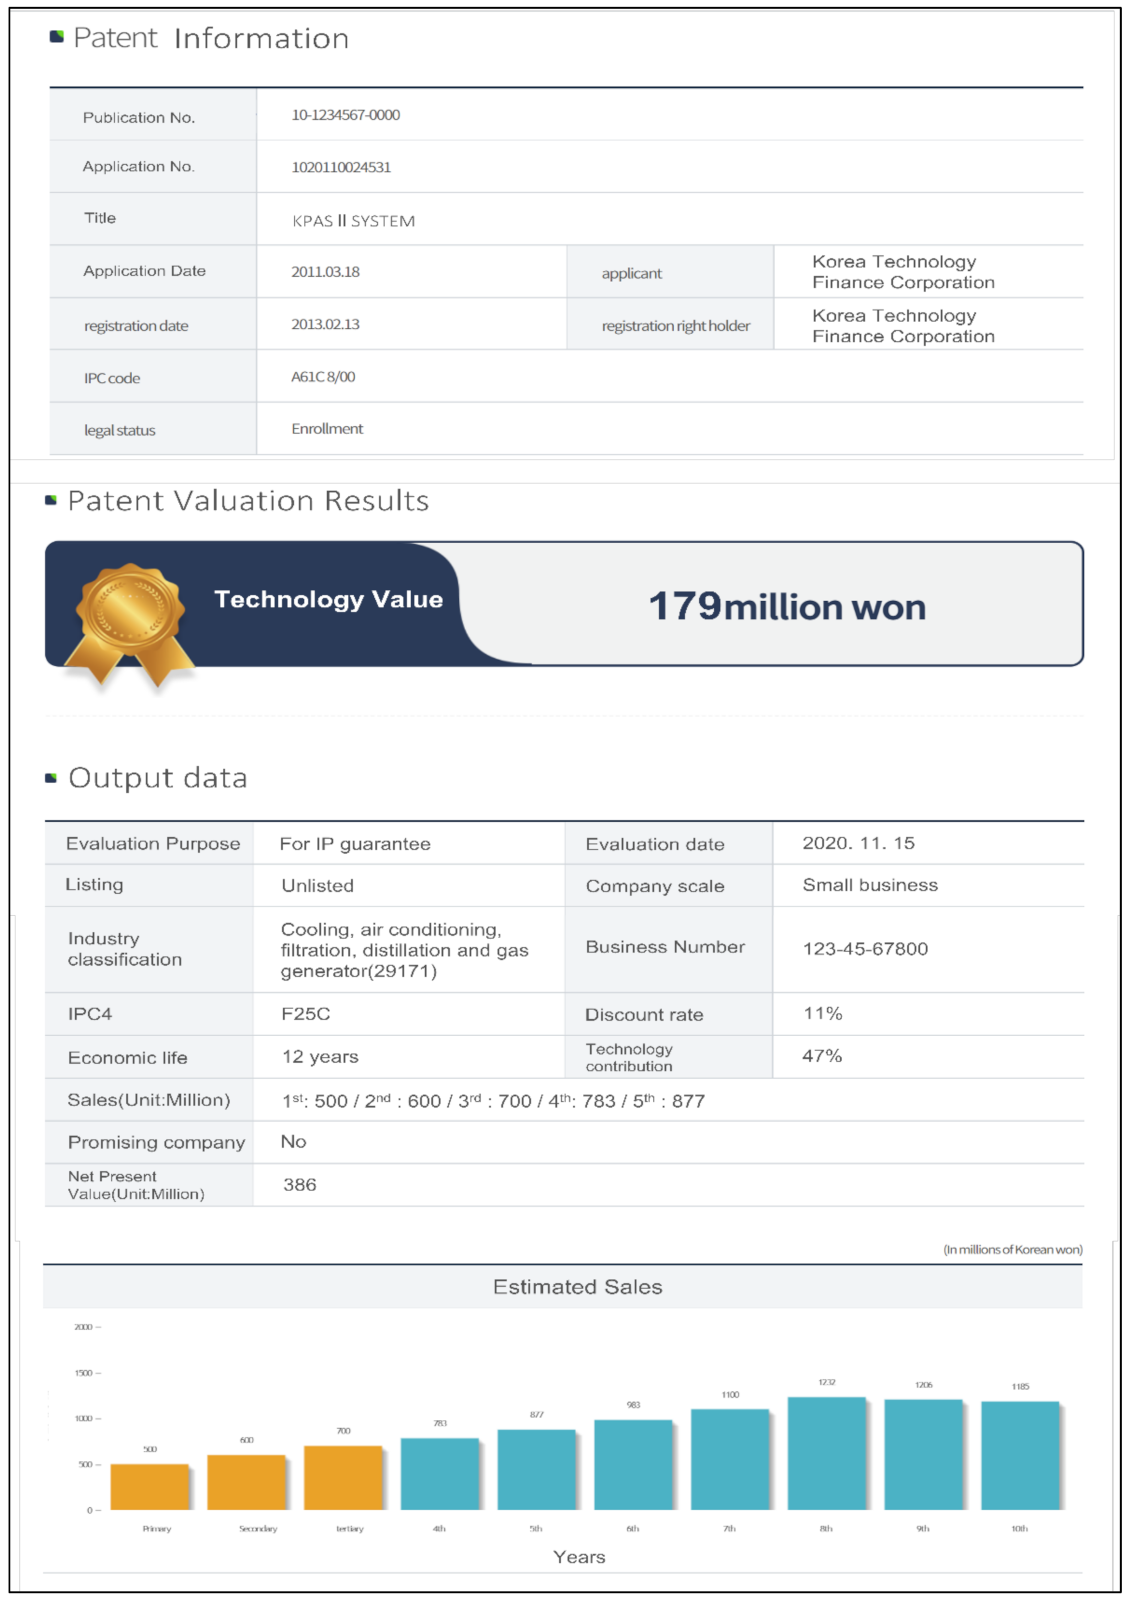
4.2.3. Final Result Screen for Technology Valuation
The result screen for technology valuation exhibits the summary of estimating the detailed factors by the DCF method and the finalized value of the subject technology, where only a few inputs, i.e., the patent and firm information, are required for the evaluators.
First, the economic life of technology leads to identifying IPC information from the patent DB based on the patent number input from the evaluator and enabling extracting the TCT corresponding to the IPC. The input data for the ensemble model is extracted from the patent and financial DB by the input of the patent number or company registration number. The extracted input data is then fed to the ensemble model established in advance, and the score for the technology life factor is displayed after learning the model. Finally, the economic life of technology is automatically calculated and presented, while Equation (3) is applied.
Second, the discount rate extracts key variables applied to Equation (7) from the financial DB by inputting the company registration number. The technology commercialization risk premium factor is calculated similarly as the technology life factor is estimated. Then, the discount rate based on Equation (7) is automatically derived and presented.
Third, for the technology contribution ratio, the industry factor of the industrial fields in which the technology lies is extracted from the financial DB by identifying the KSIC code for the input of firm information. The technology rating factor is calculated using the ensemble model as the two factors are estimated. Then, the technology contribution ratio applied to Equation (13) is automatically derived and presented.
Last, the major FCF factors are extracted from the financial DB by inputting the company registration number and KSIC code, which the evaluator entered. For sales estimation, which plays a significant role in the FCF calculation of technology valuation, Equation (4) is applied when the evaluators input the sales estimates expected for the first three years of technology commercialization, where the economic life of technology calculated in the previous step is applied for the estimated period of sales. As for the estimated sales over the economic life of technology, it can be seen in
Figure 11 that the technology adoption life cycle is also considered for sales estimation.
The result screen for valuation in the KPAS II system in
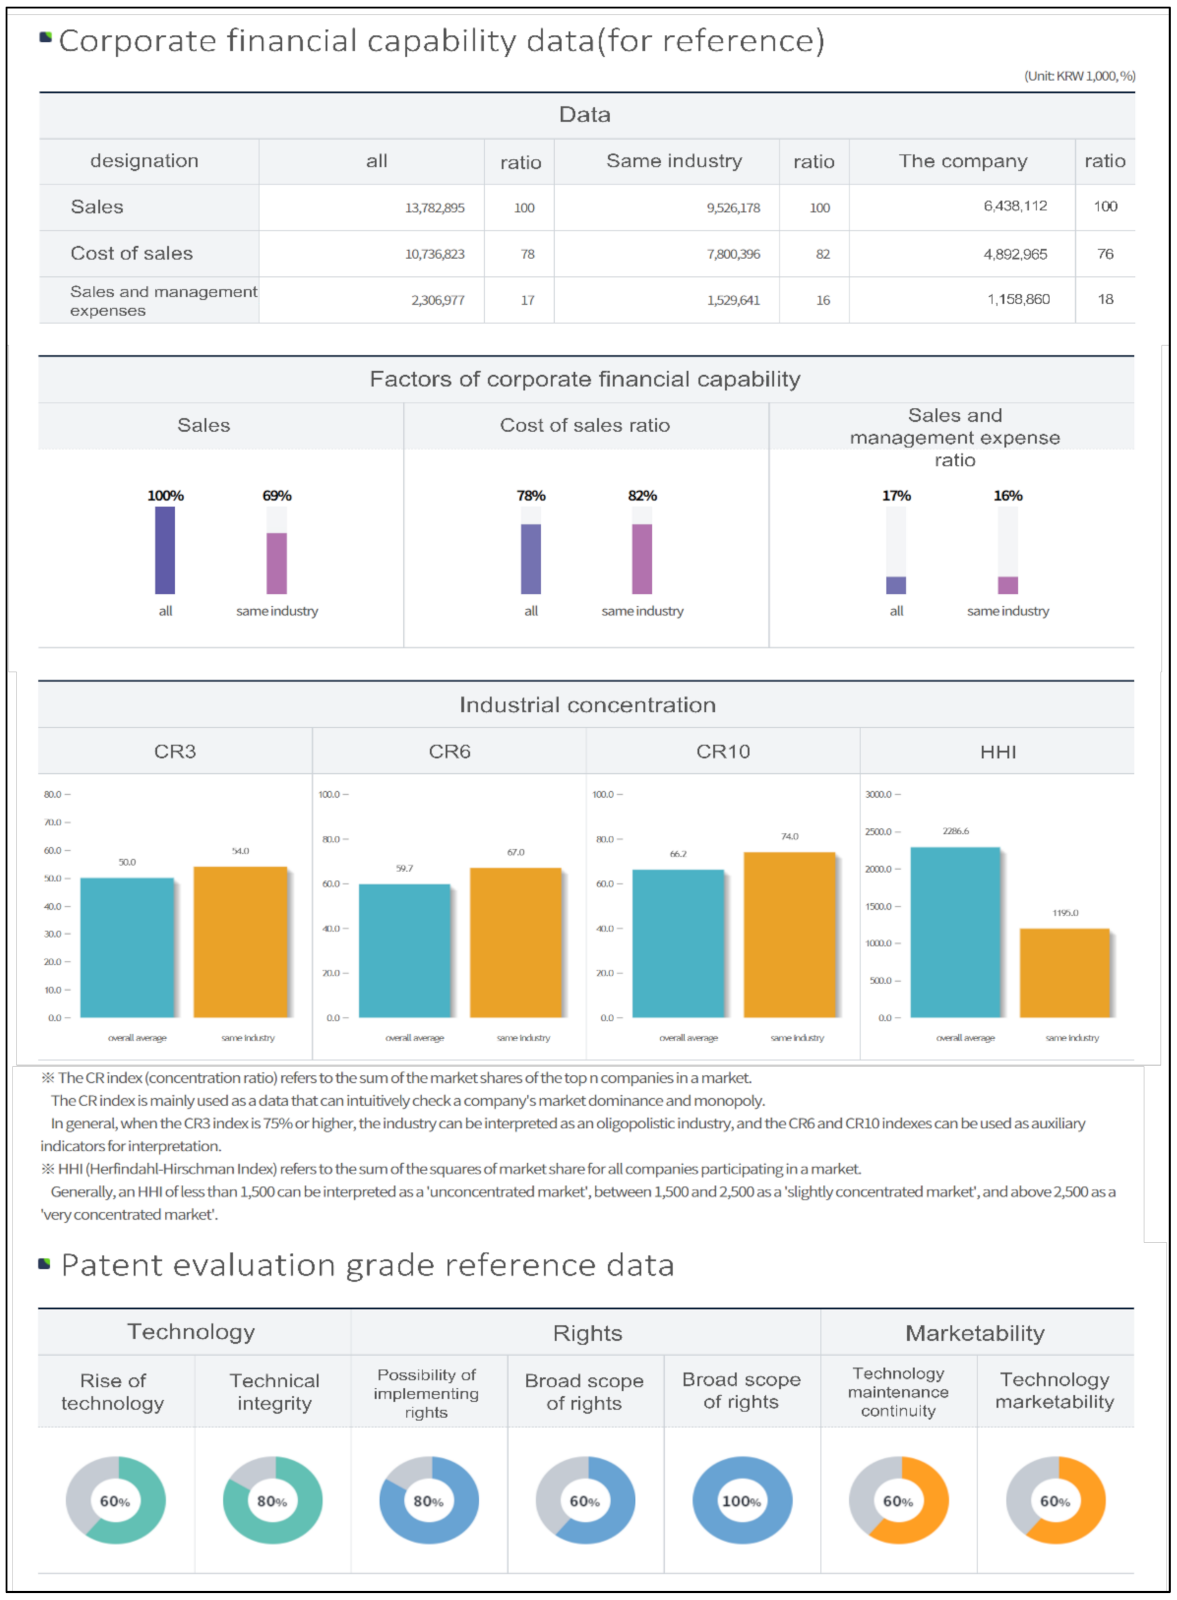
Figure 11 provides useful supplementary functions such as statistics of valuation variables and results, annual sales and cash flow estimates, etc., and the essential information of final technology values. Major financial information of the entire or similar companies by KSIC or firm size secured in the financial DB is offered to the evaluators to identify the corporate capabilities of the commercialization entity.
The KPAS II system enables the business entity to establish strategies for successful commercialization by providing the lists of dominant competitors or competing products, and market concentration indexes such as CR (Concentration Ratio) and HHI (Herfindahl-Hirschman Index) in the specific industry to which the technology-applied product lies in [
44]. Besides, patent grade evaluation information for the KPAS I system already developed and managed by KIBO is simultaneously provided, and both the intrinsic and extrinsic impact for the patent to be evaluated are quantitatively shown in
Figure 12 so that the evaluators can draw various inferences or explanatory comprehensions regarding the results of the technical value in many-sided aspects.
5. Discussion
Although the introduction of innovative and disruptive technologies in the Fourth Industrial Revolution is being world-widely spread beyond any specific boundary of industry, the recent trends of economic recession and low growth are assumed to last up to the next years or so as a medium-term or long-term global phenomenon rather than a temporary phenomenon. To break through the stagnant situations in the industries, companies should endeavor to find new sources of income created by the convergence of new technologies and the execution of active R&D and commercialization. However, in reality, the limitation for corporate growth in the technology environment already advanced if companies utilize only their internal capabilities to enhance their business productivity and profitability. In terms of open innovation, companies need to pursue corporate innovation under open cooperation paradigm by actively grafting superior technologies and knowledge from external sources or organizations [
45,
46]. The government-led fund support programs such as technology transactions and IP guarantees have positively affected technology-oriented innovation and economic activities for all types of firms such as large firms, small-and-medium firms, startups, etc., in Korea.
However, the excessively long time and high cost for completing the valuation of technology made it difficult to promote commercialization promptly, where valuation results are regarded as useful in creating technology-based economic activities. The overly theoretical methods for technology valuation made non-experts fully understand the valuation theories and apply them to practical cases. To popularize the outcomes and usability of technology valuation, expert institutions such as KIBO, KISTI and KIPA have tried to revitalize the technology finance market by widely spreading web-based intelligent valuation systems developed individually according to their own goals of utilization. These systems have, at initial release, been welcomed due to the clarity of qualitative or quantitative results. However, the constraint exists that evaluators still have to enter many of the input items in their knowledge level regarding each characteristic index and cannot calculate the technology value minutely.
The KPAS II system proposed in this study is differentiated from other evaluation modules in that it is implemented to automatically estimate the technology value by bringing the fundamental data from the pre-built databases of patents by the IPC, firm information, or financial data by industry and AI-based learning algorithms are embedded in it to determine and offer approximate score estimates through DNN learning with the structured data.
First, the proposed KPAS II system extracts fundamental real-time information associated with 36 explanatory variables from the pre-built patent, financial, and technology valuation DB. It resolves the inconvenience of the evaluators’ direct input or estimation for the patent and firm information.
Second, the KPAS II becomes to secure the appropriateness of the technology valuation procedure performed by evaluators so far in use. The technology value is calculated by following the key formula for the DCF method, which is usually applied for technology valuation.
Third, in the condition that there exists no typical reference or evaluation standard for the qualitative scores for technology valuation factors in Korea, where the scores are determined by the evaluator’s subjective judgement automatically estimating technology valuation factors from the pre-built DBs contributed to enhancing both objectivity and reliability of the estimation results. By applying the DNN-based ensemble model to estimate three qualitative factors (i.e., technology life factor, technology commercialization risk premium factor, technology rating factor), evaluators can ultimately estimate the technology valuation factors while excluding individual evaluators’ bias or outliers of scores. The pre-built technology valuation DB includes about 5000 technology valuation cases which KIBO accumulated from 2013 to 2019. In the intelligent KPAS II system, the technology valuation factors extracted by learning the ensemble model over the evaluators’ input scores in the valuation cases DB are finally automated by bringing DNN-based query values and presents a complete solution to the existing limitation that experts should judge qualitative estimation for the three factors.
Last, the proposed KPAS II system offers real-time information which researchers and coordinators for commercialization might retrieve for other business development programs. It is possible to check the current financial conditions or abilities of the commercialization entity or to visually compare the financial items or ratios of each company within the same industry, or it might provide the analyzed information of the market conditions and market entry potential. Further, the system is expected to maximize the user’s utilization by providing in-depth information such as technical level, degree of rights, marketability in which technology is realized to a product.
The KPAS II system proposed in this study holds its significance. It presents data-driven intelligent technology valuation algorithms based on a systematic calculation module, where statistical learning results for each evaluation factor become a reliable compass for non-expert’s valuation practices. In addition, the proposed KPAS II system is expected to contribute to the promotion of the technology finance fields and the diffusion of technology commercialization achievements by offering various types of usable data or pre-built metadata in real-time.
6. Conclusions
In a situation where the technological advancement of the industry faces its limitations, the essential factors for the sustainable growth of a company can be said to be convergence and innovation in the aspect of open innovation. From this point of view, this study proposes a fast-track, intelligent valuation system that enables non-experts to easily evaluate the value of their technologies to promote technology finance for technology-based commercialization such as technology transfer, licensing, intellectual property (IP) rights security, technology secured loan, etc.
Based on both patent and company financial information that can be collected at present and updated periodically in Korea, the intelligent technology valuation system (KPAS II) proposed in this thesis has been implemented as a web-based system that enables technology transfer agents or institutional technology business development consultants to estimate the economic value of their subject technology at minimal input variables or information.
The proposed system of KPAS II complies with the detailed valuation procedure of the DCF method generally used for technology valuation in Korea while focusing on implementing a sophisticated, meta-database-associated valuation system based on the method itself. Therefore, we recognize that there exists no appropriate way to perform quantitative validation for a technology’s economic value derived based on the system until the revenue streams become identified as time goes by. It is because performing practical valuation cases completed in the past gets left behind in time difference. At the same time, most dominant factors, such as the economic life, market situation, etc., have changed at the valuation moment. In addition, the technology value already derived is the one estimated and adjusted by valuation experts, and it does not necessarily guess correctly compared to future cash flow-based technology value, which is the limitation of the technology valuation system in numerical validity.
It is expected that the proposed DNN-based technology valuation system of KPAS II can provide timeliness in establishing management strategies to entity’s decision maker based on holding technology and financial condition to decision making. In addition, it is expected that fast-track screening of the technology value of the investment target entity will be possible for market participants such as investors without having separate technology evaluation knowledge. Ultimately, proposed KPAS II system could become a novel, sustainable, and effective means for various technology finance support programs such as the establishment of corporate commercialization strategy in the aspect of open innovation, the enhancement of R&D efficiency, IP guarantee, etc.


 ,
, 


