Article

The State of Human Capital and Innovativeness of Polish Voivodships in 2004–2018

by
Maciej Jagódka
and
Małgorzata Snarska
*
Department of Financial Markets, Institute of Finance, Collegium of Finance, Economy and Law, Cracow University of Economics, 31-510 Krakow, Poland
*
Author to whom correspondence should be addressed.
Sustainability 2021, 13(22), 12620; https://doi.org/10.3390/su132212620
Submission received: 18 September 2021 / Revised: 23 October 2021 / Accepted: 1 November 2021 / Published: 15 November 2021

Abstract

:
The category of human capital has increased in importance with the emergence of human capital theory in the 1960s. The interest in innovativeness is a result of successive waves of industrial revolutions and technical progress. The article aims to estimate human capital and innovation in Polish voivodeships 2004–2018 as an essential determinant of socio-economic development in emerging economies. The regional dimension related to human capital and innovativeness is rarely studied in a socio-economic context. Additionally, the main contribution of the paper is that we propose an extraordinary set of variables capturing quantitative and qualitative aspects of regional research. To measure these factors, we propose a set of sub-indices describing the state of human capital and innovation. The delimitation of regions was carried out using the method of Czekanowski. The study results confirmed the polarization of voivodeships in Poland, generally according to Eastern and Western Poland. Unfortunately, it turns out that despite the economic growth in the country in recent years, disparities within the human capital of voivodeships are increasing. This makes it challenging to unleash innovation and enter a faster and more sustainable path of growth.

1. Introduction

Human capital theory’s birth answered the question raised by inequality in individual national economies, which, despite similar geographic locations and access to natural resources, developed at different rates. Progressive globalization and European integration have reevaluated thinking about socio-economic development in the direction of regional economies. The challenge is to study the causal relationships between growth, development, human capital, and innovation in a new and different way, i.e., taking the spatial differentiation of national economies into account. A region’s pro-innovative character enables effective creation, absorption, and diffusion of innovation. This process would not be possible without the appropriate quality of human capital resources. One should remember that the potential contained in the region’s human capital alone is not sufficient to build the region’s innovative capacity. Therefore, it becomes necessary to identify the critical barriers to innovation diffusion and propose human capital development strategies to increase regions’ capacity for pro-innovative and knowledge-intensive structural transformations. This translates into the belonging of regions and entire national economies to the high and low segments. The former includes regions where the economy’s structure is based on advanced information and communication solutions and knowledge-intensive and modern industries, the new economy’s sectors. They are also characterized by a high level of income, employment, and export of innovative products, responding to the growing global demand for innovative goods and services. The second group of regions specializes in producing goods and services of low technological advancement, part of the global supply chain. It is associated with low labor costs and a “backward” economic structure based on labor-intensive sectors, i.e., low productivity sectors or agriculture. Such a strategy based on low unit-production costs may not be sufficient to maintain stable growth level in the long run. It may even deepen disparities between poor and rich regions. For example, a competence mismatch may increase economic inequalities and push Poland’s regions to the world’s economic periphery. As a result, since the Lisbon Strategy, the European Union has emphasized innovation and sustainable socially-inclusive growth. These changes are not possible without raising the quality of human capital and social, economic, environmental, and spatial cohesion in the European Union.
Undoubtedly, the pace of development of the world economy accelerates industrial revolutions’ successive waves. Increasing the quality of human capital can increase the number of innovative enterprises and products and indirectly stimulate growth and its development. Nevertheless, the long-term impact of human capital on innovation and economic prosperity is still an open field of research. The study of the functional relationship between human capital and innovation is a highly complex process due to the multifaceted nature of the economic categories under analysis. The literature indirectly indicates the mechanisms of mutual interaction of human capital and innovation and their role in building global income. The conclusions vary depending on the methodology used, the research sample, and the space–time setting. In particular, there is no consistent way of analyzing both the state of human capital and the level of innovation and interactions. The set of factors determining them is not fully defined. Unfortunately, studies in this area are carried out almost exclusively from entire national economies and not individual regions. However, regional differentiation of human capital and innovativeness is equally essential for sustainable development [1]. Our research provides new light to human capital and innovativeness research from the regional perspective.

2. Literature Review

The genesis of neoclassical human capital theories is the discovery that physical capital growth could not explain a significant part of the United States’ income. Economists drawing on development theories encountered difficulties in interpreting the so-called residual. This resulted from an explanation that the increase in national income was not due solely to the growth of physical capital and the labor force employed since income grew faster than resources. Therefore, this growth must be due to other factors, such as technological progress, which, according to Allen, came “like manna from heaven.” These considerations gave rise to a new theory of growth based on human capital. The main precursors of the human capital theory of the 1960s are considered to be three authors: Mincer [2], Schultz [3], and G. Becker [4]. Their theoretical considerations and empirical research became the basis of human capital theory, which is still developed in the social sciences today. Human capital is a complex economic category that explains why technical progress through innovation is possible in some countries and not in others.
One can discuss human capital in narrower and broader terms. On the one hand, human capital is knowledge, skills, and experience. On the other hand, it is everything embodied in society that allows it to achieve its socio-economic welfare.
According to Domański, human capital is a resource of knowledge, skills, health, and vital energy in society. This resource is not given by the genetic characteristics of a given population once and for all. However, it can be increased through investments related to human beings: in people, in human life. The distinguishing feature of human capital is that it is, as it were, part of man. One cannot separate oneself from one’s human capital—or in other words: human capital always accompanies a person. From a macroeconomic perspective, the value of human capital is infinite because if an individual dies, the remaining members of the species are alive. The capital is reproduced in the current population and new generations, which are subject to constant outlays. Human capital will be more remarkable the more significant the sum of global outlays and the outlay on average allocated to individuals in a given community [5].
The OECD’s definition of human capital captures the essence of the issue. Human capital consists of knowledge, competencies, skills, and other attributes that enable an individual to build personal, social, and economic well-being [6].
The human individual in socio-economic life competes based on intellectual, motivational, and symbolic resources, such as prestige. These resources can be measured by selected indicators such as work experience, education, migration, abilities (often defined by intelligence tests) [7,8], wellness [9], and even psychological well-being [10].
The attributes of human capital capture its complexity and multidimensionality. However, it is possible to indicate the characteristics distinguished from other types of capital [11] due to the presence of positive externalities caused by learning by doing [12] and cooperation [13,14]. Human capital cannot be separated from human beings, which means that it cannot be traded on the market. The value of human capital as a result of physical exploitation does not decrease as in physical capital but increases. However, there is a decline in human capital value when it is not used [15]. Characteristics of human capital are presented in Table 1.
According to Korenik, the term capital refers to people and entire communities and their skills and abilities. It is created by every phenomenon and thing capable of generating added value [16].
According to Statistics Poland (SP), innovation resulting from human capital is enterprises’ ability to create and implement innovations and the actual ability to introduce new and modernized products, modified or new technological or organizational and technical processes. This definition was proposed by the Oslo Manual [17], an international methodological standard called the Oslo Manual. It provides guidance to OECD countries on a list of comparable innovation indicators. On the other hand, the economy’s innovativeness is economic entities’ ability to constantly seek and use new scientific research and research and development works, new ideas, concepts, and inventions. Developing countries should use developed countries’ previous innovative achievements for the diffusion and absorption of innovations. Thus, countries that can create, absorb, and adopt new products and services that can be considered innovative. A characteristic feature is, therefore, the ability to constantly adapt to changes occurring in the environment. Adaptation is, in a way, forced by the need to join the global development process and the expanding economic globalization [18].
Innovation processes develop in a particular set of actors and conditions such as capital availability, competition intensity, legal and social system quality, infrastructure level, and market size. Links between innovative companies and the environment can be presented using the triple helix model. This describes the relations and feedbacks between the main actors of innovation processes: institutions from the science sector, industry and services, and the state. Many problems in innovation growth are attributed to the lack of cooperation between actors on the innovation scene. The exchange of information and integration of partners is often raised in the European Union documents, indicating the need to change or modify individual actors’ tasks and roles. The aim is for universities to be more open to the economy, for patents to ensure the transfer and circulation of knowledge in the infrastructure, and for accumulated practical knowledge to be a premise for innovation initiation. The SME sector, especially in local markets, can effectively create new jobs. As far as the competition between regions is concerned, an E.U. cohesion policy with a budget adequate to balance development opportunities is necessary. The triple helix model based on the knowledge-based economy’s transformations and the fourth industrial revolution has been enriched with the evolutionary approach. A unique role is played by research, markets, and public policies [19]. The role of human and social capital in the development of regions is significant. Without them, there can be no innovation, especially active innovation (innovation generation).
What characterizes innovation is novelty, invention, and change, which does not always have to be created through R&D and patenting. Different types of innovations often complement each other or form the basis for development, e.g., organizational innovations form the basis for implementing technological changes [20]. Innovation is the Holy Grail of economic growth and sustainability programs worldwide [21,22].
Economies’ innovation depends mainly on human capital, which is responsible for creativity, generation, and the absorption of new technologies. Innovation is also not possible without access to capital, which in this context is used to finance innovative activities, including R&D.
Previous research on the relationship between human capital and innovation has been conducted mainly in developed countries due to a more developed and stable institutional environment. Slightly different results can be obtained for developing countries with more significant uncertainty [23,24].
Human capital is significant in creating technological innovation in the economy [25] especially concerning emerging economies, to adopt foreign know-how and technology. Confirmation of the importance of human capital in increasing productivity has been found in theories of endogenous development primarily through the generation of innovation, its absorption, and diffusion [26,27].
The integrated development of human capital leads to the productive use of the economy and its modernization through cultural and social innovations, contributing to socio-economic development. Investment in human capital allows the creation of favorable conditions for development, mainly in the area of motivation, creativity, and potential in the labor market of individual regions. It is also about forming an innovative type of thinking in all sectors of the economy. Appropriate public policies help stimulate and develop human capital towards innovation [28].
In this paper, the categories of human capital and innovation are related to regional systems. Human capital is measured at the state, region, and enterprise level, while the regional approach is the least frequently used. Today it depends on regions whether the country as a whole will compete effectively in the global market.
The development of human capital theory and cross-sectional research on the role of human capital in economic development has inspired economists to address regional issues. The application of growth regressions at the regional level has resulted from the decentralization of economic policy in many countries. In democratic countries, developed regions are left with considerable autonomy to program and stimulate development. The argument for undertaking economic growth research in the regions is that economies within nation-states are highly differentiated. Economic development is currently concentrated in large agglomerations that have emerged from the process of metropolization. Metropolises depend on their immediate surroundings and appear on the world market separately from national economies. Simultaneously, they are engines of growth for these economies by stimulating other regions’ development [29]. The intensification of metropolization processes is primarily a consequence of the growing importance of human capital in the economy. Human capital accumulation is much more intensive in large cities with a network of schools and universities, research and development units, and health and cultural institutions. In agglomerations, as a result of migration, human capital is absorbed from other regions, which manifests itself mainly in more significant resources in the labor market. The research results on human capital and economic growth’s interdependence indicate that this relationship is most substantial in regional arrangements [30]. However, attention must be paid to whether or not metropolization processes that support overall development entail inclusive growth. Economic growth, based on megatrends such as globalization and metropolization, is value-added when it is integrated. The emergence of interregional disparities reduces the chances of a long-term path of socio-economic development [31].
The methodological approach in regional studies does not differ much from international studies, and the primary instrument remains growth regression. In the regression medley, individual human capital measures such as average length of education, health status, or innovation achievements are taken as explanatory variables for regional growth rates. Data of this type are made available by national statistical offices in aggregate form and for smaller units, making it possible to undertake studies at lower aggregation levels. In regional arrangements, the existence of a convergence between different territories is more often investigated. The impact of human capital on economic growth is not the primary objective but part of the analysis aimed at defining convergence conditions [30].
Research on the impact of human capital on regional growth processes has been conducted by, among others, Liberto [32], Badinger and Tondl [33], and Engelbrecht [34]. Diebolt and Hippe [32] showed that human capital is a critical historical factor influencing the current level of indicators such as the number of patents per capita and GDP per capita. It demonstrates the need for long-term capital formation, the high quality of which provides further incentives for development and investment in this production factor.
It turns out that human capital, expressed mainly by the percentage of people with higher education, has a significant impact on the regional growth rate [35]. Capital regions are growing faster than others, and human capital is a strong determinant of economic growth [36]. This confirms Florida’s creative class theory. High-quality human capital concentration occurs in larger cities, which account for the vast majority of regional growth [37].
The impact of human capital and innovation on economic growth in European regions has been demonstrated by many other authors [38,39,40,41].
Theory and practice prove that human capital is the effect of long duration and its regional distribution is the result of historical and geographical accumulation [42,43,44,45,46].

3. Materials and Methods

Human capital is a heterogonous concept, which makes it very difficult to measure. It is also difficult to assign a monetary value to human capital’s components, such as valuing health or psychological factors. The sum of its parts cannot estimate the value of human capital. This limitation is caused by the interaction of all the components of human capital. The total value of an individual’s human capital is greater than the sum of the components [47]. Human capital cannot be measured directly, but certain phenomena and symptoms which prove their existence can be. The empirical measurement of human capital poses problems related to the availability and comparability of data. The problem is also the definition criterion, which many actors understand differently. Therefore, it is necessary to indicate the range of indicators that explain the examined variable’s occurrence in the best possible way. Over the years, especially after the popularization of human capital theory, economists have proposed ever newer measures applicable to measurements based on this theory.
There are three main methods of measuring human capital [48]:
  •  the educational stock-based approach;
  •  the cost-based approach, otherwise known as the retrospective method;
  •  the income-based approach, otherwise known as the prospective method.
This paper uses the human capital index approach to capture as many attributes of this development factor as possible. Each sub-measure is fraught with weaknesses. Hence synthetic measures also represent a certain simplification. It should be remembered that the assumptions made in individual sub-measures do not fully correspond to reality. Therefore, the researcher’s role is to select the sub-measures to maximize the synthetic indicator’s analytical usefulness. Measures of economic categories such as human capital or innovativeness are often based on the synthetic index mechanism (European Innovation Scorecard, KAM). The study covered a fifteen-year time horizon (2004–2018), and the reference years were set as the main periods of analysis: 2004, 2008, 2014, and 2018. The choice of these years is not accidental.
The first year was 2004, Poland’s accession to the European Union, assuming that data from this period will present the initial human capital and Polish voivodeships’ innovation. Subsequent reference periods cover the years 2008 and 2014, i.e., the initial stages of implementing programs from the E.U. aid funds under the following financial perspectives (respectively, 2007–2013 and 2014–2020). Due to data availability, the last reference period is 2018. A separate range of data availability characterizes each of the diagnostic variables adopted in this chapter. Hybrid imputation was used to fill data gaps. Gaps for years in the early tail were filled with the earliest known value. They were projected using an exponential smoothing algorithm for years in the final tail if not already available from official statistics. For the characteristic describing wages by province and education, data for 2018 were determined using average wage growth in the national economy. Gaps in the data between the two periods were filled by the linear interpolation method. Several indicators were proposed as components of the synthetic human capital index to assess human capital development in Polish voivodeships. The data sources included the Local Data Bank (LDB) of Statistics Poland SP (Polish abb. GUS), Eurostat, UNESCO, Polish Business and Innovation Centers Association (Polish abb. SOOIIP), Educational Information Centre of the Ministry of Education (Polish abb. CIO MEN), Central Examination Board (Polish abb. CKE), Regional Examinations Boards (Polish abb. OKE), the Patent Office of the Republic of Poland PORP (Polish abb. PARP), the European Patent Office (Patstat), the National Electoral Commission (Polish abb. PKW), and Regional Innovation Scorecard (RIS)
A set of 120 characteristics representing Polish voivodeships’ human capital status was created based on the human life cycle (7 characteristics for childhood, 33 for schooling, 76 for adulthood, and 4 for post-working age). The 76 variables within the Adulthood area were divided into smaller areas depicting essential aspects of human capital formation in adulthood, i.e., four variables—education, 5—demographic potential, 36—professional work, 5—R&D and Knowledge Economy, 5—entrepreneurship, 2—social capital, 4—leisure time, 2—social exclusion, 11—health. The typological characteristics of the phase of human capital formation are presented in Appendix A.
To determine the similarity of provinces in human capital potential and innovation, we used J. Czekanowski’s serialized taxonomic method of differences [49].
The similarity matrix for voivodeships in terms of the level of innovation and the level of human capital can be constructed by considering the nature of the variables adopted for analysis, only indirectly, from vectors of measures or characteristics describing each voivodeship. If sij denotes the similarity between object i and object j, then the measure of dissimilarity can be expressed as dij:
d i j = 1 s i j     or   d i j = 2 1 s i j
For n provinces, for each instant of time t and available p measurements with actual values, one for each object, one can define the vector of observations for the i-th province at instant t as x t i = x 1 t i ,   x 2 t i , , x p t i . The Euclidean distance between the i-th and j-th objects is then defined as:
d E i , j = k = 1 n x k t i x k t j 2 ,
After determining the distance matrix D between the studied voivodeships concerning the level of the composite phenomenon (i.e., the state of human capital and the level of innovation), individual distances are divided into classes constituting intervals of object similarity. The minor differences are included in one class interval containing the most similar voivodeships in the composite phenomenon level. The similar minor units are, in turn, grouped in the last class interval. After determining the similarity scale, appropriate graphic symbols representing distances between voivodeships are assigned to particular classes. The result of these operations is an unordered Czekanowski diagram. Next, the columns and rows of the distance matrix D are rearranged. Along the diagonal, some objects are most similar to each other. As one moves away from the main diagonal, the differences within voivodships become larger. The typological group created in this way includes the least diversified units in terms of the value of the features that describe them. Territorial units showing the most remarkable similarities are concentrated around the main diagonal. The result of applying this algorithm is an ordered Czekanowski diagram.
A fundamental shortcoming in plotting a Czekanowski diagram is the difficulty of objectively ordering close objects. The paper proposes the use of combinatorial data analysis methods, in particular, the techniques of seriation, i.e., linear ordering of objects due to a particular multidimensional set of features and a reward or loss function, in order to discover the internal structure of a set of objects concerning the available information [50]. The basis of combinatorial data analysis is so-called discrete optimization problems, which in the most general case involve evaluating all possible solutions. Due to their combinatorial nature, the number of possible solutions grows with the size of the problem (number of objects, n) by order O (n!). It analyzes all possible options to solve the problem feasible only when the number of features characterizing the phenomenon is relatively small. With a more significant number of variables, dynamic programming can be used [51] or a branching strategy [52].
The technique of seriation as a formal method derives from [53] who, in order to determine the chronological order of graves discovered around the Nile, based on objects found there, presented a contingency table of gravesites and objects using permutations of rows and columns so that all large values, i.e., graves with similar objects, were close to the diagonal. Initially, the regrouping of rows and columns in the contingency table was done manually. Its adequacy was subject to the researcher’s subjective judgment. Modern seriation techniques rely on measures of consistency between rows as a combinatorial criterion for the optimality of the resulting distance matrix [54,55,56]. The series of a set of n objects{x_t (1),x_t (2),…,x_t (n)} starts with an n×n dimensional distance matrix D = d i j , where d i j for i,j ∈ [1,n] illustrates the disparity between pairs of objects x t i i x t j . For this distance matrix, a permutation function Ψ is defined as a function that reorders the elements of the distance matrix D by permuting the rows and columns simultaneously. The main problem of the series is to determine such a permutation function Ψ* that minimizes a loss function L of the form:
Ψ * = arg min L Ψ D ,
The distance matrix D can be represented as a finite weighted graph G(Ω, E), for which objects (provinces) are vertices of the graph, while each edge e i j E between two objects x t i and x t j corresponds to a certain weight, which represents the distance d(i,j) between objects. The ordering Ψ of individual objects is conceived as a Hamiltonian path on a graph, i.e., a path that passes through each vertex exactly once. By minimizing the Hamiltonian path’s length, one obtains an optimal ordering of objects that considers their similarities [57,58]. The loss function L (D) can then be expressed as follows:
L D = i = 1 n 1 d i , i + 1 ,
The optimization problem described above can be referred to as the plane of hierarchical clustering with optimal leaf ordering. In classical clustering methods, one usually creates an undirected acyclic graph called a dendrogram, i.e., one where from any vertex of the tree one can reach every other vertex (consistency), but only in one way. A dendrogram for n objects has 2 n 1 vertices, which means that there are 2(n−1) ways to determine individual objects’ order. To optimally order leaves, an algorithm is used that adjusts the dendrogram to minimize the Hamiltonian path through all vertices [59]. The process of optimal linear vertex sorting in hierarchical clustering for a dendrogram T with n vertices can be written in a formalized way, where k 1 , , k n are specific objects, and v 1 , ,   v n 1 the internal vertices of the graph T. A linear ordering for T will be a determination of the order of objects by changing the order of internal vertices within the dendrogram T, i.e., changing the order between two subgroups of objects v i for each v i T . It is possible to move two subtrees rooted at the node marked with a red circle, resulting in a different hierarchy within the same tree structure. Because there are n–1 internal nodes, it is possible to number 2 n 1 potential orderings of tree leaves.
Linear ordering is used to find such a sequence of vertices Ψ at which there is the most significant sum of similarities of two neighboring vertices. Formally, the number 2 n 1 of edges ordering can be described as:
L D ( T ) = arg max Ψ D Ψ T = arg max Ψ i = 1 n 1 S k Ψ ,   k Ψ + 1   ,
where k Ψ is the vertex of the graph T, and S is the similarity matrix.
The ordering starts with an internal node i and a graph fragment v located at this internal node. In the case of a subtree v, | v | are the number of edges in vertex v. The operation of the algorithm consists of finding the cost M(v) the optimal ordering of the subtree starting at node v, for each internal node v. Additionally, when v l ,   v r are two internal nodes for which v is the parent node, then for each pair u v l , w v r is estimated M(v,u,w), which is the optimal linear ordering for node v, assuming that the leftmost sub-node is u and the rightmost sub-node is v. The next step after determining the optimal ordering for the innermost parts of the graph, i.e., the lowest level of grouping of the dendrogram, is to compute M values for higher levels of grouping. Determining the cost M (v,u,w) precedes trying all pairs u,w, calculating the cost of sorting for each of them, and finally choosing the pair for which the value is the largest
M v , u , w   = max m v l , r , k v r , l M v l ,   u ,   m + M v r ,   w ,   k + S m , k ,
where v l r is the right subtree v l and v r , l is the left subtree v r . Since for any linear ordering of leaves v, there must be a vertex to the left of v as well as to the right of v, after estimating M (v,u,w) for all possible pairs u, w, find M (v) with the highest score. When v t is the core of the input tree T, then:
D   T = M   v t ,
Once M v t obtained the path that was chosen to reach M v t is determined. It allows for the actual ordering of the T leaves.
The final result of Czekanowski’s serialized method is a visualization of differences and similarities between Polish voivodeships’ human capital and innovation potential in the examined reference years.

4. Results

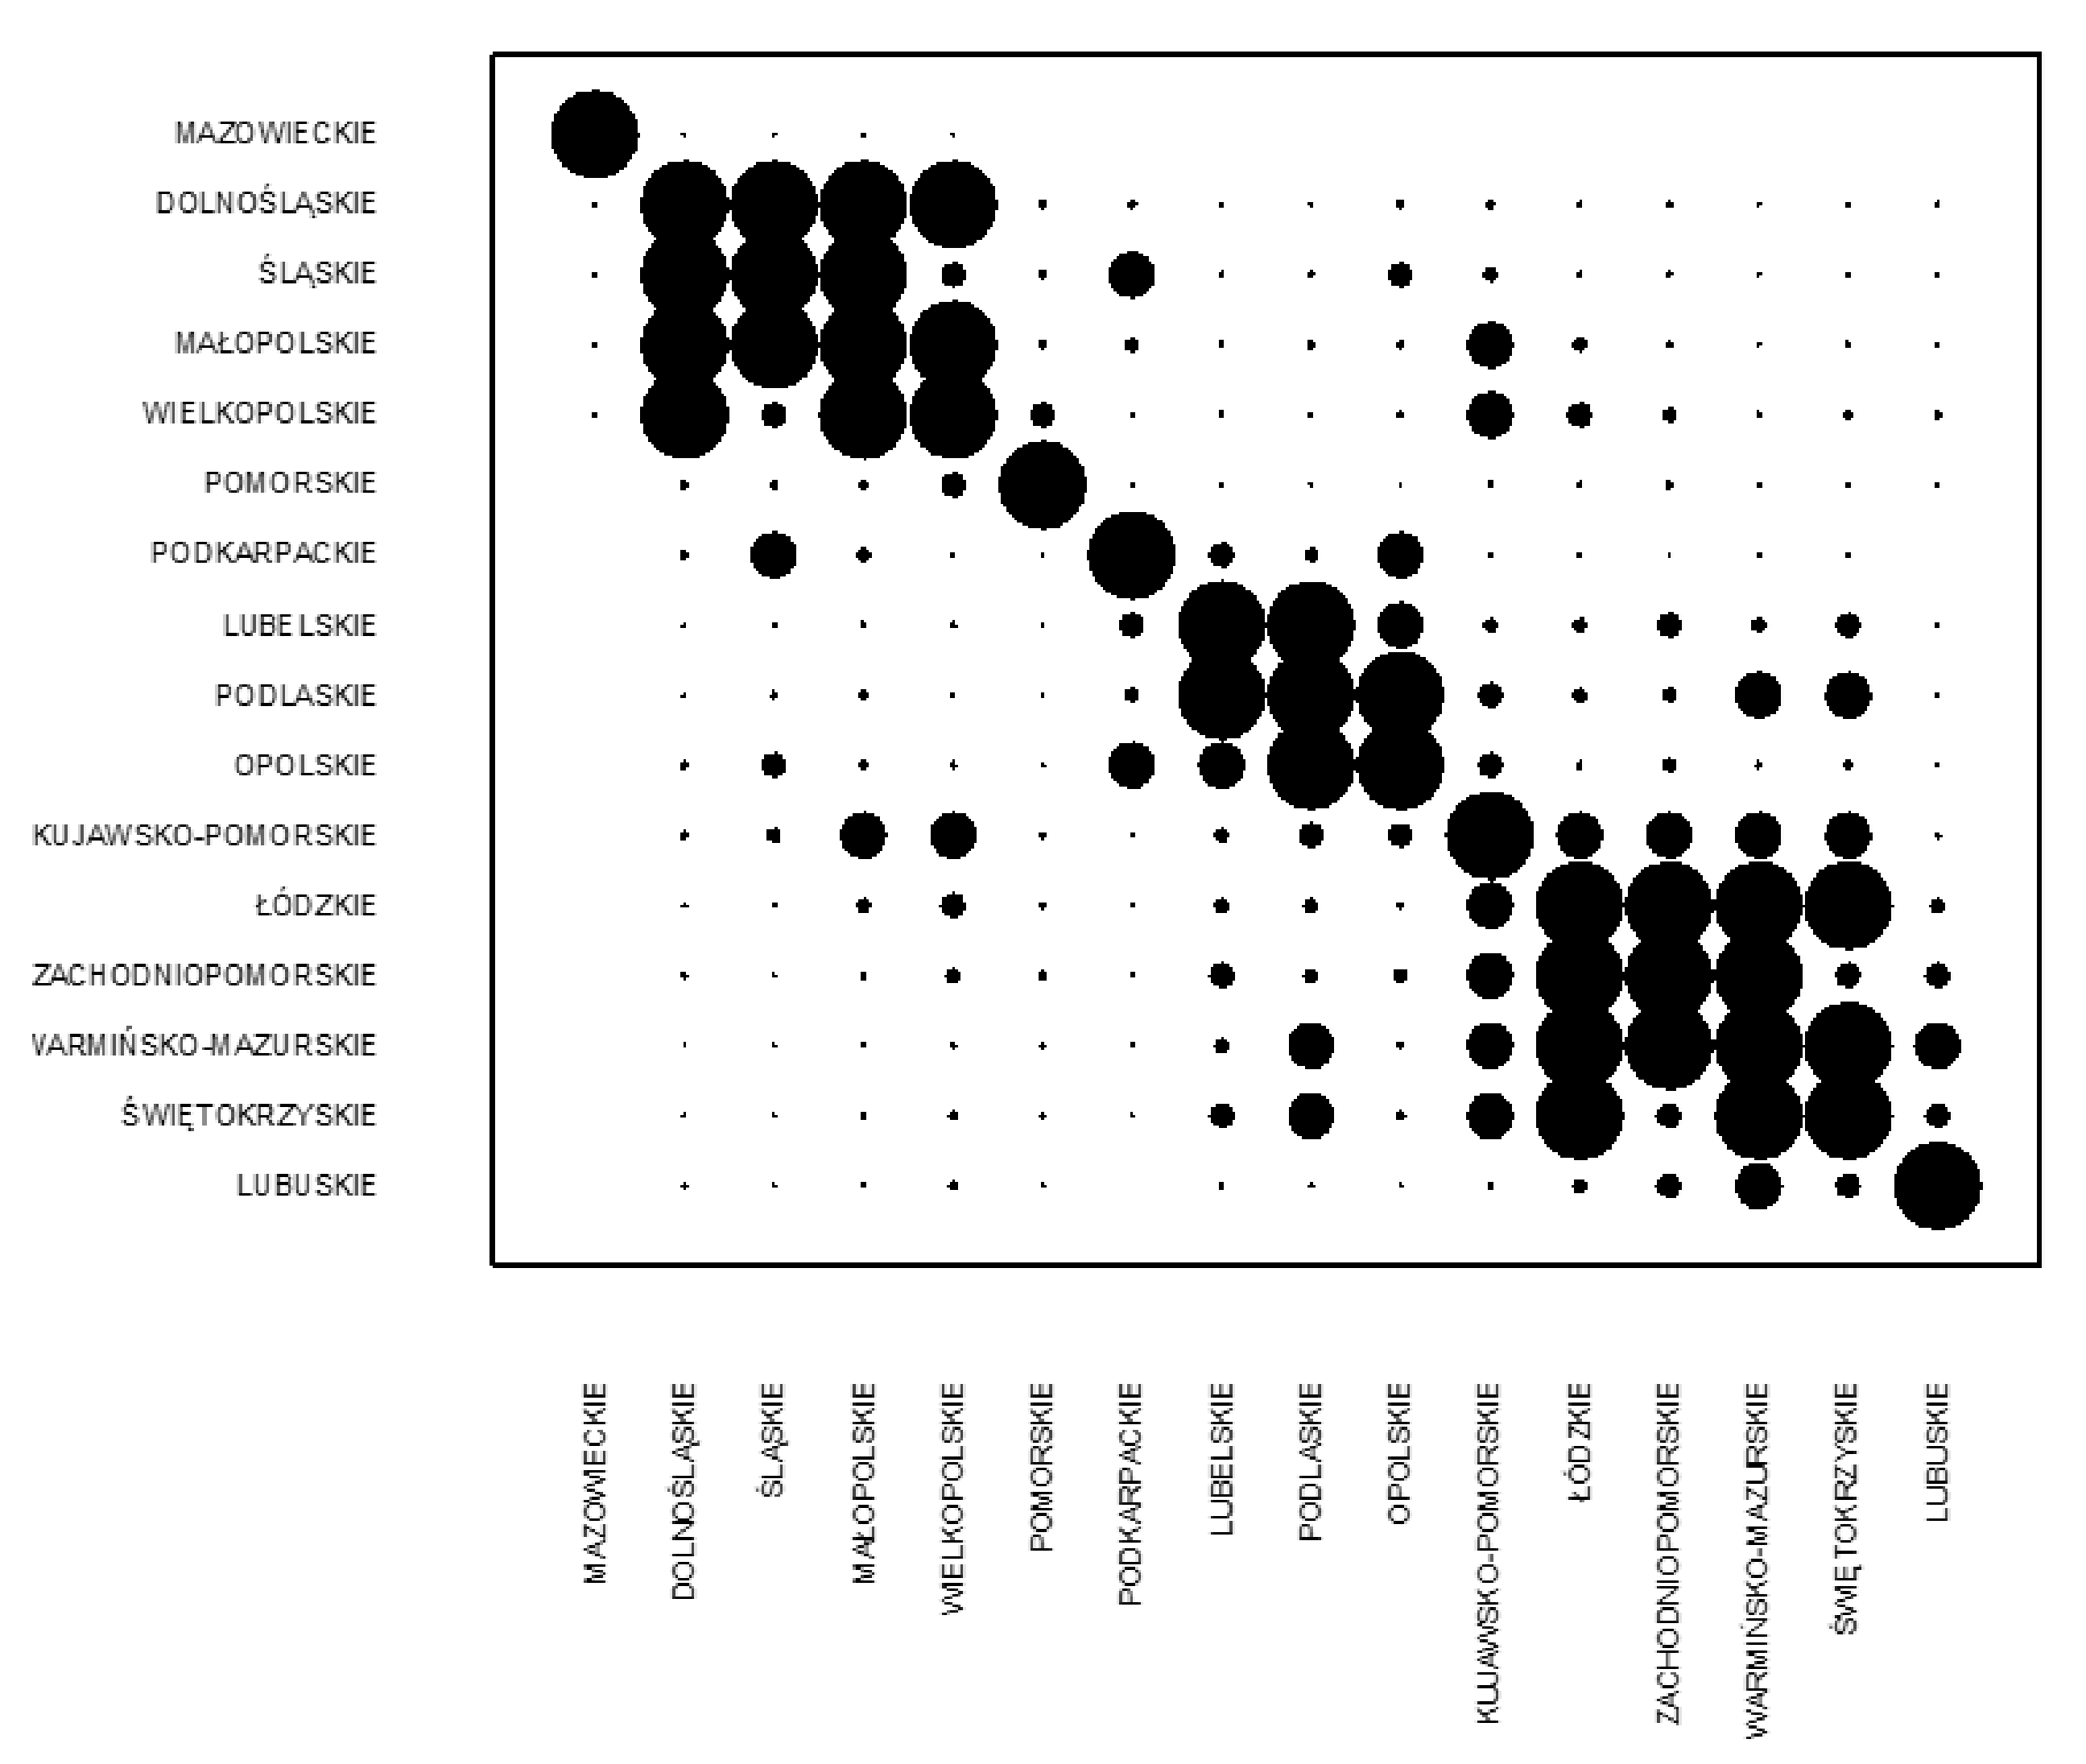
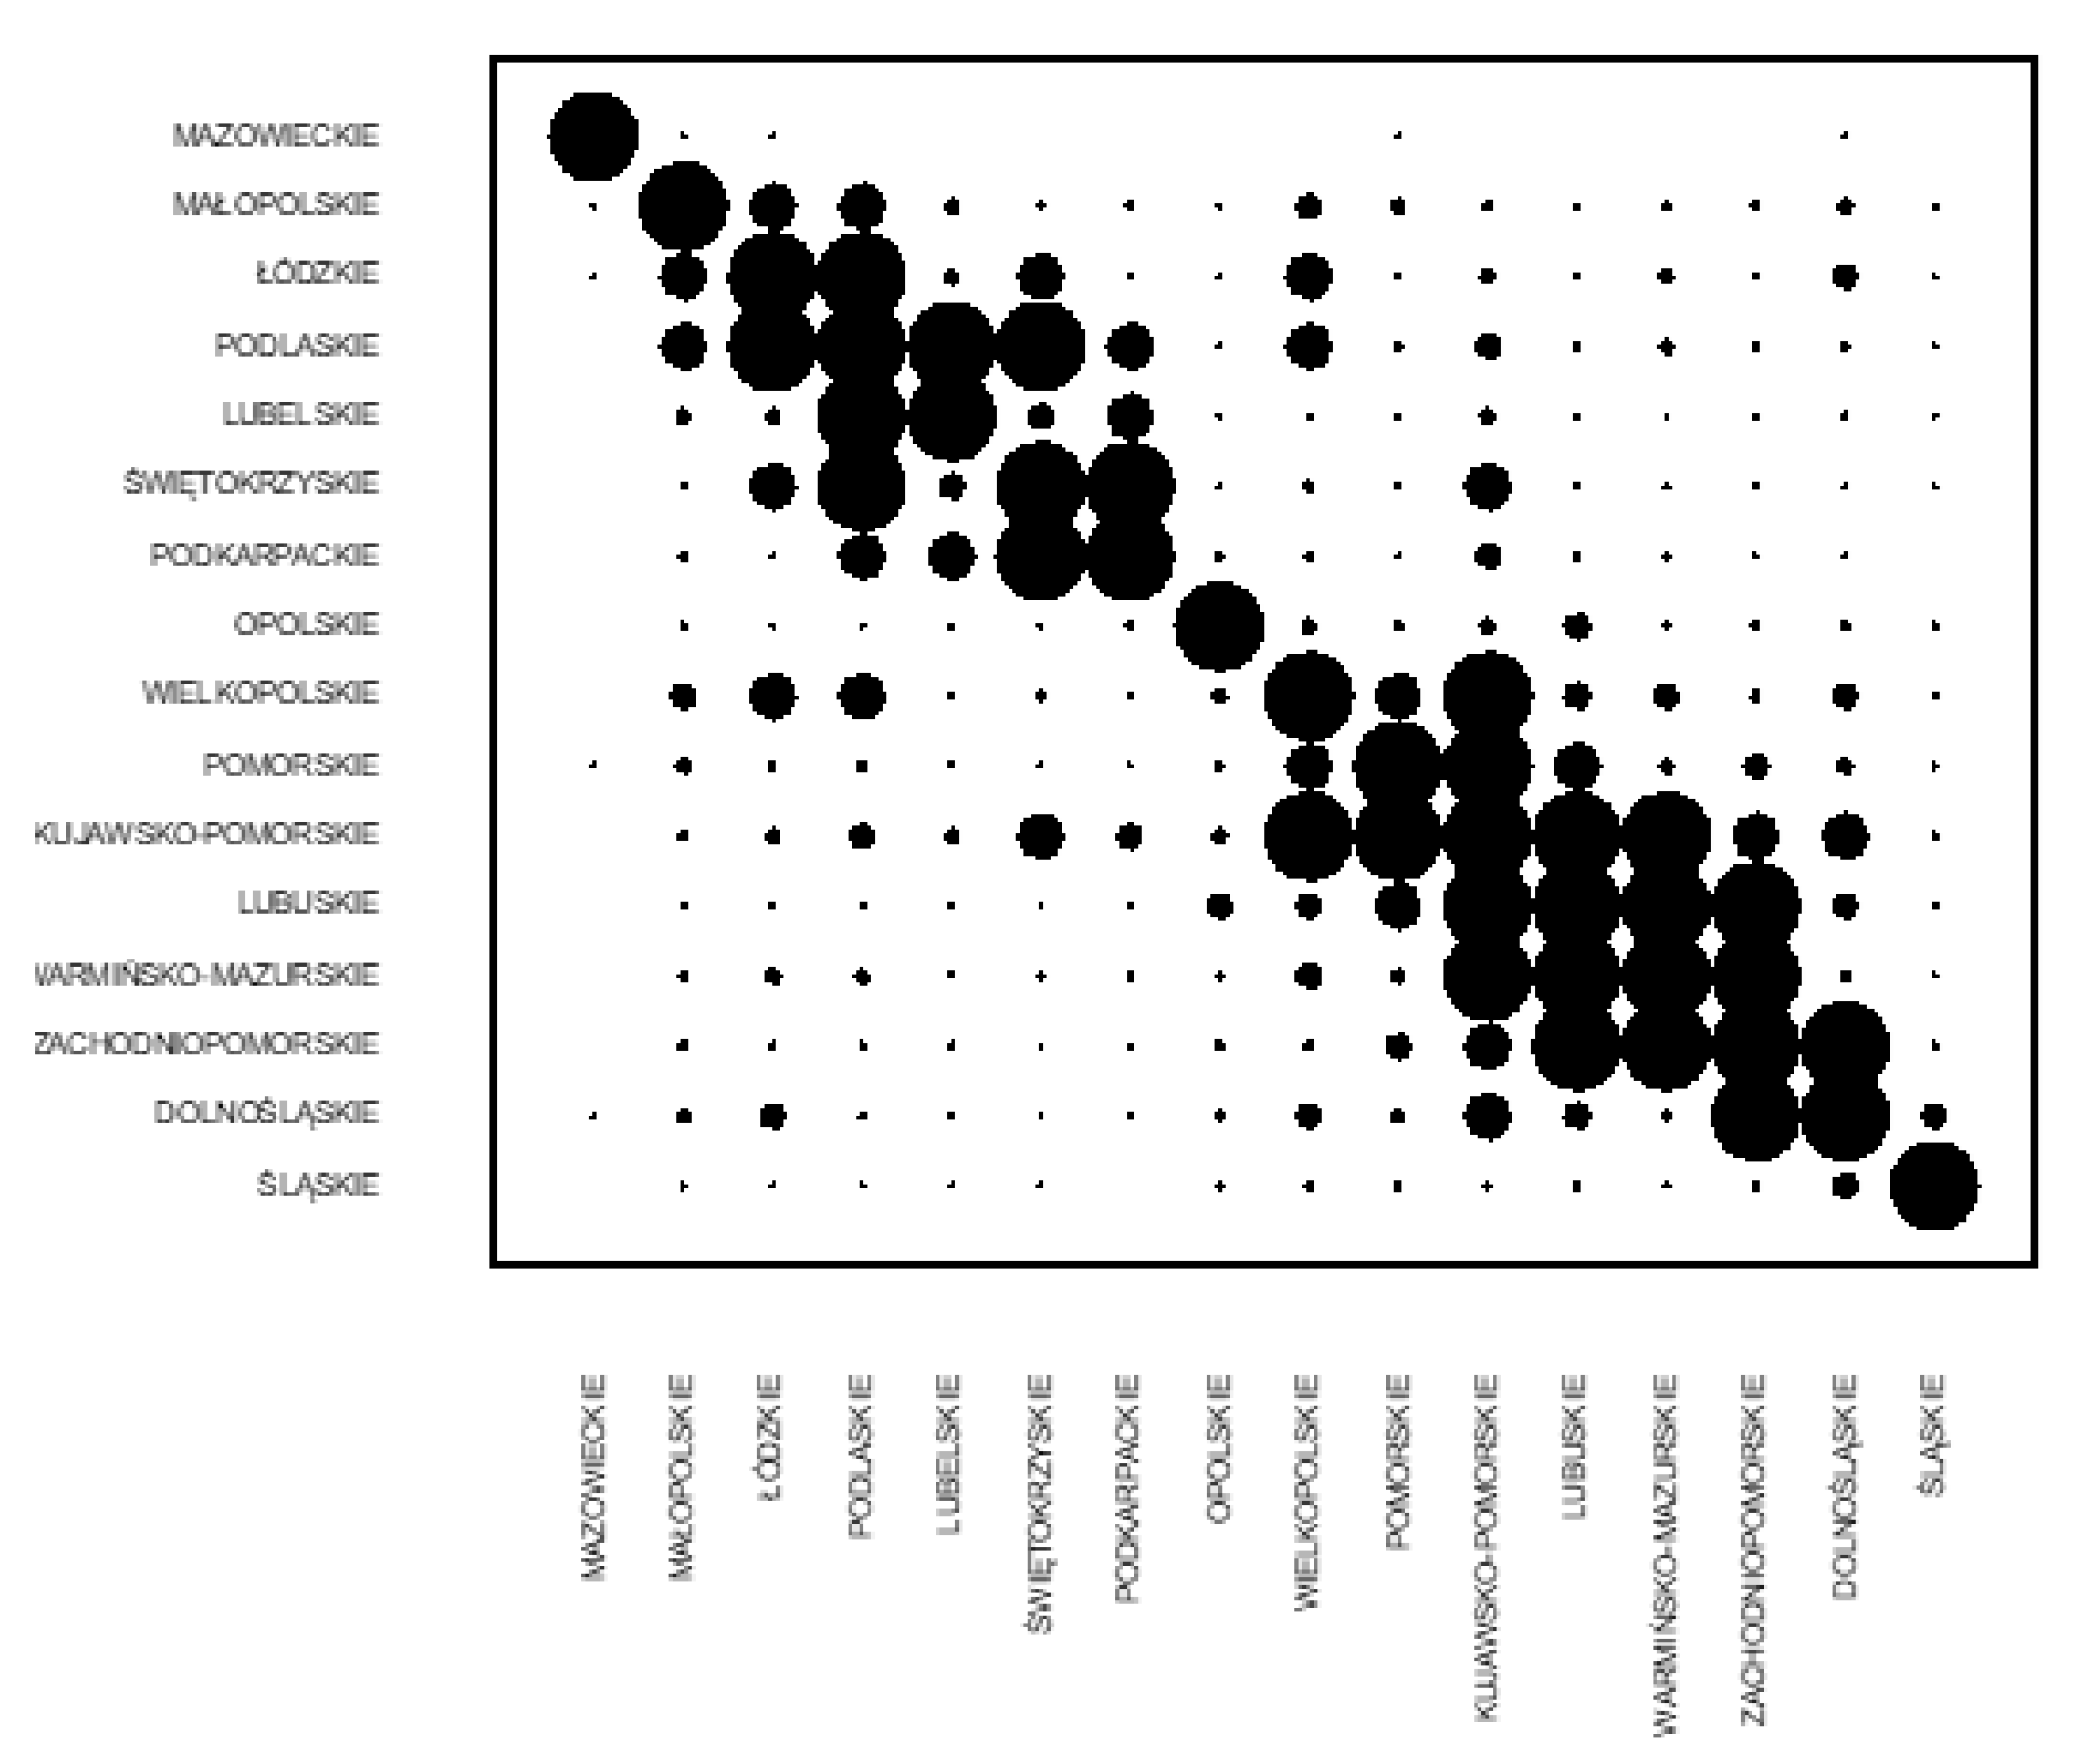
According to Czekanowski’s diagram in 2004 (see Figure 1), there is a significant difference in Mazowsze and other regions’ human capital status. In second place is Małopolska, which also diverges from other regions. Voivodeships with relatively close similarities are: Łódzkie, Podlaskie, Lubelskie. Świętokrzyskie, Podkarpackie, and Opolskie, which are voivodeships far from the other objects that do not show many similarities among themselves. On the other hand, the following voivodeships are close to each other in terms of the examined complex phenomenon: Kujawsko-Pomorskie, Wielkopolskie, Pomorskie.
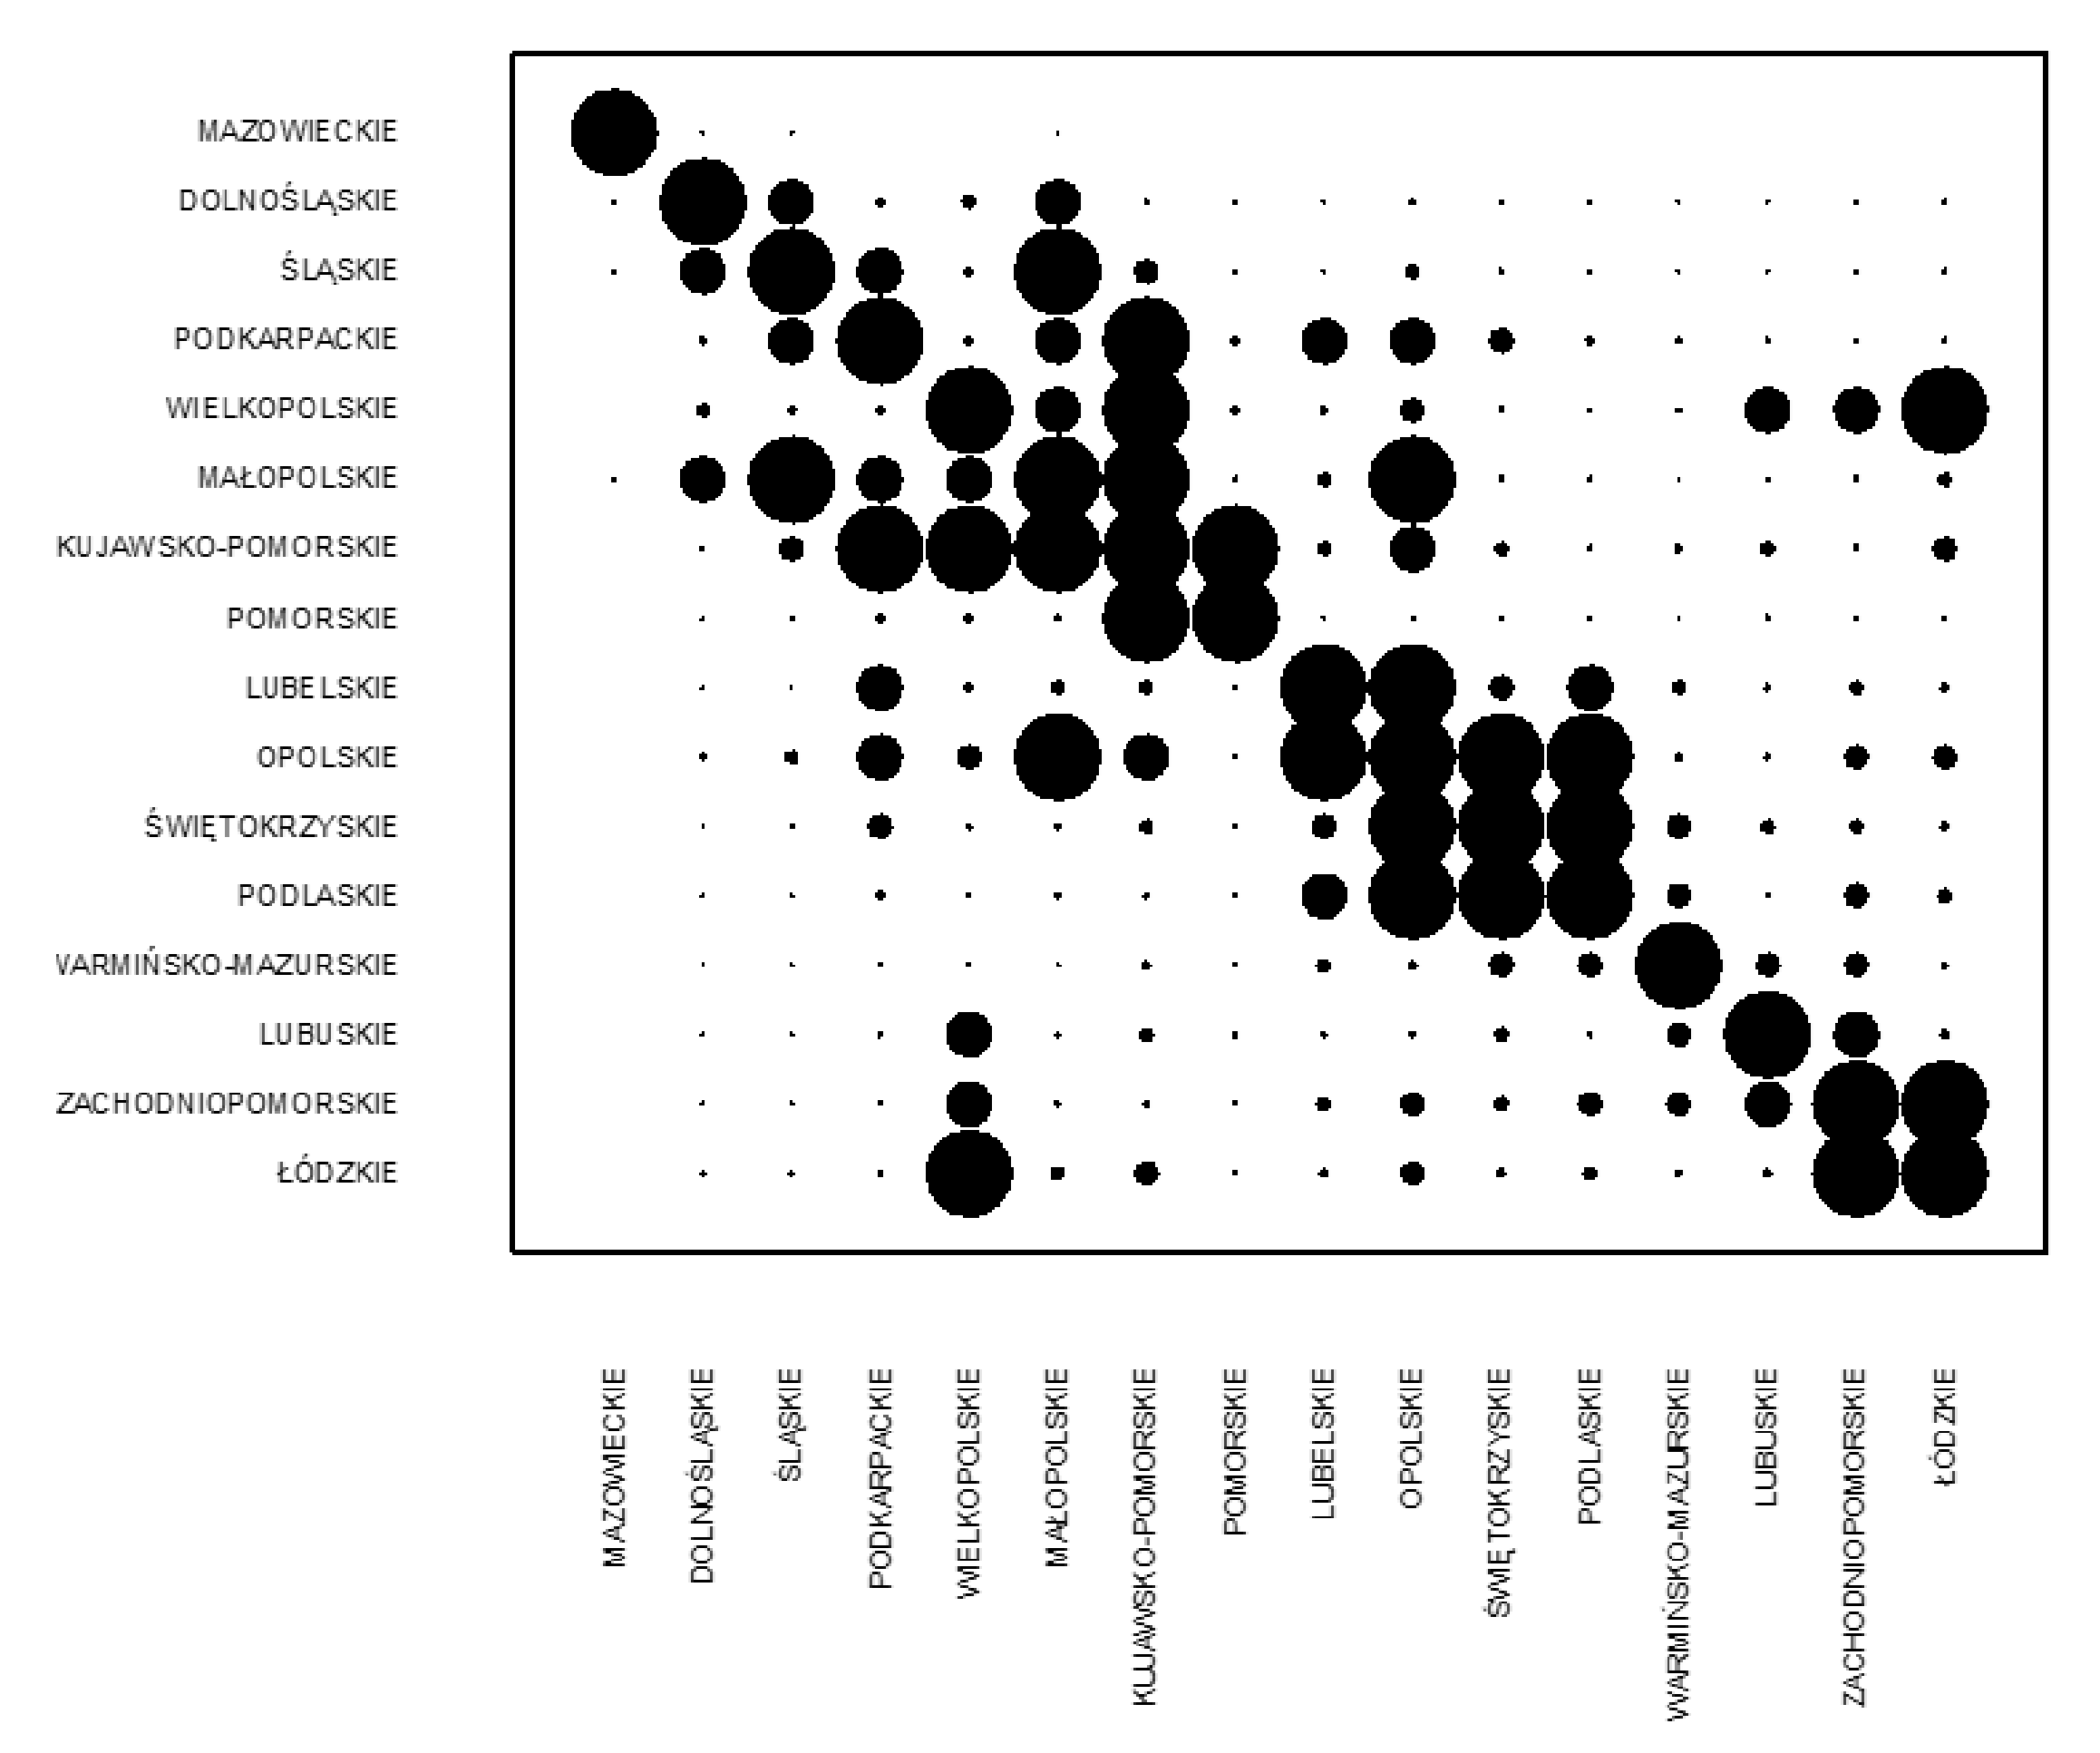
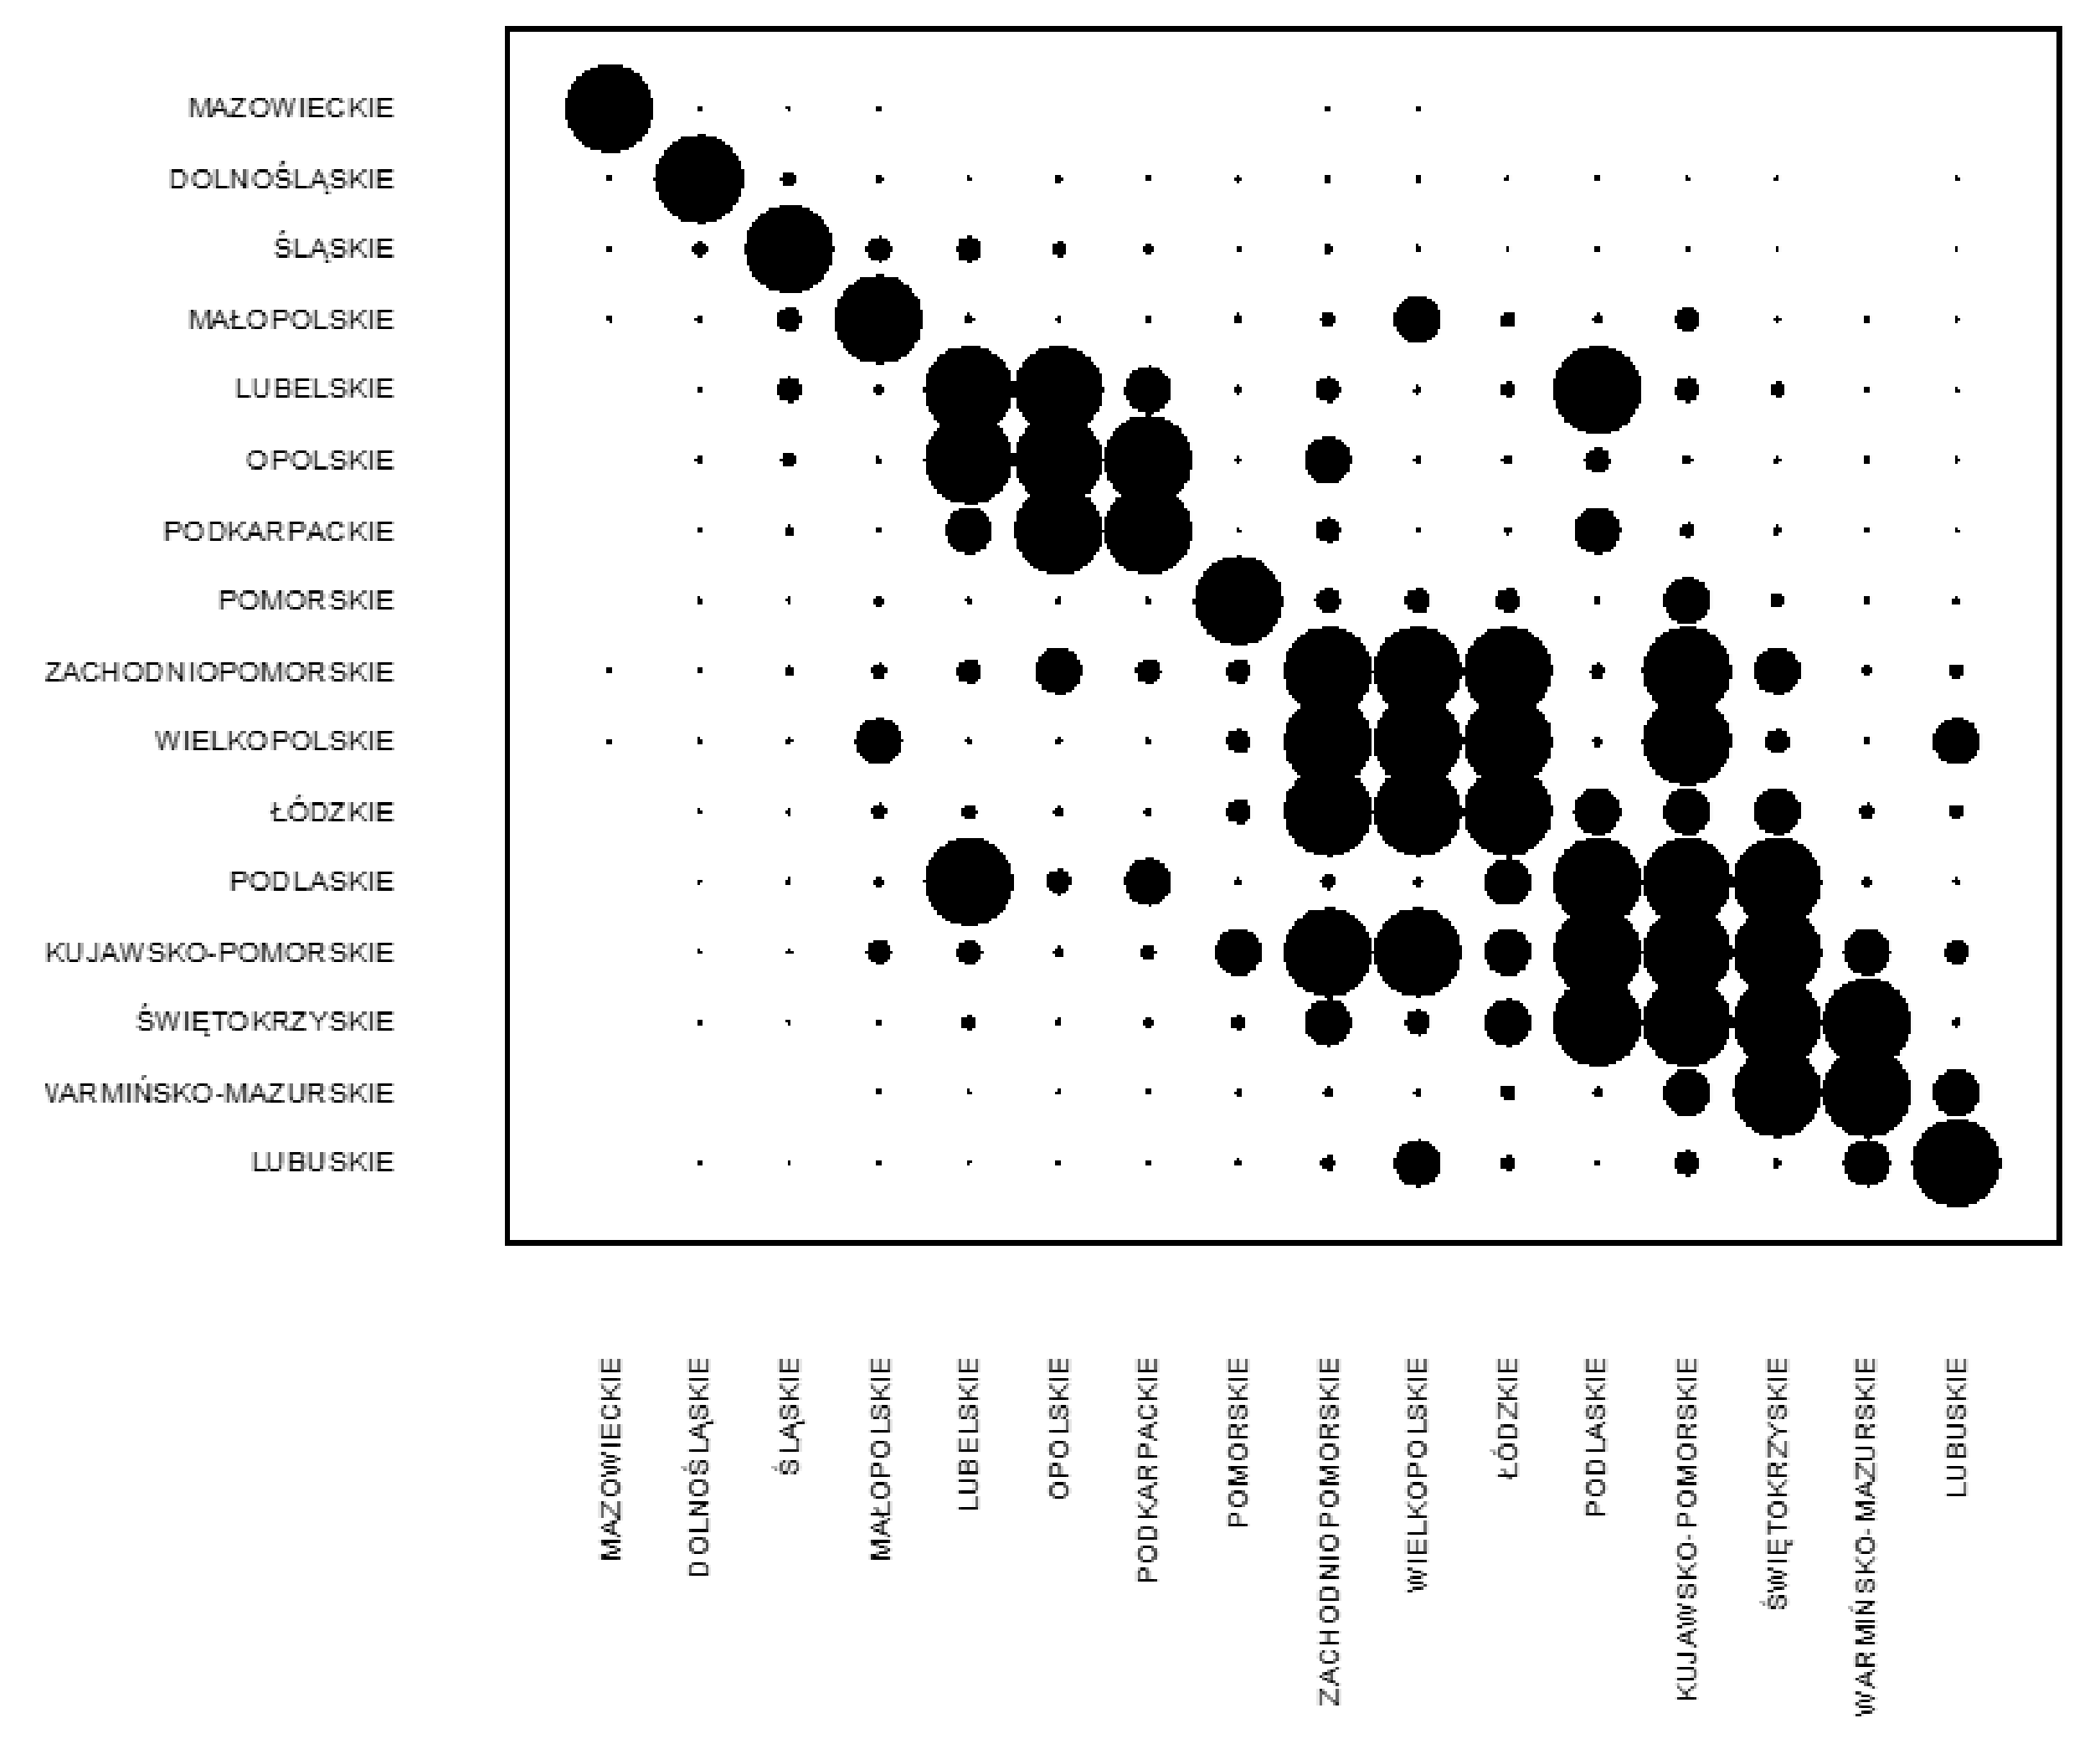
Observing the distance matrix, one may state that another group of voivodships with similar human capital potential is Zachodniopomorskie and Dolnośląskie, and just after them Lubuskie and Warmińsko-Mazurskie. The list closes with Dolnośląskie and Śląskie. Based on a preliminary analysis of data for 2008 in the context of human capital, one can see that the gap between voivodeships has been maintained (Figure 2).
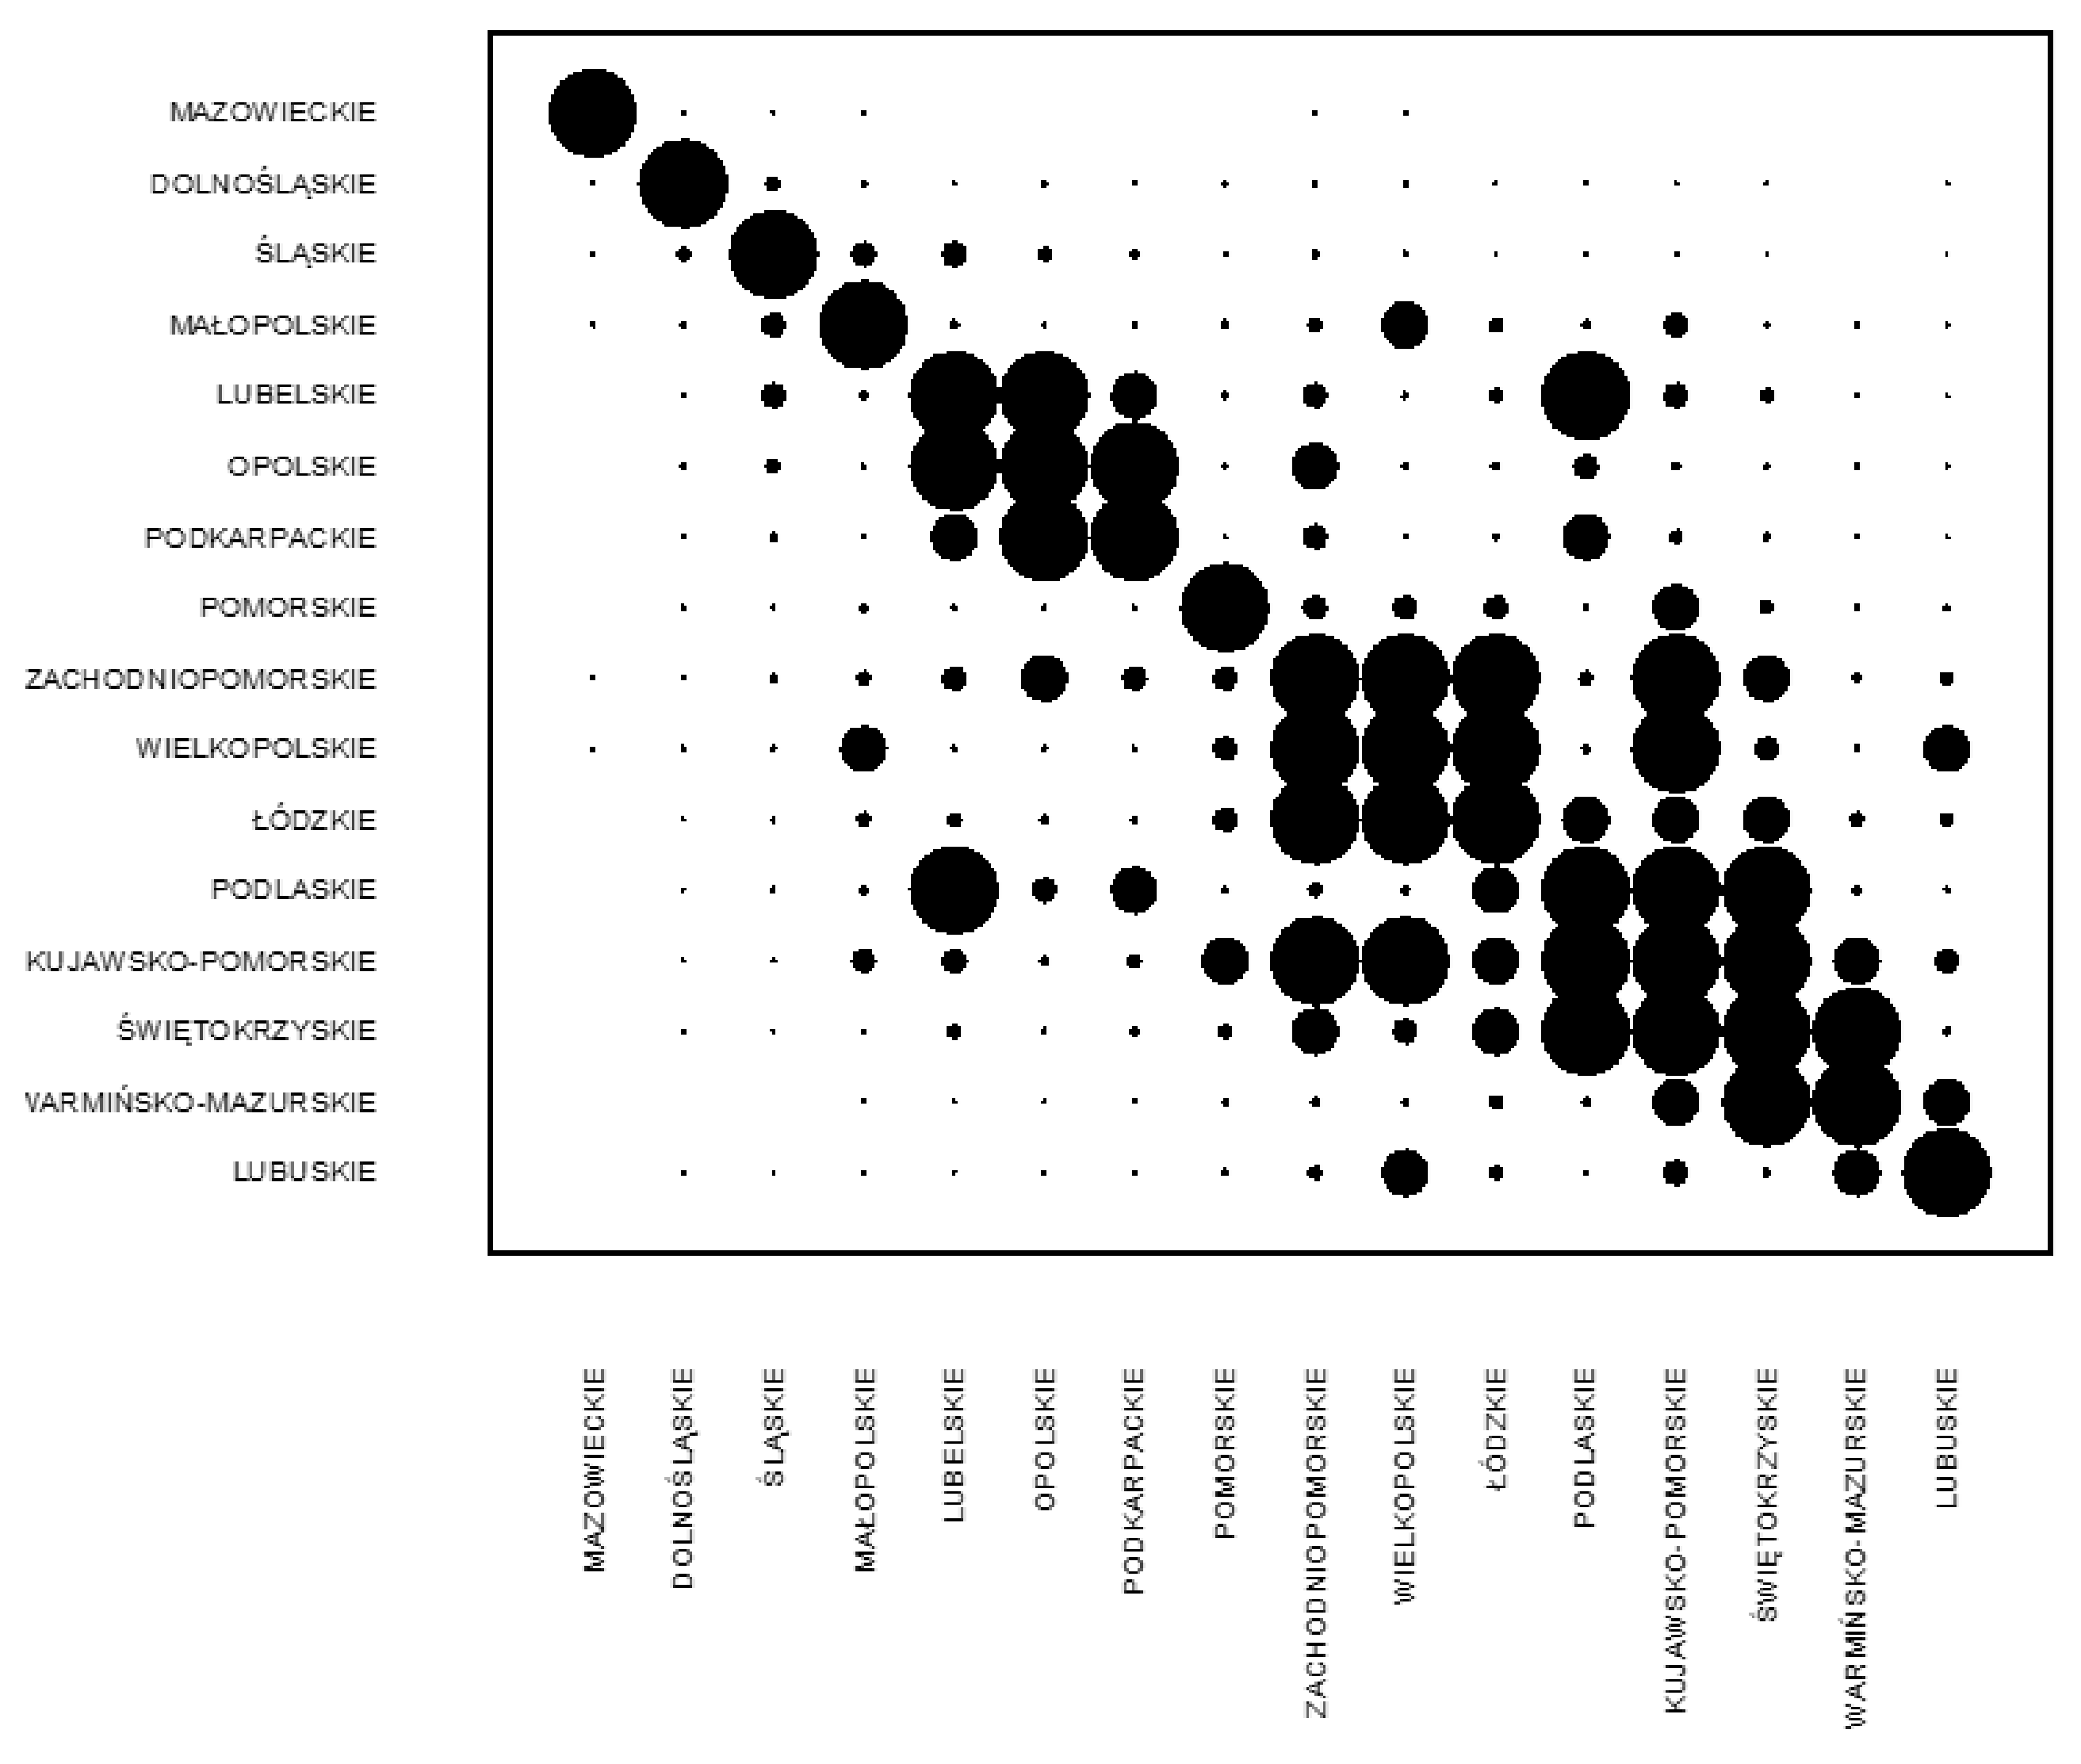
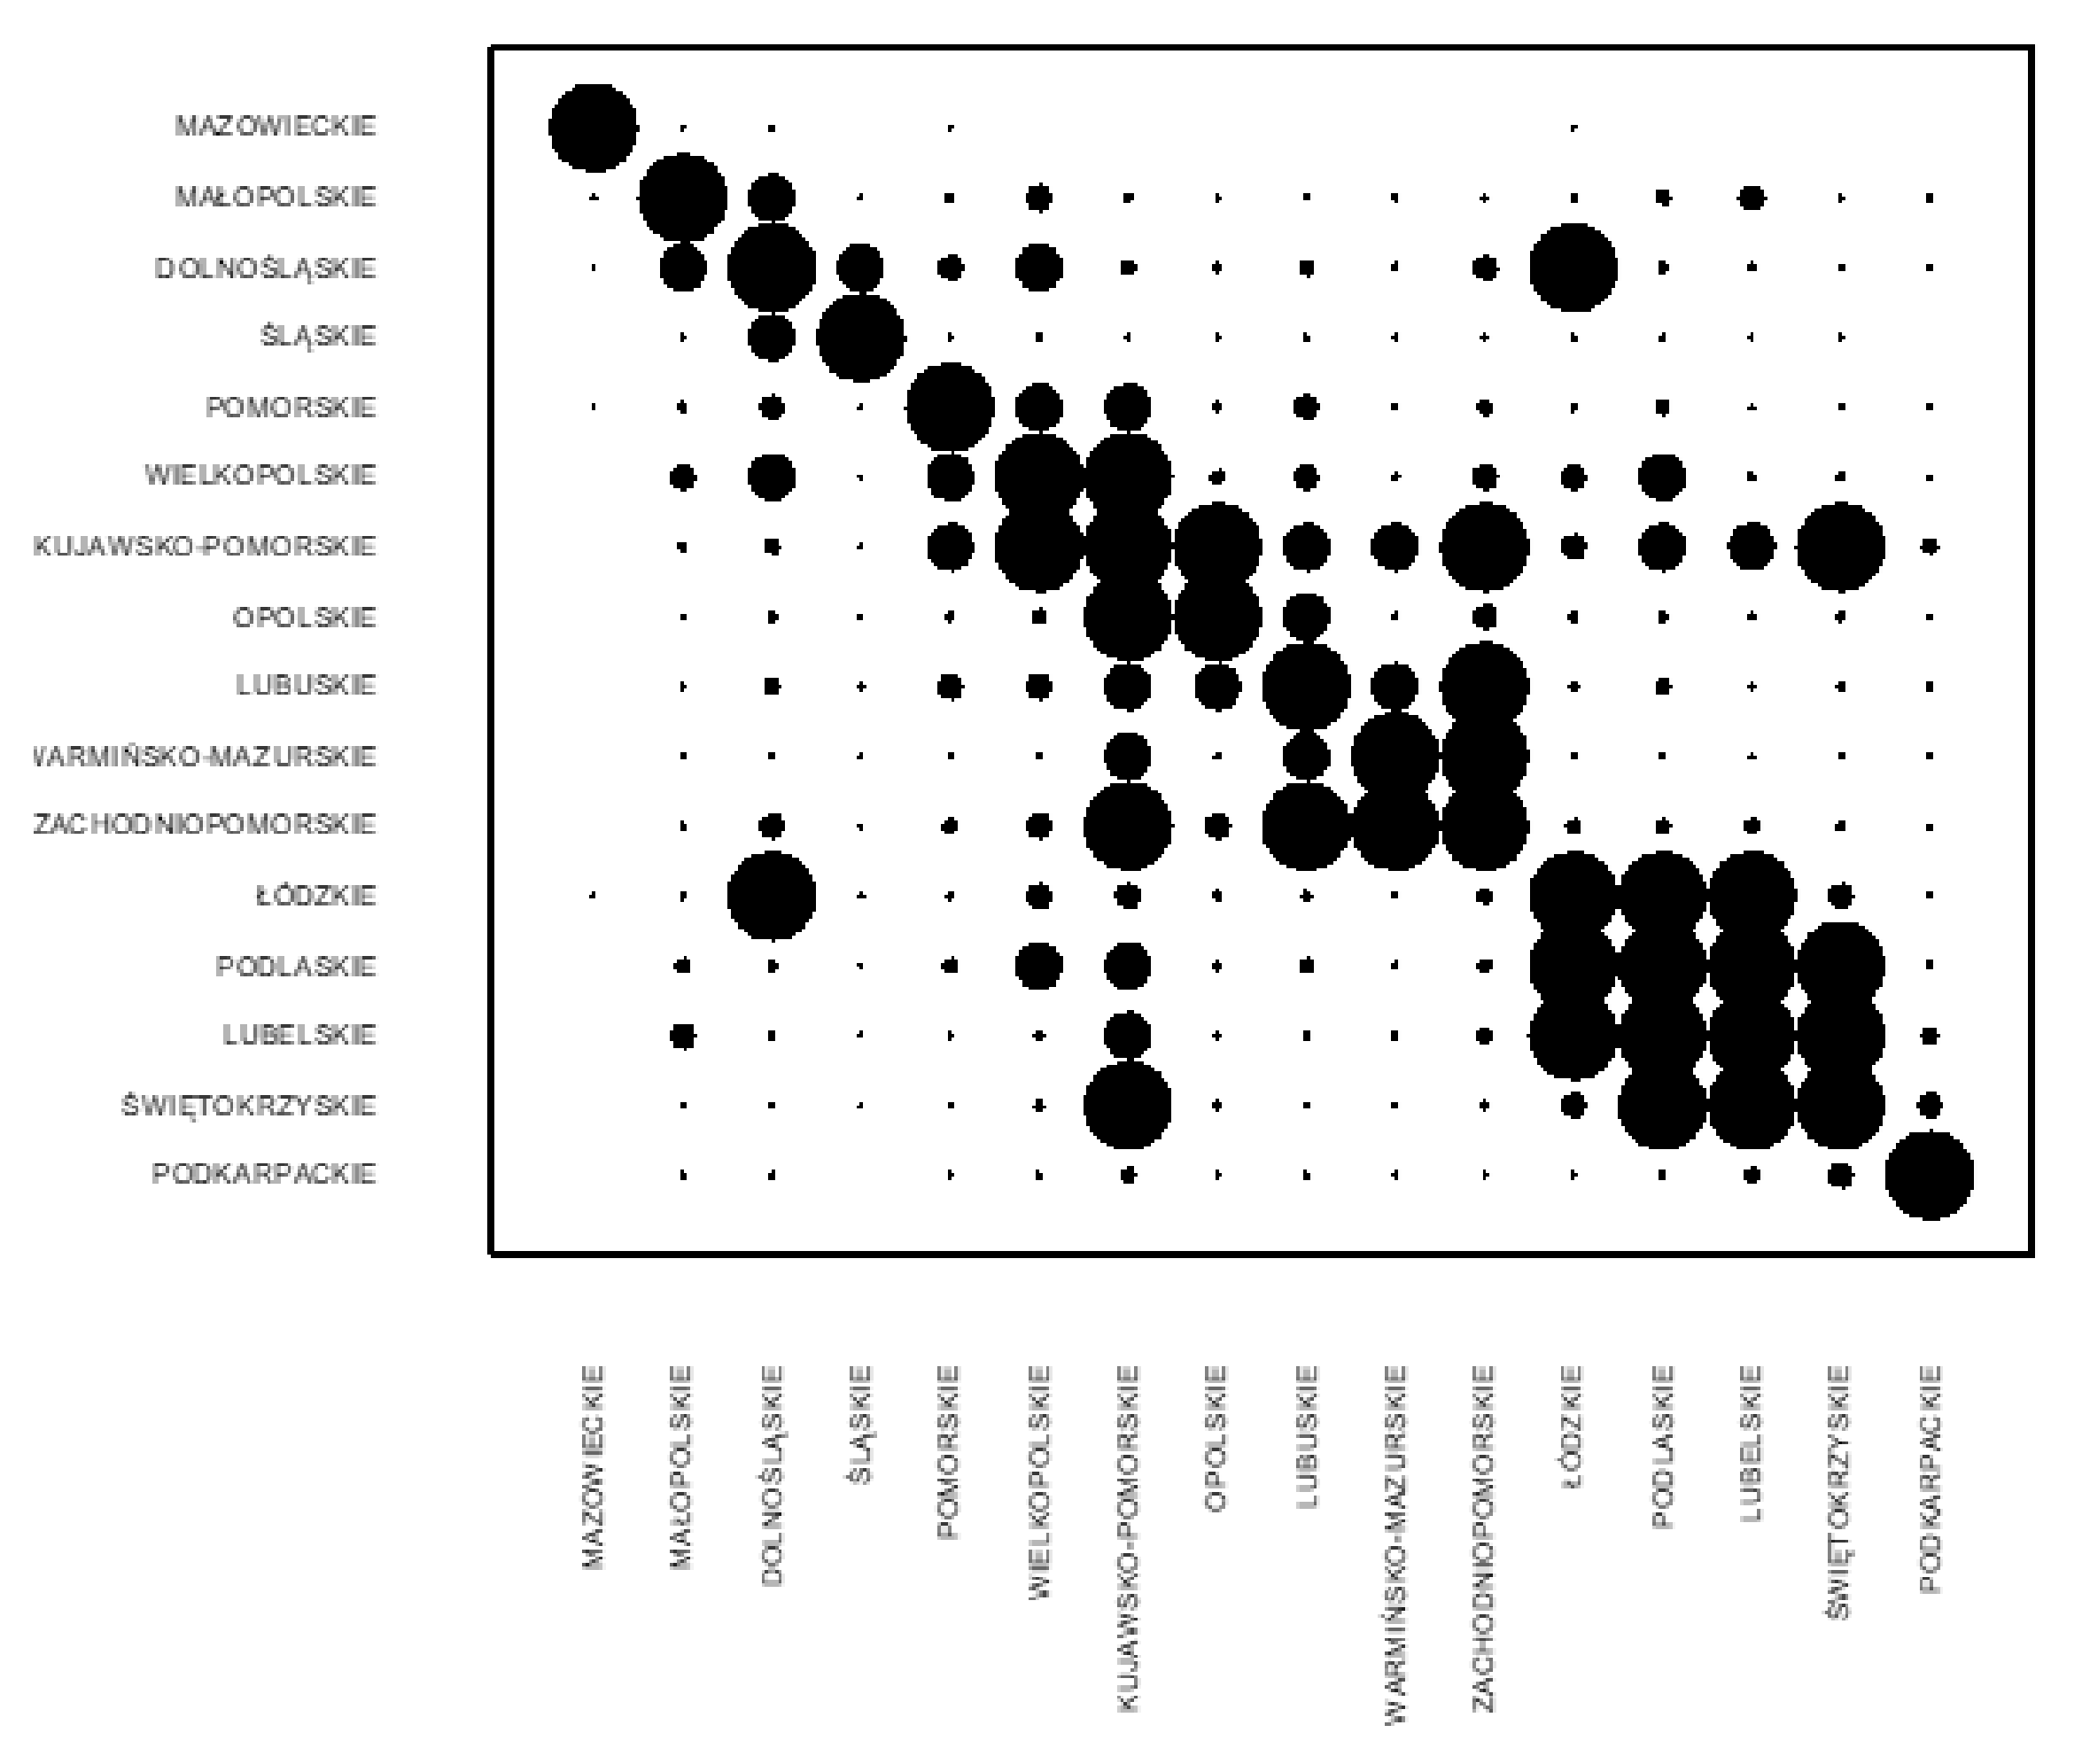
In 2014, the Silesian Voivodeship joined the group of leaders. However, a further escape of the most developed regions in the studied phenomenon area is observed concerning the other voivodeships. The worst results in terms of human capital were recorded in four voivodeships from the eastern wall: Lubelskie, Warmińsko-Mazurskie, Świętokrzyskie, Kujawsko-Pomorskie and Podlaskie. (see Figure 3).
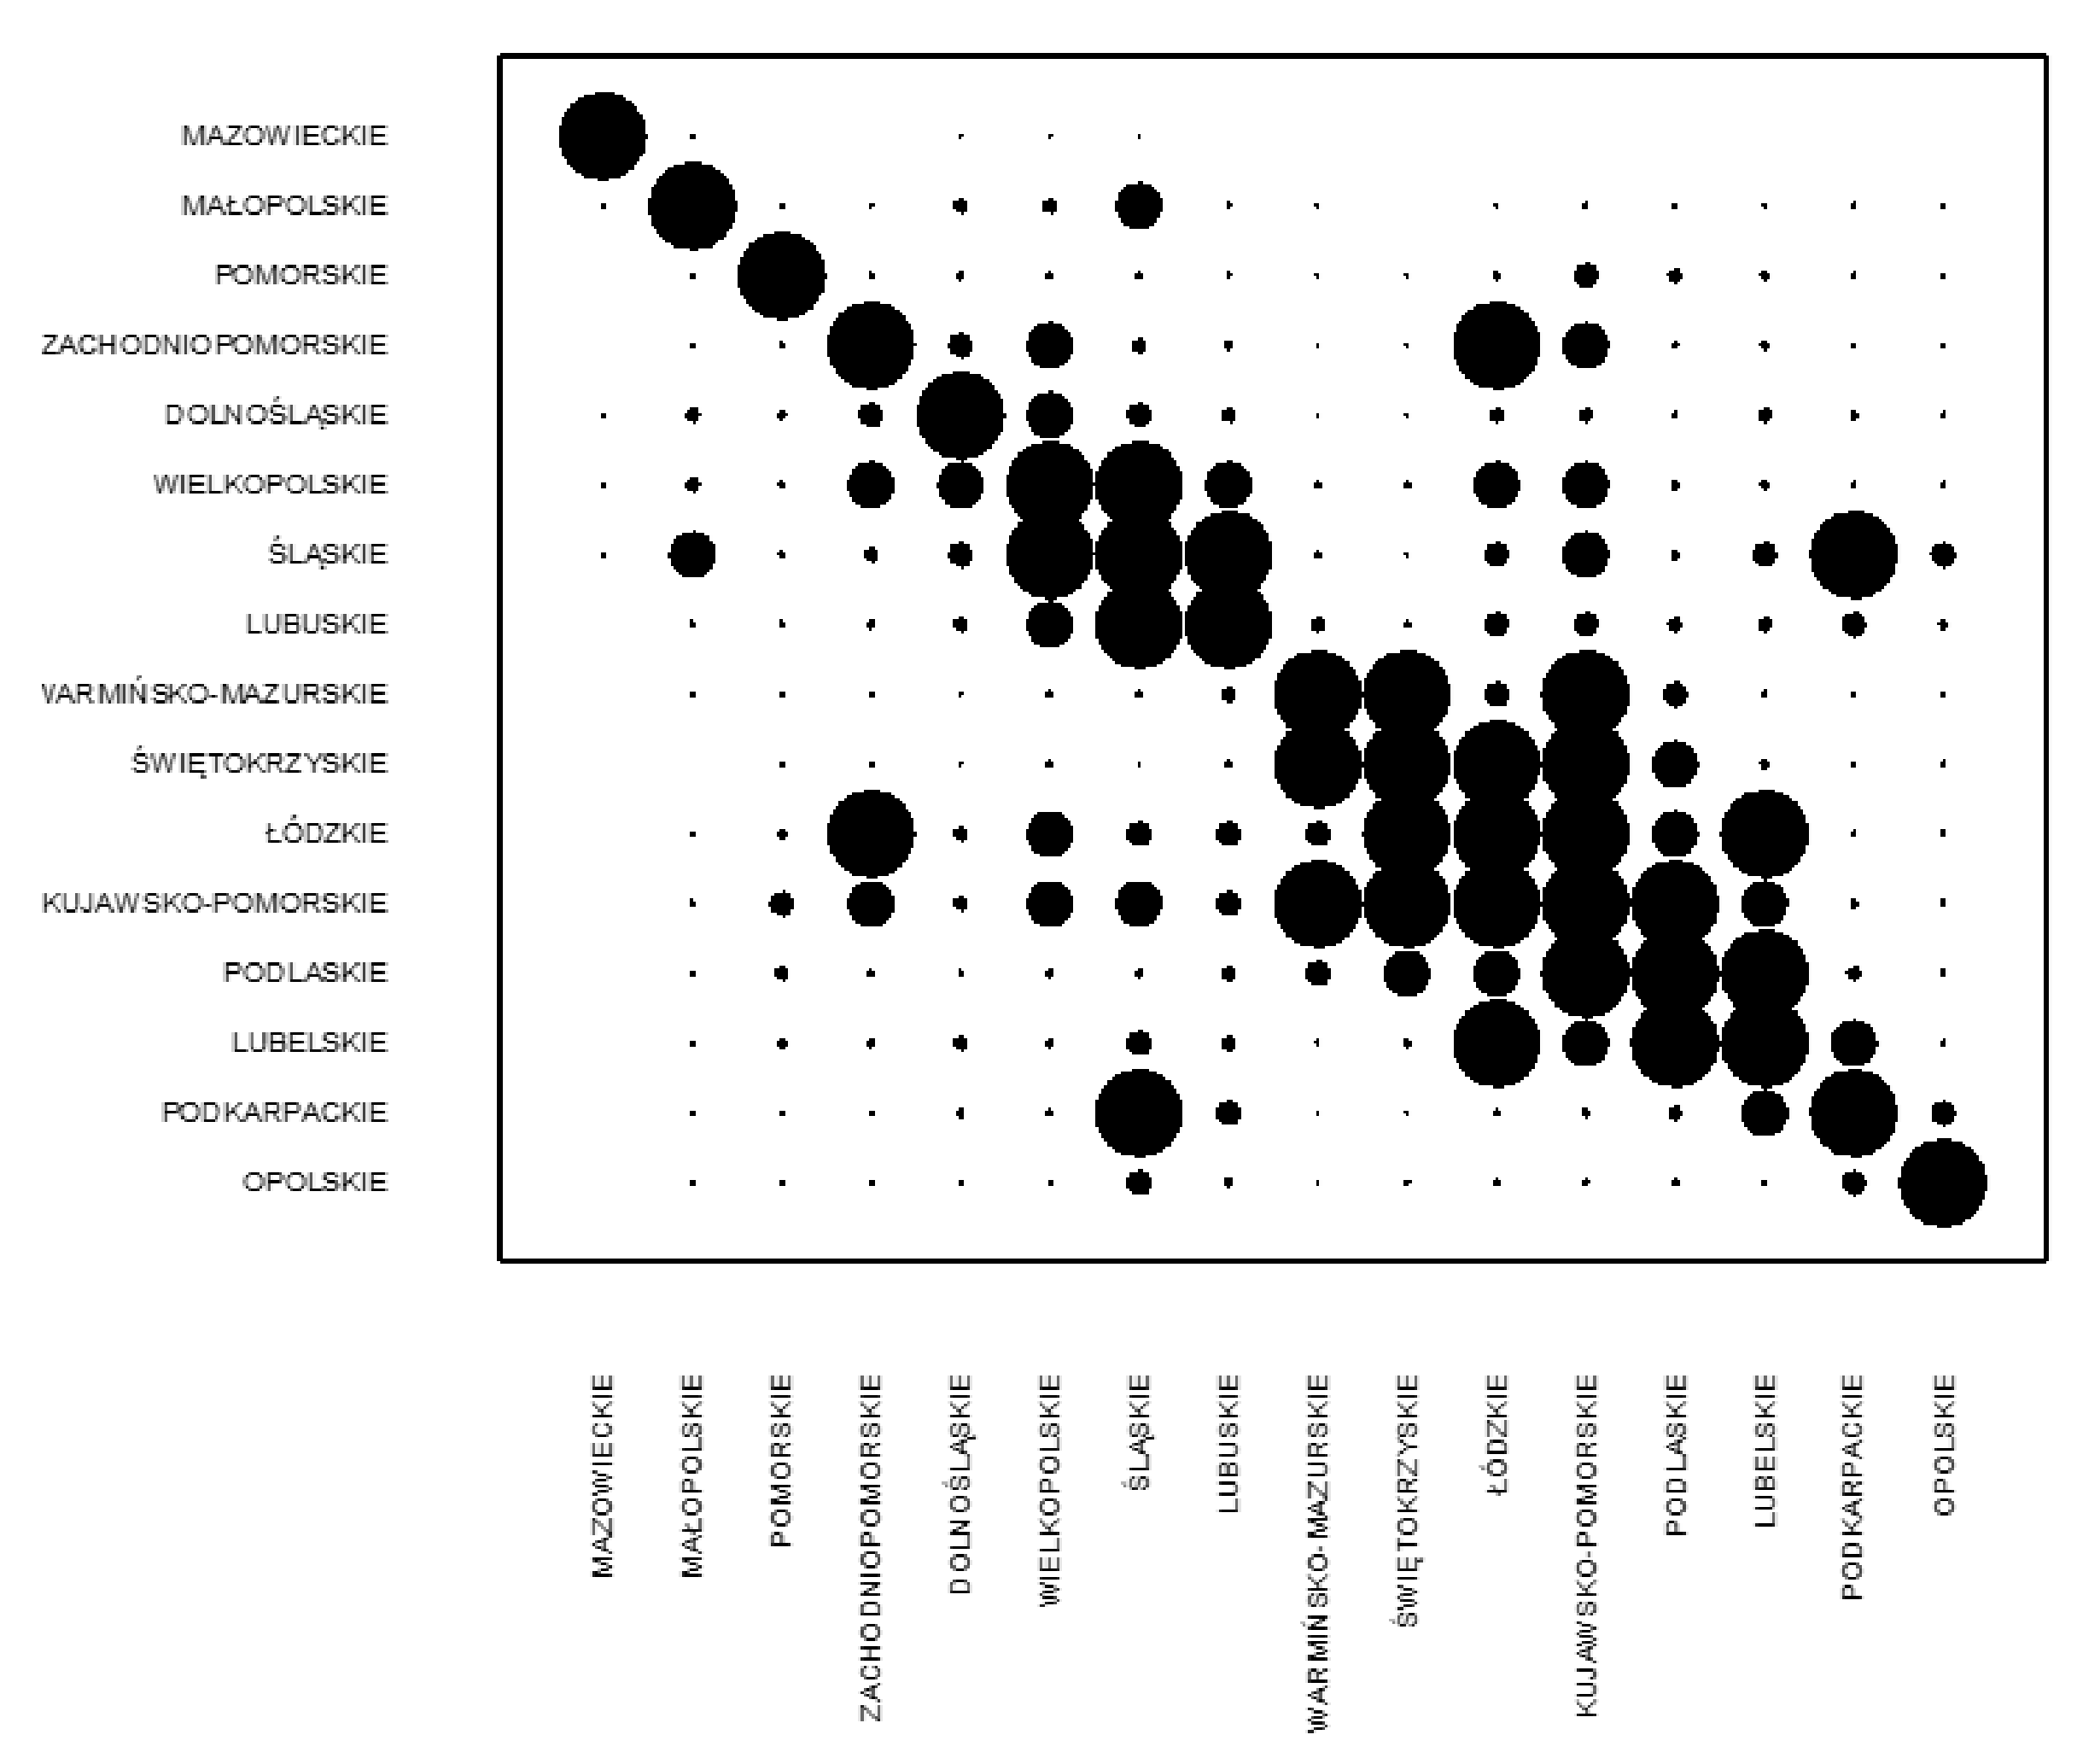
In 2018, in the context of the level of human capital, five leaders can be distinguished: starting from Mazowieckie, Małopolskie, Dolnośląskie, Śląskie and Pomorskie Voivodeships. These provinces show weak similarities to each other. The process of their distancing from the other regions is noticeable. In 2014, the worst results were observed in four provinces from the eastern wall (see Figure 4).
Similar innovativeness in Polish voivodeships is presented in Figure 5, Figure 6, Figure 7 and Figure 8 (for the years: 2004, 2008, 2014, and 2018, respectively).
In the initial year of analysis (2004), three clusters of voivodeships with a similar state of innovation can be distinguished. Mazowssze leads and does not belong to any of them. Dolnośląskie, Śląskie, and Małopolskie can be included in the first group of provinces similar to each other and performing better than the others. The second group includes Lubelskie, Podlaskie, and Opolskie Voivodeships. The cluster of voivodeships with the weakest innovation potential are Łódzkie, Zachodniopomorskie, Warmińsko-Mazurskie, and Świętokrzyskie—see Figure 5.
Figure 5. Czekanowski diagram for innovativeness in 2004. Own elaboration based on Statistics Poland (SP).
Sustainability 13 12620 g005
In 2008 there was a more intense race between the regions with the best innovation performance. Podkarpackie province significantly improved its position, taking fourth place (Figure 6).
Figure 6. Czekanowski diagram for innovativeness in 2008. Own elaboration based on Statistics Poland (SP).
Sustainability 13 12620 g006
In 2014, unfortunately, one can observe the process of the formation of a larger cluster of provinces with weak innovation potential. It includes Podlaskie, Kujawsko-Pomorskie, Świętokrzyskie, and Warmińsko-Mazurskie. The following voivodeships are slightly higher in the hierarchy concerning the level of innovation: Zachodniopomorskie, Wielkopolskie, and Łódzkie (Figure 7).
Figure 7. Czekanowski diagram for innovativeness in 2014. Own elaboration based on Statistics Poland (SP).
Sustainability 13 12620 g007
Among the leaders in 2018, five provinces increased their distance to the others and themselves. The regions at the top of the ranking are Mazowieckie and Małopolska. The next place was occupied by Pomorskie, Zachodnio-Pomorskie, and Dolnośląskie provinces. At the lowest positions are the Lubelskie, Podkarpackie, and Opolskie regions (Figure 8).
Figure 8. Czekanowski diagram for innovativeness in 2018. Source: Own elaboration based on Statistics Poland (SP).
Sustainability 13 12620 g008

5. Discussion

The results we obtained confirm previous theoretical and empirical studies. It turns out that the distribution of human capital largely coincides with the geographical and historical accumulation described in the literature for the idea of unsustainable development [41,42,43,44,45].
Higher quality human capital is found in regions with better infrastructure and large urban centers. There are also more innovative firms and better access to financial capital. We can relate to Florida’s creative class or the triple helix theory described [37].
According to the research results, we can see a clear division into less and better-developed voivodeships, which to a large extent corresponds to the borders of the partitions. The 123 years of Poland’s absence from the map of Europe as part of three different economic organisms have left a heavy mark that is still visible today. It could also be the effect of the communist period, i.e., the years after WWII to the 90s. The weakest in terms of human capital were the provinces of the former Russian partition, i.e., Podlaskie, Lubelskie, and Świętokrzyskie, but also Łódzkie.
Additionally, the approach to the law was characterized by institutional weakness. A contrast to these provinces is Mazowieckie, which was also part of the Russian partition. Today it achieves the best results of the Polish regions. However, it should be remembered that this result is mainly influenced by Warsaw, which benefits from its physical and financial capital. Human capital, in turn, is primarily created by the immigrant population, i.e., well-educated representatives and skilled workers from all Polish regions. However, not the best results are observed in the Podkarpackie voivodeship, especially in human capital (the level of innovation in this voivodeship is above average). This region was located in the Austrian partition, on the Austro-Hungarian Empire’s fringes, where often significant infrastructural investments did not reach, and the population suffered from shortages (“Galician poverty”). Podkarapcie is also less urban with few universities. Małopolska, in terms of human capital and innovation, is one of the leading Polish regions, despite its membership in the former Austrian partition. It is due to the tremendous historical significance of Kraków (the former capital of Poland), an academic center (Jagiellonian University, as one of the oldest universities in the world), and a cultural center. Even in the times of the Austrian annexation, the city’s cultural life did not die out (limited independence during the Republic of Cracow or the period of Galician autonomy after the annexation of Cracow by Austria-Hungary).
These historical human capital accumulation factors partly explain the provinces’ regional development differences, but they do not determine future development. The advantage of the Mazowieckie voivodeship is the presence of the capital city, which benefits from its rights, i.e., many companies, government institutions, universities, professional opportunities, and rich cultural offerings. The growth centers are also big urban centers like Cracow, Poznan, Gdansk, the Silesian agglomeration, and Wroclaw. In regions where there is a higher level of human capital, a higher degree of innovation and socio-economic development is also observed, which confirms the assumptions of the theory of endogenous development [12,25,27] or innovation [20,21,22,23,24].
We have taken into account the Czekanowski [49] method used in the delimitation of regions but we have improved it based on the serialization method [50,51,52,53,54,55,56,57,58,59]. Additionally we have presented the measurement of human capital, combining different advantages of measures described earlier in the literature [48].
Our findings will bring additional value to the question of whether human capital is being developed and used effectively. For public authorities, it will also be essential to determine which component of human capital influences the development of innovation and how regional disparities can be compensated. Further regional research is needed on the differences between the regions, especially on the spatial and temporal factors. Differences in human capital development can explain the dispersion within innovation and the level of socio-economic development of regions.

6. Conclusions

The main conclusion from the analysis of human capital and invention in Polish voivodeships is that there is considerable regional variation. There is a significant dissonance between the Mazowieckie voivodship and the remaining voivodships. In 15 years of the studied period, the disproportion did not decrease but increased. It is challenging to distinguish clusters of voivodeships with a similar structure during the entire period. Such an uneven distribution of human capital and innovation can be a problem for the balanced development of Polish regions. Although from the country’s point of view, a higher level of economic growth was achieved and human capital itself also increased, this did not translate into a reduction of regional disproportions.
Based on Czekanowski’s serialized method, it can be concluded that the level of the human capital of this resource is higher in regions where in the past there were better institutions, understood as an efficient state and an approach to the common good. In this study, we constructed a measure to define human capital consisting of an extensive set of characteristics incorporating cost, income, learning indicators, and qualitative methods. Additionally, the measure of innovation included few variables defining invention, learning potential, sales of innovative products, etc. The next research stage must consider whether there is a long-term relationship between human capital and innovation at the regional level, and, if there is, whether human capital is fully utilized in creating innovation. For this type of research, it is necessary to apply methods from the scope of multidimensional data analysis.

Author Contributions

M.J.: Conceptualization; methodology; validation; formal analysis; investigation, writing—original draft preparation; writing—review and editing; visualization. M.S.: Conceptualization; methodology; validation; formal analysis; investigation, writing—original draft preparation; writing—review and editing; visualization. All authors have read and agreed to the published version of the manuscript.

Funding

The APC was funded by the program of the Minister of Education and Science under the name “Regional Excellence Initiative” in the years 2019–2022; project number 021/RID/2018/19.

Institutional Review Board Statement

Not applicable.

Informed Consent Statement

Not applicable.

Conflicts of Interest

The authors declare no conflict of interest.

Appendix A

The symbol X_ijz, i stands for human life stages (childhood, school, adulthood, old age). Additionally, j is the number of the sub-area of research variables, z specifies the two-digit number of the variable in the associated group.
The symbol Y_ij, i stands for a certain innovativeness area (innovativeness of entrepreneurs, export/sales of innovative products, foreign direct investments, potential of science, inventiveness, and economic growth). Additionally, j is the two-digit number specifying the variable in the associated group.
Table A1. Variables for regional human capital.
AreaSubS/DVariableNameUnitSource
Childhood DX1001Infant mortality rate%Eurostat
SX1002Life expectancy at birthyearEurostat
SX1003Number of midwives per 10,000 inhabitantspersonLDB
SX1004Fertility rate%LDB
SX1005Children in nursery%LDB
SX1006Children in pre-school education establishments per 1 thousand children aged 3–5personLDB
SX1007Average monthly disposable income per personPLNLDB
Schooling time/education SX2001Gross enrolment ratio—primary schools%LDB
SX2002Gross enrolment ratio—lower secondary schools%LDB
SX2003Gross enrolment ratio—general secondary schools%LDB
SX2004Gross enrolment ratio—vocational schools%LDB
SX2005Gross enrolment ratio—technical secondary schools%LDB
SX2006Gross enrollment ratio in higher education%LDB
SX2007Mean years of schoolingyearUNDP
DX2008Early leavers from education and training%Eurostat
SX2009Students per 10,000 inhabitantspersonLDB
SX2010Percentage of students majoring in technical and natural sciences%LDB
SX2011Graduates per 10,000 populationpersonLDB
SX2012Postgraduate students per 10 thousand inhabitantspersonLDB
SX2013Doctoral students per 10 thousand inhabitantspersonLDB
SX2014Number of academic teachers per 10 thousand inhabitantspersonLDB
SX2015Number of academic teachers with professorial title per 10 thousand inhabitantspersonLDB
DX2016Number of students per academic teacherpersonLDB
DX2017Number of pupils per section in primary schoolspersonLDB
DX2018Number of pupils per section in lower secondary schoolspersonLDB
DX2019Number of pupils per section in general secondary schoolspersonLDB
DX2020Number of pupils per teacher in primary schoolpersonLDB
DX2021Number of pupils per teacher in lower secondary schoolspersonLDB
DX2022Number of pupils per teacher in general secondary schoolspersonLDB
DX2023Number of pupils per teacher in technical secondary schoolspersonLDB
DX2024Number of pupils per teacher in vocational schoolspersonLDB
SX2025Percentage of students additionally learning a foreign language in primary schools%LDB
SX2026Percentage of students additionally learning a foreign language in lower secondary schoolsStudents following additional foreign language instruction%LDB
SX2027Gymnasium exams—the average performance of students (in the mathematics and natural sciences part)%LDB/
OKE
SX2028Gymnasium exams—the average performance of students (in the humanities part)%LDB/
OKE
SX2029Passing the exam maturity examination in relation to the national average%LDB
SX2030Average monthly per capita household expenditure on educationPLNLDB
SX2031Expenditure on education as a proportion of total household expenditure%LDB
SX2032Expenditures of territorial self-government units on education per student PLNLDB/
CIO
SX2033Expenditure on higher education per student PLNGUS
AdulthoodEducationDX3101Percentage of people participating in lifelong learning aged 25–64%Euro
SX3102Percentage of people aged 25–64 with primary education%Eurostat
SX3103Percentage of people aged 25–64 with secondary education%Eurostat
SX3104Percentage of people aged 25–64 with tertiary education%Eurostat
Demographic potentialSX3201Population densityperson/km2LDB
SX3202The net change in population, adjusted for migrationpersonLDB
SX3203The working-age population to the total population%LDB
DX3204Demographic dependency ratio for the population in post-working age%LDB
DX3205The median age of the populationyearEurostat
JobDX3301Percentage of registered unemployed with tertiary education%LDB
DX3302Percentage of unemployed with post-secondary and secondary technical education%LDB
DX3303Percentage of unemployed registered with general secondary education%LDB
DX3304Percentage of unemployed with vocational education LDB
DX3305Percentage of unemployed with primary education LDB
DX3306Share of the long-term unemployed in the total population of the unemployed%Eurostat
DX3307Youth unemployment rate (population aged 15–24)%Eurostat
DX3308Economically inactive per 10 thousand economically active%GUS
DX3309Percentage of job vacancies%GUS
DX3310Percentage of people not in work or education aged 15–24%Eurostat
DX3311Duration of job searchmonthLDB
SX3312Young people neither in employment nor in education and training%Eurostat
SX3313The employment rate for people with primary education%Eurostat
SX3314The employment rate of people with secondary education%Eurostat
SX3315The employment rate for people with tertiary education%Eurostat
SX3316Employment rates by age 15–24%Eurostat
SX1317Employment rates by age 25–34%Eurostat
SX1318Employment rates by age 35–44%Eurostat
SX1319Employment rates by age 45–54%Eurostat
SX1320Employment rates by age 55–64%Eurostat
SX3321Economic activity rates by primary education%Eurostat
SX3322Economic activity rates by secondary education%Eurostat
SX3323Economic activity rates by tertiary education%Eurostat
SX3324The employment rate of disabled people aged 16–64%LDB
SX3325Average number of usual weekly hours of work in the main job by age 15–24hourEurostat
SX3326Average number of usual weekly hours of work in the main job by age 25–64hourEurostat
SX3327Average number of usual weekly hours of work in the main job by age 65–74hourEurostat
SX3328Gross value added per employeePLNLDB
SX3329Average gross salary of persons with higher education (M.A. and higher)%GUS
SX3330Average gross salary of persons with higher bachelor’s and engineer’s degrees in comparison to the national average%GUS
SX3331Average gross salary of persons with post-secondary education in comparison to the national average%GUS
SX3332Average gross salary of persons with technical education in comparison to the national average%GUS
SX3333Average gross salary of persons with general secondary education in comparison to the national average%GUS
SX3334Average gross salary of persons with general vocational education in comparison to the national average%GUS
SX3335Average gross salary of persons with lower secondary education in comparison to the national average%GUS
SX3336Average gross salary of persons with primary and incomplete primary education in comparison to the national average%GUS
R&D and KBESX3401Expenditures on innovation activity in enterprises per economically active personPLNLDB
SX3402R&D expenditure per capitaPLNLDB
SX3403Employment in technology and knowledge-intensive sectors to the total number of employees%Eurostat
SX3404Human resources in science and technology (HRST) as % of the active population%Eurostat
SX3405Employment in high-tech sectors as % of the active population%Eurostat
EntrepreneurshipSX3501Entities entered in the REGON register per 10 thousand populationobjectLDB
SX3502Natural persons conducting economic activity per 100 persons of working agepersonLDB
SX3503Number of business environment institutions per 100 thousand inhabitants IOB
SX3504Funds from E.U. to finance programs and projects E.U. per capitaPLNLDB
SX3505Households furnished with a personal computer and a broadband connection to the Internet%LDB
Social capitalSX3601Voter turnout in parliamentary elections%LDB
SX3602Foundations, associations, and social organizations per 10,000 populationobjectLDB
LeisureSX3701Library loans per borrower in volumesbookLDB
DX3702Number of population per one seat in fixed cinemaspersonLDB
SX3703Museum/branch visitors per 10,000 populationpersonLDB
SX3704Sports clubs including religious and UKS clubs per 10,000 inhabitantsobjectLDB
Social exclusionDX3801Social assistance benefits—beneficiaries per 10,000 populationPLN/personLDB
DX3802Poverty rates—in % of persons in households with expenditures below the extreme poverty threshold %LDB
HealthSX3901Nurses and midwives per 10 thous. populationpersonLDB
SX3902Doctors per 10 thous. populationpersonLDB
SX3903Beds in general hospitals per 10 thous. populationobjectLDB
DX3904Deaths of people due to cardiovascular disease per 100 thous. population personLDB
DX3905Deaths due to cancer per 100 thous. populationpersonLDB
DX3906Deaths of people due to mental and behavioral disorders per 10 thous. populationpersonLDB
DX3907Suicide per 10 thous. populationpersonLDB
DX3908Occupational diseases per 10 thous. economically active personspersonLDB
SX3909Average monthly gross pension due to an inability to workPLNLDB
SX3910Private households—average monthly expenditures on health per capita PLNLDB
SX3911Local government expenditures on health care per capita LDB
Postproductiveage SX4001Average monthly gross retirement from a non-agricultural social security systemPLNLDB
SX4002Average monthly gross retirement for farmersPLNLDB
SX4003Economic activity rates after 65 years old%Eurostat
SX4004Residents of social welfare home per 10 thous. inhabitants personLDB
Source: own elaboration based on public sources.
Table A2. Variables describing regional innovativeness.
AreaVariableNameUnitSource
Innovativeness of enterprisesY101The average share of innovative enterprises in the total number of enterprises%LDB
Y102Innovative service sectors enterprises by new or improved products%LDB
Y103Innovative service sectors enterprises by new or improved products to the market%LDB
Y104Innovative service sectors enterprises by new or improved business processes%LDB
Y105Innovative industrial enterprises by new or improved products%LDB
Y106Innovative industrial enterprises by new or improved products to the market%LDB
Y107Industrial enterprises by new or improved business processes%LDB
Y108Innovative industrial enterprises that cooperated in terms of innovation activity in % of total enterprises%LDB
Y109Innovative enterprises in the service sector that cooperated in terms of innovation activity in % of total enterprises%LDB
Y110Industrial enterprises that participated in innovation activities cluster or other formal types of cooperation in % of the innovation active enterprises%LDB
Sales/export of innovative productsY201Share of net revenues from sales of exported innovative products to the market in total net revenues from sales (industrial enterprises)%LDB
Y202Share of net revenues from sales of exported innovative products in total net revenues from sales (industrial enterprises)%LDB
Y203Share of net revenues from sales of innovative to the market products in total net revenues from sales (industrial enterprises)%LDB
Y204Share of sold production of new or significantly improved industry goods in industrial enterprises in the total amount of sold goods%LDB
Y205Share of net income from the sale of products in entities classified to high and medium-%LDB
FDI foreign direct investmentY301New entities of the national economy recorded per 10,000 of population at working ageobjectLDB
Y302Investment outlays in the companies with foreign capital to total investment outlays%LDB
Y303Foreign capital per inhabitant of working agePLNLDB
Y304Number of units with foreign capital per 100 thousand inhabitantsunitLDB
Y305Number of employees in companies with foreign capital participation per 1 thousand total employeesunitLDB
inventivenessY401Patents granted by the Patent Office of the Republic of Poland (PORP) per 100 thous. populationunitPORP
Y402Rights of protection granted by the Patent Office of the Republic of Poland per 100 thous. populationunitPORP
Y403Patent applications filed in the Patent Office of the Republic of Poland per 100 thous. populationunitPORP
Y404Rights of protection filed in the Patent Office of the Republic of Poland per 100 thous. populationunitPORP
Y405Patents-applications filed with EPO (Patstat) per 100 thous. inhabitantsunitPatstat
Potential of scienceY501Scientific publications per 1 million inhabitants with at least one foreign author in EnglishunitRIS
Y502Number of scientific publications with the highest citations (10% of the most citations worldwide) to the total number of publications in the region as a relation to the E.U. averageunitRIS
Economic GrowthY601Gross domestic product per capitaPLNLDB
Source: own elaboration based on public sources.

References

  1. Gennaioli, N.; la Porta, R.; Lopez-de-Silanes, F.; Shleifer, A. Human capital and economic development. Q. J. Econ. 2013, 128, 105–164. [Google Scholar] [CrossRef] [Green Version]
  2. Mincer, J. Human capital and economic growth. Econ. Educ. Rev. 1984, 3, 195–205. [Google Scholar] [CrossRef] [Green Version]
  3. Schultz, T.W. Investment in human capital. Am. Econ. Rev. 1961, 51, 1–17. [Google Scholar]
  4. Becker, G.S. Human Capital: A Theoretical and Empirical Analysis, with Special Reference to Education; The University of Chicago Press: Chicago, IL, USA, 1994. [Google Scholar]
  5. Domański, S.R. Kapitał Ludzki a Wzrost Gospodarczy; Wydawnictwo Naukowe PWN: Warszawa, Poland, 1993. [Google Scholar]
  6. Healy, S.; Côté, S. The Well-Being of Nations: The Role of Human and Social Capital. Education and Skills; OECD: Paris, France, 2001. [Google Scholar]
  7. Hause, J.C. Earnings Profile: Ability and Schooling. J. Polit. Econ. 1972, 80, S108–S138. [Google Scholar] [CrossRef]
  8. Taubman, T.J.; Wales, P.J. Higher education, mental ability, and screening. J. Polit. Econ. 1973, 81, 28–55. [Google Scholar] [CrossRef]
  9. McDonald, J.; Roberts, S. Growth and multiple forms of human capital in an augmented Solow model: A panel data investigation. Econ. Lett. 2002, 74, 271–276. [Google Scholar] [CrossRef]
  10. Luthans, F.; Luthans, K.W.; Luthans, B.C. Positive psychological capital: Beyond human and social capital. Bus. Horiz. 2004, 47, 45–50. [Google Scholar] [CrossRef] [Green Version]
  11. Laroche, G.C.; Mérette, M.; Ruggeri, M. On the concept and dimensions of human capital in a knowledge-based economy context. Can. Public Policy 1999, 25, 87–100. [Google Scholar] [CrossRef]
  12. Tamura, J. Income convergence in an endogeneous growth model. J. Polit. Econ. 1991, 99, 522–540. [Google Scholar] [CrossRef]
  13. Lucas, R.E. On the mechanics of economic development. J. Monet. Econ. 1988, 22, 3–42. [Google Scholar] [CrossRef]
  14. Benabou, R. Heterogeneity, stratification, and growth: Macroeconomic implications of community structure and school finance. Am. Econ. Rev. 1996, 86, 584–609. [Google Scholar]
  15. Liu, B.M.; Fraumeni, G. Measuring Human Capital Measurement: Country Experiences and International Initiatives; Cambridge University Press: Cambridge, UK, 2016. [Google Scholar]
  16. Korenik, S. Region Ekonomiczny w Nowych Realiach Społeczno-Gospodarczych; CeDeWu: Warszawa, Poland, 2011. [Google Scholar]
  17. OECD/Eurostat. Oslo Manual 2018. Guidelines for collecting, reporting and using data on innovation. In The Measurement of Scientific, Technological and Innovation Activities, 4th ed.; OECD Publishing: Paris/Eurostat, Luxembourg, 2018; Available online: https://www.oecd-ilibrary.org/science-and-technology/the-measurement-of-scientific-technological-and-innovation-activities_24132764 (accessed on 18 September 2021).
  18. Reichel, M. Innowacyjność i konkurencyjność regionów. Kwestie definicyjne—Zakres zbieżności. In Rozwój Regionalny w Polsce w Świetle Wyzwań XXI Wieku; Kudłacz, T., Ed.; Komitet Przetrzennego Zagospodarowania PAN: Warsaw, Poland, 2010; p. 40. [Google Scholar]
  19. Leydesdorff, L. Synergy in knowledge-based innovation systems at national and regional levels: The Triple-Helix model and the Fourth industrial revolution. J. Open Innov. Technol. Mark. Complex. 2018, 4, 16. [Google Scholar] [CrossRef] [Green Version]
  20. Gault, F. Defining and measuring innovation in all sectors of the economy. Res. Policy 2018, 47, 617–622. [Google Scholar] [CrossRef]
  21. Better Policies for 2030 An OECD Action Plan on the Sustainable Development Goals; OECD: Paris, France, 2016; Available online: https://www.oecd.org/dac/OECD-action-plan-on-the-sustainable-development-goals-2016.pdf (accessed on 18 September 2021).
  22. Fagerberg, J. Mobilizing innovation for sustainability transitions: A comment on transformative innovation policy. Res. Policy 2018, 47, 1568–1576. [Google Scholar] [CrossRef]
  23. Danquah, M.; Amankwah-Amoah, J. Assessing the relationships between human capital, innovation and technology adoption: Evidence from sub-Saharan Africa. Technol. Forecast. Soc. Chang. 2017, 122, 24–33. [Google Scholar] [CrossRef]
  24. George, G.; McGahan, A.M.; Prabhu, J. Innovation for inclusive growth: Towards a theoretical framework and a research agenda. J. Manag. Stud. 2012, 49, 661–683. [Google Scholar] [CrossRef]
  25. Romer, P.M. Endogenous technological change. J. Polit. Econ. 1990, 98, 71–102. [Google Scholar] [CrossRef] [Green Version]
  26. Grossman, G.M.; Helpman, E. Trade, innovation, and growth. Am. Econ. Rev. 1990, 80, 86–91. [Google Scholar]
  27. Aghion, P.; Howitt, P.; Howitt, P.W.; Brant-Collett, M.; García-Peñalosa, C. Endogenous Growth Theory; MIT Press: Cambridge, MA, USA, 1998. [Google Scholar]
  28. Lenihan, H.; McGuirk, H.; Murphy, K.R. Driving innovation: Public policy and human capital. Res. Policy 2019, 48, 103791. [Google Scholar] [CrossRef]
  29. Gorzelak, B.; Jałowiecki, G. Konkurencyjność regionów. Studia Reg. i Lokalne 2000, 1, 7–24. [Google Scholar]
  30. Herbst, M. Kapitał ludzki, dochód i wzrost gospodarczy w badaniach empirycznych. In Kapitał Ludzki i Kapitał Społeczny a Rozwój Regionalny; Herbst, M., Ed.; Wydawnictwo Scholar: Warszawa, Poland, 2007; pp. 118–123. [Google Scholar]
  31. Jagódka, M. Kapitał ludzki jako determinanta innowacyjności i konkurencyjności miast w regionie Małopolski. In Funkcje Średnich Ośrodków Miejskich Jako Regionalnych Biegunówrozwoju Społeczno-Ekonomicznego; Prusek, A., Ed.; WSGiZ Kraków: Kraków, Poland, 2017; pp. 53–87. [Google Scholar]
  32. di Liberto, A. Education and Italian regional development. Econ. Educ. Rev. 2008, 27, 94–107. [Google Scholar] [CrossRef] [Green Version]
  33. Badinger, G.; Tondl, H. TradHuman Capital and Innovation: The Engines of European Regional Growth in the 1990s. In European Regional Growth; Fingleton, B., Ed.; Springer: Berlin/Heidelberg, Germany, 2003; pp. 215–239. [Google Scholar]
  34. Engelbrecht, H.J. Human capital and international knowledge spillovers in TFP growth of a sample of developing countries: An exploration of alternative approaches. Appl. Econ. 2002, 37, 831–841. [Google Scholar] [CrossRef]
  35. Sterlacchini, A. R&D, higher education and regional growth: Uneven linkages among European regions. Res. Policy 2008, 37, 1096–1107. [Google Scholar]
  36. Cuaresma, J.C.; Doppelhofer, G.; Feldkircher, M. The determinants of economic growth in European regions. Reg. Stud. 2014, 48, 44–67. [Google Scholar] [CrossRef]
  37. Florida, F. The flight of the creative class: The new global competition for talent. Lib. Educ. 2006, 92, 22–29. [Google Scholar]
  38. Laskowska, B.; Dańska-Borsiak, I. The importance of human capital for the economic development of EU regions. Comp. Econ. Res. 2016, 19, 63–79. [Google Scholar] [CrossRef] [Green Version]
  39. Fagerberg, J.; Verspagen, B.; Caniëls, M. Technology, Growth and Unemployment across European Regions Technology, Growth and Unemployment across European Regions. Reg. Stud. 1997, 31, 457–466. [Google Scholar] [CrossRef]
  40. Azorín, J.D.B.; de la Vega, M.D.M.S. Human capital effects on labour productivity in EU regions. Appl. Econ. 2015, 47, 4814–4828. [Google Scholar] [CrossRef]
  41. Golejewska, A. Human capital and regional growth perspective. Barom. Reg. 2013, 11, 7–17. [Google Scholar]
  42. Hirschman, A.O. Strategy of Economic Development; Yale University Press: New Haven, CT, USA, 1958. [Google Scholar]
  43. Myrdal, G. Economic Theory and Underdeveloped Regions; Gerald Duckworth: London, UK, 1957. [Google Scholar]
  44. Iammarino, S.; Rodriguez-Pose, A.; Storper, M. Regional inequality in Europe: Evidence, theory and policy implications. J. Econ. Geogr. 2019, 19, 273–298. [Google Scholar] [CrossRef]
  45. Friedmann, J. A General Theory of Polarized Development; The Free Press: New York, NY, USA, 1972. [Google Scholar]
  46. Perroux, F. Economic space: Theory and applications. Q. J. Econ. 1950, 64, 89–104. [Google Scholar] [CrossRef]
  47. Łukasiewicz, G.; Organizacji, K.L. Pomiar i Sprawozdawczość; PWN: Warszawa, Poland, 2009. [Google Scholar]
  48. Le, L.; Gibson, T.; Oxley, J. Cost-and income-based measures of human capital. J. Econ. Surv. 2003, 17, 271–307. [Google Scholar] [CrossRef]
  49. Czekanowski, J. Zur Differentialdiagnose der Neandertalgruppe. Korespondentblatt der Deutschen Gesellschaft fur Anthropologie. Ethnol. Urgesch 1909, 40, 44–47. [Google Scholar]
  50. Arabie, L.; Hubert, P. Overview of Combinatorial Data Analysis. In Clustering and Classification; Arabie, G., Hubert, P., Soete, L., Eds.; World Scientifistic: River Edge, NJ, USA, 1996; pp. 5–63. [Google Scholar]
  51. Hubert, J.; Arabie, L.; Meulman, P. Combinatorial Data Analysis: Optimization by Dynamic Programming; Society for Industrial and Applied Mathematics (SIAM): Philadelphia, PA, USA, 2001. [Google Scholar]
  52. Brusco, S.; Stahl, M.J. Branch-and-Bound Applications in Combinatorial Data Analysis; Springer Science & Business Media: New York, NY, USA, 2006. [Google Scholar]
  53. Petrie, F. Sequences in Prehistoric Remains. J. Anthropol. Inst. Great Br. Irel. 1899. Available online: https://www.semanticscholar.org/paper/Sequences-in-Prehistoric-Remains-Petrie/35f89e9f654e79f32a7a1362d998a8f11e383cd0 (accessed on 18 September 2021). [CrossRef]
  54. Hahsler, C.; Hornik, M. Buchta Getting things in order: An introduction to the R package seriation. J. Stat. Softw. 2008, 25, 1–34. [Google Scholar] [CrossRef] [Green Version]
  55. Kendall, D. Abundance matrices and seriation in archaeology. Z. Wahrscheinlichkeitstheorie Verwandte Geb. 1971, 17, 104–112. [Google Scholar] [CrossRef]
  56. Robinson, W.S. A Method for Chronologically Ordering Archaeological Deposits. Am. Antiq. 1951, 16, 293–301. [Google Scholar] [CrossRef]
  57. Hubert, L. Some Applications of Graph Theory and Related Nonmetric Techniques to Problems of Approximate Seriation: The Case of Symmetric Proximity Measures. Br. J. Math. Stat. Psychol. 1974, 27, 133–153. [Google Scholar] [CrossRef]
  58. Caraux, S.; Pinloche, G. Permutmatrix: A Graphical Environment to Arrange Gene Expression Profiles in Optimal Linear Order. Bioinformatics 2005, 21, 1280–1281. [Google Scholar] [CrossRef] [Green Version]
  59. Bar-Joseph, T.S.; Gifford, Z.; Jaakkola, D.K. Fast Optimal Leaf Ordering for Hierarchical Clustering. Bioinformatics 2001, 17, 22–29. [Google Scholar] [CrossRef] [Green Version]
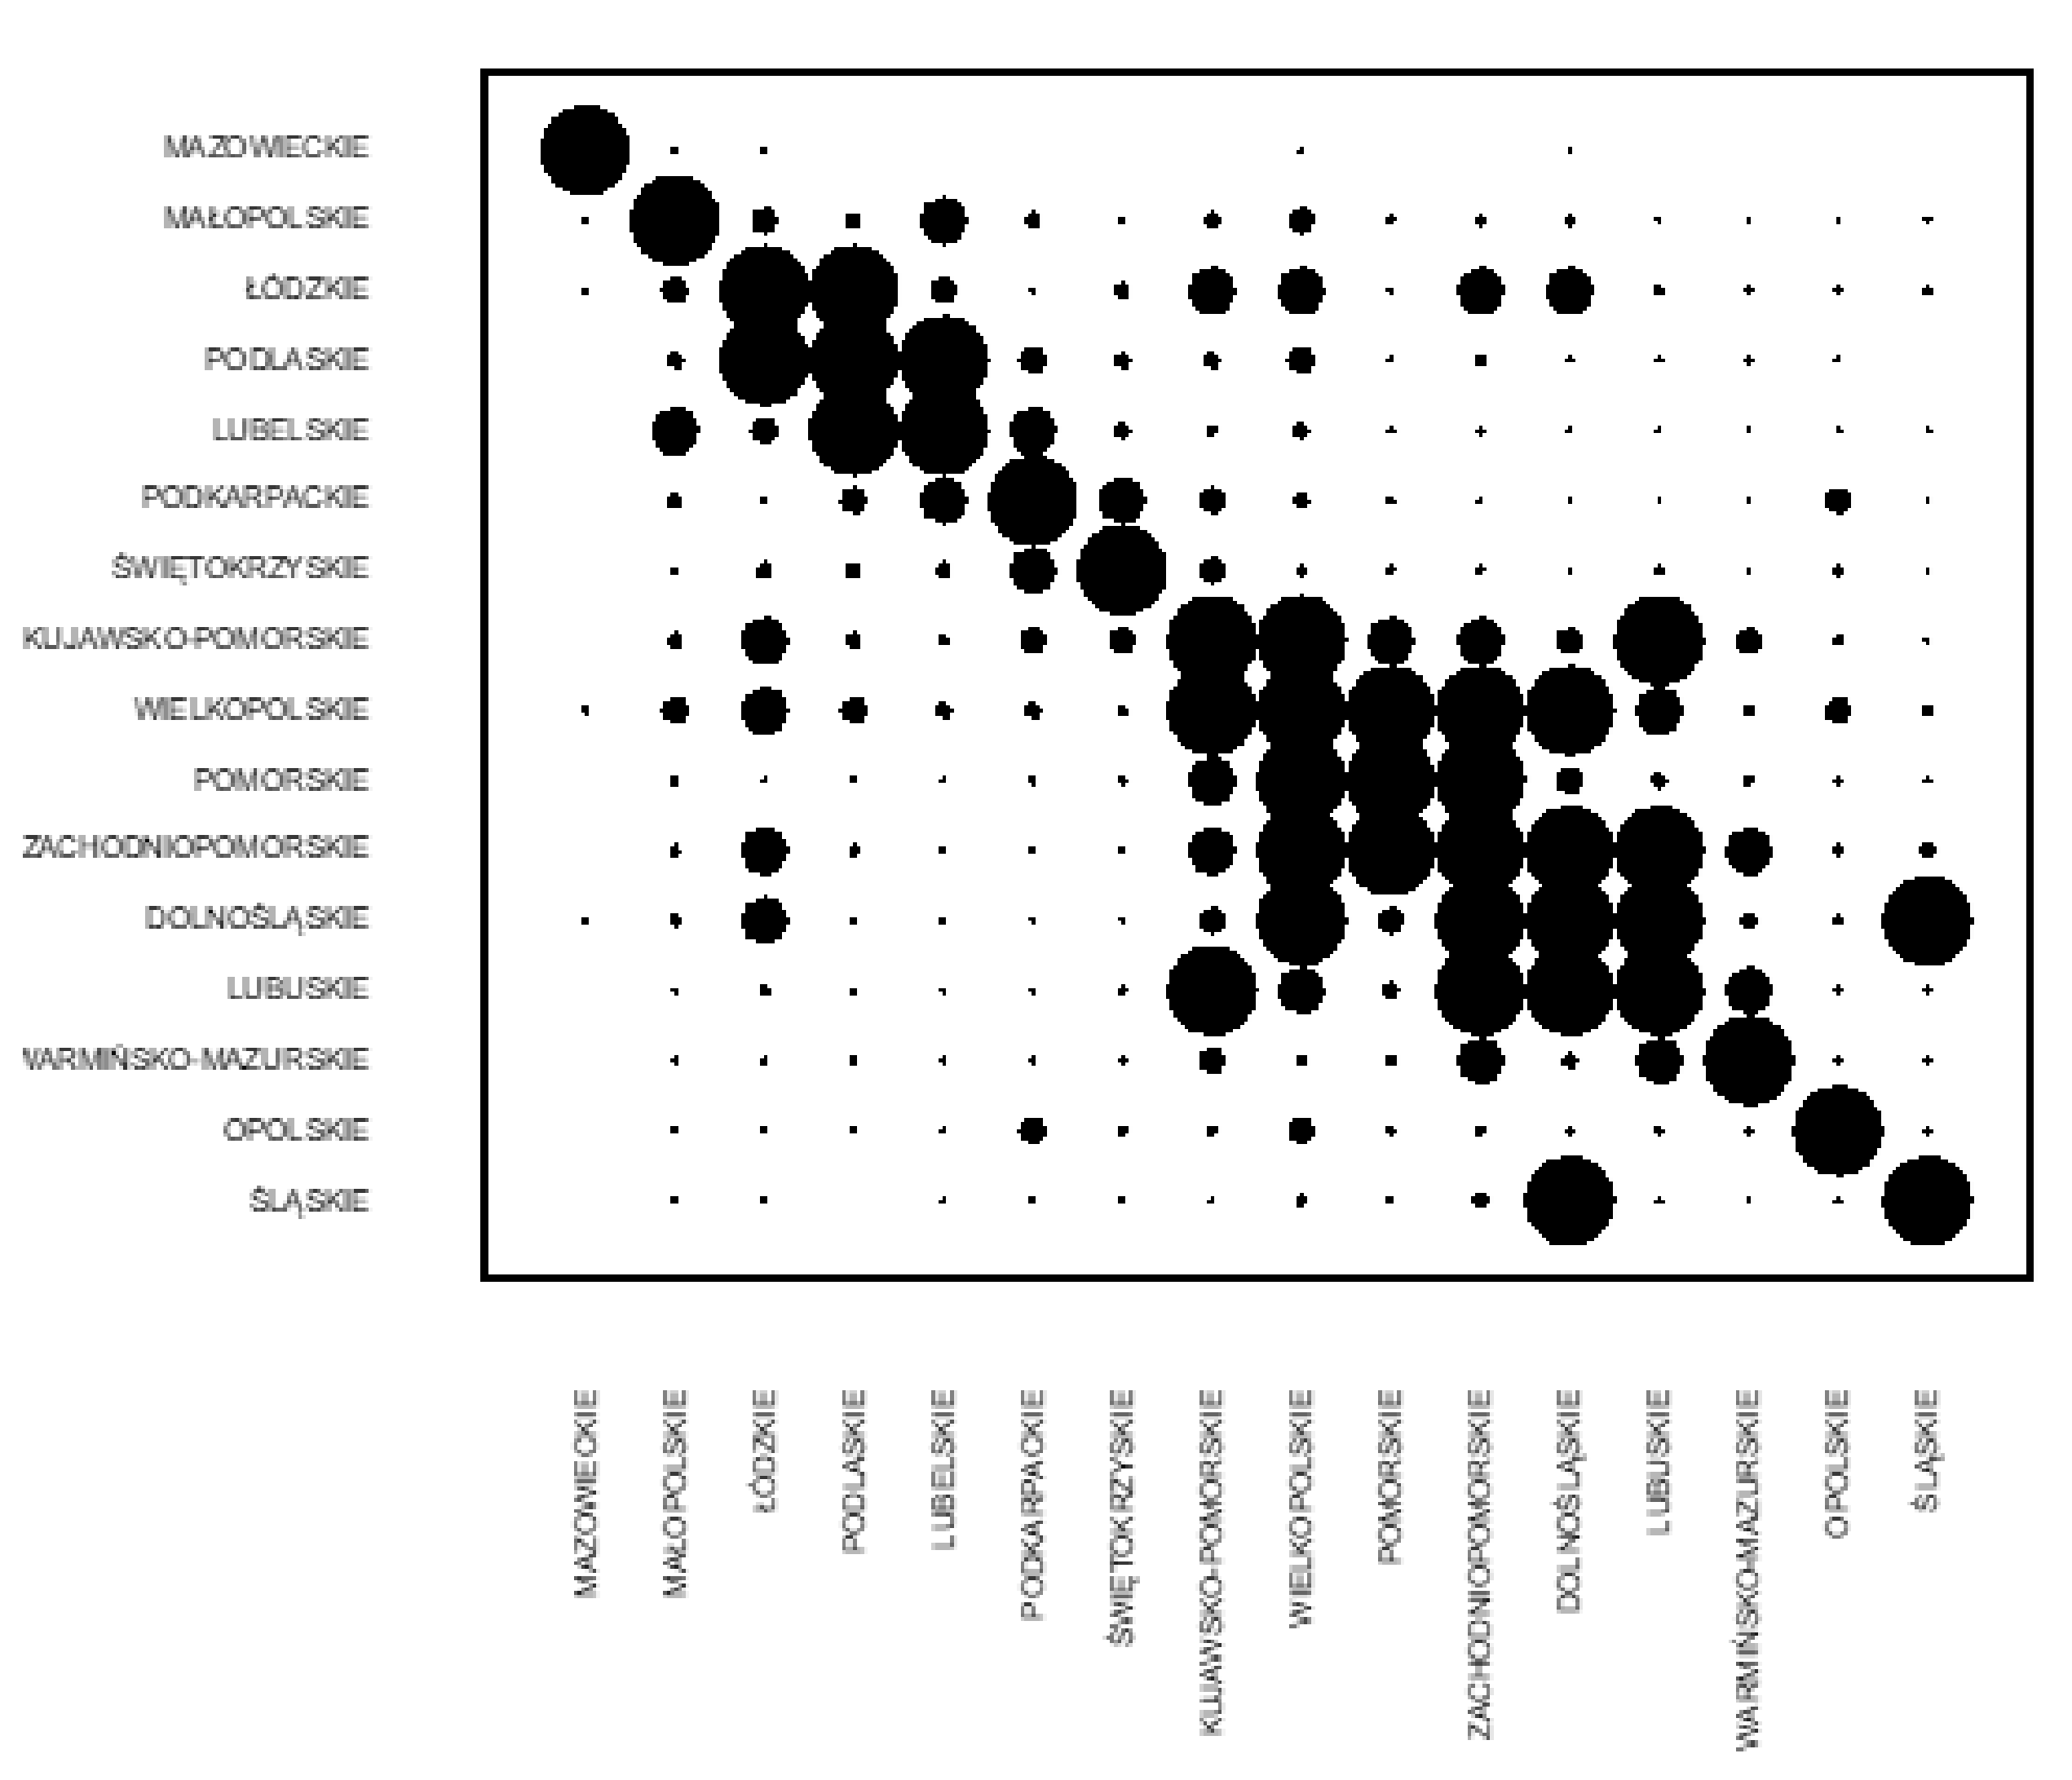
Figure 1. Czekanowski diagram for human capital in 2004. Own elaboration based on Statistics Poland (SP).
Sustainability 13 12620 g001
Figure 2. Czekanowski diagram for human capital in 2008. Own elaboration based on Statistics Poland (SP).
Sustainability 13 12620 g002
Figure 3. Czekanowski diagram for human capital in 2014. Own elaboration based on Statistics Poland (SP).
Sustainability 13 12620 g003
Figure 4. Czekanowski diagram for human capital in 2018. Own elaboration based on Statistics Poland (SP). Own elaboration based on Statistics Poland (SP).
Sustainability 13 12620 g004
Table 1. Characteristics of human capital.
Analysis CriterionHuman CapitalPhysical Capital
FormIt is embodied in man. It cannot be subject to market exchange.It takes a tangible form that can be traded on the market at any time.
MeasurabilityMeasurement is challenging due to intangible aspects of human capital.Market value in monetary units is relatively easy to estimate.
FundingIt is limited, primarily subsidized in the form of academic/social scholarships.Relatively easy, which is due to a large number of market transactions for this manufacturing factor.
Significance for developmentIn the digital age, it is growingProminent in the era of industrialization.
It is decreasing under GOW conditions.
Marginal productivityIt grows as it is used, which is related to gaining experience.It decreases with use.
AccumulationIt is more time and labor-intensive because of the social aspect of human capital. It can take different forms: formal and informal learning. Not always dependent on the capital owner.It depends on the decisions of the holders (owners) of capital.
TreatmentBecause it is embodied in a person, it should be treated as a subject.Objective approach.
Source: own elaboration based on the cited literature.
Publisher’s Note: MDPI stays neutral with regard to jurisdictional claims in published maps and institutional affiliations.