Article

Development of a Scale to Remove Farmers’ Sustainability Barriers to Meteorological Information in Iran

1
Department of Agricultural Extension and Education, School of Agriculture, Shiraz University, Shiraz 7144165186, Iran
2
Department of Agricultural Extension and Education, College of Agriculture, Tarbiat Modares University (TMU), Tehran 1497713111, Iran
3
Department of Technology Development Studies (DTDS), Iranian Research Organization for Science and Technology (IROST), Tehran 7144165186, Iran
4
Institute of Economics and Social Sciences, Estonian University of Life Sciences, 51006 Tartu, Estonia
5
Business Administration, Universidad Militar Nueva Granada, Bogotá 110111, Colombia
6
Xinjiang Institute of Ecology and Geography, Chinese Academy of Sciences, 818 South Beijing Road, Urumqi 830011, China
7
Research Center for Ecology and Environment of Central Asia, Chinese Academy of Sciences, 818 South Beijing Road, Urumqi 830011, China
8
Sino-Belgian Joint Laboratory for Geo-Information, Urumqi 830011, China
9
University of Chinese Academy of Sciences, Beijing 100049, China
10
Department of Geography, Ghent University, 9000 Ghent, Belgium
11
Faculty of Environmental Sciences, Czech University of Life Sciences, 165 00 Prague, Czech Republic
*
Author to whom correspondence should be addressed.
Sustainability 2021, 13(22), 12617; https://doi.org/10.3390/su132212617
Submission received: 20 September 2021 / Revised: 26 October 2021 / Accepted: 9 November 2021 / Published: 15 November 2021
(This article belongs to the Section Sustainable Agriculture)

Abstract

:
Even with significant breakthroughs in the production and delivery of meteorological information, most farmers are not able to utilize such information properly and pertinently. Up to the present time, a standardized scale has not been developed to examine farmers’ sustainability barriers to meteorological information use (BMIU). Furthermore, there is no doubt that identifying indicators and dimensions of sustainability barriers to meteorological information and weather forecasts’ usage by farmers can play a major role in their adaptation and resilience to the risks of climate change. Therefore, the present study aimed to generate and validate a scale for BMIU by farmers through an eight-step approach. Accordingly, the statistical population included 9006 Iranian farmers, 368 of whom were selected as study samples. The principal component factor analysis (PCFA) and second-order confirmatory factor analysis (CFA) were further practiced to develop the scale for meteorological information and weather forecasts’ use. Factor analysis also led to the emergence of five latent factors including “educational–communicative barriers (ECBs)”, “normative barriers (NBs)”, “informational barriers (IBs)”, “infrastructural–political barriers (IPBs)”, and “professional–economic barriers (PEBs)”. The second-order CFA correspondingly confirmed these five factors and their 25 related indicators. Given the challenges facing academic scholars, decision makers, and authorities in the application and facilitation of meteorological information, the developed multidimensional scale in this study along with its implementation steps can be effective in examining the limitations of utilizing such information and measuring its impacts in different agricultural communities.

1. Introduction

Meteorological information and weather forecasts are recognized as major factors affecting agricultural systems [1,2,3]. Despite significant advances in the production and delivery of meteorological information in recent years [4,5], many farmers, as the key decision makers at farms and one of the main users of meteorological information, have not been able to use this information and forecasts properly and pertinently [6,7]. It should be noted that decision making takes place in complex dynamic environments such as the agricultural sector in which there is a network of different actors with their own specific interests, concerns, and areas of activity. In this regard, the issue of failure to use meteorological information and weather forecasts has been studied from various aspects [8].
The agricultural sector is also one of the most vulnerable sectors to climate change. As such, it accounts for more than 80% of climate-change-related damages and side effects [9,10]. Droughts, torrential rains, strong winds, severe storms, high temperatures, seasonal patterns, and pests and diseases associated with climate change are thus considered major challenges to agricultural and livestock products [11], which can be followed by instability in production and reduced productivity [12,13,14]. Since farmers are at the forefront of these threats, the mentioned problems can also lead to increased instability of their livelihoods [15]. In view of that, reducing farmers’ vulnerability and improving their resilience to climate changes require access to and effective use of meteorological information and weather forecasts [13,16,17]. Therefore, having access to better meteorological information and providing technical climate recommendations to farmers are taken into account as effective ways to adapt to climate change [18], which can have a significant impact on making proper decisions on the usage of this information by farmers. Despite the vital role that meteorological information and weather forecasts play in minimizing the damage to the agricultural sector, enhancing farmers’ adaptation to climate change, and reducing their vulnerability [13,14,15,16,17,18], there are constraints and issues hindering farmers from exploiting such information efficiently and effectively [19]. There are many factors that can limit the use of meteorological information. Table 1 summarizes the worldwide studies on the barriers to the use of meteorological information by farmers
Hansen [36] argues that meteorological information must meet farmers’ needs and be consistent with their decision-making goals. However, research studies show that a large proportion of farmers do not use meteorological information and weather forecasts in their decisions [35]. It is worth mentioning that sustainability barriers refer to the obstacles linked to the implementation of sustainability efforts taking into account economic, social, and environmental aspects. To our best knowledge, there was no organized and standardized scale to assess farmers’ sustainability barriers to meteorological information and weather forecast usage. This is while identifying the indicators and dimensions of barriers to use such information and forecasts by farmers may improve their adaptation and resilience to the risks of climate change. Therefore, the development and statistical validation of a scale for sustainability barriers to meteorological information use (BMIU) by farmers are determined as the main objectives in the present study. In other words, this study attempts to clarify the most significant obstacles that prevent farmers from using meteorological information sustainably. To achieve this purpose, four research questions are defined as follows:
What are the main sustainability barriers to BMIU by farmers?
1.
How should the factor structure of sustainability BMIU be formulated?
2.
Is the structure of the scale of sustainability BMIU valid?
3.
What items does the final checklist of the scale of sustainability BMIU contain?

2. Materials and Methods
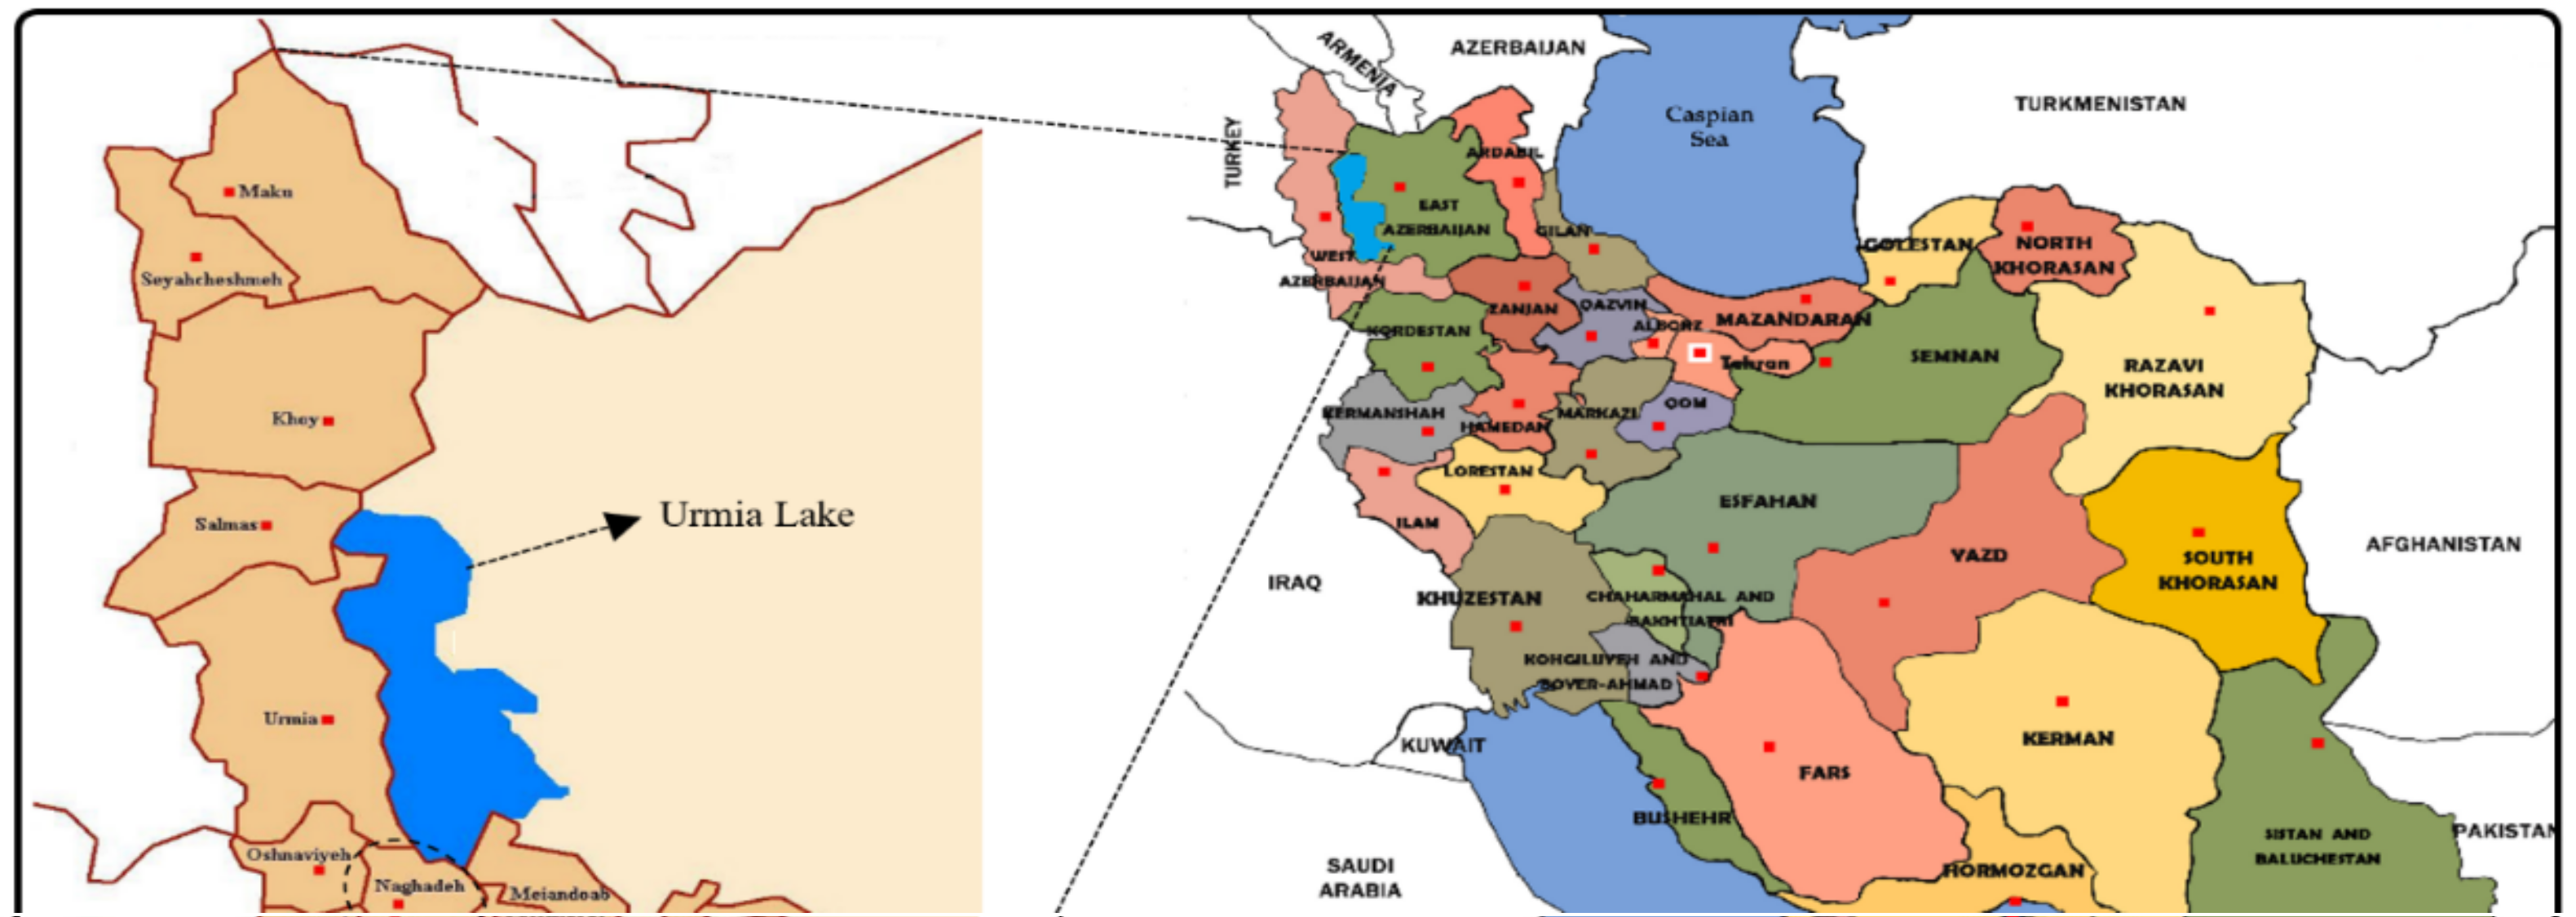
2.1. Study Area

The present research endeavor was conducted in Naqadeh County in West Azerbaijan Province, Iran. This area is located in the northwest of Iran and in the Soldoz Wetlands (Figure 1). According to the Statistical Centre of Iran (SCI), this county has a population of 127,671 [37]. West Azarbaijan Province and particularly Naqadeh County are among the pioneering regions in terms of producing agricultural crops in Iran. The economy of this province also depends on agriculture and animal husbandry. Furthermore, the major agricultural products in Naqadeh County with a diverse four-season climate include wheat, barley, canola, and horticultural products.

2.2. Characteristics of the Population and Selecting Samples

The target population of this study included farmers residing in Naqadeh County (n = 9006). In recent years, all agricultural systems and producers of various agricultural products in Naghadeh County have been influenced by the negative impacts of climate change and lack of using meteorological information. Thus, in this research endeavor, a specific and limited group of farmers were not selected as a target population. In other words, the population included farmers who produced different crops, had different land sizes, and had different types of land ownership. This was done in order to increase the generalizability of the research results to different groups of Iranian farmers. The study was carried out in two distinctive and interrelated phases (namely qualitative and quantitative). Therefore, two different sampling approaches were also employed for selecting the samples. The snowball sampling was applied to specifically select the samples or farmers in the qualitative in-depth interviews. In this process, as a starting point, one of the farmers was picked up to answer the qualitative question of the study. After the interview, he introduced another sample/participant for the next in-depth qualitative interview. A similar process was employed to select 10 more participants. In general, 12 farmers were sampled in this phase. The 12th participant was the last person to participate in the in-depth interviews. The snowball sampling approach has some advantages and disadvantages. The snowball sampling method is cost-effective and convenient because, in this method, the researcher does not spend much time on finding the target people [38]. This method is not as expensive as other sampling methods. In addition, in this sampling method, the participants’ trust in the researcher is high [39]. However, one of the most important disadvantages of the snowball sampling method is that the samples that are selected in the early stages of the research have a great impact on the results. Furthermore, sampling is not random, and therefore the results are not very generalizable [40]. The uncertainty of the sample size and the low control of researchers over the sampling process are other disadvantages of the snowball sampling method [39]. The snowball sampling method is purely dependent on referrals. However, in order to prevent the respondents’ responses from being influenced by each other, according to previous studies, see [14,15,16,17,18,19,20,21,22,23,24,25,26,27,28,29,30,31,32,33,34,35,36,37,38], three strategies were employed. First, the interviewed farmer was asked not to contact the next reference until the interviews were completed. Second, the identity of the nominating farmer remained unknown to the interviewees. Third, the interviewee was asked to identify a person for the next interview who, in his/her point of view, has new and complementary information on barriers to the use of meteorological information. After defining the problem, a qualitative and open-ended research tool (questionnaire) was developed and distributed among the farmers with the approval of the research team, where the farmers were questioned about the barriers to using meteorological information and weather forecasts [see Supplementary File S1 to see the qualitative questionnaire]. The obtained findings of these in-depth interviews were recorded in a form of written notes and voices, which were reviewed and analyzed line-by-line after their completion [41] and then compared with the findings of the former interviews. This was carried out to identify the “theoretical saturation” point. Theoretical saturation is a point in qualitative research indicating the adequacy of the data collected for analysis. Theoretical saturation also shows the stopping point of the sampling process [39,40,41]. In this study, the obtained results from the 9th to 12th participant farmers revealed that, with the continuation of the in-depth interviews (or theoretical sampling), no further groundbreaking and new findings would be added to the former results. In a sense, the researchers observed that the theoretical saturation on the barriers to meteorological information and forecast use has been achieved. Therefore, after the termination of the 12th interview and synthesizing its results, the selection process of the samples was stopped. In the quantitative phase, using the predetermined equalization in the Krejcie and Morgan table, the total size of the sample was estimated to be 368 cases [42]. At this point, a particular stratified sampling approach was applied to randomize the selection process. In order to increase the representativeness and generalizability of the research findings, the total sample size was proportionally distributed among the strata. For this purpose, in the beginning, the investigation site was divided into four Dehestans (a collection of villages). Out of each Dehestan, two rural residential areas or villages were selected at random. Afterward, within each village, samples (farmers) were selected in a random manner. There were three main reasons to adopt this approach for sampling. First, the variance difference between the categories/strata of the study area (i.e., villages and Dehestans) was significant with respect to the number of farmers. In other words, it enabled the researchers to proportionally and normally distribute the samples among the predetermined strata. Second, there were some salient similarities among the categories in terms of features such as agricultural practices, meteorological information, and so on. Third, this sampling manner improves the accuracy of sampling and reduces the economic constraints. In other words, this sampling approach could enable the researchers to categorize the study population, reduce the research costs, and increase the sampling accuracy as a result of low variance within classes.

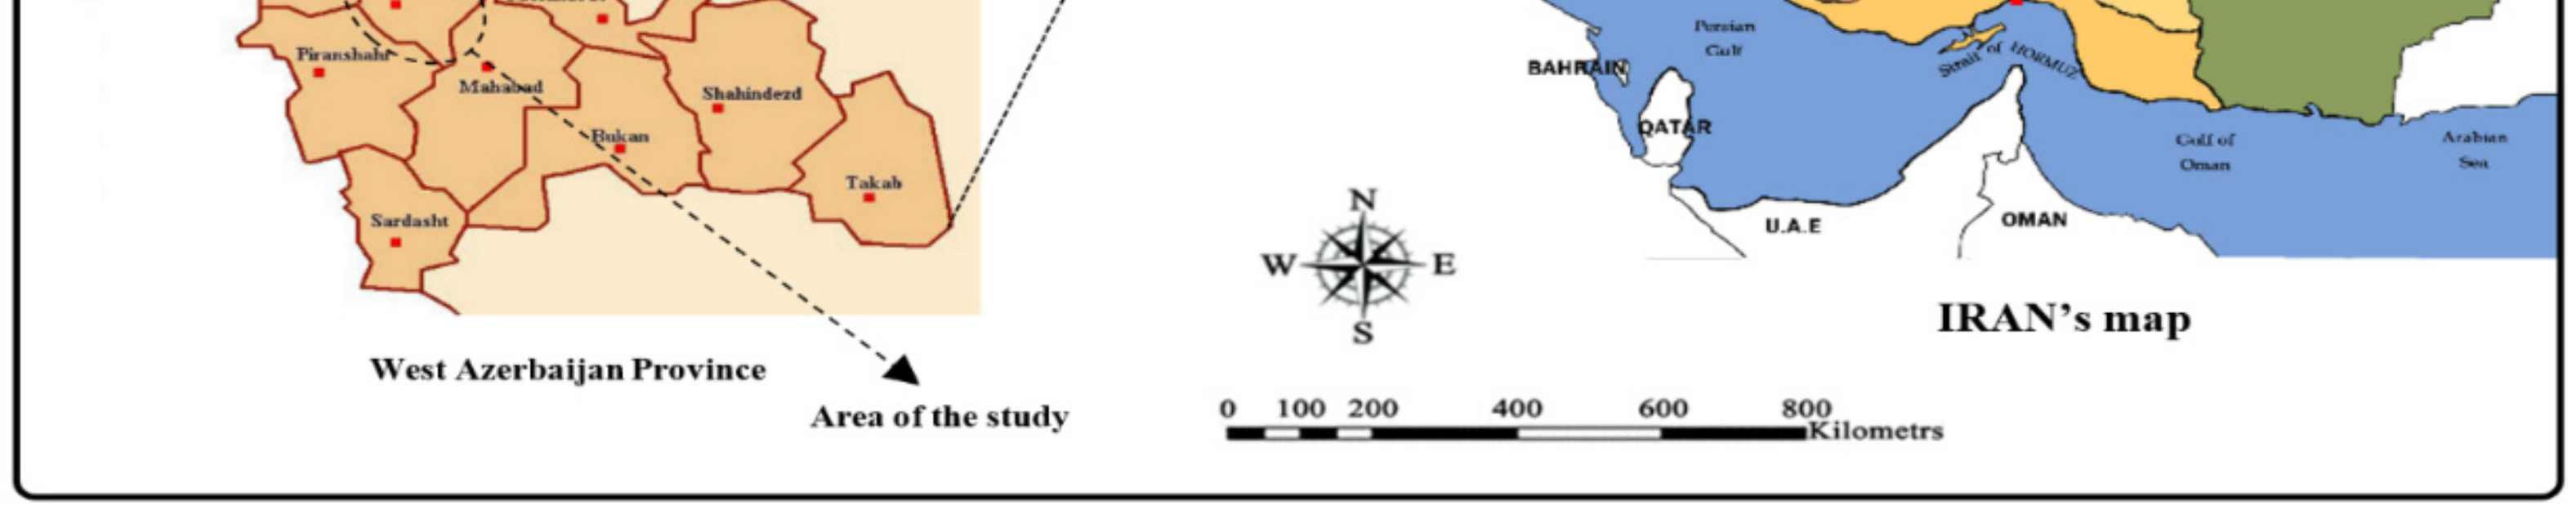
2.3. Extraction of Primary/Initial Indicators for BMIU

In the qualitative phase, 12 in-depth interviews were carried out. Then, the responses were summed up and the keywords and concepts related to the barriers imposed on meteorological information use were abstracted and extracted.

2.4. Research Instrument, Data Collection, and Quantitative Analysis Methods

Face-to-face interviews with participants (farmers) were used in a quantitative step. The study tool was thus a structured and/or close-ended questionnaire, which was formed using the keywords/concepts regarding BMIU use (obtained in the qualitative phase). The validity of this questionnaire (consisting of 45 items/indicators) was scored on a five-point Likert-type scale (1: completely disagree to 5: completely agree), and it was also approved by a group of professional experts [see Supplementary File S1 to see the qualitative questionnaire]. The reliability of this structured/close-ended tool was further examined by item-total correlation coefficients. Therefore, items having correlation coefficients lower than 0.3 were excluded from the final data set. Since some statisticians, see [27,28,29,30], have argued that item-total correlation coefficients lower than 0.3 can reduce the explanatory power of the factor model, they were eliminated from the items’ list. Finally, 42 out of 45 items obtained from the qualitative phase were used for the quantitative analysis. The phenomenon of the use or non-use of meteorological information is a complex and multi-aspect issue. Thus, a methodological approach was applied in the next step that could contribute to the identification of the hidden dimensions of BMIU. Specifically, it was tried to categorize the sub-indicators in the form of more abstract factors (namely, dimensions). This process enables the researchers to identify factor structure after importing the collected data into the IBM SPSS Statistics software. Accordingly, the principal component factor analysis (PCFA) was introduced as a reliable method for this task. In order to rotate the abstracted factors, we decided to apply the oblique rotation manner. The main justification to employ oblique rotation was that, theoretically, there is a correlation between the factors and dimensions, and they are not uncorrelated [43]. Two indicators Kaiser–Meyer–Olkin (KMO) and Bartlett’s sphericity were used to evaluate the suitability of the data for PCFA. The Kaiser–Meyer–Olkin (KMO) statistic is an important criterion to evaluate the fitness of the data to test the factor structure. This statistic must be higher than 0.7 in an appropriate data set [44,45]. Bartlett’s sphericity test was adopted to ensure and conclude that the correlation matrix was not zero in the statistical population. In PCFA, a non-zero correlation matrix is considered one of the presuppositions of factor analysis [45]. After running PCFA, confirmatory factor analysis (CFA) was utilized to confirm and validate the structure of BMIU. Therefore, a second-order CFA (based on maximum likelihood) was adopted using the linear structural relations (LISREL) software. In summary, the procedure and steps to develop the scale in this study can be illustrated in Figure 2.

3. Results

The purpose of this phase was to identify sustainability barriers to meteorological information and weather forecasts’ usage from farmers’ perspectives. Based on the results in this section, 45 concepts were obtained as follows (Table 2).

3.1. Item Analysis of the Scale for BMIU

In this step, items (n = 9) obtaining item-total values lower than 0.3 were removed from the data set. According to the results of this section, nine items including “long distance from meteorological stations”, “negligence in publishing information by organizations”, “low use of mass media”, “no interface between the Meteorological Organization and farmers to have quick access to meteorological information”, “lack of future-oriented time perspectives”, “low value of meteorological information and weather forecasts”, “weakness in planning by government organizations and agencies”, “no strong systems to predict climate change”, and “limitations of the Meteorological Organization in providing information” were eliminated from the initial list of concepts.

3.2. The Main Dimension/Factor Structure of the Scale for BMIU

The PCFA was used to summarize the variables and to investigate the contribution of each factor in relation to the barriers to meteorological information and weather forecasts’ usage. KMO statistic’s numerical value was 0.867 in the present study; therefore, it approved the adequacy samples to run the PCFA. The significance level reported for Bartlett’s statistic was 0.001 for all sub-factors. With respect to the insights provided by Howard [46], this conclusion implies that the data set is appropriate for running the PCFA (Table 3).
Table 4 demonstrates the eigenvalues and the corresponding explained variances of the identified hidden factors for BMIU. With reference to the PCFA results, five latent factors obtained eigenvalues higher than 1. According to Kaiser [47], eigenvalues higher than 1 are required for the significance of the factors. Since five factors had eigenvalues higher than 1, five significant factors were identified. Together, these latent variables could totally account for more than 54.962% of variance [39]. The significant difference between the first latent factor and other factors represents its major effect on the barriers to meteorological information and weather forecast use. The basis for determining the significance of the differences is the criterion. In other words, factors whose eigenvalues are greater than 1 are considered the significant factors [39,47]. As the results of this study show, only five factors had eigenvalues greater than 1.
To identify the latent/hidden factors and to recognize on which latent factor each item/indicator was loaded, only indicators/items (variables) with a loading factor (correlation) higher than 0.5 were picked up, and the other variables having lower factor loadings were excluded from the analysis. The indicators that had also been loaded on more than one latent/hidden factor were eliminated from the subsequent analysis [43]. In order to facilitate the analysis of the results, the varimax approach was applied. The varimax approach is an oblique rotation approach. After rotating 36 concepts identified in the first step (9 out of 45 concepts in Table 2 were eliminated in the reliability test of the questionnaire), 36 indicators were included in factor analysis (Table 5).
According to PCFA, the barriers to meteorological information and weather forecast use were categorized into five latent/hidden factors. In the next step, according to the items loading on the factors and their correlations, some suitable titles were selected for the latent factors. Therefore, based on the results, BMIU included “educational–communicative barriers (ECBs)”, “normative barriers (NBs)”, “informational barriers (IBs)”, “infrastructural–political barriers (IPBs)”, and “professional–economic barriers (PEBs)” (Table 5).

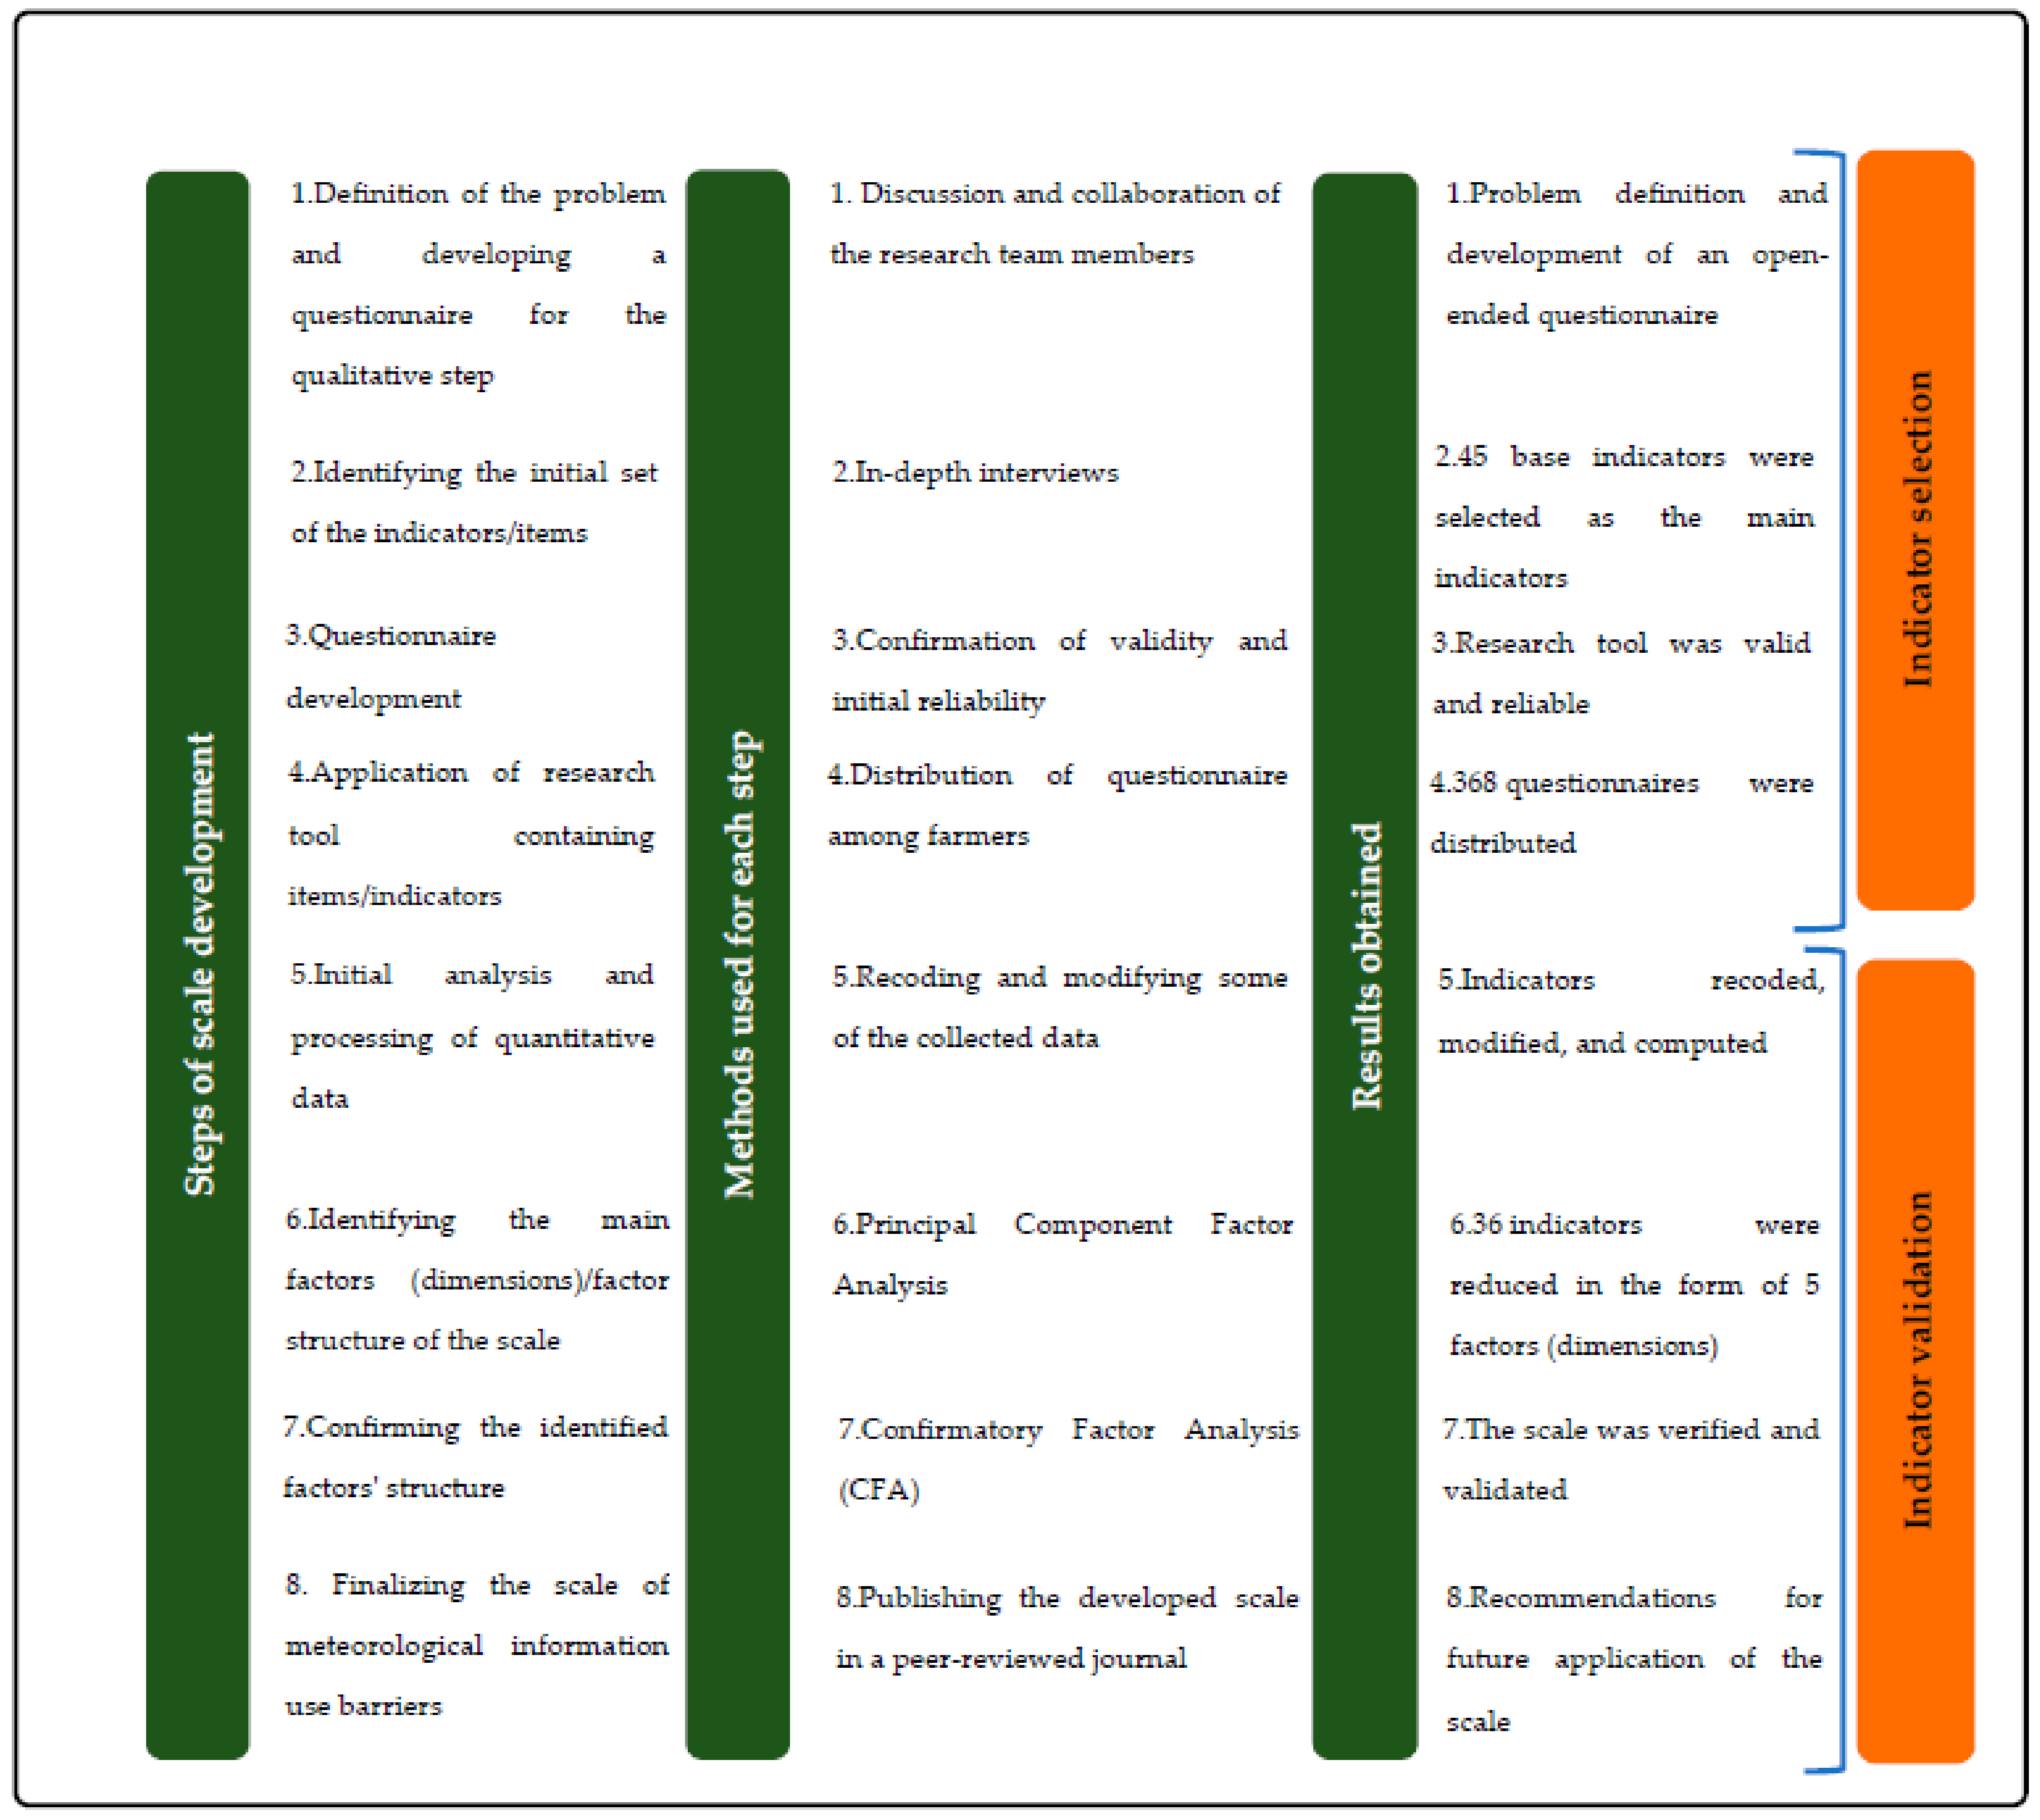
3.3. The Structure of the Scale for BMIU

Figure 3 visualizes the CFA framework of the scale for BMIU. In this figure, the loading factors (correlations) are in their standardized mode. The acceptable cut-off values for the loadings were 0.5, meaning that the indicators with factor loadings less than 0.5 were deleted from the final scale for BMIU and/or CFA framework (Table 6).
According to the fact that the loading factors of 23 items (indicators) in the scale for BMIU showed values higher than the acceptable cut-off value of 0.5, it can be mentioned that the construct validity of the scale for BMIU was confirmed by eliminating 13 items. Furthermore, the loading factors between hidden/latent factors and the scale for BMIU (these second-order loading factors are known as the gamma coefficients) were significant (p < 0.01). It is of note that gamma coefficients represent the effectiveness level of each latent/hidden factor in explaining the main scale. In other words, they can be applied to rank the latent factors in terms of their contribution to the main construct (scale for BMIU). Table 6 demonstrates that all latent factors had significant gamma coefficients and could account for an acceptable percentage of variance changes in BMIU. Gamma coefficients also ranged from 0.42 to 0.83. As shown in Figure 3, the calculated t-values for all items/indicators and latent factors are greater than 1.96 and are therefore significant at the error level of 0.05.
The value of composite reliability (CR), which is applied to evaluate the internal consistency, must be higher than 0.7. The average variance extracted (AVE) should also be higher than 0.5. However, some statisticians [48,49,50,51] have found that values greater than 0.4 are acceptable as well. If the CR value is higher than the numerical value of 0.6, the convergent validity of the latent factor is also acceptable [48]. With respect to the results reported in Table 6, it can easily be concluded that all dimensions of the scale for BMIU have appropriate convergent validity.
Fitness indexes were additionally adopted to assess the merit of the scale for BMIU (Table 7). Taken together, the results revealed that the goodness-of-fit index (GFI) and the adjusted goodness-of-fit index (AGFI) were greater than the plausible value of 0.9 (GFI = 0.95; AGFI = 0.92). These indexes are the fitness evaluation criteria between the hypothesized scale for BMIU and the real observed covariance matrix. The Bentler–Bonett normed fit index (NFI) and the comparative fit index (CFI) were also at an acceptable level (NFI = 0.95; CFI = 0.91). Theoretically, their values should be higher than 0.9. Thus, the results of NFI and CFI indices highlighted the appropriateness of data-model fit.
Another index for the fitness of the developed scale was the root mean square error of approximation (RMSEA) (RMSEA = 0.073). Values smaller than 0.08 are acceptable for this index. In the end, it is worth mentioning that the value of the Chi-square (χ2) normalized by the degree of freedom (df) was 2.94 (less than the plausible value of 3).
The fitted structural model of the scale for barriers to meteorological information and weather forecasts’ use is shown in Figure 3, in which the symbols ECBs, NBs, IBs, IPBs, and PEBs denote educational–communicative barriers, normative barriers, informational barriers, infrastructural–political barriers, and professional–economic barriers, respectively. Furthermore, BMIU represents the construct of BMIU.

3.4. Final Checklist of the Scale for BMIU

Finally, after analyzing the structural factor of the scale using structural equation modeling (SEM) and second-order CFA, 23 items/indicators were introduced as the final checklist of the index (Table 8).

4. Discussion

The development and validation of this scale revealed five latent factors including ECBs, NBs, IBs, IPBs, and PEBs. Moreover, the results showed that these five latent factors had a high ability to account for sustainability barriers to meteorological information use by farmers. In this respect, it is suggested that these five barriers be seriously considered in future intervention programs reflecting on farmers’ use of meteorological information and weather forecasts. Infrastructural–political barriers were the strongest determinants in the scale for BMIU. Inadequate meteorological stations in agricultural areas, poor recording of observations by meteorological stations, small land area and no attention to potential damages, and neglected importance of providing meteorological information to farmers in Iran’s macro-policies are the most important infrastructural–political barriers. In addition, barriers such as no cooperation between government agencies to establish strong predictive systems in the region and low investments in meteorological information by the government and private sector are other indicators that have been categorized in this dimension. Deficiency and obsolescence of meteorological information registration systems is the main barrier in the field of infrastructure, and it is suggested that responsible organizations increase the number of meteorological information registration centers and update the old systems. Lack of proper cooperation between agricultural program planner organizations, meteorological organizations, and broadcasting centers and ignoring the importance of providing accurate meteorological information to farmers in agricultural policies are the main obstacles in the infrastructural–political dimension. This result has been supported by other studies at the international level. Afouku and Obiazi [31] argued that meteorological infrastructures and policies of Nigeria government have a significant impact on the reluctance of farmers to use meteorological and climate-change-related information. Krell et al. [32] stated that political considerations and weakness of the infrastructures are of the main limitations for adaptive responses of the farming communities against the climate change impacts. Similar findings have been reported by the researchers from other countries including Zambia [52] and Egypt [53]. To be specific, most of these studies suggest that, in order to provide easier and better meteorological information to farmers, first, inter-institutional cooperation between stakeholders should be increased. Then, providing accurate information about the weather and meteorological conditions in different seasons of the year should be followed and monitored by decision makers, planners, and policymakers in the agricultural sector. Agricultural extension and education change agents can help the executive staff of cooperating stakeholders. Many of the executive staff of organizations providing services such as meteorological information in agricultural areas of most countries are just trying to deliver the messages (mainly technical messages). However, agricultural extension and education practitioners can deliver or help the executive staff of cooperating organizations to deliver these technical messages effectively in the form of more applicable and comprehensible short tips.
As the results showed, professional–economic barriers were the second key latent dimension of BMIU. Lack of capable and experienced specialists to predict climate variability in the region, costs of meteorological information use, and the absence of meteorologists in the agricultural areas were the main indicators in this category of barriers. In the field of professional barriers, two important points should not be overlooked. The first point is related to the lack of capable and experienced specialists to predict climate change in all the meteorological centers. This causes diminishing the quality of work of meteorologists. The second point in this regard is the lack of meteorologists. In other words, the second point highlights the number of experts. Economic barriers are also among the main obstacles for farmers to use meteorological information. The importance of this recommendation has been approved by other researchers see [33,54]. Lin et al. [33] showed that the economic factors such as high cost of the meteorological information have a significant impact on the reluctance of farmers to use the weather prediction services in Taiwan. Thus, they suggest that these farmers should be provided with low-cost services. Behailu et al. [54] concluded that, from the farmers point of view, some of the predictions are not accurate in Ethiopia. They also emphasized that some of the experts of meteorological centers have not enough knowledge and expertise. Accordingly, it is recommended that the meteorological centers reduce the initial costs of providing meteorological information. In addition, it is suggested that meteorological centers pay more attention to hiring highly specialized and skilled personnel in the process of recruiting experts. Additionally, they should increase their executive staff in local weather forecasting centers.
The normative barriers were the third major category of barriers to farmers’ use of meteorological information and predictions. Taken together, the normative barriers in the context of such studies refer to erroneous and institutionalized norms of meteorological information usage in some agricultural communities. This problem has been reported as a major obstacle, especially in most developing and underdeveloped countries, see [1,53,55]. Sharifzadeh et al. [1], in an actor–network analysis of weather information in Iran, revealed that social norms of farming communities have negative impacts on the adoption of these services. These researchers, however, suggest that educated farmers can be a turning point to change these negative perspectives towards weather information. Kassem et al. [53] reported similar results for the adoption of climate-related predictions in Egypt. Salite [55] also introduced the tradition and negative attitude towards new climate prediction systems as one of the main limiting factors of applying weather services in Mozambique. These incorrect individual and social norms have led to a kind of stereotype-centeredness in agricultural societies. The key indicators of this aspect include lack of risk-taking [56], pessimism due to some wrong forecasts in the past, fatalism on climate changes (i.e., uncontrollability), and extreme self-centrism in predicting agricultural climate issues. Given that the majority of the farmers are elderly farmers and that changing and improving individual and social norms are more difficult among older and less educated farmers than among young and educated farmers, investing in normative changes in the elderly might not be cost-effective. More interestingly, young and educated farmers are often used as sources of information on meteorological issues and forecasts. Therefore, it is suggested that organizations such as the meteorological organization and the authorities of agricultural development use the potential capacities of these young farmers to guide individual and social norms in the application of meteorological information and forecasts.
Informational barriers were the fourth most important factor in the scale for BMIU. The most prominent indicators of this stratum of barriers included low-quality weather forecasts, no attention to users’ specific needs in providing meteorological information, distortion of real information content by organizations, slow pace of meteorological data transmission to farmers, linguistic differences in the provision of information, and specialized texts and meteorological recommendations and no understanding by farmers. Given that mass media such as radio and television are the main means of informing farmers about the weather and meteorological conditions in many countries, see [31,32,33,34], it is recommended that broadcasting centers revise their policies and processes in transmitting meteorological information to the agricultural and rural communities. In addition, the potential of cyberspace and membership of many educated young people of agricultural communities to social networks can be used as an effective tool to deliver meteorological information. The applicability of this recommendation has been supported by others. For instance, Dumenu and Tiamgne [52] concluded that information barriers are of the main factors resulting in the vulnerability of farming communities against climate change in Zambia. Similar results can be found among the results of the researchers from Brazil [26], Kenya [27,32], Vietnam [28], Nigeria [31], and Taiwan [33]. Iranian farmers in general, and farmers in West Azerbaijan Province in particular, are composed of different ethnicities. Broadcasting centers, however, generally emphasize the transmission of information in one language. As a result, meteorological information is not available to a wide range of farmers in a timely manner. To fill this gap, it is suggested that such information should be provided in different languages. In addition, it is suggested that meteorological information should be provided to farmers more accurately and in a timely manner; this will reduce lack of trust in meteorological information and forecasts among farmers, and they will be able to take timely measures to reduce the potential risks of meteorological changes.
Based on the results of the index validation process, the educational–communicative barriers were the fifth strong determinant factor of not using meteorological information by farmers. This result means that, based on the perspectives of farmers as users of information and meteorological forecasts, educational–communication barriers are a major obstacle for them in this field. Low levels of education, knowledge and information poverty, lack of direct communication between farmers and meteorological and agricultural experts, and insufficient awareness of the benefits of using meteorological information are the most prominent indicators of this dimension. They play an important role in not using meteorological information and predictions. In general, it can be concluded from these results that weakness in education and communication of farmers (farmers’ communication with meteorological centers, experts, and their peers) is the main root of farmers’ reluctance to use meteorological information. Based on this finding, it is suggested that farmers attend some facilitation and training courses on effective methods of communicating with meteorological centers and/or obtaining information, reducing agricultural risk through meteorological information, and meteorological information applications. These courses can be conducted by trained agricultural extension staff who are the executive arms of social intervention programs in most countries. It should be noted that educators and agricultural extension experts should use participatory methods in training courses in which farmers themselves actively play a role.

5. Conclusions

Despite the growing number of studies in various areas of meteorological information, not much effort has been made to develop and validate a scale for BMIU by farmers. However, one of the salient requirements of the agricultural sector around the globe is the existence of valid and reliable scales in this field. This necessity is the result of the fact that different actors in the agricultural sector such as farmers, policy-makers, executives, etc., need accurate information about the sustainability barriers to meteorological information use to make the right decisions. However, in most cases, they do not have access to such tools and thus incorrect decisions may be made. Furthermore, wrong policies may be adopted since there is no knowledge about the level of limitations in this area. In this regard, the main objective of this study was to develop and validate a scale for sustainability barriers to meteorological information use by farmers based on a practical eight-step approach that can be utilized in future research.
The most important conclusion of the present study is that the infrastructural–political, professional–economic, and normative factors are the strongest barriers to meteorological information use by farmers. In other words, these three factors are more significant than the informational and educational–communicative barriers. Identified barriers to the use of meteorological information can help reduce the negative impacts of climate change. In many cases, farmers are affected by the consequences of climate change because of the fact that factors such as infrastructural–political, professional–economic, and normative barriers limit their sustainable and timely use of information. However, identifying these barriers and trying to overcome them can facilitate the use of meteorological information for farmers. This increases their ability to adapt more to the impacts of climate change. Finally, it should be noted that the removal of these barriers can lead to the development of climate-smart agriculture among farmers.
From the methodological point of view, developing and validating a scale is a complex process that is inherently difficult. For this reason, very little effort is generally made in this area. This is especially true in the case of sustainability barriers to meteorological information use by farmers from their own perspectives as the insiders. In addition to considering technical dimensions in developing and validating a scale for sustainability barriers to meteorological information use through farmers’ own perspectives, it is necessary to assess social, cultural, and psychological dimensions in the process of scale development and validation. The present study paves the way for various researchers and users by presenting an eight-step approach (Figure 2) to develop and validate a scale so that they can make further efforts in this area. In addition, this approach provides users and researchers with a pragmatic methodology by simplifying the process of developing and validating a scale. They are also provided with very simple and understandable insights so they can test and validate the process. Using such scales to assess and measure the sustainability barriers of meteorological information use can provide users with a very credible decision-making tool. In other words, it can be used to help develop new policies, reform/revise the existing policies, and eliminate misguided ones on barriers to meteorological information and weather forecasts’ usage in agricultural communities. Although the study was conducted in Iran, particularly in West Azerbaijan Province, and the scale was developed using the Iranian farmers’ perspectives, it can also be used for a wider geographical scope at an international level. Due to the widespread climate changes occurring all over the world, many countries and geographical regions may face similar barriers and restrictions. However, it should be noted that the results and implications of the present study can be more applicable to countries that are similar to Iran in terms of climatic conditions and agricultural structure.
The present study, similar to any other research endeavor, had a few limiting factors. Uncovering these limitations can be useful for future studies. First, it should be mentioned that, because of the economic constraints, the sample size was estimated using the Krejcie and Morgan Table. This sampling table estimates the minimum required sample size. However, future studies can conduct this study with a relatively larger sample and in a larger geographical location. Second, the validation approach of the scale for BMIU was mainly based on statistical methods and the perceptions of end-users (i.e., farmers). However, the expert validation of the scale for BMIU is not among the alternatives that can be applied by future researchers.

Supplementary Materials

The following are available online at https://www.mdpi.com/article/10.3390/su132212617/s1, File S1: The qualitative and qualitative questionnaires.

Author Contributions

Conceptualization, methodology, software, formal analysis, data curation and writing—original draft preparation, N.V.; validation, investigation, resources, writing—review and editing, visualization, supervision, and project administration, L.H., M.B., N.F.H., M.F. and H.A.; formal analysis and writing—review and editing, A.-H.V., Y.K.P.-A. and A.K. All authors have read and agreed to the published version of the manuscript.

Funding

This research received no external funding.

Institutional Review Board Statement

Not applicable.

Informed Consent Statement

Not applicable.

Data Availability Statement

Raw data were generated at Shiraz University. We confirm that the data, models, or the methodology used in the research are proprietary, and the derived data supporting the findings of this study are available from the first author on request.

Acknowledgments

The authors hereby express their special gratitude to all the farmers who participated in the interviews and completed the questionnaires with great patience as well as the surveyors and interviewers who did their best in the data collection process. This research paper was partly funded by the Strategic Priority Research Program of Chinese Academy of Sciences (Grant No. XDA20060303) and the Chinese Academy of Sciences President’s International Fellowship Initiative (PIFI grant no. 2021VCA0004).

Conflicts of Interest

The authors declare no conflict of interest.

References

  1. Sharifzadeh, M.; Zamani, G.H.; Karami, E.; Khalili, D.; Tatnall, A. Climate Information Use: An Actor-Network Theory Perspective. In Technological Advancements and the Impact of Actor-Network Theory; Tantall, A., Ed.; IGI Global: Melbourne, Australia, 2012; pp. 35–60. [Google Scholar]
  2. Harjanne, A. Servitizing climate Science-Institutional analysis of climate services discourse and its implications. Glob. Environ. Chang. 2017, 46, 1–16. [Google Scholar] [CrossRef]
  3. Hollas, C.E.; Bolsan, A.C.; Venturin, B.; Bonassa, G.; Tápparo, D.C.; Cândido, D.; Antes, F.G.; Vanotti, M.B.; Szögi, A.A.; Kunz, A. Second-Generation Phosphorus: Recovery from Wastes towards the Sustainability of Production Chains. Sustainability 2021, 13, 5919. [Google Scholar] [CrossRef]
  4. Hassanpour, B.; Amiri Ardekani, M. Investigation of factors influencing the effectiveness of agro-meteorological information from the viewpoint of wheat farmers in Kohgiluyeh-va-Boyerahmad Province. Iran Agric. Educ. Ext. J. 2020, 15, 187–203. (In Persian) [Google Scholar]
  5. Borrajo-Millán, F.; Alonso-Almeida, M.-d.-M.; Escat-Cortes, M.; Yi, L. Sentiment Analysis to Measure Quality and Build Sustainability in Tourism Destinations. Sustainability 2021, 13, 6015. [Google Scholar] [CrossRef]
  6. Hu, Q.; Zillig, L.M.P.; Lynne, G.D.; Tomkins, A.J.; Waltman, W.J.; Hayes, M.J.; Wilhite, D.A. Understanding farmers’ forecast use from their beliefs, values, social norms, and perceived obstacles. J. Appl. Meteorol. Climatol. 2006, 45, 1190–1201. [Google Scholar] [CrossRef]
  7. Sung, J.H.; Baek, D.; Ryu, Y.; Seo, S.B.; Seong, K.-W. Effects of Hydro-Meteorological Factors on Streamflow Withdrawal for Irrigation in Yeongsan River Basin. Sustainability 2021, 13, 4969. [Google Scholar] [CrossRef]
  8. Sharifzadeh, M.; Zamani, G.H.; Khalili, D.; Karami, E. Agricultural climate information use: An application of the planned behaviour theory. J. Agric. Sci. Technol. 2012, 14, 479–492. [Google Scholar]
  9. FAO. The Impact of Disasters and Crises on Agriculture and Food Security. 2017. Available online: http://www.fao.org (accessed on 10 June 2020).
  10. Hazran, Z.; Norsida, M.; Nitty Hirawaty, K.; Nolila, M.N. The post-flood impacts on farmers, agricultural sector and food security in Kelantan. Int. J. Acad. Res. Bus. Soc. Sci. 2017, 7, 175–184. [Google Scholar]
  11. Mertz, O.; D’haen, S.; Maiga, A.; Moussa, I.B.; Barbier, B.; Diouf, A.; Dabi, D. Climate variability and environmental stress in the Sudan-Sahel zone of West Africa. Ambio 2012, 41, 380–392. [Google Scholar] [CrossRef] [Green Version]
  12. Doblas-Reyes, F.; Garcia, A.; Hansen, J.; Mariani, L.; Nain, A.; Ramesh, K.; Venkataraman, R.; Weather and Climate Forecasts for Agriculture. Guide to Agricultural, Meteorological Practices. 2003. Available online: http://citeseerx.ist.psu.edu (accessed on 15 November 2019).
  13. Wamalwa, I.W.; Mburu, B.K.; Mang’uriu, D.G. Agro climate and weather information dissemination and its influence on adoption of climate smart practices among small scale farmers of Kisii country, Kenya. J. Biol. Agric. Healthc. 2016, 6, 14–23. [Google Scholar]
  14. Mu, L.; Fang, L.; Liu, Y.; Wang, C. Identifying Barriers and Enablers for Climate Change Adaptation of Farmers in Semi-Arid North-Western China. Sustainability 2020, 12, 7494. [Google Scholar] [CrossRef]
  15. Maleki, T.; Kouhestani, E.; Zarifian, S.; Zarafshani, K. Adaptation of eastern regions of Urmia Lake Basin to water crisis. Iran J. Agric. Educ. Ext. J. 2018, 14, 37–53. (In Persian) [Google Scholar]
  16. Jones, L.; Boyd, E. Exploring social barriers to adaptation: Insights from Western Nepal. Glob. Environ. Chang. 2011, 21, 1262–1274. [Google Scholar] [CrossRef]
  17. Mase, A.S.; Prokopy, L.S. Unrealized potential: A review of perceptions and use of weather and climate information in agricultural decision making. Weather Clim. Soc. 2014, 6, 47–61. [Google Scholar] [CrossRef]
  18. World Bank. World Development Report 2008: Agriculture for Development; The World Bank: Washington, DC, USA, 2008. [Google Scholar]
  19. Bijani, M.; Ghazani, E.; Valizadeh, N.; Fallah Haghighi, N. Predicting and understanding of farmers’ soil conservation behavior in Mazandaran province, Iran. J. Agric. Sci. Technol. 2019, 21, 1705–1719. [Google Scholar]
  20. Vincent, K.; Dougill, A.J.; Dixon, J.L.; Stringer, L.C.; Cull, T. Identifying climate services needs for national planning: Insights from Malawi. Clim. Policy 2017, 17, 189–202. [Google Scholar] [CrossRef] [Green Version]
  21. Stone, R.C.; Meinke, H. Weather, climate, and farmers: An overview. Meteorol. Appl. 2006, 13 (Suppl. S1), 7–20. [Google Scholar] [CrossRef] [Green Version]
  22. Clements, J.; Ray, A.; Anderson, G. The Value of Climate Services across Economic and Public Sectors: A Review of Relevant Literature; United States Agency for International Development (USAID): Washington, DC, USA, 2013. [Google Scholar]
  23. Lemos, M.C.; Kirchhoff, C.J.; Ramprasad, V. Narrowing the climate information usability gap. Nat. Clim. Chang. 2012, 2, 789–794. [Google Scholar] [CrossRef]
  24. Singh, C.; Daron, J.; Bazaz, A.; Ziervogel, G.; Spear, D.; Krishnaswamy, J.; Kituyi, E. The utility of weather and climate information for adaptation decision-making: Current uses and future prospects in Africa and India. Clim. Dev. 2018, 10, 389–405. [Google Scholar] [CrossRef] [Green Version]
  25. Hill, H.S.; Mjelde, J.W.; Love, H.A.; Rubas, D.J.; Fuller, S.W.; Rosenthal, W.; Hammer, G. Implications of seasonal climate forecasts on world wheat trade: A stochastic, dynamic analysis. Can. J. Agric. Econ. 2004, 52, 289–312. [Google Scholar] [CrossRef]
  26. Broad, K.; Pfaff, A.; Taddei, R.; Sankarasubramanian, A.; Lall, U.; De Souza Filho, F.D.A. Climate, stream flow prediction and water management in northeast Brazil: Societal trends and forecast value. Clim. Chang. 2007, 84, 217–239. [Google Scholar] [CrossRef]
  27. Muema, E.; Mburu, J.; Coulibaly, J.; Mutune, J. Determinants of access and utilisation of seasonal climate information services among smallholder farmers in Makueni County, Kenya. Heliyon 2018, 4, e00889. [Google Scholar] [CrossRef] [Green Version]
  28. Le Dang, H.; Li, E.; Bruwer, J.; Nuberg, I. Farmers’ perceptions of climate variability and barriers to adaptation: Lessons learned from an exploratory study in Vietnam. Mitig. Adapt. Strateg. Glob. Chang. 2014, 19, 531–548. [Google Scholar]
  29. Hansen, J.W.; Vaughan, C.; Kagabo, D.M.; Dinku, T.; Carr, E.R.; Körner, J.; Zougmoré, R.B. Climate services can support african farmers’ context-specific adaptation needs at scale. Front. Sustain. Food Syst. 2019, 3, 21. [Google Scholar] [CrossRef] [Green Version]
  30. Mudombi, S.; Nhamo, G. Access to weather forecasting and early warning information by communal farmers in Seke and Murewa districts, Zimbabwe. J. Hum. Ecol. 2014, 48, 357–366. [Google Scholar] [CrossRef]
  31. Afouku, A.; Obiazi, C. Constraints to Access and Utilization of Meteorological Services in Delta State, Nigeria. Yuzuncu Yıl Univ. J. Agric. Sci 2020, 31, 150–161. [Google Scholar]
  32. Krell, N.T.; Giroux, S.A.; Guido, Z.; Hannah, C.; Lopus, S.E.; Caylor, K.K.; Evans, T.P. Smallholder farmers’ use of mobile phone services in central Kenya. Clim. Dev. 2021, 13, 215–227. [Google Scholar] [CrossRef] [Green Version]
  33. Lin, H.I.; Liou, J.L.; Hsu, S.H. Economic Valuation of Public Meteorological Information Services—A Case Study of Agricultural Producers in Taiwan. Atmosphere 2019, 10, 753. [Google Scholar] [CrossRef] [Green Version]
  34. Hein, Y.; Vijitsrikamol, K.; Attavanich, W.; Janekarnkij, P. Do farmers perceive the trends of local climate variability accurately? An analysis of farmers’ perceptions and meteorological data in Myanmar. Climate 2019, 7, 64. [Google Scholar] [CrossRef] [Green Version]
  35. Frisvold, G.B.; Murugesan, A. Use of weather information for agricultural decision making. Weather Clim. Soc. 2013, 5, 55–69. [Google Scholar] [CrossRef]
  36. Hansen, J.W. Applying seasonal climate prediction to agricultural production. Agric. Syst. 2002, 74, 305–307. [Google Scholar] [CrossRef]
  37. Statistical Center of Iran. Statistical YearBook of Fars Province for the Year 2017. 2019. Available online: http://nashriatamari.fars.ir (accessed on 10 January 2020).
  38. Etikan, I.; Alkassim, R.; Abubakar, S. Comparision of snowball sampling and sequential sampling technique. Biom. Biostat. Int. J. 2016, 3, 55. [Google Scholar] [CrossRef] [Green Version]
  39. Mansoorfar, K. Advanced Statistical Methods Using SPSS; University of Tehran: Tehran, Iran, 2018. (In Persian) [Google Scholar]
  40. Johnson, T.P. Snowball sampling: Introduction; Wiley StatsRef, Statistics Reference Online: Hoboken, NJ, USA, 2014; pp. 1–20. [Google Scholar]
  41. Fatemi, M.; Karami, E. Case study and analysis of the drivers and impacts of drought. Iran J. Agric. Educ. Ext. J. 2010, 6, 77–96. Available online: ‏https://www.climate-services.org (accessed on 20 January 2020).
  42. Krejcie, R.V.; Morgan, D.W. Determining sample size for research activities. Educ. Psychol. Meas. 1970, 30, 607–610. [Google Scholar] [CrossRef]
  43. Kalantari, K. Data Processing and Analysis in Socio-Economic Research; Design and Landscape Publishing: Tehran, Iran, 2018. (In Persian) [Google Scholar]
  44. Nunnally, J.; Bernstein, I. Psychometric Theory; McGraw-Hill: New York, NY, USA, 1994. [Google Scholar]
  45. Habibpour Gatabi, K.; Safari Shali, R. Comprehensive Manual for Using SPSS in Survey Researches; Luyeh Publication: Tehran, Iran, 2018. (In Persian) [Google Scholar]
  46. Howard, M.C. A review of exploratory factor analysis decisions and overview of current practices: What we are doing and how can we improve? Int. J. Hum. Comput. Interact. 2016, 32, 51–62. [Google Scholar] [CrossRef]
  47. Kaiser, H.F. The application of electronic computers to factor analysis. Educ. Psychol. Meas. 1960, 20, 141–151 . [Google Scholar] [CrossRef]
  48. Fornell, C.; Larcker, D.F. Evaluating structural equation models with unobservable variables and measurement error. J. Mark. Res. 1981, 18, 39–50. [Google Scholar] [CrossRef]
  49. Huang, C.C.; Wang, Y.M.; Wu, T.W.; Wang, P.A. An empirical analysis of the antecedents and performance consequences of using the moodle platform. Int. J. Inf. Educ. Technol. 2013, 3, 217. [Google Scholar] [CrossRef] [Green Version]
  50. Shyu, C.S.; Li, Y.L.; Tang, Y. Applying confirmatory factor analysis on the measure for restaurant over-service. J. Int. Manag. Stud. 2013, 8, 10–16. [Google Scholar]
  51. Cheung, G.W.; Wang, C. Current approaches for assessing convergent and discriminant validity with SEM: Issues and solutions. Acad. Manag. Ann. 2017, 2017, 12706. [Google Scholar] [CrossRef]
  52. Dumenu, W.K.; Tiamgne, X.T. Social vulnerability of smallholder farmers to climate change in Zambia: The applicability of social vulnerability index. SN Appl. Sci. 2020, 2, 1–16. [Google Scholar] [CrossRef] [Green Version]
  53. Kassem, H.S.; Alotaibi, B.A.; Ghoneim, Y.A.; Diab, A.M. Mobile-based advisory services for sustainable agriculture: Assessing farmers’ information behavior. Inf. Dev. 2020, 37, 483–495. [Google Scholar] [CrossRef]
  54. Behailu, G.; Ayal, D.Y.; Zeleke, T.T.; Ture, K.; Bantider, A. Comparative Analysis of Meteorological Records of Climate Variability and Farmers’ Perceptions in Sekota Woreda, Ethiopia. Clim. Serv. 2021, 23, 100239. [Google Scholar] [CrossRef]
  55. Salite, D. Traditional prediction of drought under weather and climate uncertainty: Analyzing the challenges and opportunities for small-scale farmers in Gaza province, southern region of Mozambique. Nat. Hazards 2019, 96, 1289–1309. [Google Scholar] [CrossRef] [Green Version]
  56. Neisi, M.; Bijani, M.; Abbasi, E.; Mahmoudi, H.; Azadi, H. Analyzing farmers’ drought risk management behavior: Evidence from Iran. J. Hydrol. 2020, 590, 125243. [Google Scholar] [CrossRef]
Figure 1. The study area.
Sustainability 13 12617 g001aSustainability 13 12617 g001b
Figure 2. The process of developing the scale of BMIU [source: results of present study].
Sustainability 13 12617 g002
Figure 3. The model for measuring the variable of BMIU or standardized coefficients [source: results of present study].
Sustainability 13 12617 g003
Table 1. Some studies conducted in the field of barriers to the use of meteorological information and forecasts by farmers around the world.
BarriersCountry/Scale of the StudyResearchers
Poor documentation of observations and low level of investment in meteorologyMalawi[20]
Weak policy-making, socio-economic characteristics of farmers, and lack of facilities and resourcesCross-country[21]
Socio-economic characteristics of farmers and lack of facilities and resourcesNepal[16]
Lack of awareness of opportunities and their benefits, and unreliability of information and dataCross-country[22]
Disconnection between users and producers of informationCross-country[23]
Insufficient institutional capacity to provide and use meteorological information effectivelyIndia[24]
Self-forecasting and institutional constraints related to decision makers and the environmentCross-country[25]
Socio-institutional problems, lack of access to the information, difficulties in using information, neglecting information dissemination, and distortion of information contentBrazil[26]
Low access to media (radio, television, etc.), inadequate agricultural extension services, and lack of government funding and supportKenya[27]
Emphasis on the use of incompatible technologies, lack of credit, social communication, low technical knowledge, habit, and lack of access to meteorological informationVietnam[28]
Lack of proper access to information, low accuracy of predictions, and incomprehensible informationAfrica[29]
Lack of access to information, cost of meteorological information, emphasis on old cultivation methodsZimbabwe[30]
Lack of interaction between farmers and organizations, lack of access to information, low literacy, and infrastructural barriersNigeria[31]
Lack of access to information, demographic characteristics, cultural/normative problems, and infrastructural and political barriersKenya[32]
Problems with access to appropriate information, demographic characteristics, high cost of access to information, technical problems, and educational problemsTaiwan[33]
Lack of access to appropriate information and lack of trainingMyanmar[34,35]
Table 2. Concepts extracted from in-depth interviews with farmers on the BMIU.
1No cooperation between government agencies to establish strong predictive systems in the region24Specialized texts and recommendations and no understanding by farmers
2Lack of motivation in agricultural activities25Absence of meteorologists in agricultural areas
3Slow pace of meteorological data transmission to farmers26No attention to users’ specific needs in providing meteorological information
4Poor recording of observations by meteorological stations27No trust in meteorological information
5No agricultural extension training courses28Pessimism due to some wrong forecasts in the past
6Long distance from meteorological stations29Low levels of education
7Inadequate meteorological stations in agricultural areas30Lack of skills related to the use of meteorological statistics and information
8Negligence in publishing information by organizations31Inadequate facilities for necessary meteorological forecasts in the region
9Low use of mass media32Limitations of the Meteorological Organization in providing information
10Influence of farmers who are not interested and do not trust the meteorological information33No strong systems to predict climate change
11No risk-taking34Distortion of real information content by organizations
12Lack of capable and experienced professionals to predict climate change in the region35Fatalism on climate changes (i.e., uncontrollability)
13Small land area and no attention to potential damages36Neglected importance of providing information to farmers in macro-policies
14Traditional ideas about the method and timing of planting agricultural products37Low investments in meteorological information by the government and private sector
15No proper planning and purpose in agricultural activities38Low cooperation between organizations such as the Ministry of Agriculture Jihad and Islamic Republic of Iran Broadcasting (IRIB) in transmitting meteorological information to farmers
16Non-institutionalization of the importance and usage of meteorological information in agriculture39Knowledge and information poverty
17Costs of meteorological information use40Failure of operators to answer farmers’ questions
18Self-centrism in predicting agricultural climate issues41Lack of direct communication between farmers and meteorological and agricultural experts
19No ability to communicate individually with meteorological centers42Weakness in planning by government organizations and agencies
20Linguistic differences in the provision of information43Farmers’ low spatial attachment to agricultural lands
21Insufficient knowledge about the benefits of meteorological information use44Low-quality weather forecasts
22No interface between the Meteorological Organization and farmers to have quick access to meteorological information45Low value of meteorological information and weather forecasts
23Lack of future-oriented time perspectives
Table 3. Estimation related to the KMO and Bartlett statistics.
Identified FactorsKMOBartlett’s SphericitydfSig.
50.8676140.906660.001
Table 4. Extracted latent variables, eigenvalues, and percentage of explained variance.
Un-Rotated FactorsRotated Factors
Factors/Latent VariableEigenvaluesPercent of Explained VarianceCumulative %EigenvaluesPercent of Explained VarianceCumulative %
110.51628.42128.4215.50514.87714.877
23.2508.78437.2504.46812.07726.954
32.8197.61944.8244.39611.88038.834
42.2466.07050.8943.6769.93548.769
51.5054.06854.9622.2916.19354.962
Table 5. Factors/dimensions identified for the scale of BMIU.
FactorItem/IndicatorFactor 1Factor 2Factor 3Factor 4Factor 5
Educational–communicative barriers (ECB)Low levels of education0.761
Knowledge and information poverty0.757
Lack of direct communication between farmers and meteorological and agricultural experts0.738
Insufficient knowledge about the benefits of meteorological information use0.701
Influence of farmers who are not interested and do not trust the meteorological information0.692
Lack of motivation in agricultural activities0.680
Farmers’ low spatial attachment to agricultural lands 0.670
No ability to communicate individually with meteorological centers0.655
No agricultural extension training courses on how to use meteorological information and lack of awareness of its importance0.620
Lack of skills related to the use of meteorological statistics and information0.600
Normative barriers (NB)Self-centrism in predicting agricultural climate issues 0.787
No risk-taking 0.743
No trust in meteorological information 0.731
Traditional ideas about the method and timing of planting agricultural products 0.727
Non-institutionalization of the importance and usage of meteorological information in agriculture 0.685
Pessimism due to some wrong forecasts in the past 0.570
No proper planning and purpose in agricultural activities 0.545
Fatalism on climate changes (i.e., uncontrollability) 0.538
Informational barriers (IB)No attention to users’ specific needs in providing meteorological information 0.744
Low-quality weather forecasts 0.731
Low cooperation between organizations such as the Ministry of Agriculture Jihad and Islamic Republic of Iran Broadcasting (IRIB) in transmitting meteorological information to farmers 0.686
Slow pace of meteorological data transmission to farmers 0.646
Linguistic differences in the provision of information 0.645
Specialized texts and meteorological recommendations and no understanding by farmers 0.632
Distortion of real information content by organizations 0.629
Failure of operators to answer farmers’ questions about agricultural information 0.573
Infrastructural–political barriers (IPB)Inadequate meteorological stations in agricultural areas 0.743
Poor recording of observations by meteorological stations 0.703
Small land area and no attention to potential damages 0.700
Neglected importance of providing meteorological information to farmers in Iran’s macro-policies 0.663
Inadequate facilities for necessary meteorological forecasts in the region 0.650
No cooperation between government agencies to establish strong predictive systems in the region 0.647
Low investments in meteorological information by the government and private sector 0.628
Professional–economic barriers (PEB)Lack of capable and experienced professionals to predict climate change in the region 0.660
Costs of meteorological information use 0.634
Absence of meteorologists in agricultural areas 0.614
Table 6. Factor loadings, significance levels, and measurement models’ fit indices of the scale for BMIU.
Factor/DimensionIndicatorLoading Factor t ValueGama Coefficientt ValueCRAVE
Educational–communicative barriers (ECB)ECB10.68--0.426.190.830.45
ECB20.8513.33
ECB30.6410.76
ECB40.6811.36
ECB50.539.10
ECB60.6410.82
Normative barriers (NB)NB10.66--0.638.370.780.42
NB20.629.63
NB30.7310.85
NB40.659.97
NB50.599.32
Informational barriers (IB)IB10.77--0.507.370.800.46
IB20.7112.49
IB30.7312.82
IB40.6411.35
IB50.529.17
Infrastructural–political barriers (IPB)IPB10.62--0.839.520.760.46
IPB20.7910.82
IPB30.7310.44
IPB40.528.18
Professional–economic barriers (PEB)PEB10.69--0.729.260.750.50
PEB20.7310.73
PEB30.7110.61
Table 7. Fitness indices of the scale for BMIU.
IndexRMSEAAGFIGFINFICFIχ2/dfχ2df
Value0.0730.920.950.950.912.9663.01225
Table 8. Final checklist of the scale for BMIU.
Factor/DimensionItem/Indicator
Educational–communicative barriers (ECB)Knowledge and information poverty
Lack of direct communication between farmers and meteorological and agricultural experts
Insufficient knowledge about the benefits of meteorological information use
No ability to communicate individually with meteorological centers
No agricultural extension training courses on how to use meteorological information and lack of awareness of its importance
Lack of skills related to the use of meteorological statistics and information
Normative barriers (NB)No trust in meteorological information
Traditional ideas about the method and timing of planting agricultural products
Non-institutionalization of the importance and usage of meteorological information in agriculture
Pessimism due to wrong forecasts in the past
Fatalism on climate changes (i.e., uncontrollability)
Informational barriers (IB)No attention to users’ specific needs in providing meteorological information
Low-quality weather forecasts
Linguistic differences in the provision of information
Specialized texts and meteorological recommendations and no understanding by farmers
Distortion of real information content by organizations
Infrastructural–political barriers (IPB)Inadequate meteorological stations in agricultural areas
Poor recording of observations by meteorological stations
Neglected importance of providing meteorological information to farmers in Iran’s macro-policies
Low investments in meteorological information by the government and private sector
Professional–economic barriers (PEB)Lack of capable and experienced professionals to predict climate change in the region
Costs of meteorological information use
Absence of meteorologists in agricultural areas
Publisher’s Note: MDPI stays neutral with regard to jurisdictional claims in published maps and institutional affiliations.

