
Assessing Rainwater Harvesting Potential in Urban Areas: A Building Information Modelling (BIM) Approach

 ,
,  ,
,  ,
,  ,
,  ,
,  and
and 
Abstract
:1. Introduction
2. Materials and Methods
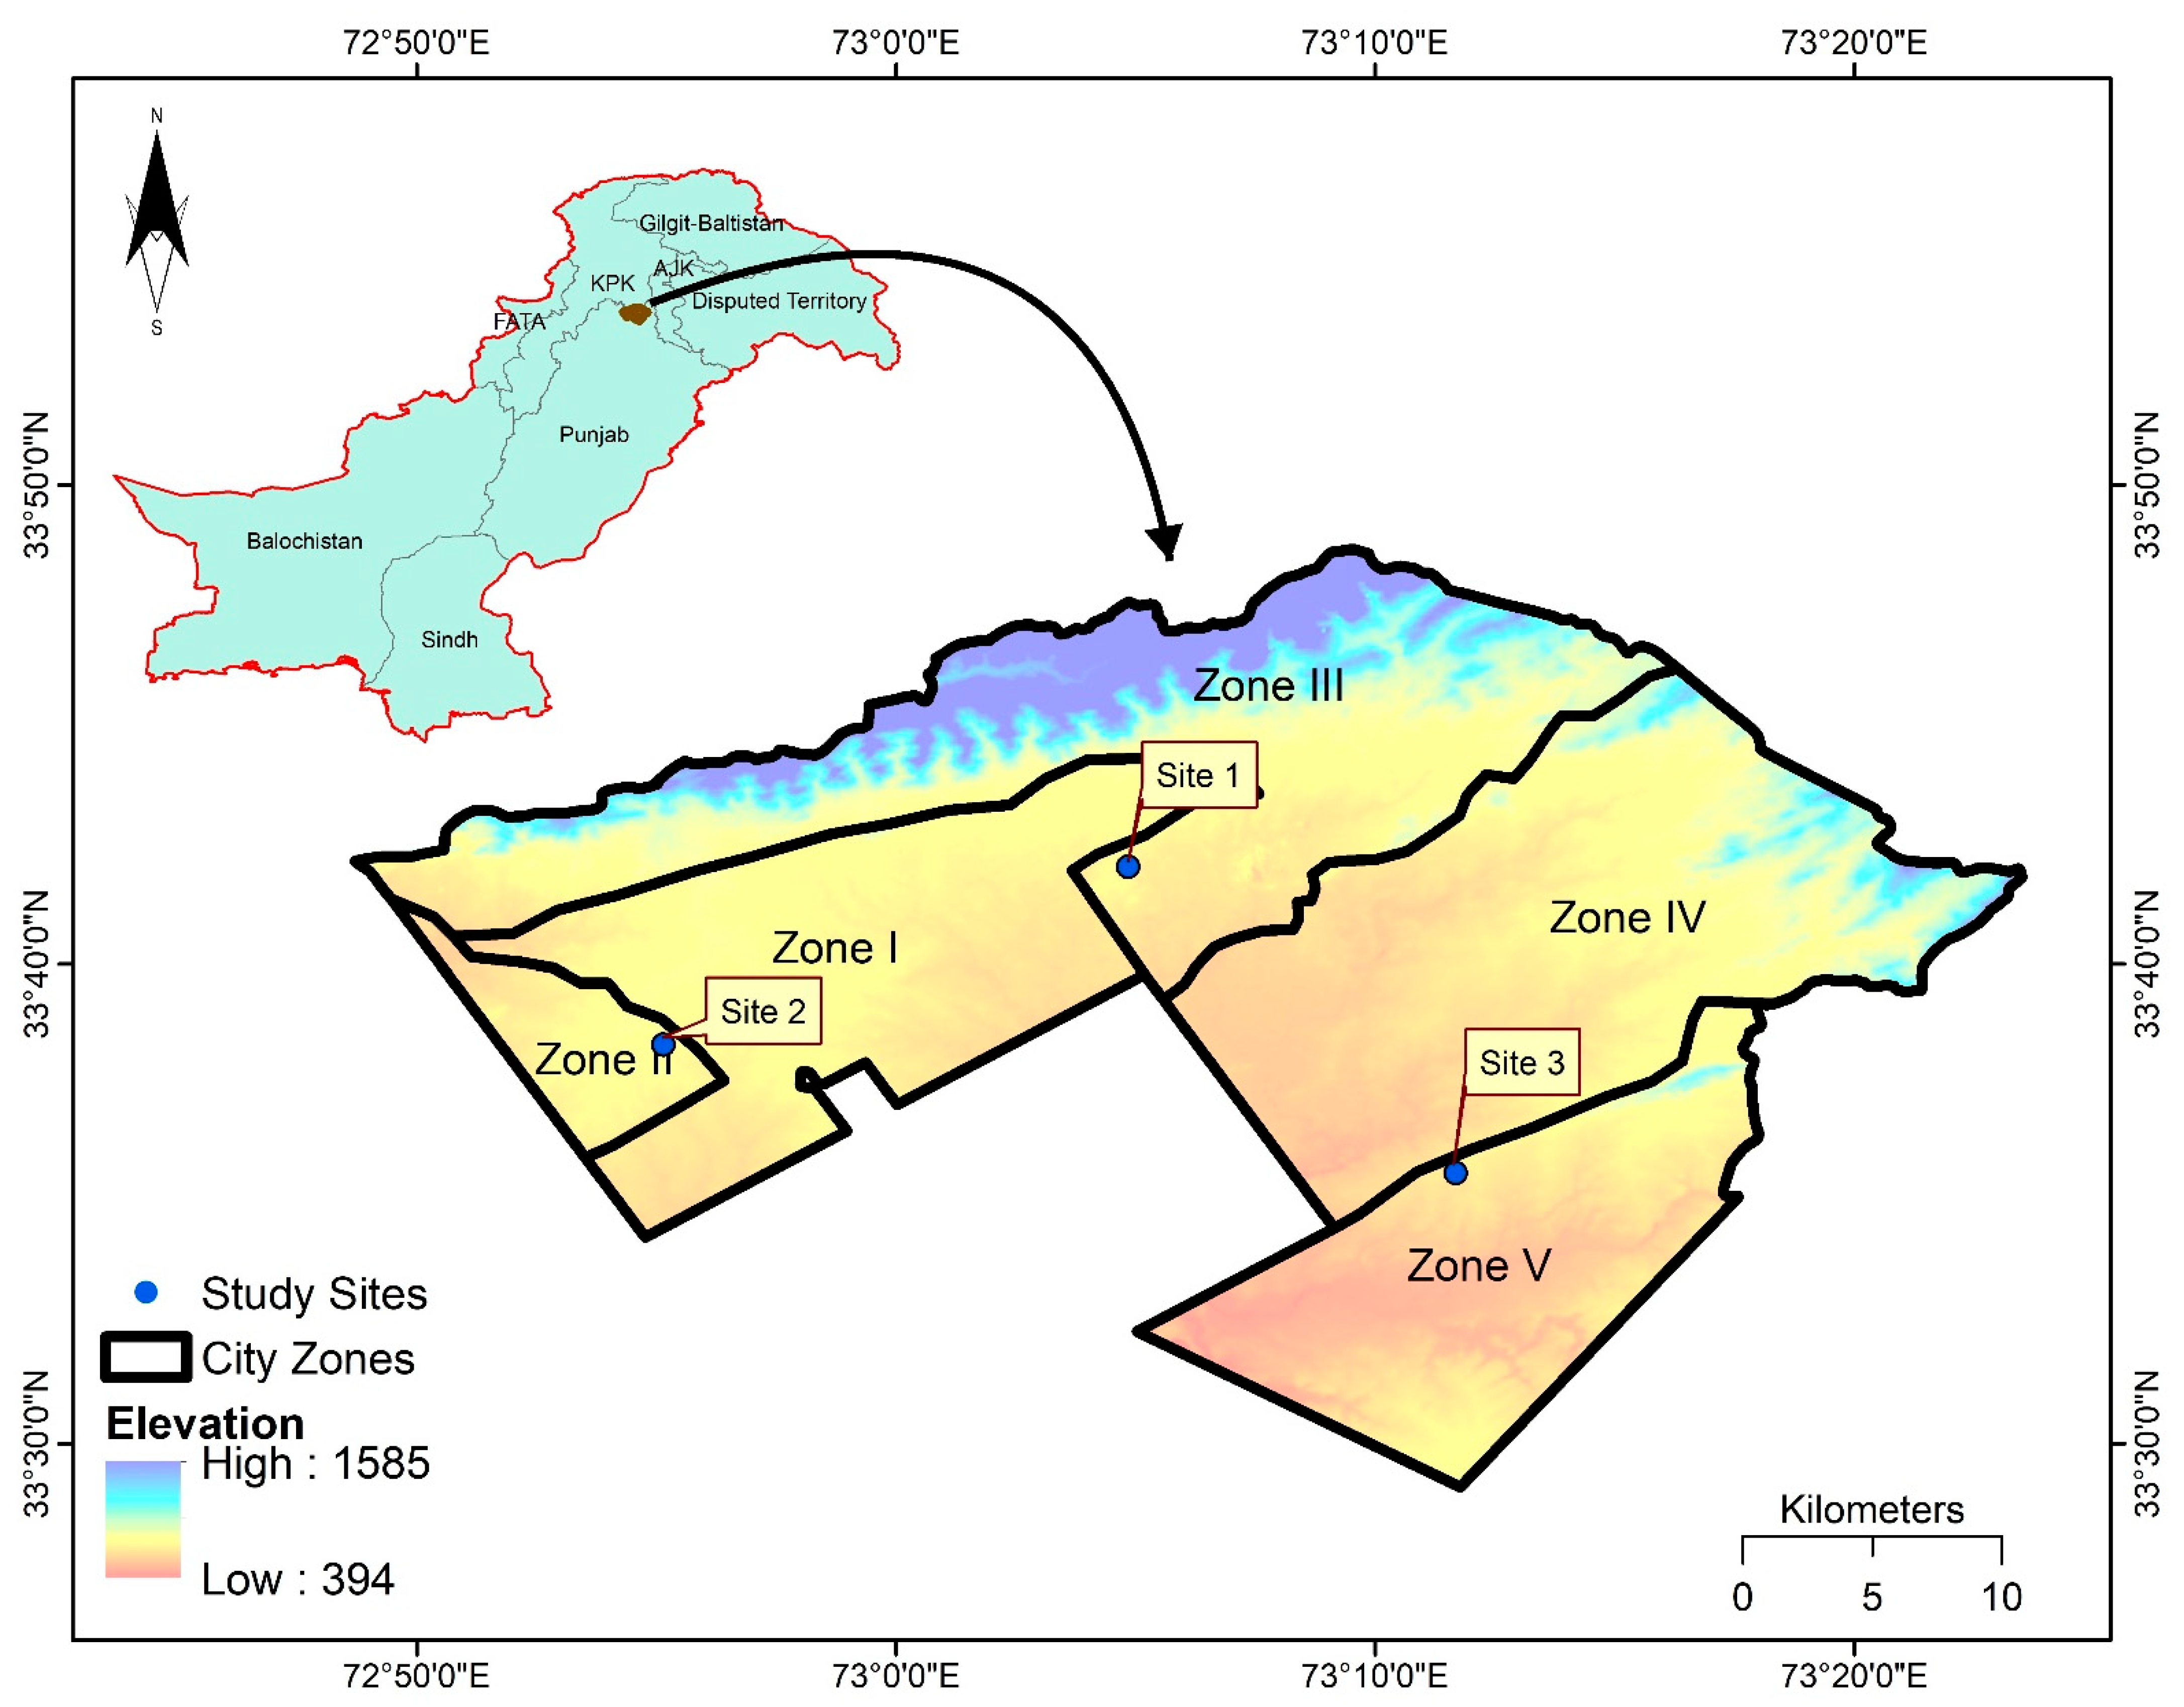
- Rainfall data were only available for these three sites (Table 1) and were taken from the Pakistan Meteorological Department (PMD) (https://www.pmd.gov.pk accessed on 6 June 2021).
- Proposed sites were visited, common structures of the surrounding building were considered, and the roof area was calculated.
- A concrete surface, which is more viable and smoother regarding water flow with a slope of 5°, was developed and used.
- The roofing area (RA) was calculated according to the equation suggested by [51].
- The runoff coefficient of the rainwater was taken from [49].
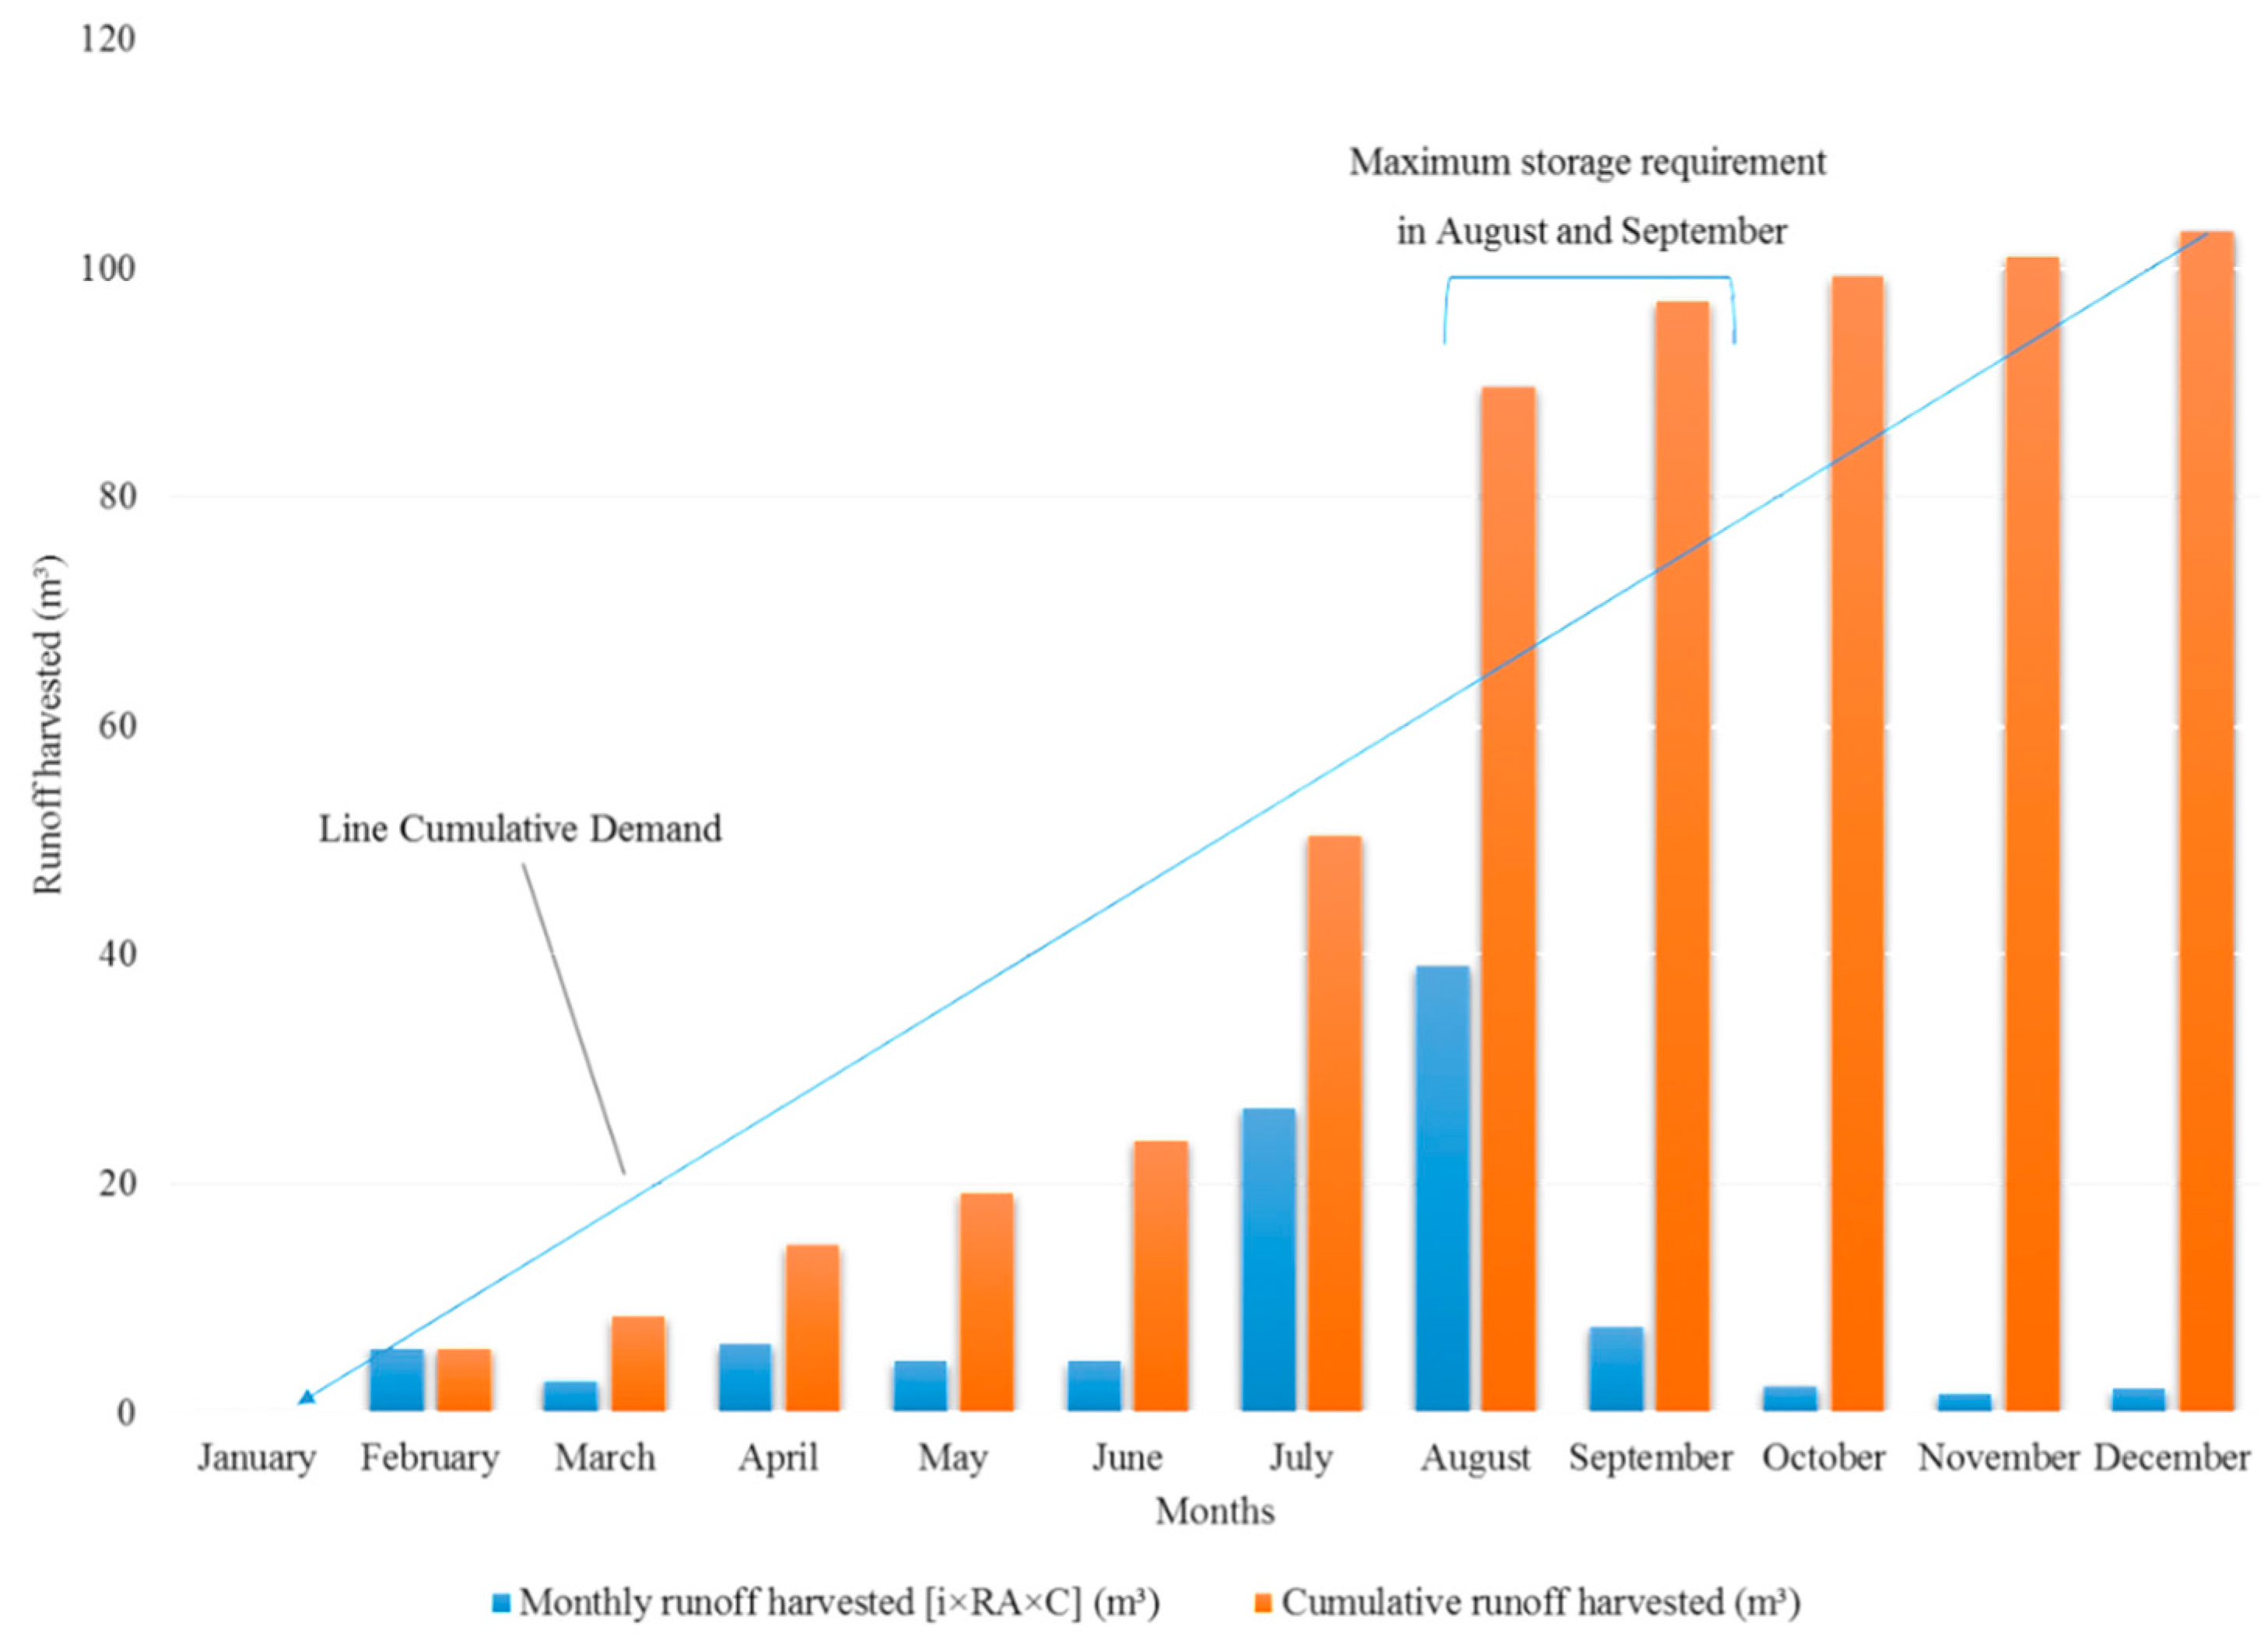
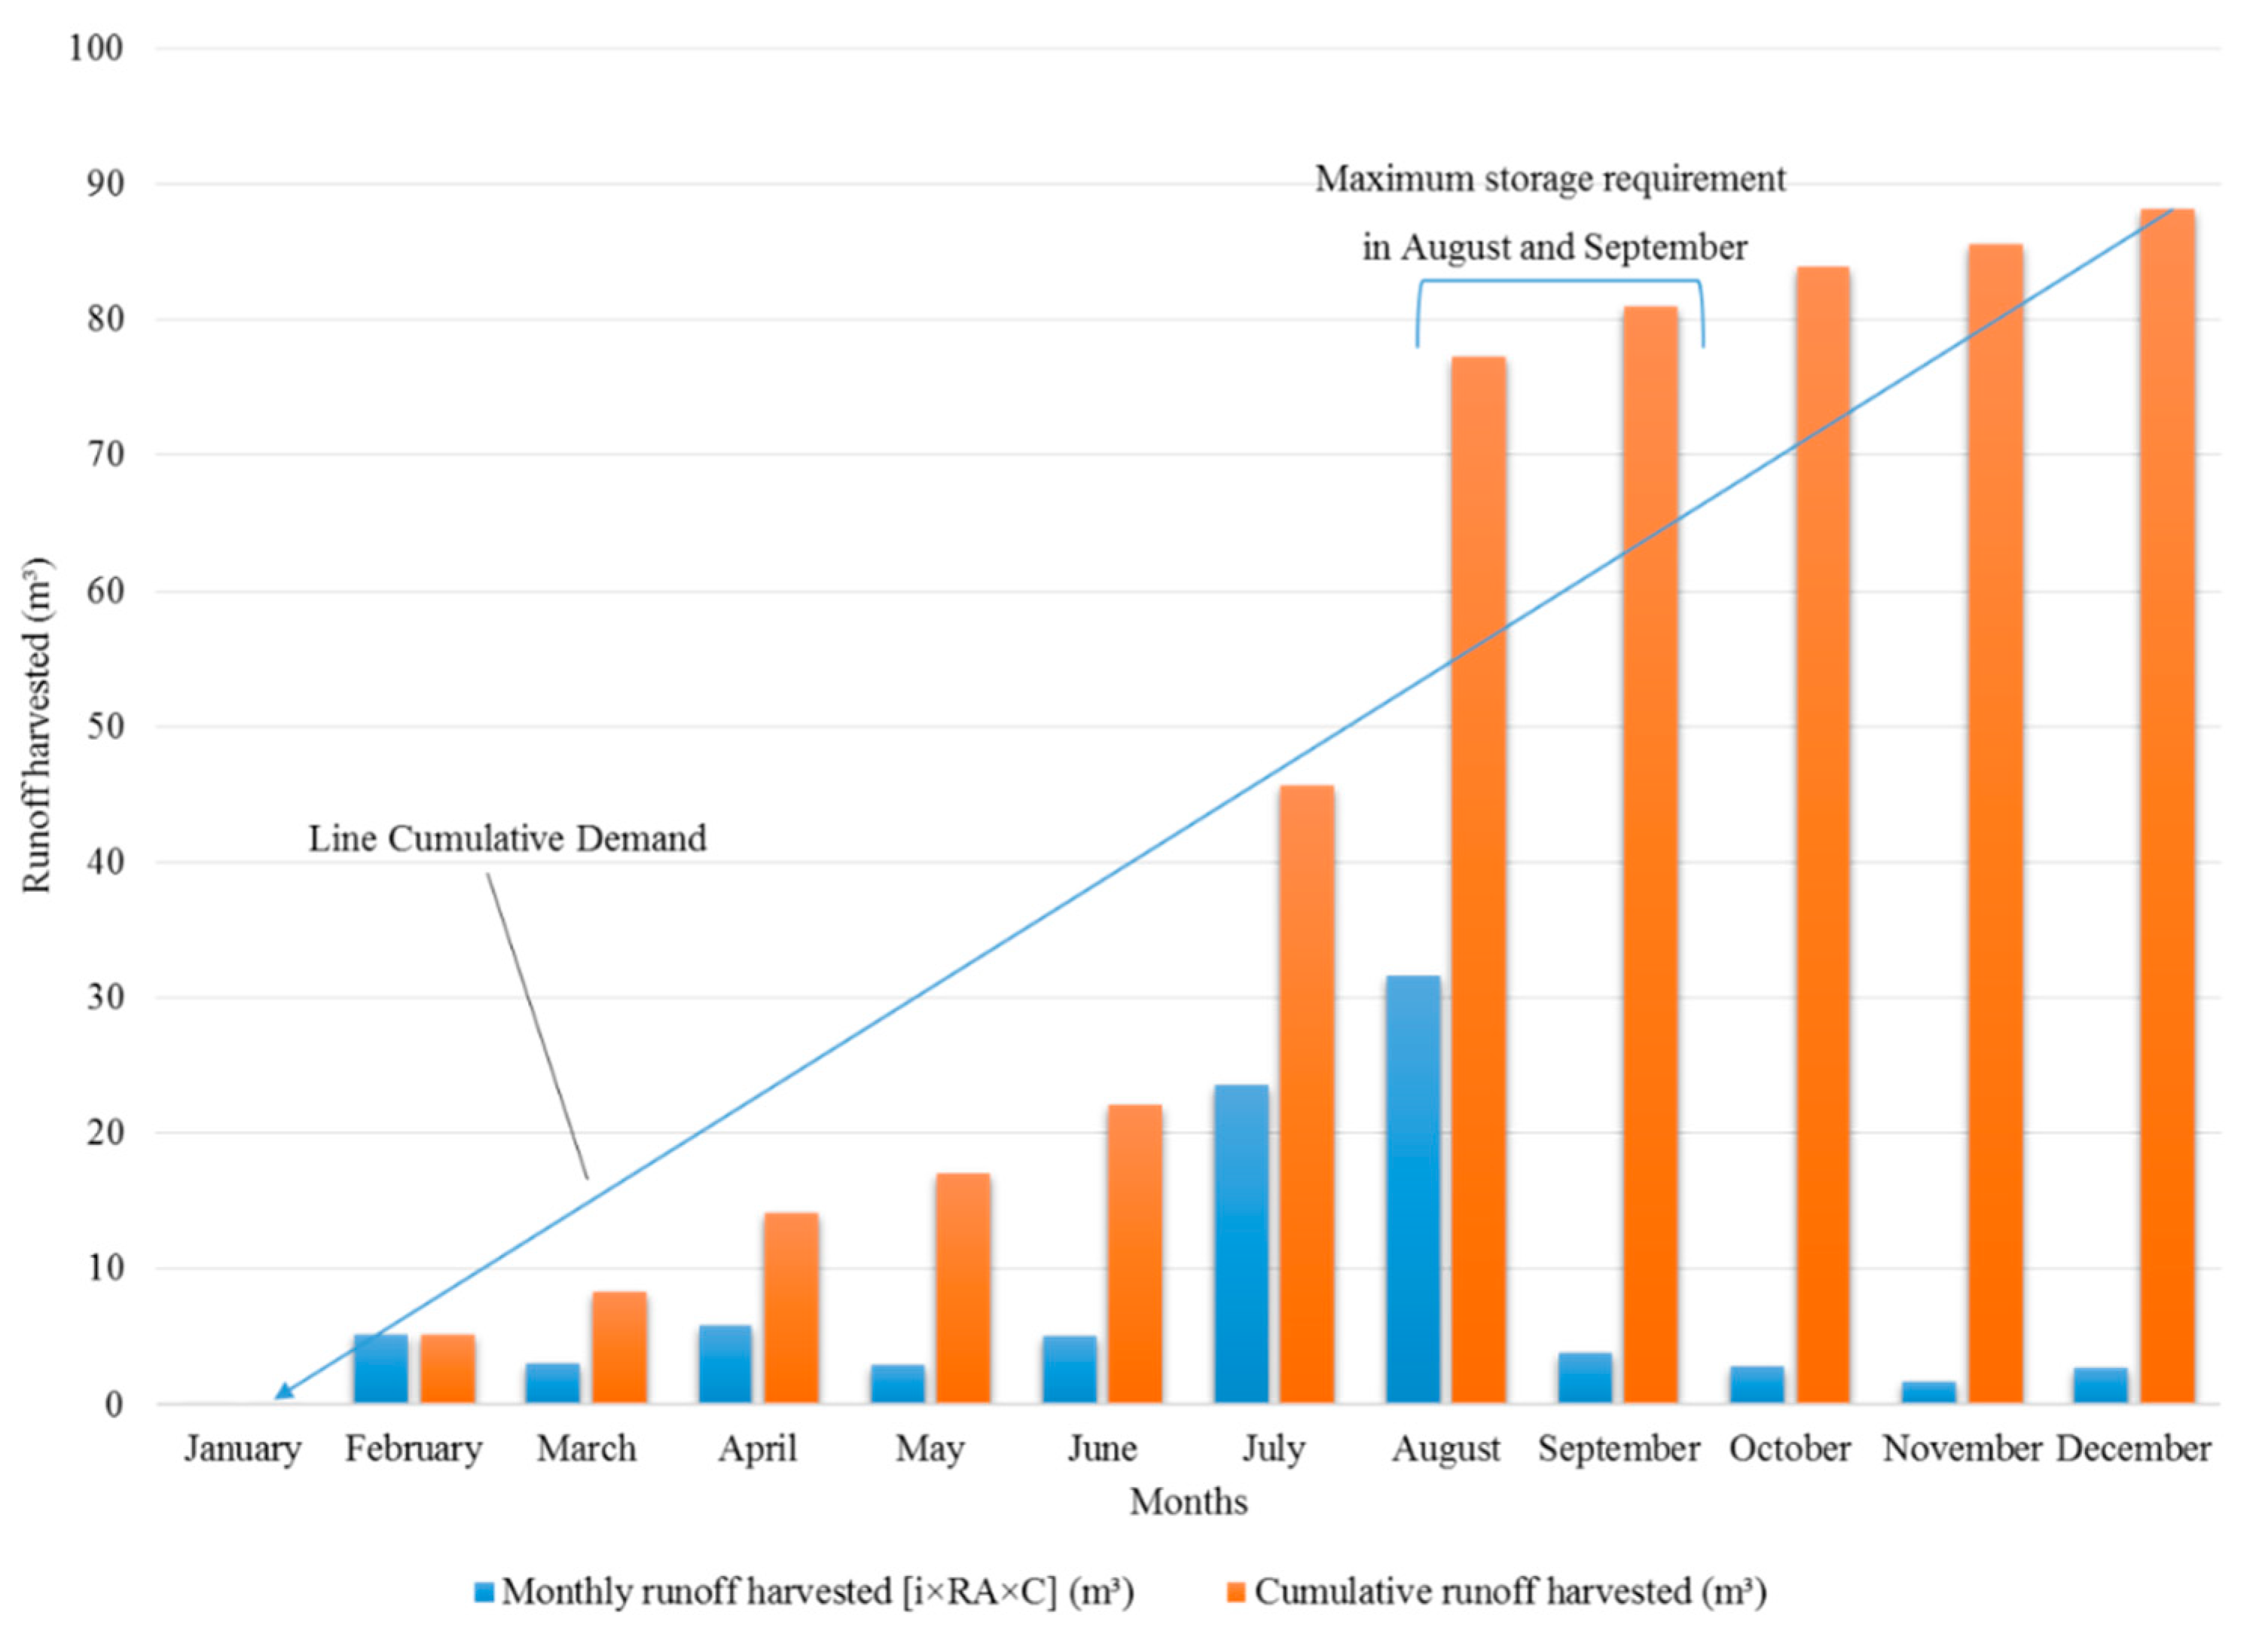
- RA of 90 m2, a coefficient of 0.8, and the monthly average rainfall for the last four years were used to find the monthly RwH potential in liters in the case study area.
- The cumulative RwH potential was derived from each month’s RwH potential.
- The average difference between the demand line and the accumulated rainfall provides the tank storage capacity for the storage of all of the accumulated rainwater.
2.1. Study Area
2.2. Rainfall Data Acquisition and Details
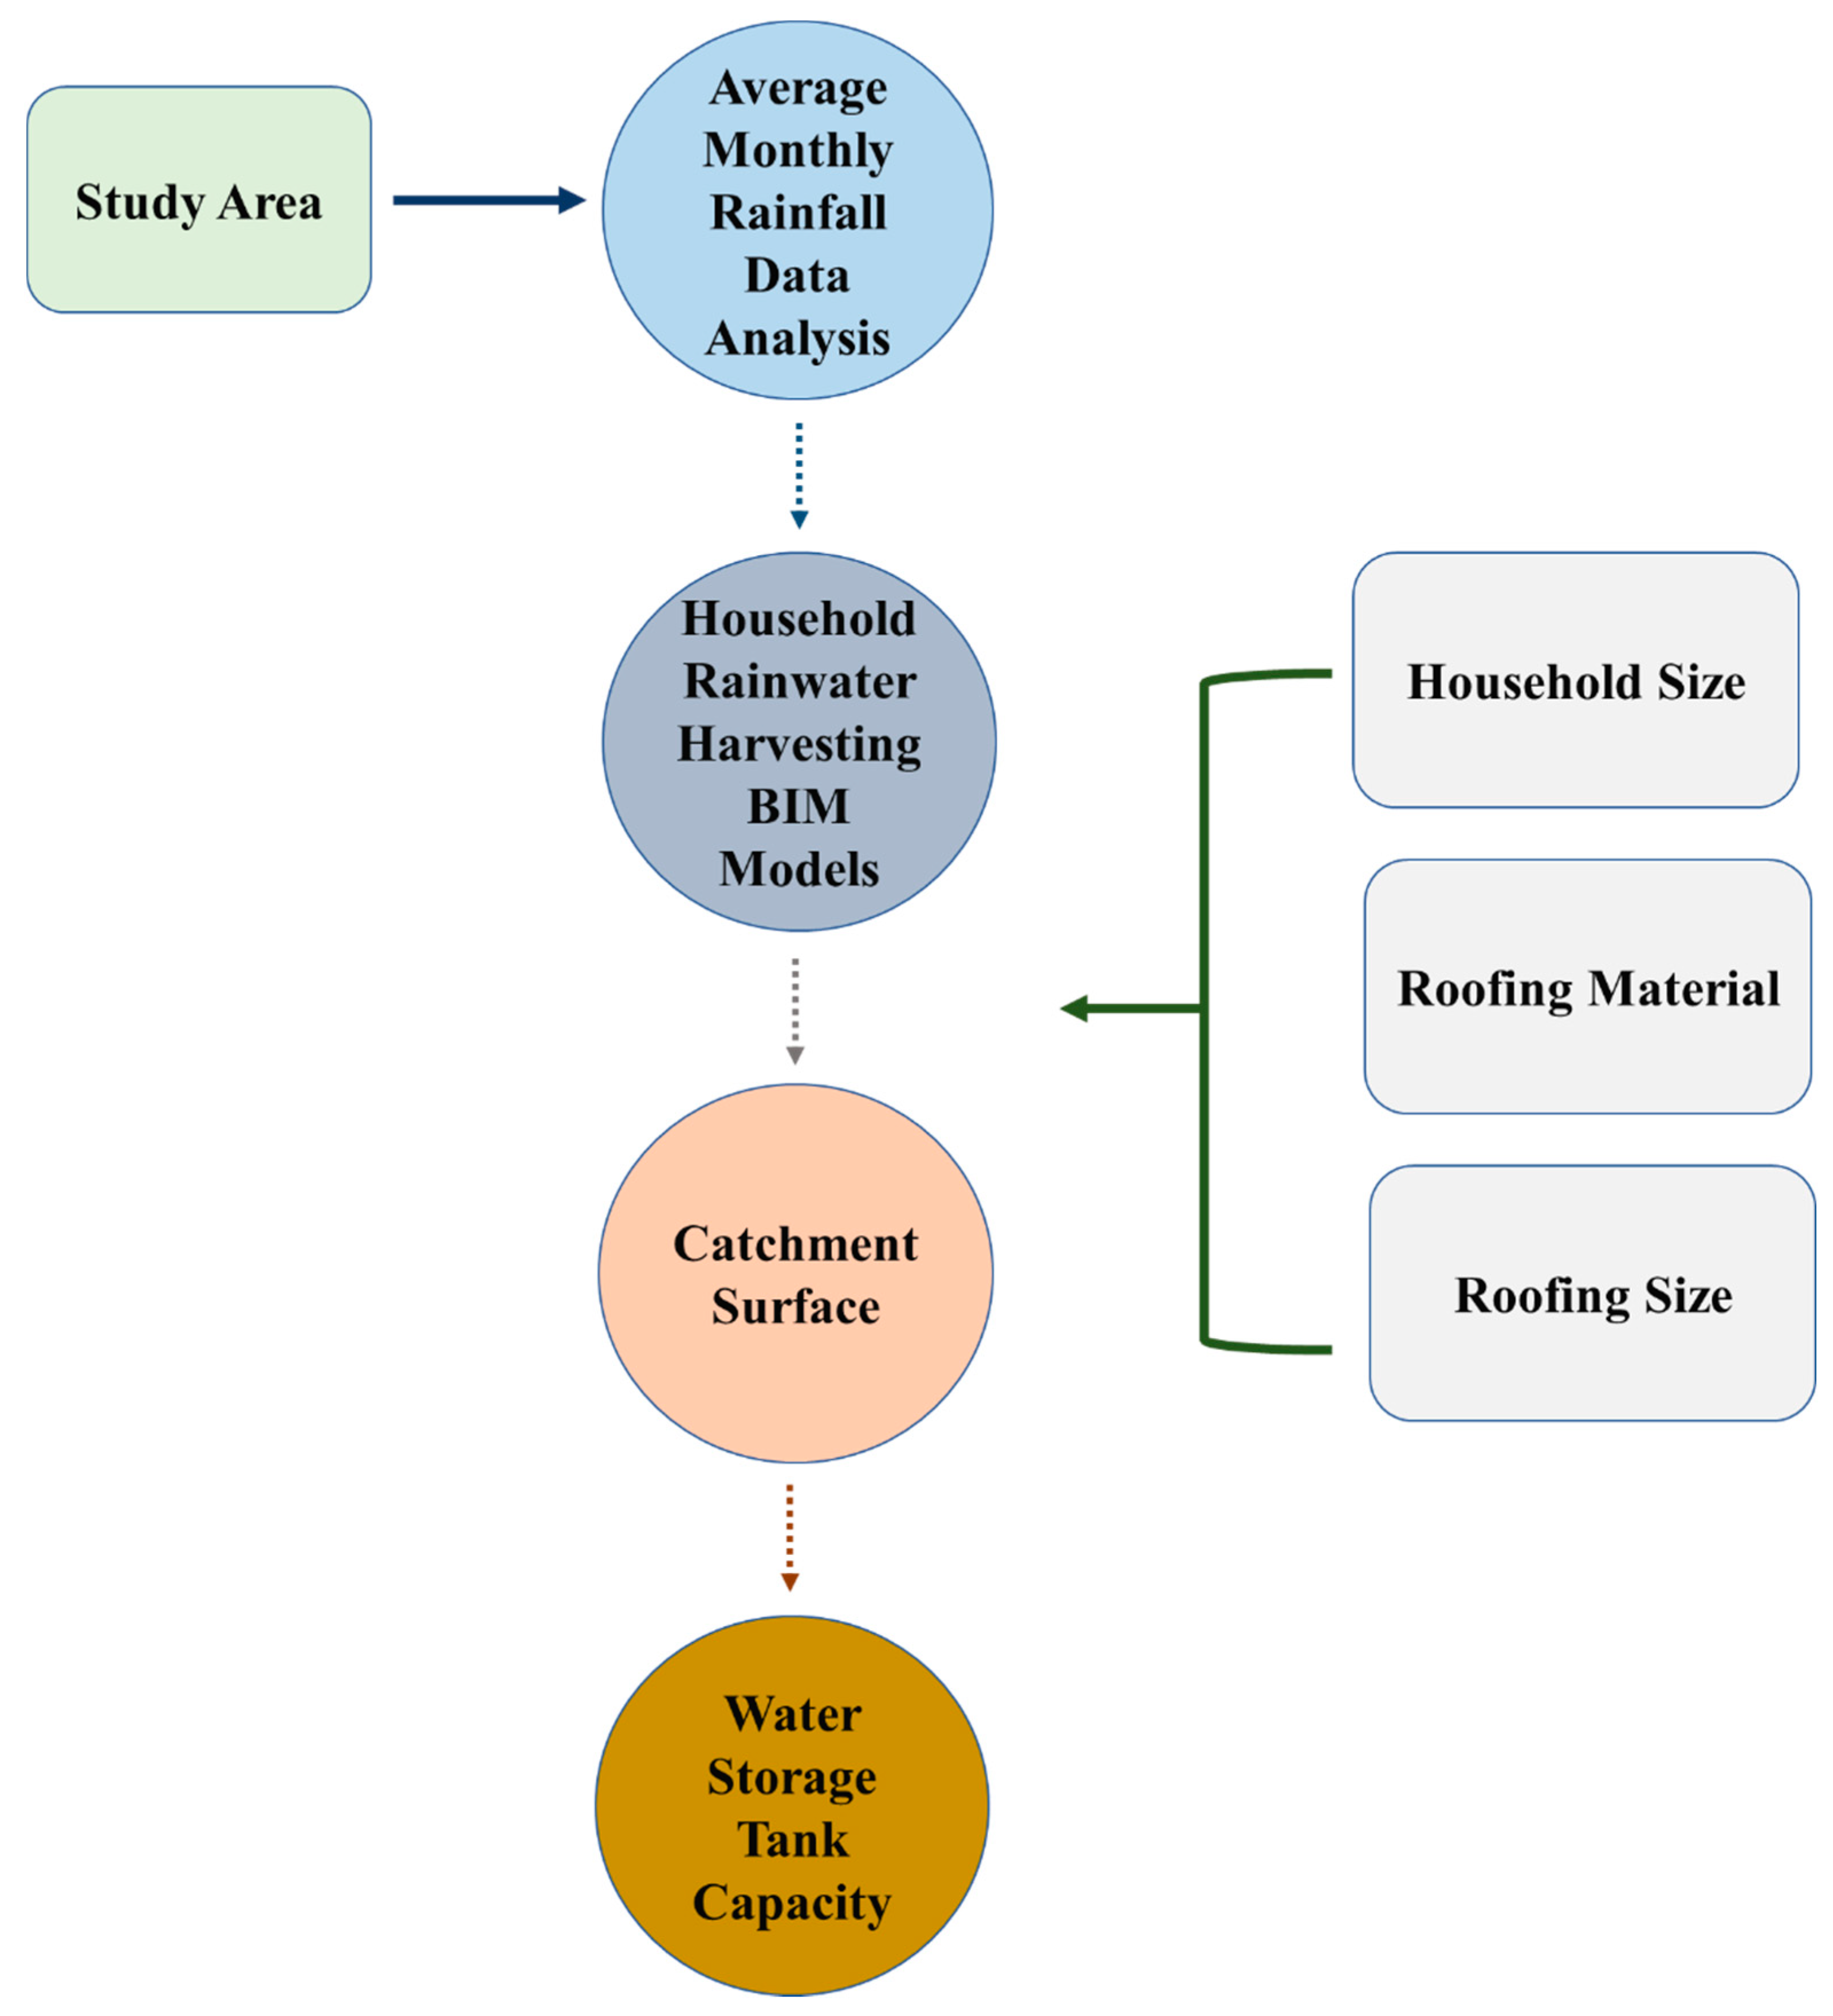
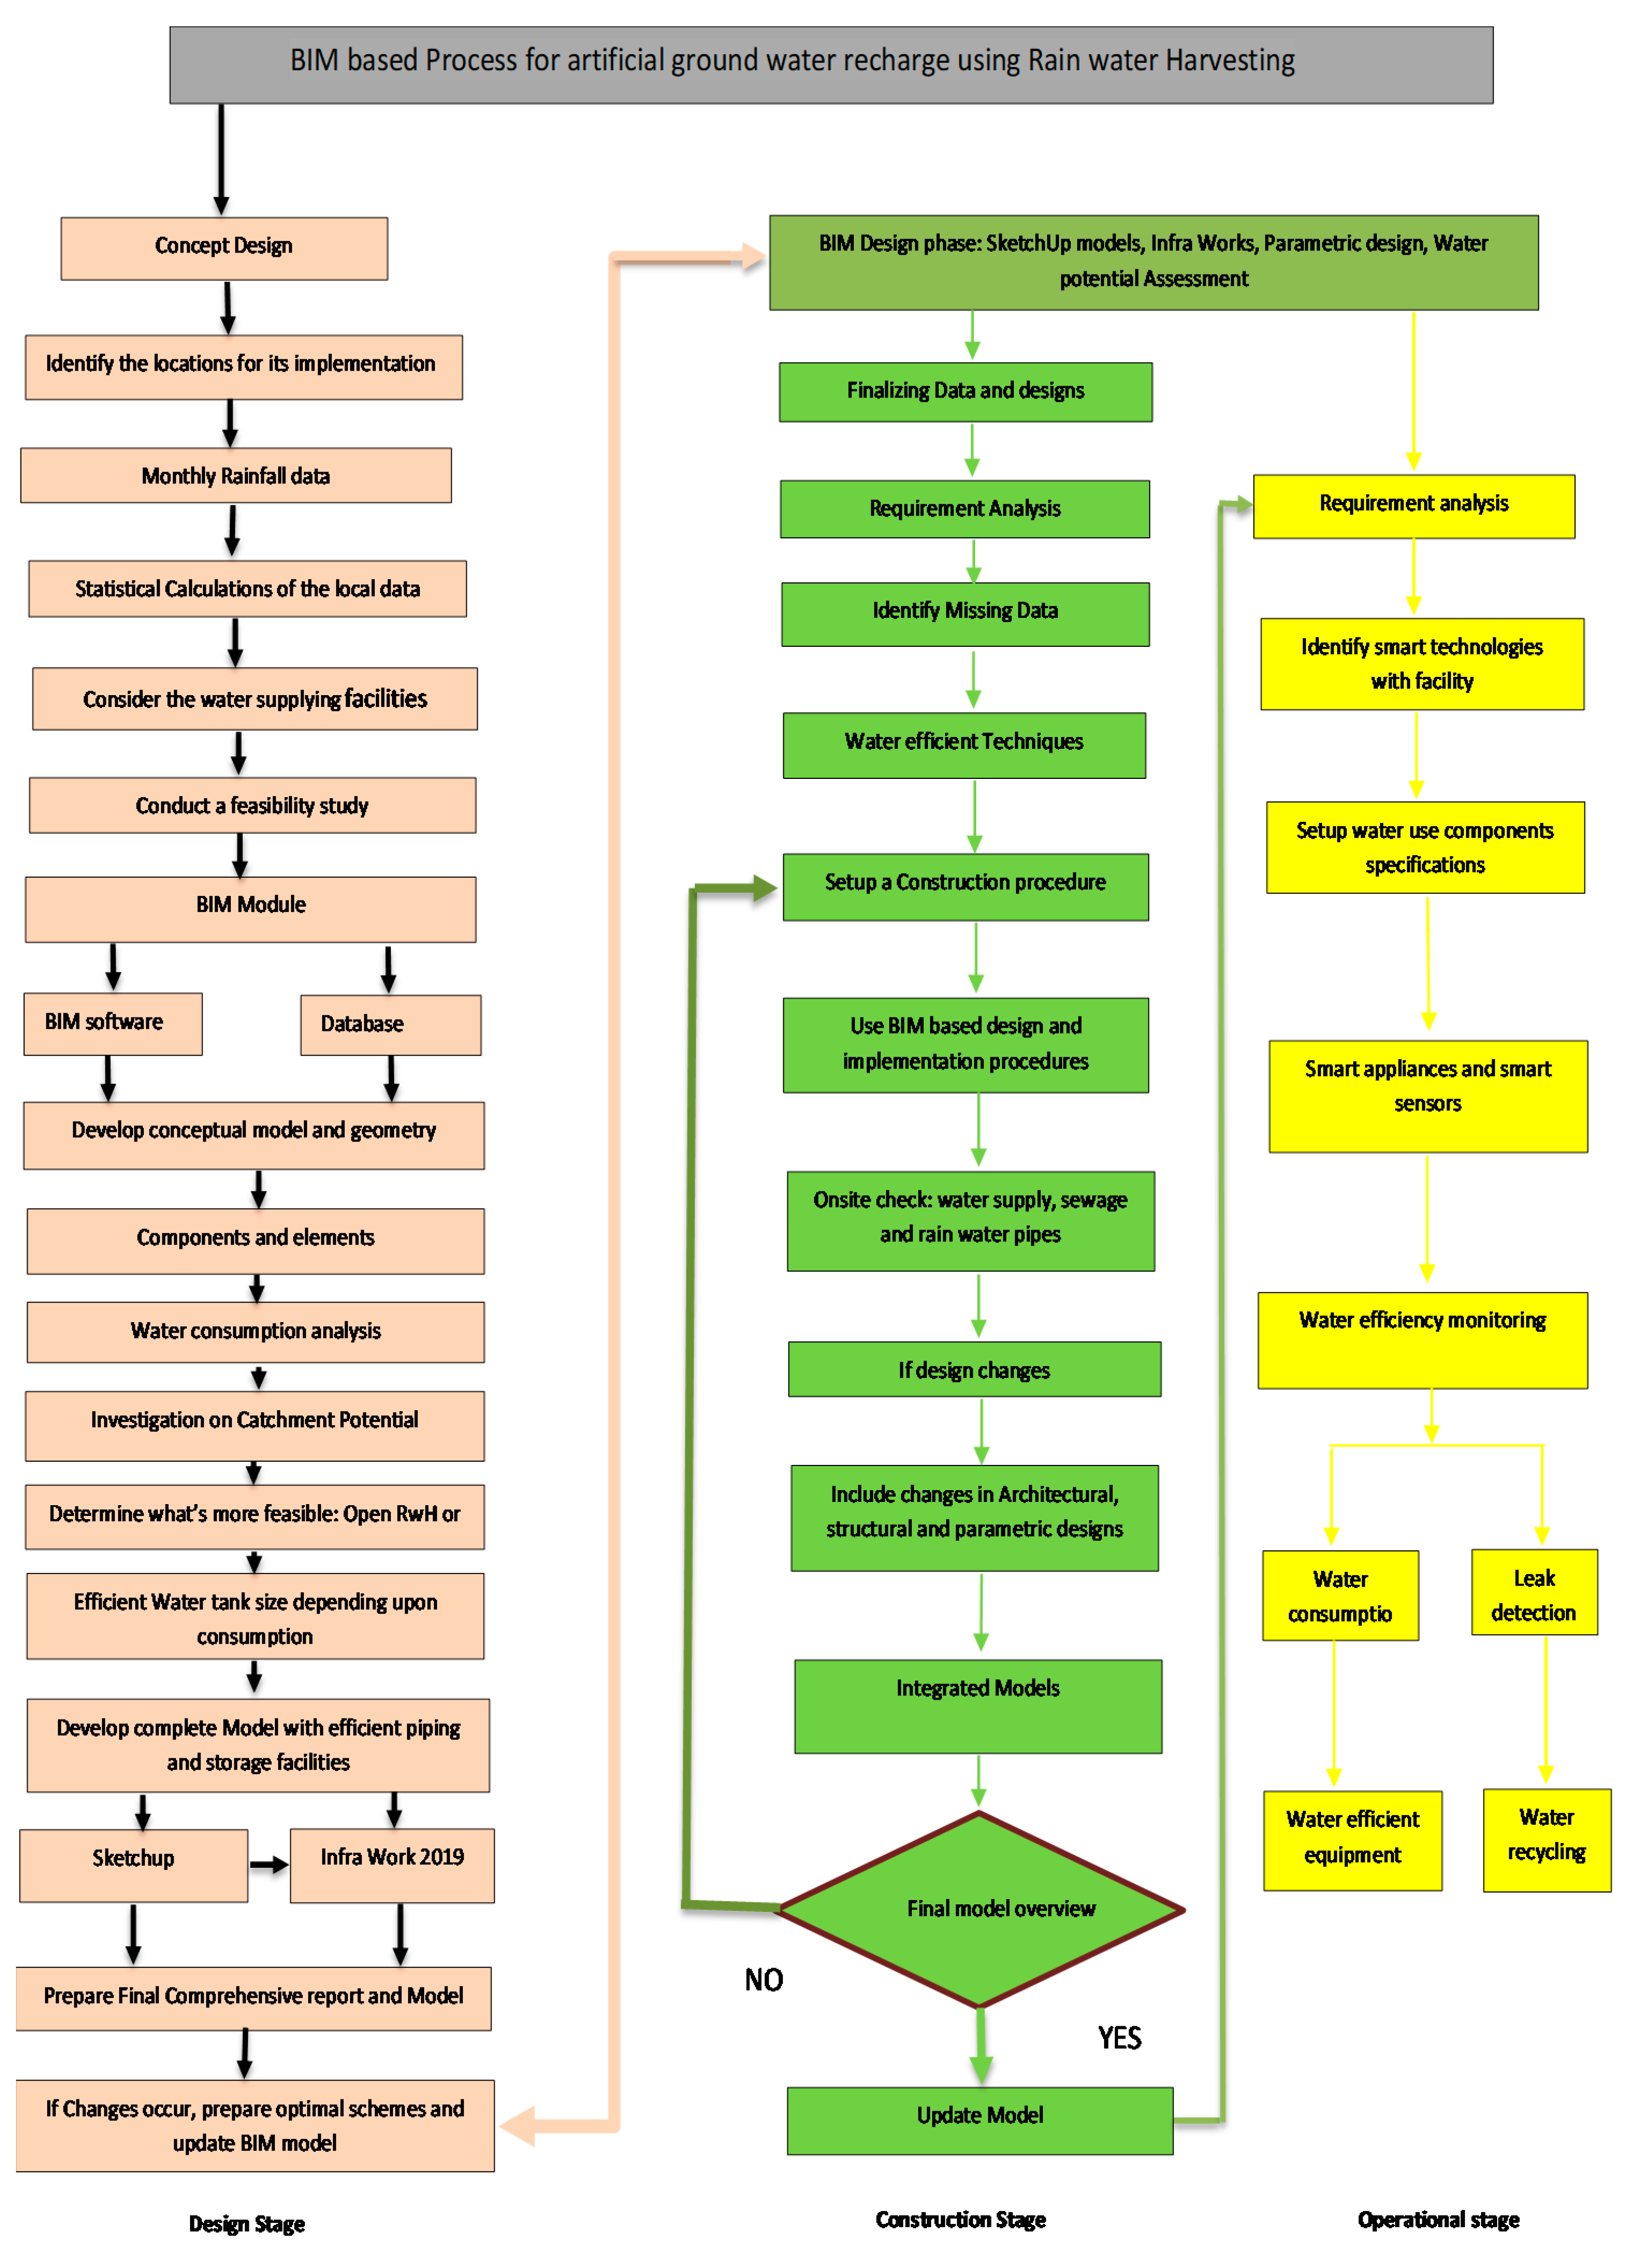
2.3. Modeling and Simulation of the Data
2.3.1. Household Number
2.3.2. Roofing Materials
2.3.3. Roofing Size
2.4. Rainwater Harvesting Potential
2.5. Storage Tank Capacity
3. Results
4. RwH Technique Adoption and Discussion
5. Conclusions
Author Contributions
Funding
Institutional Review Board Statement
Informed Consent Statement
Data Availability Statement
Acknowledgments
Conflicts of Interest
References
- Raghav, S.; Painuli, R.; Kumar, D. Threats to water: Issues and challenges related to ground water and drinking water. In A New Generation Material Graphene: Applications in Water Technology; Naushad, M., Ed.; Springer International Publishing: New York City, NY, USA, 2019; pp. 1–19. [Google Scholar]
- Samir, K.; Lutz, W. The human core of the shared socioeconomic pathways: Population scenarios by age, sex and level of education for all countries to 2100. Glob. Environ. Chang. 2017, 42, 181–192. [Google Scholar]
- Hao, T.; Du, P.; Gao, Y. Water environment security indicator system for urban water management. Front. Environ. Sci. Eng. 2012, 6, 678–691. [Google Scholar] [CrossRef]
- Herrmann, C.; Schmidt, C.; Kurle, D.; Blume, S.; Thiede, S. Sustainability in manufacturing and factories of the future. Int. J. Precis. Eng. Manuf. Technol. 2014, 1, 283–292. [Google Scholar] [CrossRef] [Green Version]
- Pérez, A.; Hurtado-Patiño, J.; Herrera, H.; Carvajal, A.; Pérez, M.; Gonzalez-Rojas, E.; Pérez-García, J. Assessing sub-regional water scarcity using the groundwater footprint. Ecol. Indic. 2019, 96, 32–39. [Google Scholar] [CrossRef]
- Adnan, S.; Ullah, K.; Gao, S.; Khosa, A.H.; Wang, Z. Shifting of agro-climatic zones, their drought vulnerability, and precipitation and temperature trends in Pakistan. Int. J. Clim. 2017, 37, 529–543. [Google Scholar] [CrossRef]
- Tiwari, K.; Goyal, R.; Sarkar, A. GIS-based methodology for identification of suitable locations for rainwater harvesting structures. Water Resour. Manag. 2018, 32, 1811–1825. [Google Scholar] [CrossRef]
- Aslam, B.; Maqsoom, A.; Khalid, N.; Ullah, F.; Sepasgozar, S. Urban overheating assessment through prediction of surface temperatures: A case study of Karachi, Pakistan. ISPRS Int. J. Geo-Inf. 2021, 10, 539. [Google Scholar] [CrossRef]
- Wang, R.; Zimmerman, J. Economic and environmental assessment of office building rainwater harvesting systems in various U.S. cities. Environ. Sci. Technol. 2015, 49, 1768–1778. [Google Scholar] [CrossRef]
- Rice, J.; Martin, N. Smart infrastructure technologies: Crowdsourcing future development and benefits for Australian communities. Technol. Forecast. Soc. Chang. 2020, 153, 119256. [Google Scholar] [CrossRef]
- Rodríguez-Sinobas, L.; Zubelzu, S.; Perales-Momparler, S.; Canogar, S. Techniques and criteria for sustainable urban stormwater management: The case study of Valdebebas (Madrid, Spain). J. Clean. Prod. 2018, 172, 402–416. [Google Scholar] [CrossRef]
- Lupia, F.; Baiocchi, V.; Lelo, K.; Pulighe, G. Exploring rooftop rainwater harvesting potential for food production in urban areas. Agriculture 2017, 7, 46. [Google Scholar] [CrossRef] [Green Version]
- Ali, B.; Zahoor, H.; Nasir, A.R.; Maqsoom, A.; Khan, R.W.A.; Mazher, K.M. BIM-based claims management system: A centralized information repository for extension of time claims. Autom. Constr. 2020, 110, 102937. [Google Scholar] [CrossRef]
- Ullah, F.; Qayyum, S.; Thaheem, M.J.; Al-Turjman, F.; Sepasgozar, S.M. Risk management in sustainable smart cities governance: A TOE framework. Technol. Forecast. Soc. Chang. 2021, 167, 120743. [Google Scholar] [CrossRef]
- Ullah, F.; Sepasgozar, S.M.; Thaheem, M.J.; Al-Turjman, F. Barriers to the digitalisation and innovation of Australian Smart Real Estate: A managerial perspective on the technology non-adoption. Environ. Technol. Innov. 2021, 22, 101527. [Google Scholar] [CrossRef]
- Ullah, F.; Sepasgozar, S.M.; Shirowzhan, S.; Davis, S. Modelling users’ perception of the online real estate platforms in a digitally disruptive environment: An integrated KANO-SISQual approach. Telematics Informatics 2021, 63, 101660. [Google Scholar] [CrossRef]
- Ullah, F.; Sepasgozar, S.M.; Thaheem, M.J.; Wang, C.C.; Imran, M. It’s all about perceptions: A DEMATEL approach to exploring user perceptions of real estate online platforms. Ain Shams Eng. J. 2021. [Google Scholar] [CrossRef]
- Ullah, F.; Thaheem, M.J.; Sepasgozar, S.M.E.; Forcada, N. System dynamics model to determine concession period of PPP Infrastructure Projects: Overarching effects of critical success factors. J. Leg. Aff. Disput. Resolut. Eng. Constr. 2018, 10, 04518022. [Google Scholar] [CrossRef]
- Hamidavi, T.; Abrishami, S.; Hosseini, M. Towards intelligent structural design of buildings: A BIM-based solution. J. Build. Eng. 2020, 32, 101685. [Google Scholar] [CrossRef]
- Maqsoom, A.; Khan, M.U.; Khan, S.; Naeemullah; Ullah, F. Factors influencing the construction time and cost overrun in projects: Empirical evidence from Pakistani construction industry. In Proceedings of the Proceedings of the 21st International Symposium on Advancement of Construction Management and Real Estate; Chau, K., Chan, I., Lu, W., Webster, C., Eds.; Springer: Singapore, Singapore, 2018; pp. 769–778. [Google Scholar]
- Lotfi, N.; Behnam, B.; Peyman, F. A BIM-based framework for evacuation assessment of high-rise buildings under post-earthquake fires. J. Build. Eng. 2021, 43, 102559. [Google Scholar] [CrossRef]
- Ali, Q.; Thaheem, M.J.; Ullah, F.; Sepasgozar, S.M.E. The performance gap in energy-efficient office buildings: how the occupants can help? Energies 2020, 13, 1480. [Google Scholar] [CrossRef] [Green Version]
- Trindade, A.D.; Coelho, G.B.; Henriques, F.M. Influence of the climatic conditions on the hydrothermal performance of autoclaved aerated concrete masonry walls. J. Build. Eng. 2021, 33, 101578. [Google Scholar] [CrossRef]
- Panteli, C.; Kylili, A.; Stasiuliene, L.; Seduikyte, L.; Fokaides, P.A. A framework for building overhang design using Building Information Modeling and Life Cycle Assessment. J. Build. Eng. 2018, 20, 248–255. [Google Scholar] [CrossRef]
- Siddiqui, M.Z.; Pearce, A.R.; Ku, K.; Langar, S.; Ahn, Y.H.; Jacocks, K. Green BIM approaches to architectural design for increased sustainability. Available online: https://www.researchgate.net/publication/236878118_Green_BIM_Approaches_to_Architectural_Design_for_Increased_Sustainability (accessed on 6 July 2021).
- Badenkoa, V.; Bolshakov, N.; Tishchenkob, E.; Celanic, A.; Fedotova, A.; Yadykina, V. Integration of digital twin and BIM technologies within factories of the future. Mag. Civ. Engineering. 2021, 101, 10114. [Google Scholar]
- Langar, S.; Pearce, A.R. Implementation trends for rainwater-harvesting technologies and strategies and their relationship with Building Information Modeling. J. Arch. Eng. 2017, 23, 04016016. [Google Scholar] [CrossRef]
- Qureshi, A.S. Groundwater Governance in Pakistan: From Colossal Development to Neglected Management. Water 2020, 12, 3017. [Google Scholar] [CrossRef]
- Arshad, A.; Zhang, Z.; Zhang, W.; Dilawar, A. Mapping favorable groundwater potential recharge zones using a GIS-based analytical hierarchical process and probability frequency ratio model: A case study from an agro-urban region of Pakistan. Geosci. Front. 2020, 11, 1805–1819. [Google Scholar] [CrossRef]
- Raza, M.; Hussain, F.; Lee, J.-Y.; Shakoor, M.B.; Kwon, K.D. Groundwater status in Pakistan: A review of contamination, health risks, and potential needs. Crit. Rev. Environ. Sci. Technol. 2017, 47, 1713–1762. [Google Scholar] [CrossRef]
- Yeh, H.-F.; Lin, H.-I.; Lee, C.-H.; Hsu, K.-C.; Wu, C.-S. Identifying seasonal groundwater recharge using environmental stable isotopes. Water 2014, 6, 2849–2861. [Google Scholar] [CrossRef]
- Bhutta, M.N.; Alam, M.M. Prospectives and Limits of Ggroundwater Use in Pakistan. Available online: https://publications.iwmi.org/pdf/H039312.pdf (accessed on 6 July 2021).
- Farid, M.; Irshad, M.; Fawad, M.; Ali, Z.; Eneji, A.E.; Aurangzeb, N.; Mohammad, A.; Ali, B. Effect of cyclic phytoremediation with different wetland plants on municipal wastewater. Int. J. Phytoremediation 2013, 16, 572–581. [Google Scholar] [CrossRef]
- Gallardo, A.H. Hydrogeological characterisation and groundwater exploration for the development of irrigated agriculture in the West Kimberley region, Western Australia. Groundw. Sustain. Dev. 2018, 8, 187–197. [Google Scholar] [CrossRef]
- Mun, J.; Han, M. Design and operational parameters of a rooftop rainwater harvesting system: Definition, sensitivity and verification. J. Environ. Manag. 2012, 93, 147–153. [Google Scholar] [CrossRef] [PubMed]
- Pacheco, P.R.D.C.; Gómez, Y.D.; de Oliveira, I.F.; Teixeira, L.C.G. A view of the legislative scenario for rainwater harvesting in Brazil. J. Clean. Prod. 2017, 141, 290–294. [Google Scholar] [CrossRef]
- Azhar, S.; Nadeem, A.; Mok, J.Y.; Leung, B.H. Building Information Modeling (BIM): A new paradigm for visual interactive modeling and simulation for construction projects. In Proceedings of the First International Conference on Construction in Developing Countries (ICCIDC-I), Karachi, Pakistan, 4–5 August 2008. [Google Scholar]
- Najjar, M.; Figueiredo, K.; Palumbo, M.; Haddad, A. Integration of BIM and LCA: Evaluating the environmental impacts of building materials at an early stage of designing a typical office building. J. Build. Eng. 2017, 14, 115–126. [Google Scholar] [CrossRef]
- Gourlis, G.; Kovacic, I. Building Information Modelling for analysis of energy efficient industrial buildings—A case study. Renew. Sustain. Energy Rev. 2017, 68, 953–963. [Google Scholar] [CrossRef]
- Ku, K.; Taiebat, M. BIM Experiences and Expectations: The Constructors’ Perspective. Int. J. Constr. Educ. Res. 2011, 7, 175–197. [Google Scholar] [CrossRef]
- Azhar, S.; Brown, J.W.; Sattineni, A. A case study of building performance analyses using Building Information Modeling. In Proceedings of the 27th International Symposium on Automation and Robotics in Construction; International Association for Automation and Robotics in Construction (IAARC), Bratislava, Slovakia, 25–27 June 2010; pp. 213–222. [Google Scholar] [CrossRef] [Green Version]
- Azhar, S.; Carlton, W.A.; Olsen, D.; Ahmad, I. Building information modeling for sustainable design and LEED® rating analysis. Autom. Constr. 2011, 20, 217–224. [Google Scholar] [CrossRef]
- Eastman, C.M.; Jeong, Y.-S.; Sacks, R.; Kaner, I. Exchange model and exchange object concepts for implementation of national BIM standards. J. Comput. Civ. Eng. 2010, 24, 25–34. [Google Scholar] [CrossRef] [Green Version]
- Kensek, K. BIM Guidelines Inform Facilities Management Databases: A Case Study over Time. Buildings 2015, 5, 899–916. [Google Scholar] [CrossRef] [Green Version]
- Ahmad, Z.; Thaheem, M.J.; Maqsoom, A. Building information modeling as a risk transformer: An evolutionary insight into the project uncertainty. Autom. Constr. 2018, 92, 103–119. [Google Scholar] [CrossRef]
- Qayyum, S.; Ullah, F.; Al-Turjman, F.; Mojtahedi, M. Managing smart cities through six sigma DMADICV method: A review-based conceptual framework. Sustain. Cities Soc. 2021, 71, 103022. [Google Scholar] [CrossRef]
- Barlish, K.; Sullivan, K. How to measure the benefits of BIM—A case study approach. Autom. Constr. 2012, 24, 149–159. [Google Scholar] [CrossRef] [Green Version]
- Tang, F.; Ma, T.; Guan, Y.; Zhang, Z. Parametric modeling and structure verification of asphalt pavement based on BIM-ABAQUS. Autom. Constr. 2020, 111, 103066. [Google Scholar] [CrossRef]
- Leggett, D.; Brown, R.; Stanfield, G.; Brewer, D.; Holli, E. Rainwater and Greywater Recycling in Buildings: Decision Making for Water Conservation; CIRIA: London, UK, 2001. [Google Scholar]
- Ayub, B.; Ullah, F.; Rasheed, F.; Sepasgozar, S. Risks in EPC hydropower projects: A case of Pakistan. In Proceedings of the 8th International Civil Engineering Congress (ICEC) Ensuring Technological Advancement through Innovation Based Knowledge Corridor, Karachi, Pakistan, 23–24 December 2016. [Google Scholar]
- Ghisi, E. Potential for potable water savings by using rainwater in the residential sector of Brazil. Build. Environ. 2006, 41, 1544–1550. [Google Scholar] [CrossRef]
- Yaqub, M. Open Source Architecture: Redefining Residential Architecture in Islamabad. Ph.D. Thesis, Roger Williams University, Bristol, RI, USA, 2017. [Google Scholar]
- Bulbul, G.; Shahid, I.; Chishtie, F.; Shahid, M.Z.; Hundal, R.A.; Zahra, F.; Shahzad, M.I. PM10 sampling and AOD trends during 2016 winter fog season in the Islamabad Region. Aerosol. Air Qual. Res. 2018, 18, 188–199. [Google Scholar] [CrossRef] [Green Version]
- Sheikh, M.M.; Manzoor, N.; Adnan, M.; Ashraf, J.; Khan, A. Climate profile and past climate changes in Pakistan; Global Change Impact Studies Center (GCISC)-RR-01; Global Change Impact Studies Centre: Islamabad, Pakistan, 2009. [Google Scholar]
- Partzsch, L. Smart regulation for water innovation–the case of decentralized rainwater technology. J. Clean. Prod. 2009, 17, 985–991. [Google Scholar] [CrossRef]
- Langar, S. The role of building information modeling (BIM) in the implementation of rainwater harvesting technologies and strategies (RwHTS). Ph.D. Thesis, Virginia Polytechnic Institute and State University, Blacksburg, VA, USA, June 2013. [Google Scholar]
- Rehman, M.S.U.; Thaheem, M.J.; Nasir, A.R.; Khan, K.I.A. Project schedule risk management through building information modelling. Int. J. Constr. Manag. 2020, 1–11. [Google Scholar] [CrossRef]
- Lee, C.-Y.; Chong, H.-Y.; Wang, X. Streamlining digital modeling and Building Information Modelling (BIM) uses for the oil and gas projects. Arch. Comput. Methods Eng. 2018, 25, 349–396. [Google Scholar] [CrossRef] [Green Version]
- Amos, C.; Rahman, A.; Gathenya, J.M. Economic analysis of rainwater harvesting systems comparing developing and developed countries: A case study of Australia and Kenya. J. Clean. Prod. 2018, 172, 196–207. [Google Scholar] [CrossRef]
- Stec, A. Sustainable Water Management in Buildings; Springer: Berlin Germany, 2020; p. 90. [Google Scholar]
- Ullah, F.; Sepasgozar, S.M.E.; Wang, C. A systematic review of smart real estate technology: Drivers of, and barriers to, the use of digital disruptive technologies and online platforms. Sustainability 2018, 10, 3142. [Google Scholar] [CrossRef] [Green Version]
- Ullah, F. A beginner’s guide to developing review-based conceptual frameworks in the built environment. Architecture 2021, 1, 5–24. [Google Scholar] [CrossRef]
- Malik, Q.; Nasir, A.R.; Muhammad, R.; Thaheem, M.J.; Ullah, F.; Khan, K.I.A.; Hassan, M.U. BIMp-Chart—A Global Decision Support System for Measuring BIM Implementation Level in Construction Organizations. Sustainability 2021, 13, 9270. [Google Scholar] [CrossRef]
- Dahutia, P.; Pathak, B.; Bhuyan, P.K. Aerosols characteristics, trends and their climatic implications over Northeast India and adjoining South Asia. Int. J. Clim. 2018, 38, 1234–1256. [Google Scholar] [CrossRef]
- Lasage, R.; Verburg, P.H. Evaluation of small scale water harvesting techniques for semi-arid environments. J. Arid. Environ. 2015, 118, 48–57. [Google Scholar] [CrossRef]
- Asadi, S.; Bannayan, M.; Monti, A. The association of crop production and precipitation; a comparison of two methodologies. Arid. Land Res. Manag. 2018, 33, 155–176. [Google Scholar] [CrossRef]


| Site No. | Site Name | Location (Latitude, Longitude) |
|---|---|---|
| 1 | Zero Point | 33°41′38″, 73°03′55″ |
| 2 | Airport | 33°33′41″, 72°51′25″ |
| 3 | Rawat | 33°31′26″, 73°10′17″ |
| Properties | Description |
|---|---|
| Roof height | 3.0 m |
| Roof slope | 5.0° |
| Roofing material | Concrete |
| Roofing size | 90 m2 |
| Building type | Double story residential house |
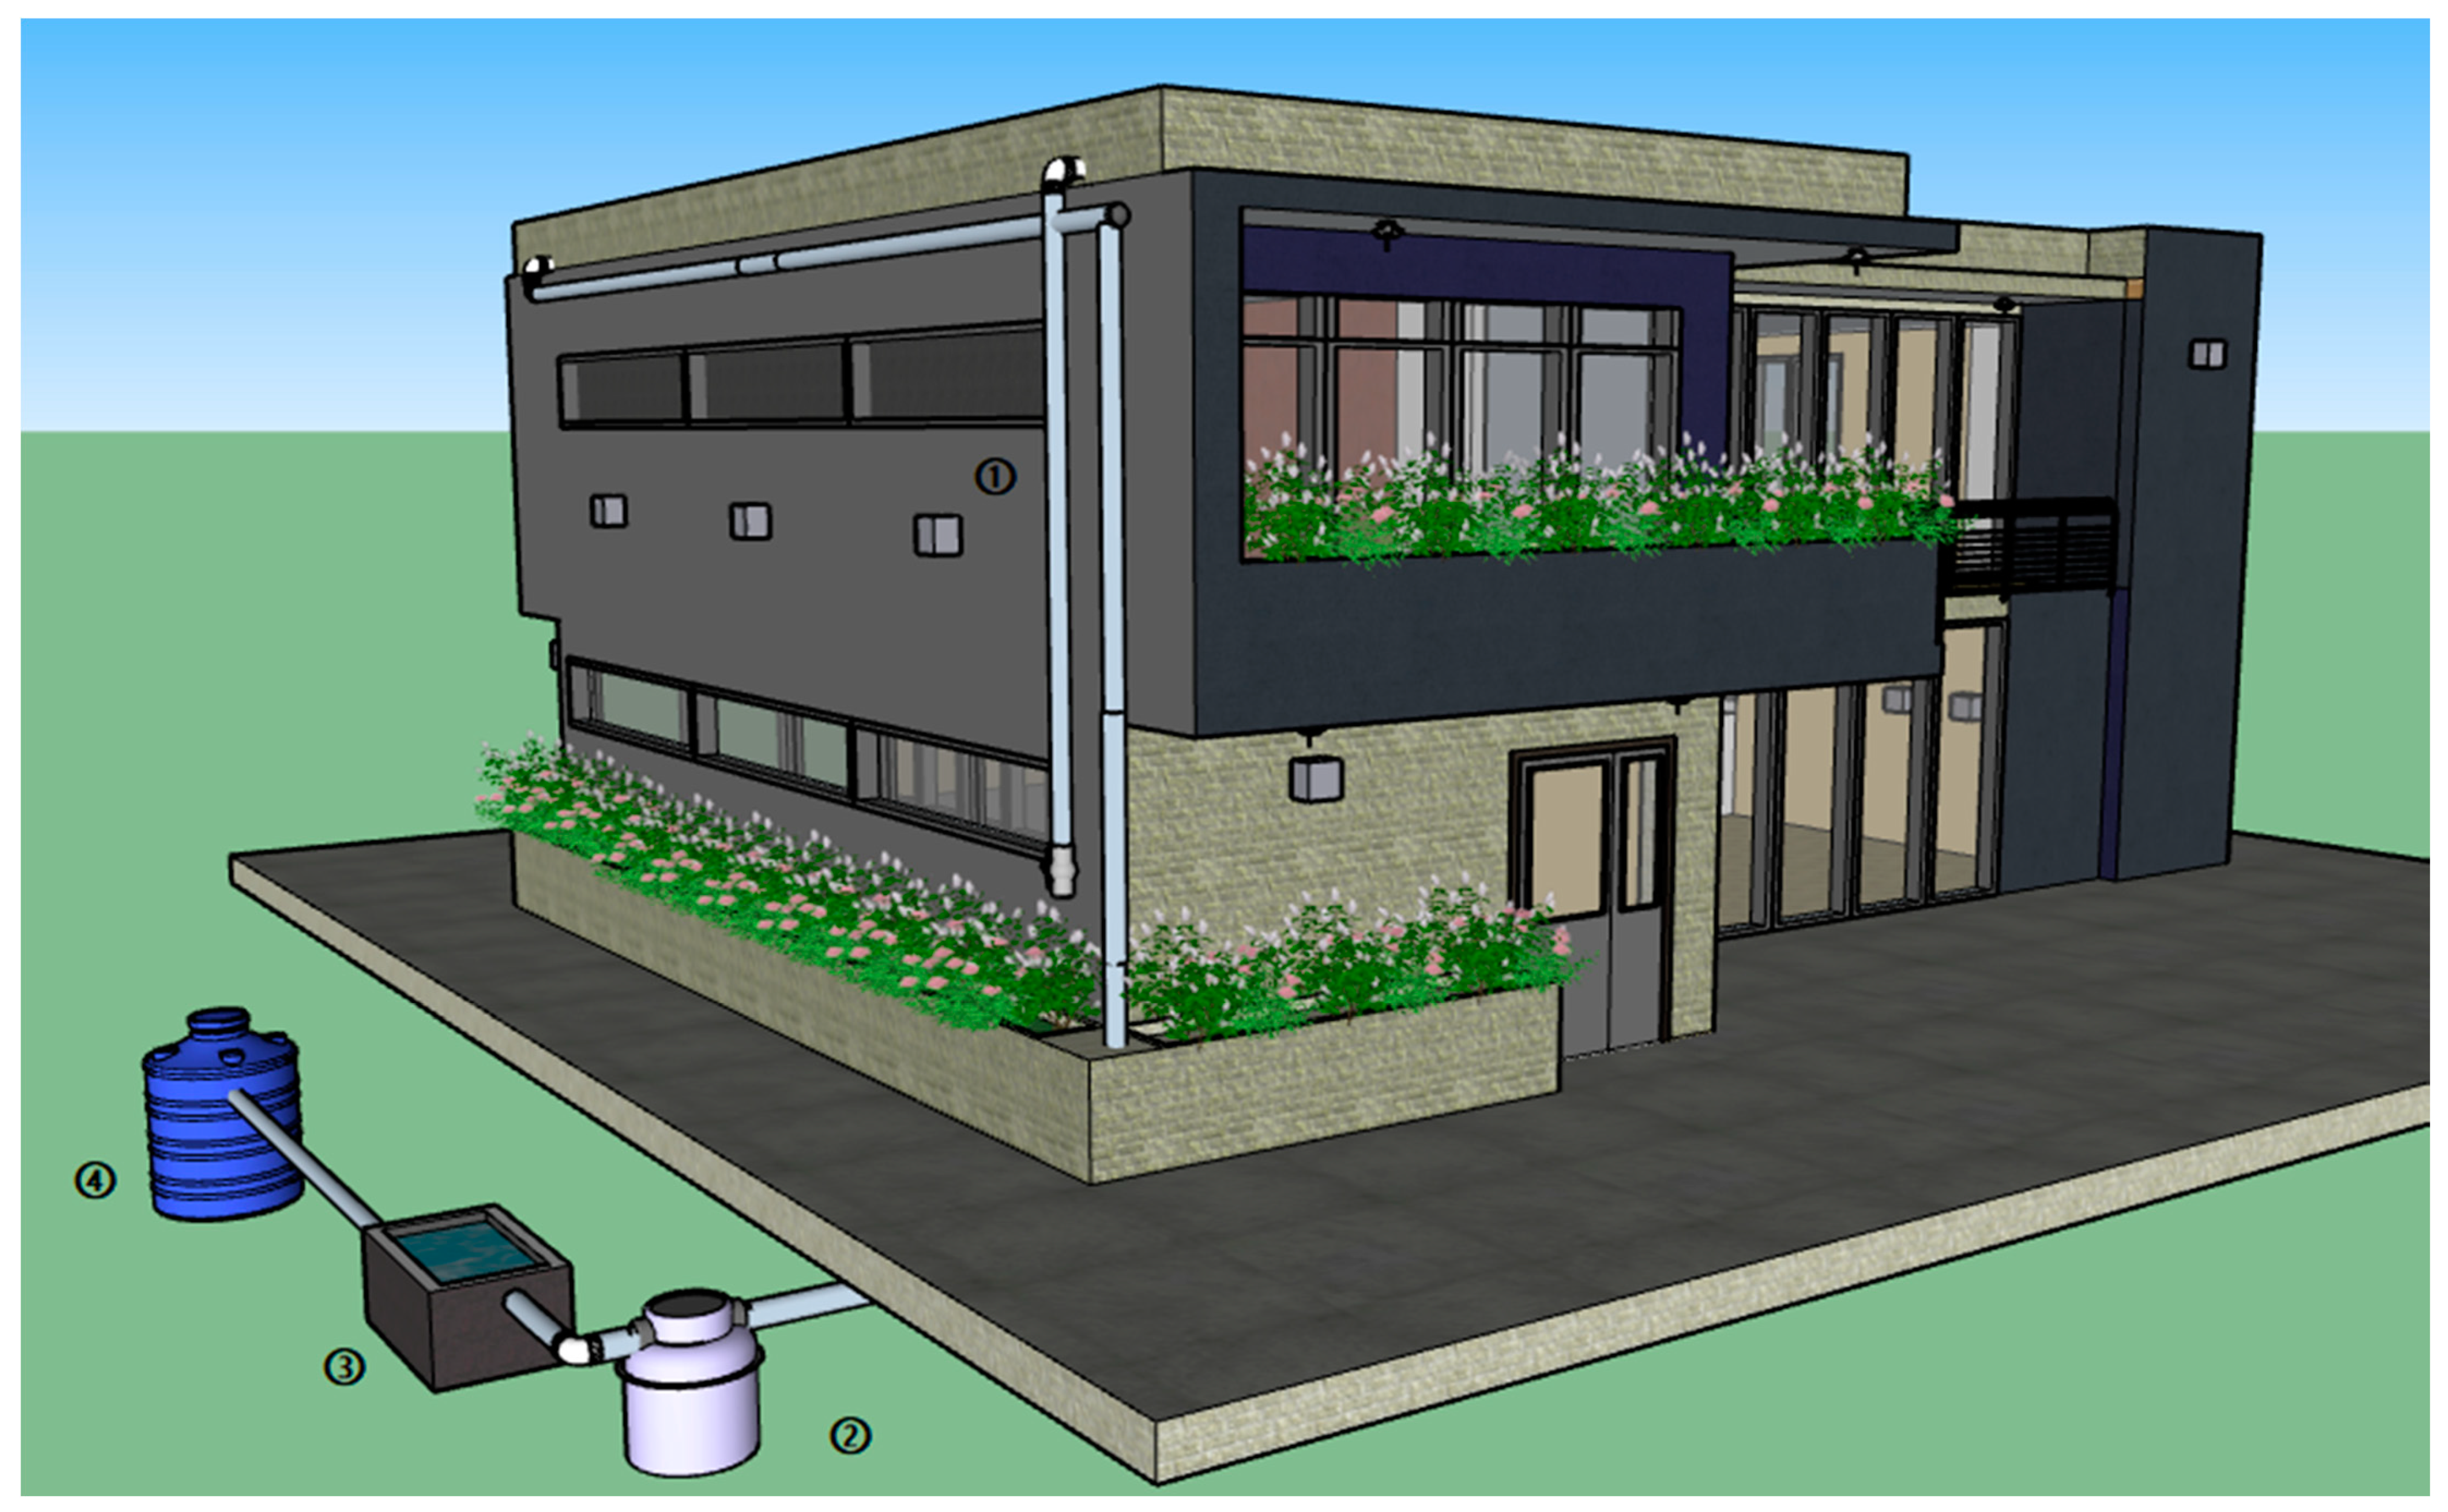
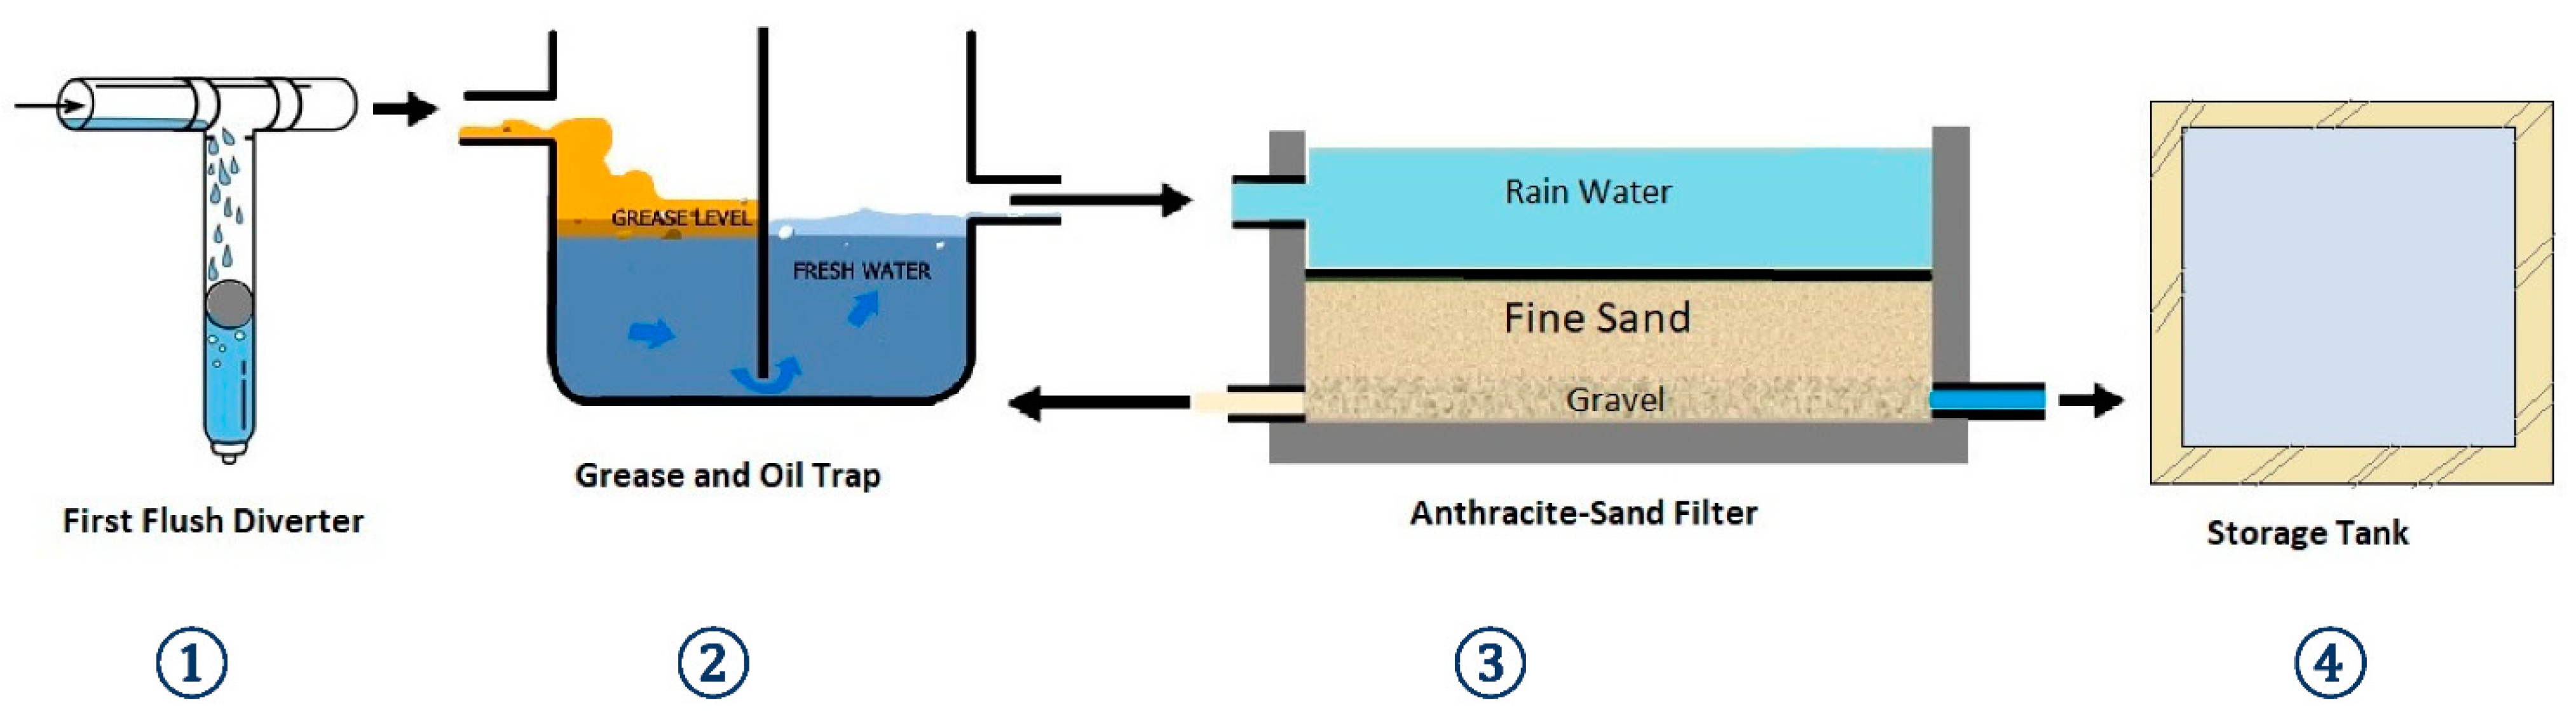
| S.No. | Component | Description | Function | Specification |
|---|---|---|---|---|
| 1. | First flush diverter | It diverts the first few liters of dirty rainwater to another pipe from where it can be flushed out. | It consists of an assembly of a pipe, a ball, and a valve. When the rainwater travels through the flush diverter pipe, it forces a ball at the bottom to rise up and finally seals off the pipe. This way, some dirty water is stored in the pipe, which is later flushed out by opening the valve. | Four first flush diverters are used in this model, one for each pipeline, collecting rainwater from the roof. This way, the first 10 L accumulated from the rooftop are flushed, and the remaining water heads towards the cleaning stage. |
| 2. | Grease and oil trap | It allows the separation of grease and oil traces in the water accumulated from the roof. | It consists of a container with a gate panel placed in the middle. The water enters from one side of the container; the solids settle at the bottom while the oil and grease float at the top. The clear water then enters the other side of the container from under the gate panel and exits. | The dimensions of the container are 400 × 400 × 250 mm, with an overflow height of 220 mm. The container has a capacity of 35.3 L. |
| 3. | Anthracite-sand filter | It removes the smallest impurities present in the water by refining through fine sand. | It consists of a reservoir with a layer of Schmutzdecke, a layer of fine sand, and a layer of gravel. The water enters the tank from above and passes through all of these layers to be purified. This filter also requires backwashing from time to time (3–7 days) to prevent blockage of pores. | The top layer (Anthracite) has a thickness of 250 mm, the bottom layer, which consists of sand, has a thickness of 300 mm, and the support gravel layer has a thickness of 430 mm. |
| 4. | Storage tank | It collects the purified rainwater ready for use. | It is normally 1520–2130 mm high and is made of PVC. A water tap may be attached for direct access to water and a drainage nozzle to convey water to the main tank. | A 3000-L capacity storage tank is selected with a diameter of 1625 mm and 1828 mm in height. |
| Surface | Type | Coefficient |
|---|---|---|
| Roof | Pitch roof tiles | 0.75–0.90 |
| Flat roof with a smooth surface | 0.5 | |
| Flat roof with gravel layer or thin turf (<150 mm) | 0.4–0.5 |
| Month | Average Rainfall (mm) Site 1 | Average Rainfall (mm) Site 2 | Average Rainfall (mm) Site 3 |
|---|---|---|---|
| January | 1.01 | 1.01 | 1.01 |
| February | 78.02 | 74.32 | 71.36 |
| March | 39.21 | 43.08 | 42.54 |
| April | 85.02 | 79.31 | 81.23 |
| May | 64.23 | 39.81 | 40.36 |
| June | 63.01 | 67.53 | 70.12 |
| July | 371.02 | 322.28 | 326.96 |
| August | 542.81 | 434.54 | 439.24 |
| September | 105.00 | 57.04 | 52.77 |
| October | 31.00 | 36.61 | 39.25 |
| November | 24.01 | 21.54 | 23.28 |
| December | 30.40 | 35.40 | 36.80 |
| Month | Average Rainfall [i] (mm) | Roof Area [RA] (m²) | Runoff Coefficient [C] | Site 1 | Site 2 | Site 3 | |||||
|---|---|---|---|---|---|---|---|---|---|---|---|
| Site 1 | Site 2 | Site 3 | Monthly Runoff Harvested (i1 × RA × C) (m³) | Cumulative Runoff Harvested (m³) | Monthly Runoff Harvested (i2 × RA × C) (m³) | Cumulative Runoff Harvested (m³) | Monthly Runoff Harvested (i3 × RA × C) (m³) | Cumulative Runoff Harvested (m³) | |||
| i1 | i2 | i3 | |||||||||
| January | 1.01 | 1.01 | 1.01 | 90 | 0.8 | 0.07272 | 0.07272 | 0.07272 | 0.07272 | 0.07272 | 0.07272 |
| February | 78.02 | 74.32 | 71.36 | 90 | 0.8 | 5.61744 | 5.69016 | 5.35104 | 5.42376 | 5.13792 | 5.21064 |
| March | 39.21 | 43.08 | 42.54 | 90 | 0.8 | 2.82312 | 8.51328 | 3.10176 | 8.52552 | 3.06288 | 8.27352 |
| April | 85.02 | 79.31 | 81.23 | 90 | 0.8 | 6.12144 | 14.63472 | 5.71032 | 14.23584 | 5.84856 | 14.12208 |
| May | 64.23 | 39.81 | 40.36 | 90 | 0.8 | 4.62456 | 19.25928 | 2.86632 | 17.10216 | 2.90592 | 17.028 |
| June | 63.01 | 67.53 | 70.12 | 90 | 0.8 | 4.53672 | 23.796 | 4.86216 | 21.96432 | 5.04864 | 22.07664 |
| July | 371.02 | 322.28 | 326.96 | 90 | 0.8 | 26.71344 | 50.50944 | 23.20416 | 45.16848 | 23.54112 | 45.61776 |
| August | 542.81 | 434.54 | 439.24 | 90 | 0.8 | 39.08232 | 89.59176 | 31.28688 | 76.45536 | 31.62528 | 77.24304 |
| September | 105 | 57.04 | 52.77 | 90 | 0.8 | 7.56 | 97.15176 | 4.10688 | 80.56224 | 3.79944 | 81.04248 |
| October | 31 | 36.61 | 39.25 | 90 | 0.8 | 2.232 | 99.38376 | 2.63592 | 83.19816 | 2.826 | 83.86848 |
| November | 24.01 | 21.54 | 23.28 | 90 | 0.8 | 1.72872 | 101.11248 | 1.55088 | 84.74904 | 1.67616 | 85.54464 |
| December | 30.4 | 35.4 | 36.8 | 90 | 0.8 | 2.1888 | 103.30128 | 2.5488 | 87.29784 | 2.6496 | 88.19424 |
Publisher’s Note: MDPI stays neutral with regard to jurisdictional claims in published maps and institutional affiliations. |
© 2021 by the authors. Licensee MDPI, Basel, Switzerland. This article is an open access article distributed under the terms and conditions of the Creative Commons Attribution (CC BY) license (https://creativecommons.org/licenses/by/4.0/).
Share and Cite
Maqsoom, A.; Aslam, B.; Ismail, S.; Thaheem, M.J.; Ullah, F.; Zahoor, H.; Musarat, M.A.; Vatin, N.I. Assessing Rainwater Harvesting Potential in Urban Areas: A Building Information Modelling (BIM) Approach. Sustainability 2021, 13, 12583. https://doi.org/10.3390/su132212583
Maqsoom A, Aslam B, Ismail S, Thaheem MJ, Ullah F, Zahoor H, Musarat MA, Vatin NI. Assessing Rainwater Harvesting Potential in Urban Areas: A Building Information Modelling (BIM) Approach. Sustainability. 2021; 13(22):12583. https://doi.org/10.3390/su132212583
Chicago/Turabian StyleMaqsoom, Ahsen, Bilal Aslam, Sharjeel Ismail, Muhammad Jamaluddin Thaheem, Fahim Ullah, Hafiz Zahoor, Muhammad Ali Musarat, and Nikolai Ivanovich Vatin. 2021. "Assessing Rainwater Harvesting Potential in Urban Areas: A Building Information Modelling (BIM) Approach" Sustainability 13, no. 22: 12583. https://doi.org/10.3390/su132212583
APA StyleMaqsoom, A., Aslam, B., Ismail, S., Thaheem, M. J., Ullah, F., Zahoor, H., Musarat, M. A., & Vatin, N. I. (2021). Assessing Rainwater Harvesting Potential in Urban Areas: A Building Information Modelling (BIM) Approach. Sustainability, 13(22), 12583. https://doi.org/10.3390/su132212583