Article

Multiple Analytical Models to Evaluate the Impact of Carbon Nanotubes on the Electrical Resistivity and Compressive Strength of the Cement Paste

by
Nzar Shakr Piro
1,2,*,
Ahmed Salih Mohammed
3 and
Samir Mustafa Hamad
2
1
Civil Engineering Department, Faculty of Engineering, Soran University, Erbil 46001, Kurdistan Region, Iraq
2
Scientific Research Centre, Soran University, Soran, Erbil 44008, Kurdistan Region, Iraq
3
Civil Engineering Department, College of Engineering, University of Sulaimani, Sulaimani 46001, Kurdistan Region, Iraq
*
Author to whom correspondence should be addressed.
Sustainability 2021, 13(22), 12544; https://doi.org/10.3390/su132212544
Submission received: 11 October 2021 / Revised: 28 October 2021 / Accepted: 3 November 2021 / Published: 13 November 2021
(This article belongs to the Special Issue Towards Advanced Sustainable Recycled Materials and Technology)

Abstract

:
Cement paste is the most common construction material being used in the construction industry. Nanomaterials are the hottest topic worldwide, which affect the mechanical properties of construction materials such as cement paste. Cement pastes containing carbon nanotubes (CNTs) are piezoresistive intelligent materials. The electrical resistivity of cementitious composites varies with the stress conditions under static and dynamic loads as carbon nanotubes are added to the cement paste. In cement paste, electrical resistivity is one of the most critical criteria for structural health control. Therefore, it is essential to develop a reliable mathematical model for predicting electrical resistivity. In this study, four different models—including the nonlinear regression model (NLR), linear regression model (LR), multilinear regression model (MLR), and artificial neural network model (ANN)—were proposed to predict the electrical resistivity of cement paste modified with carbon nanotube. Furthermore, the correlation between the compressive strength of cement paste and the electrical resistivity model has also been proposed in this study and compared with models in the literature. In this respect, 116 data points were gathered and examined to develop the models, and 56 data points were collected for the proposed correlation model. Most critical parameters influencing the electrical resistivity of cement paste were considered during the modeling process—i.e., water to cement ratio ranged from 0.2 to 0.485, carbon nanotube percentage varied from 0 to 1.5%, and curing time ranged from 1 to 180 days. The electrical resistivity of cement paste with a very large number ranging from 0.798–1252.23 Ω.m was reported in this study. Furthermore, various statistical assessments such as coefficient of determination (R2), mean absolute error (MAE), root mean square error (RMSE), scatter index (SI), and OBJ were used to investigate the performance of different models. Based on statistical assessments—such as SI, OBJ, and R2—the output results concluded that the artificial neural network ANN model performed better at predicting electrical resistivity for cement paste than the LR, NLR, and MLR models. In addition, the proposed correlation model gives better performance based on R2, RMSE, MAE, and SI for predicting compressive strength as a function of electrical resistivity compared to the models proposed in the literature.

1. Introduction

Cement-based materials—such as paste, mortar, and concrete—are commonly used in the construction industry for their high strength, low cost, ease of construction, and large use. However, some drawbacks hinder the use of cement-based materials, such as poor longevity and comparatively low flexural strength. One method for addressing the aforementioned issue is to add nanoparticle fillers to cement-based materials [1,2,3,4], because the mechanical strength and service life of cement composite materials are determined by their microstructure and nanoscale mass transfer [5]. Besides, nanofiller composites or nanotechnology can show superior electrical conductivity [6,7] and piezoresistivity [8,9,10]. In other words, they can be used for smart concrete such as structural health monitoring. The piezoresistive effect is a self-monitoring parameter in structural materials that describes changing the electrical resistivity of material while it is subjected to mechanical stresses [11,12,13,14,15]. Past experiments have demonstrated that nanoparticles significantly affect the mechanical and electrical properties of cement-based materials such as cement slurry and concrete [16,17,18]. Since nanoparticles have a high surface area, offering high chemical reactivity, scattered nanoparticles may fill the gaps between cement grains, resulting in denser concrete.
Generally, the particle size of nanomaterials can be ranged between 1 and 100 nm [1,5,19]. Furthermore, nanotechnology has attracted immense global attention due to its high success in diverse fields. Many types of conductive nanomaterials have been used to enhance cement paste sensitivity in previous studies, such as graphite, carbon nanofiber (CNF), carbon fiber (CF), carbon black (CB), magnetite (Fe3O4), and carbon nanotube (CNT) [20,21,22,23,24,25,26]. Nanotechnology may be used in a variety of industries, including the construction sector, through nanoparticles in the manufacturing of cement-based products. Additionally, using conductive nanoparticles in cement-based material highly increased the sensitivity of the material by increasing electrical conductivity [10,20,27].
CNTs are one of the most popular conductive nanoparticles widely used in construction materials such as cement paste. CNTs with a scale of several nanometers exhibit excellent structural integrity, electrical conductivity, remarkably excellent mechanical strength, and electromechanical properties [4,28,29,30,31,32,33,34,35,36]. Due to the excellent electrical conductivity and the high surface-to-volume ratio of CNTs, it draws the interest of researchers to the appropriate use of CNTs to boost the conductivity of ultra-high resistance matrix and structural health monitoring for industrial buildings.
Electrical resistivity is one of the most essential parameters for structural health monitoring in cement paste because it makes concrete sensitive for detecting any strain or cracks. Many studies have used electrical resistivity tests for cement content applications [17,37,38,39]. Despite the number of studies, there is a paucity of detail in the literature regarding tracking and quantification of electrical resistivity assessments to characterize cement-based materials. Measurement of electrical resistivity reaction characteristics has sufficient sensitivity for tracking cemented materials’ characteristics, but there is no quantification [40]. In fact, few studies have proposed statically models to estimate the electrical resistivity of cement-based materials [39]. Moreover, cement paste’s electrical resistivity is impacted by many factors, including water to cement ratio (w/c), temperature, moisture content, nanoparticle content, and pore structure [17]. Therefore, these parameters have been considered to propose accurate models—namely w/c, curing, and compressive strength.
According to the matters mentioned above, the purpose of this study was to analyze and quantify the influence of a wide variety of combination proportions on the electrical resistivity of cement paste, including CNT concentration, curing time, and w/c ratio. Different model techniques such as linear regression (LR), nonlinear regression (NLR), multi-logistic regression (MLR), and artificial neural network (ANN) were implemented to predict the electrical resistivity of CNT-cement using 116 data samples from the literature review [4,30,32,33,34,35,36].

2. Research Significance
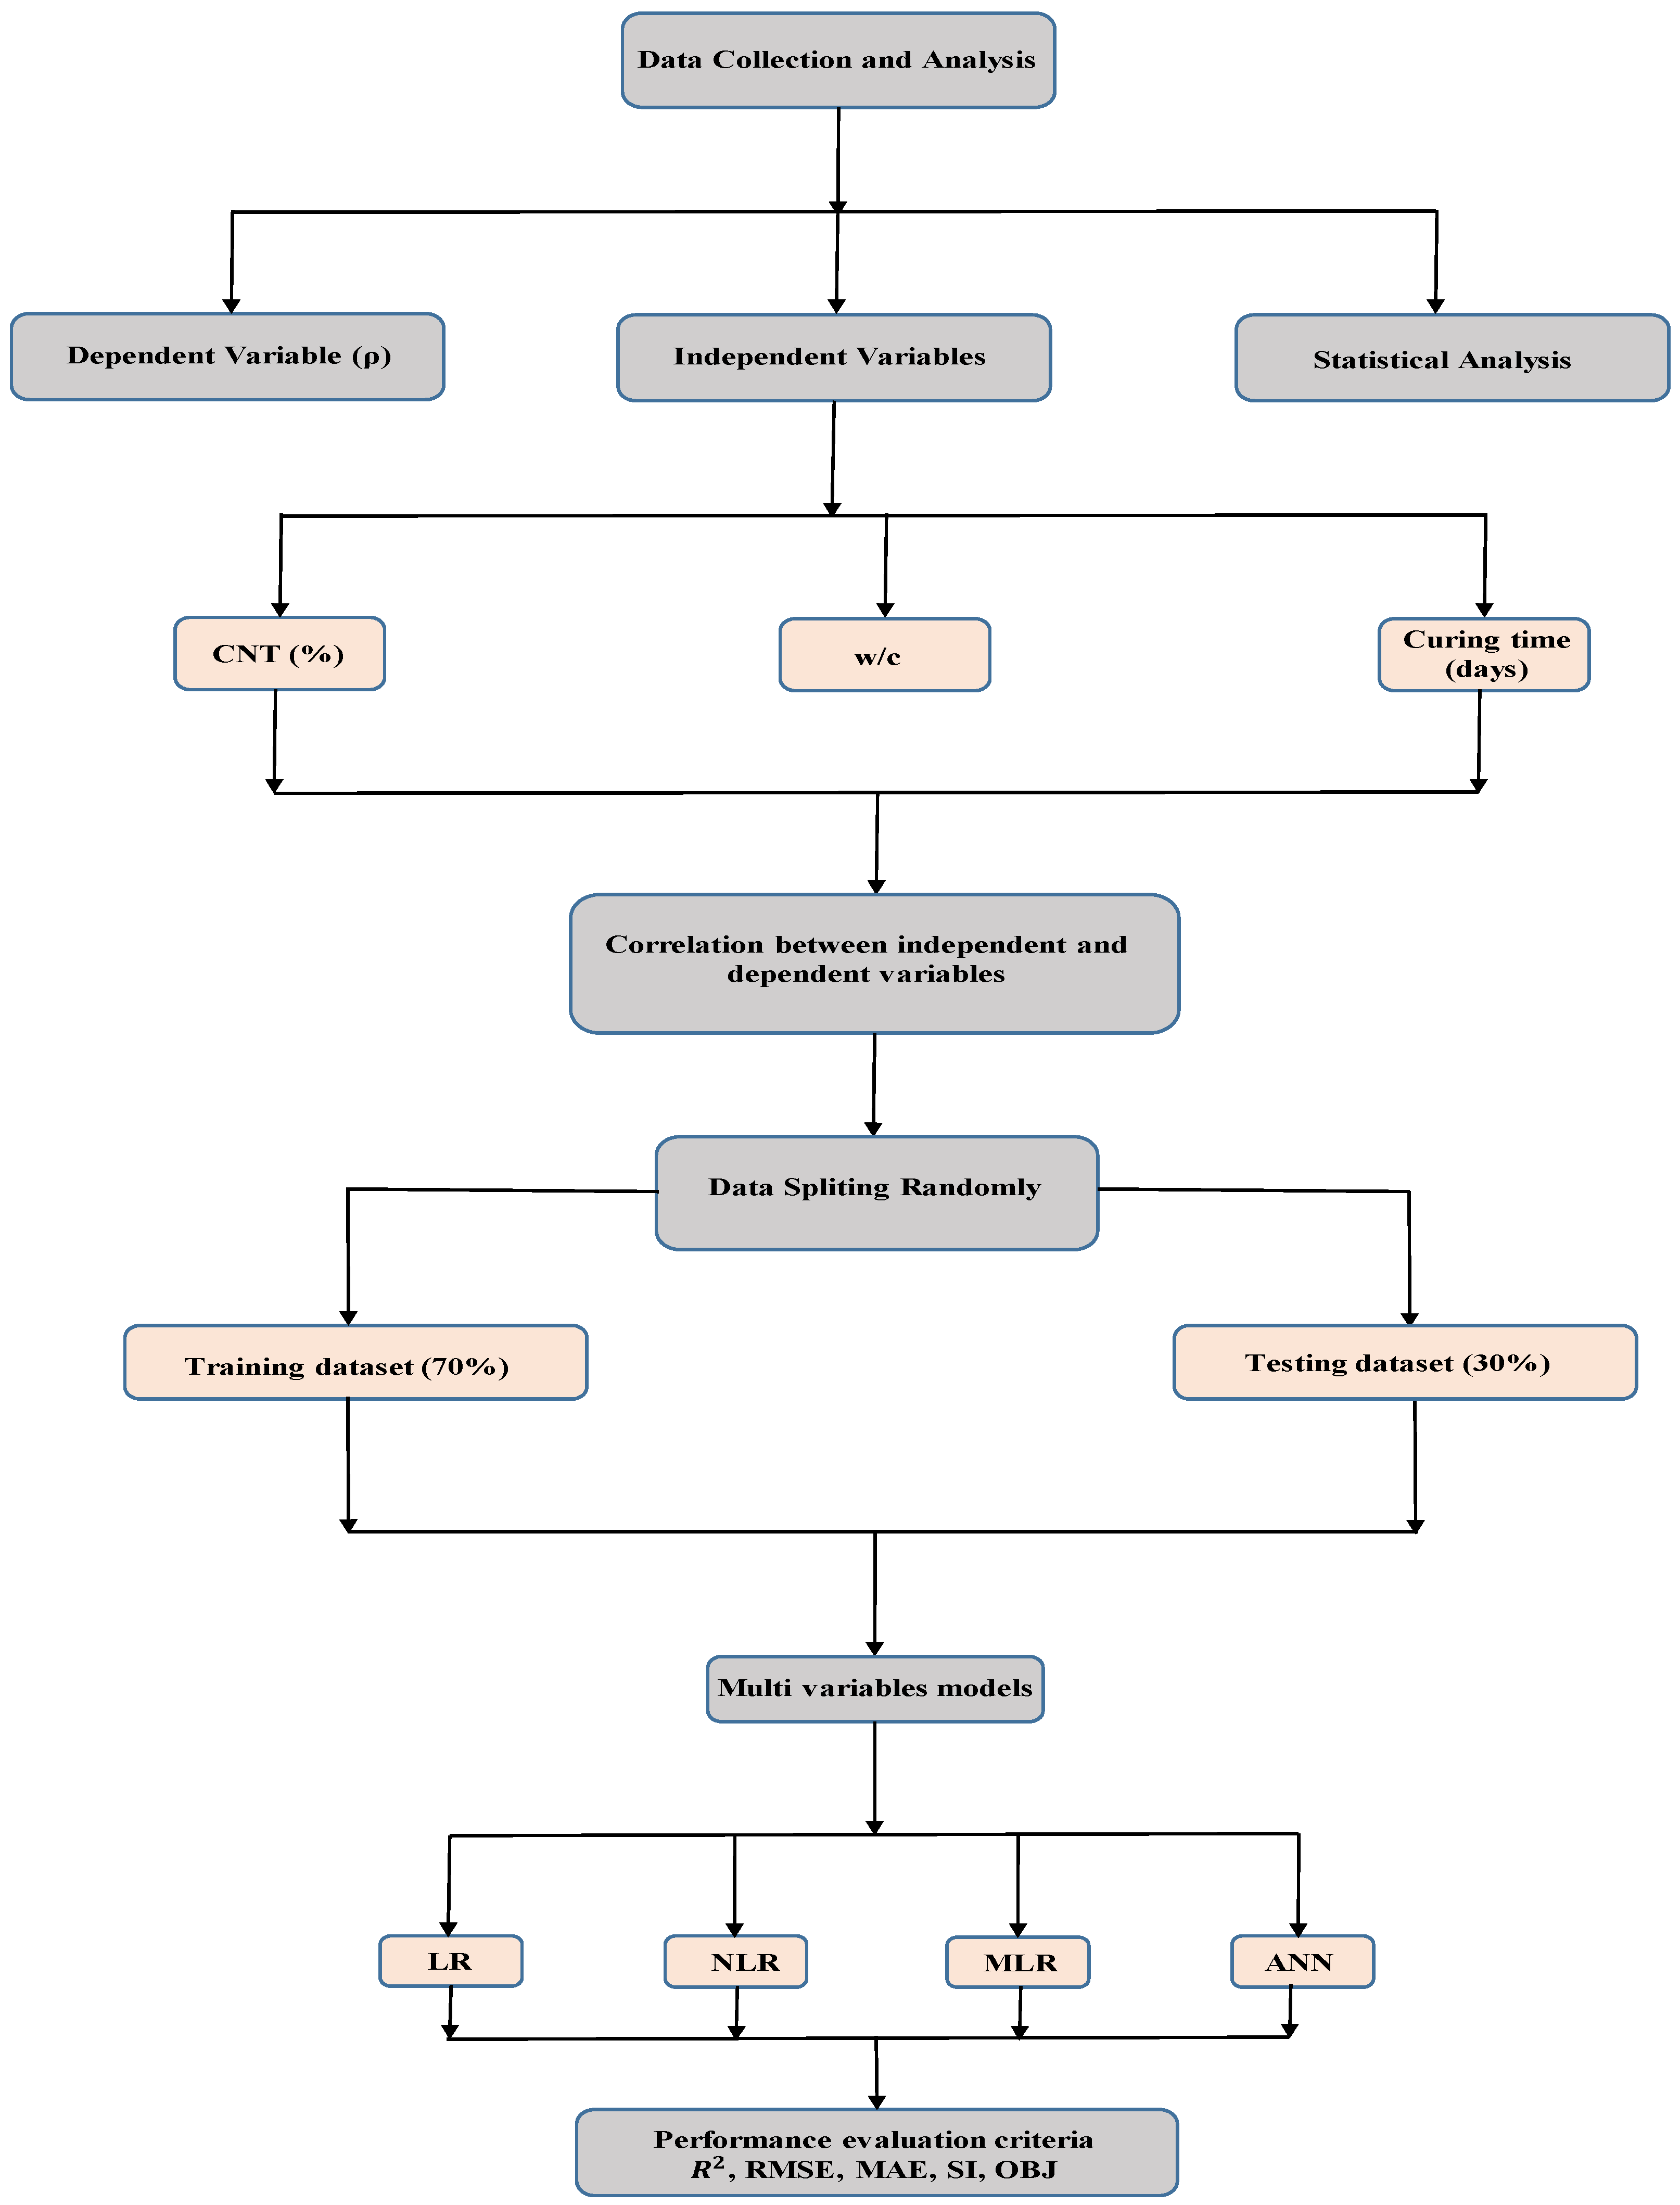
This study aims to predict the electrical resistivity of CNT-based paste as a function of w/c, curing time, and CNTs using different multiscale models. The models’ sensitivity was evaluated using statistical assessment tools such as Microsoft Excel, Weka [41], and Minitab software. Accordingly, a set of experimental data have been collected from other research papers and utilized with different statistical modeling method target (i) to perform a statistical assessment and investigate the impact of mixture compositions such as CNTs, water to cement ratio, and curing time on the electrical resistivity of cement paste; (ii) to find the threshold value of carbon nanotube content in cement paste to reduce electrical resistivity and create smart cement paste; (iii) to assess and discover the best dependable model to evaluate the cement paste’s resistivity with CNTs between all models (linear model, nonlinear model, multi-logistic relation model, and ANN) using statistical evaluation parameters.

3. Methodology

The literature study yielded 116 experimental data, which were then statistically analyzed and classified into two categories. The first group, consisting of 82 data points, was used as a training data set. The second group, which includes 34 data points, was considered a testing data set [42,43]. The summary of data collection includes water to cement ratio (w/c), CNT percentage, and curing time as input variables and measured electrical resistivity as an output parameter (Table A1). As mentioned previously, the main goal of this study is to design a model to predict the electrical resistivity of cement paste modified with carbon nanotube. Therefore, four different statistical models were used to evaluate the predicted electrical resistivity. In addition, the following flow chart shows the process of modeling based on the selected parameters (Figure 1). Further details regarding the figures and predicting models have been shown in the following sub-sections.

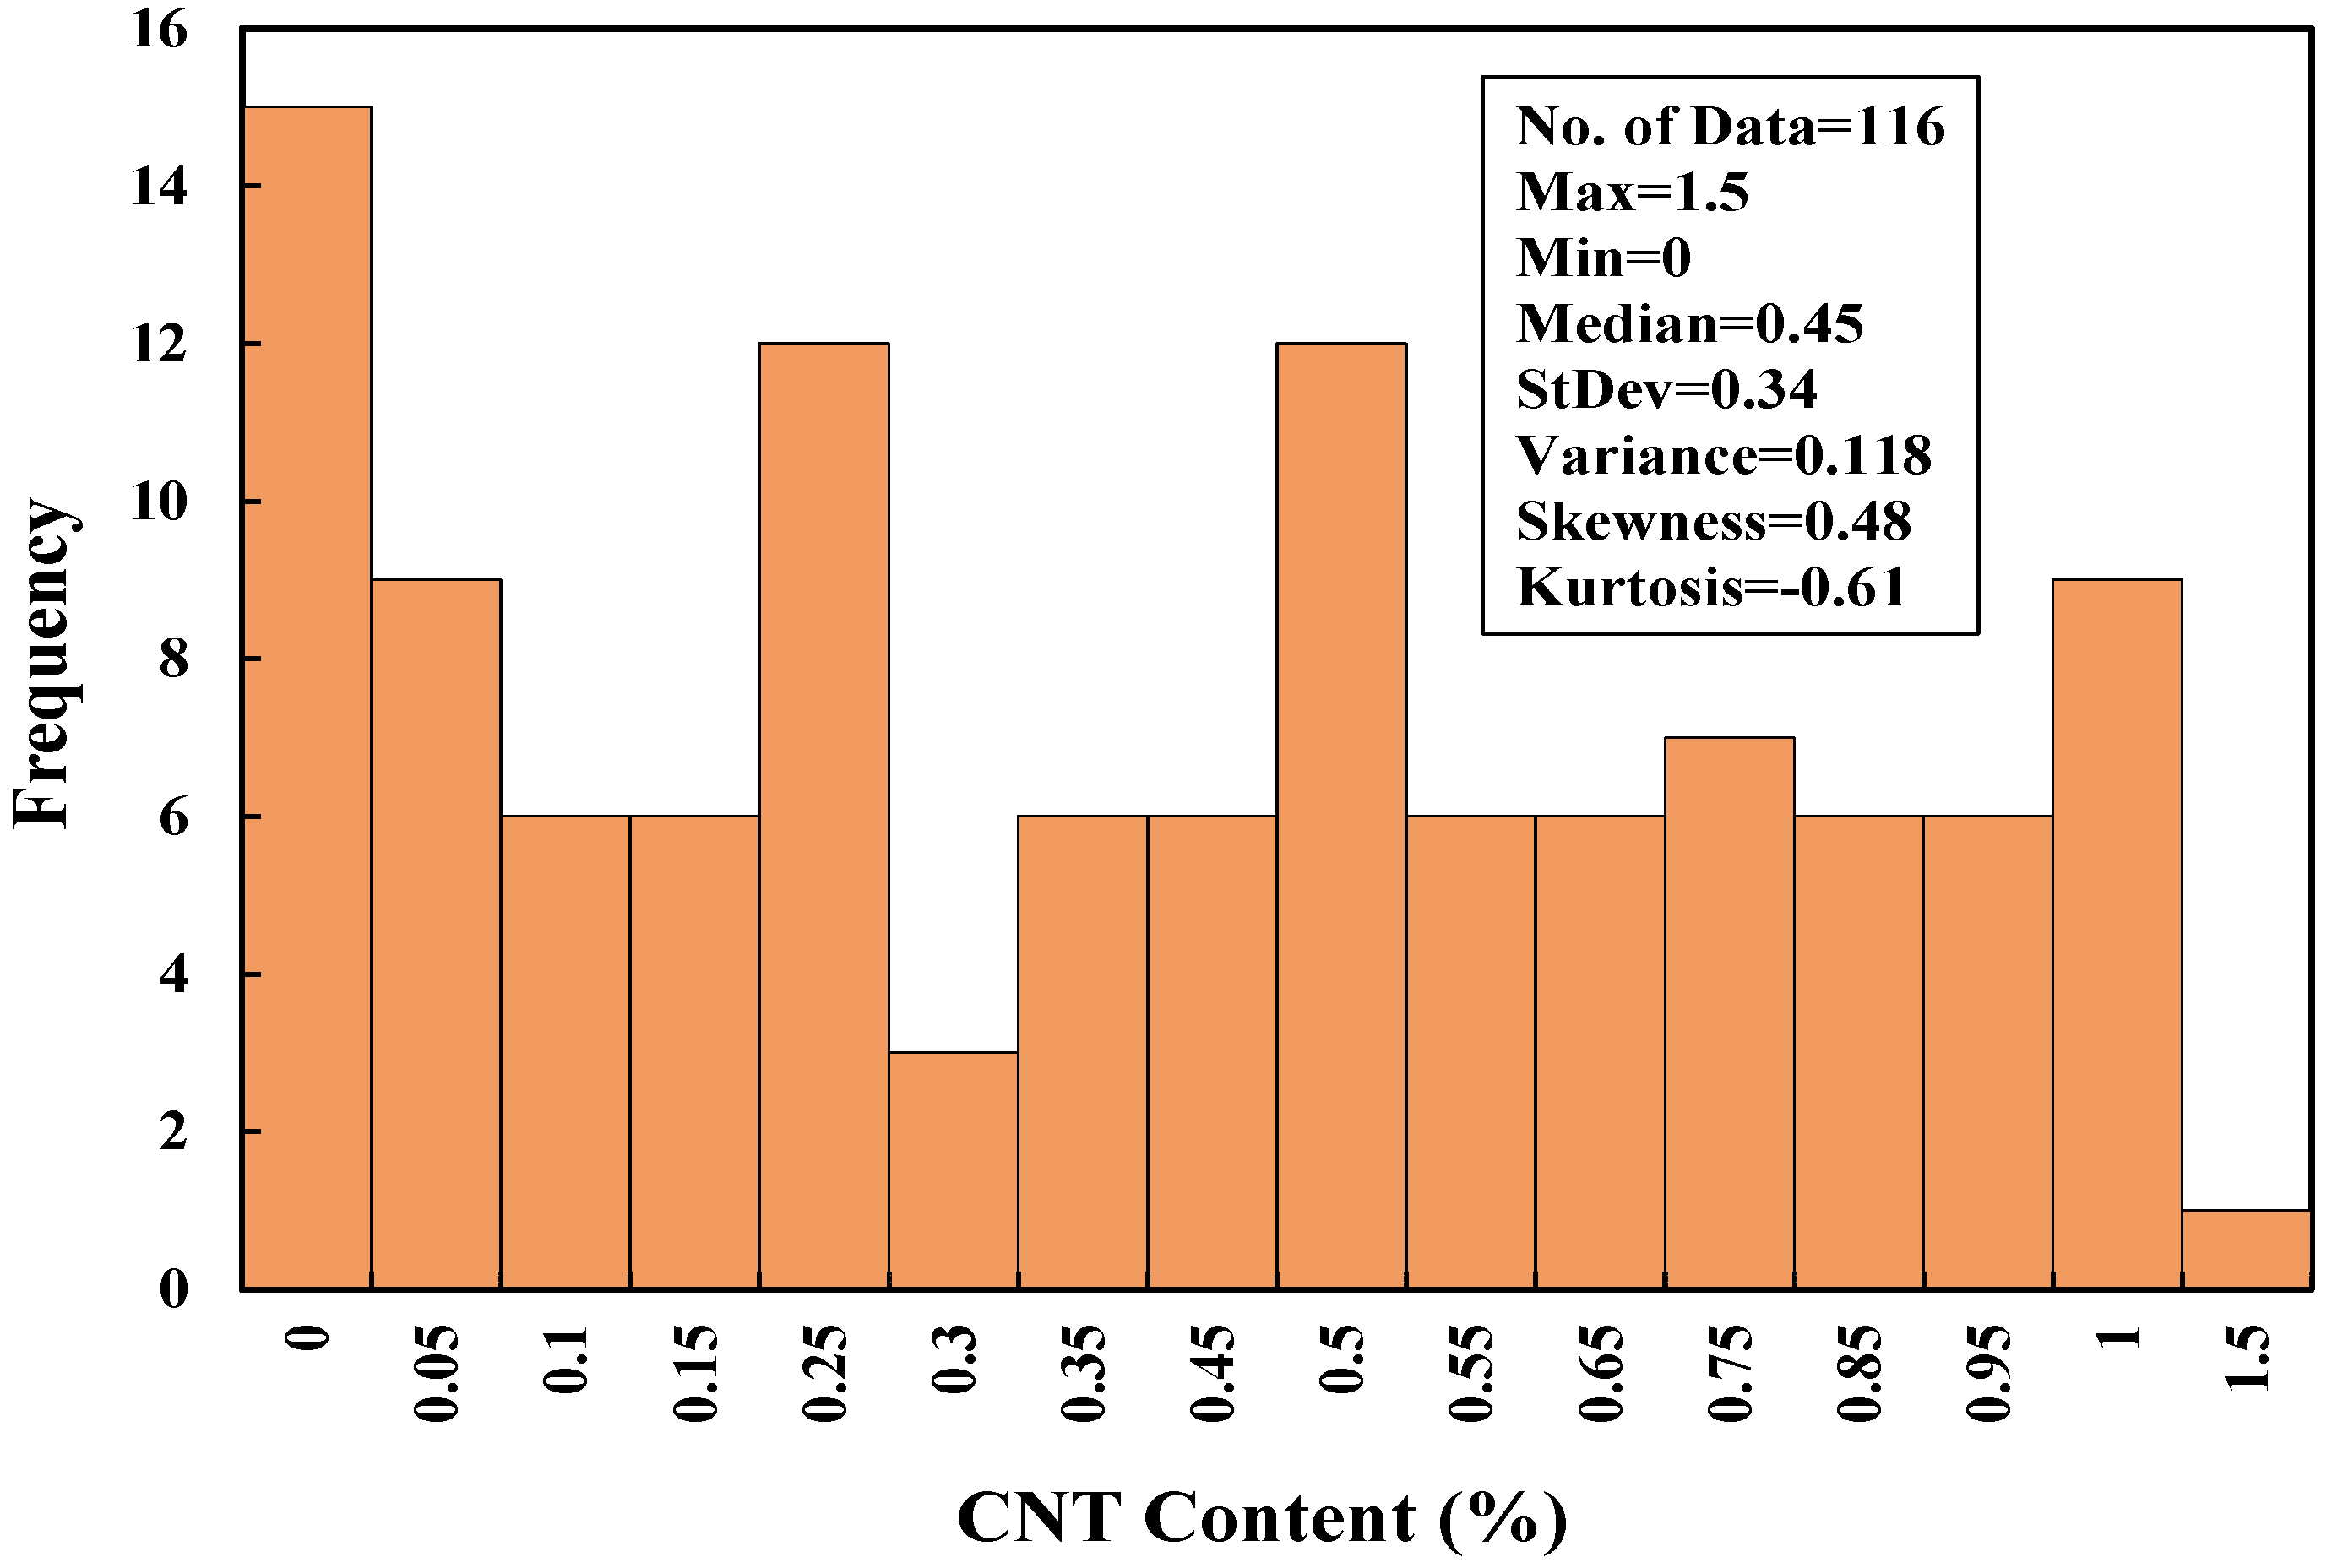
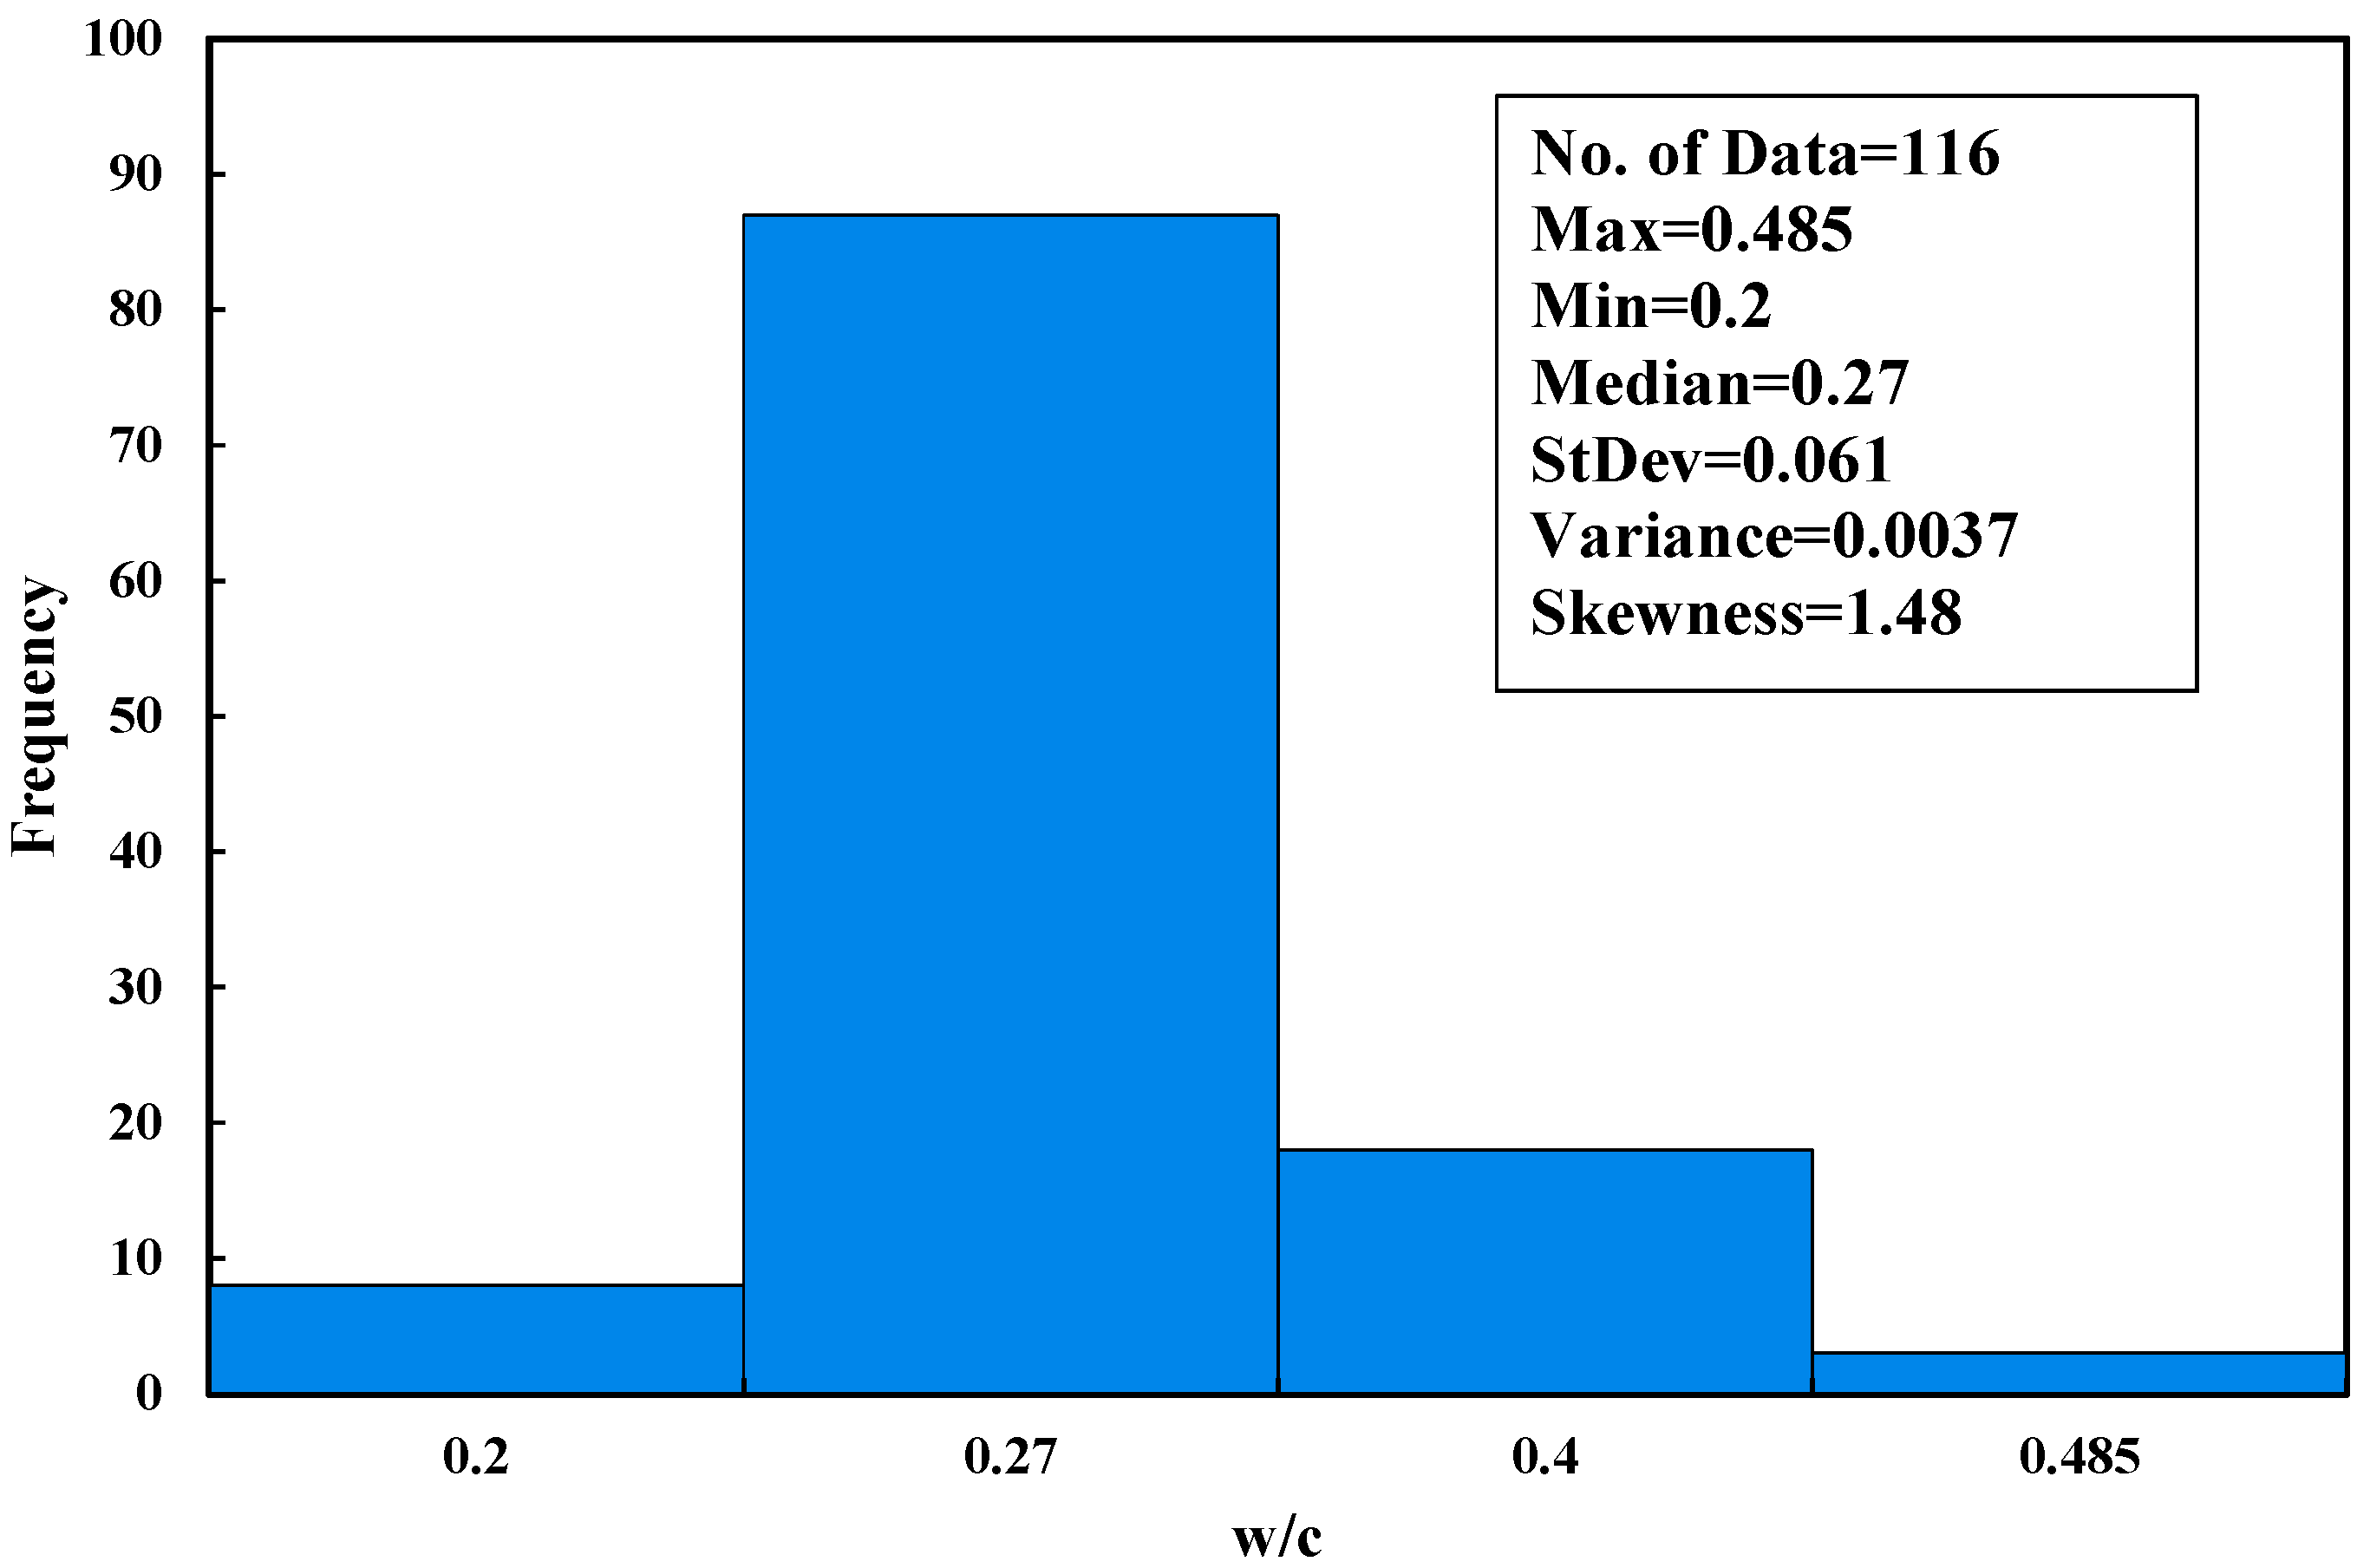
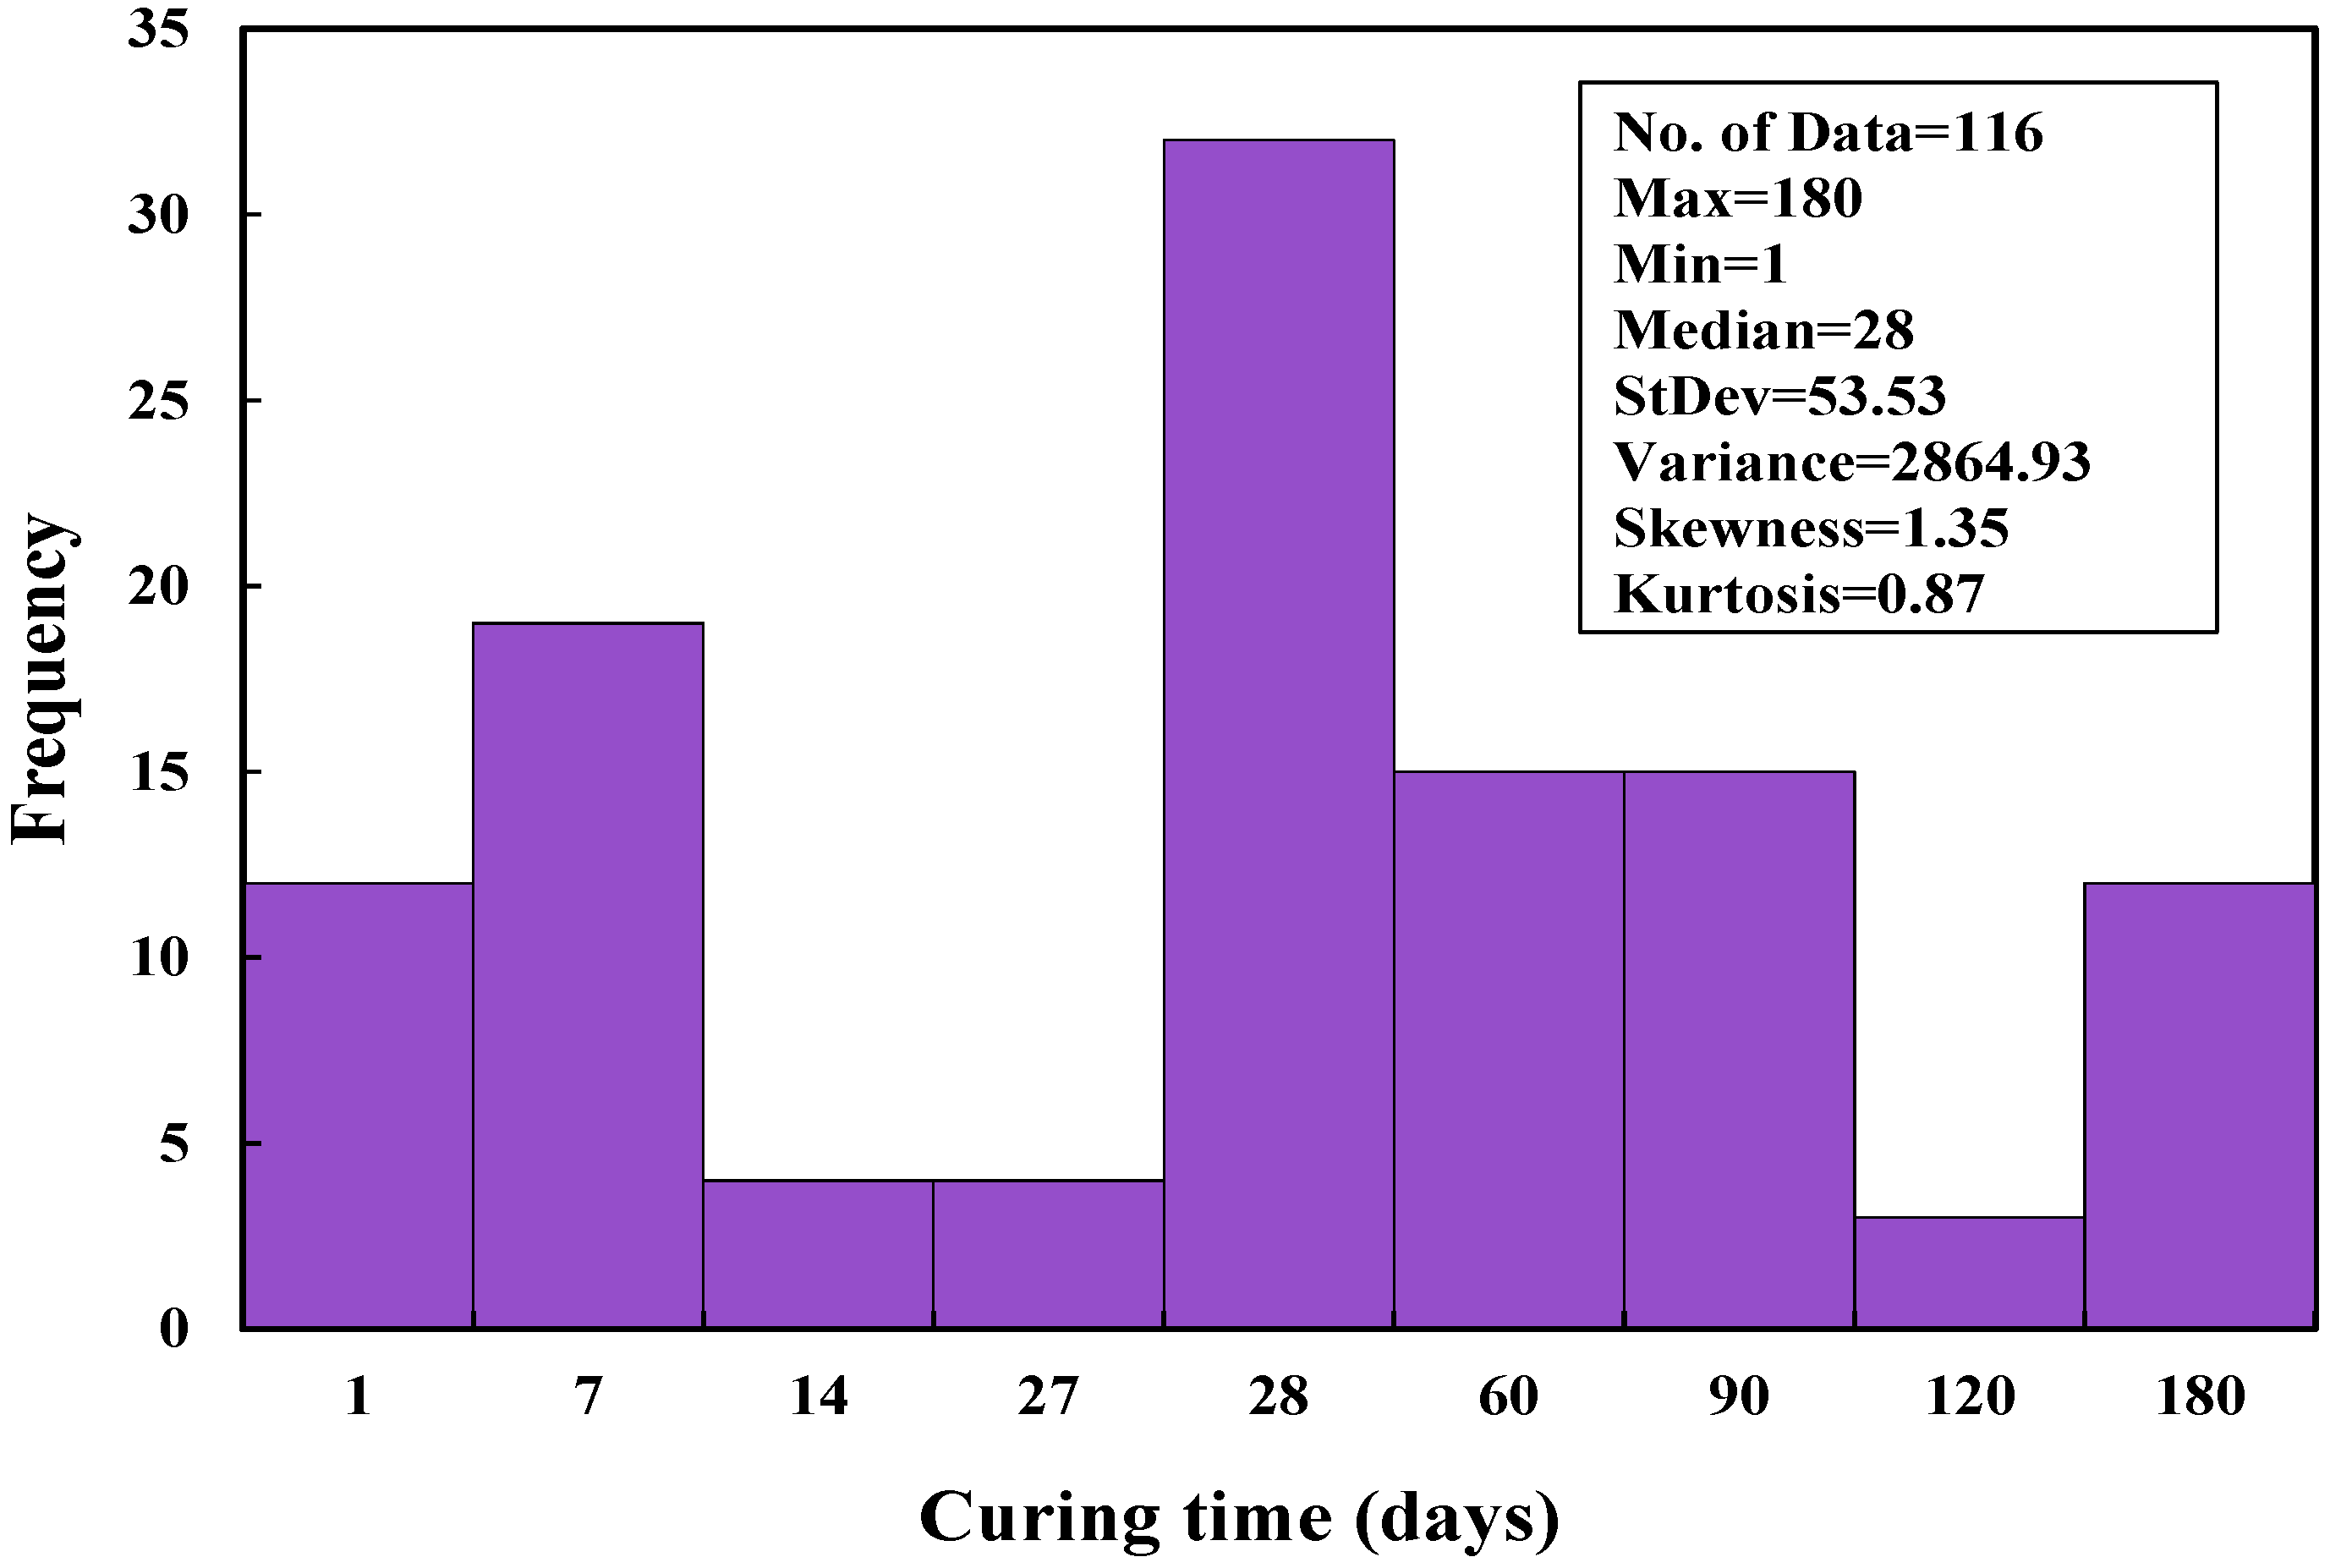
3.1. Statistical Evaluation

This study performed multiple mathematical algorithms to demonstrate strong relations among input variables and electrical resistivity. From this point of view, all considered variables, including (i) CNT content; (ii) w/c; (iii) curing time, as input variables were plotted and analyzed with electrical resistivity. Additionally, the statistical function such as standard deviation, skewness, kurtosis, and variance was calculated to demonstrate the distribution of each variable with electrical resistivity. As for the kurtosis parameter, the shorter distribution tails have a strong negative value relative to the normal distribution, whereas the longer tails reflect a positive value.
(i)
Carbon Nanotubes (CNTs)
Based on data collected from the literature review, which contains 116 data, the CNTs utilized in the mix proportions had the particle size diameter between 10–50 nm, its purity was 95–98%, and the surface area between 60–250 m2/g. The proportion of carbon nanotubes utilized in the cementitious mixes ranged between 0 and 1.5 percent by weight of cement. Moreover, the standard deviation, variance, skewness, and kurtosis are 0.34, 0.118, 0.48, and 0.61, respectively (Figure 2).
(ii)
Water to Cement Ratio (w/c)
According to the aggregated data from earlier studies, the w/c ratio of cement paste modified with carbon nanotubes ranged between 0.2 and 0.485, with a median value of 0.27. Other characteristics such as standard deviation, kurtosis, variance, and skewness, were determined to be 0.061, 1.72, 0.0037, and 1.48, respectively, according to the statistical analysis. Furthermore, the change between electrical resistivity and w/c and the histogram of cement paste modified with CNTs is illustrated in Figure 3.
(iii)
Curing Time (t)
According to published statistics, the curing period for cement paste enhanced with carbon nanotubes ranged from 1 to 180 days, with an average of 28 days. Based on the statistical analysis, the standard deviation, kurtosis variance, and skewness are 53.53, 0.87, 2864.93, and 1.35 respectively. Figure 4 indicates the histogram of electrical resistivity of cement paste.
(iv)
Electrical Resistivity (ρ)
The electrical resistivity ( ρ ) of cement paste mixtures adjusted with CNTs ranged from 0.798 to 1252.23 Ω.m, with a median of 71.66 Ω.m, a standard deviation of 187.64 Ω.m, and a variance of 35516.14 Ω.m, according to the comprehensive data listed in Table A1 (Appendix A). From the overall data, 65%, 23%, and 12% of the mixes had electrical resistivity of 0.798–141.92, 141.92–350, and 350 Ω.m, respectively (Table A1).

3.2. Modeling

No direct relationships between electrical resistivity and other formulations of CNT-based paste—such as CNT content, w/c, and curing time up to 180 days—can be observed following the statistical study and figures stated in Section 4, even according to the R2 value. Therefore, four different models are proposed to test the Effect of the various mixture proportions described above on cement paste adjusted with CNTs, as stated below.
The models suggested in this study are used to estimate cement paste’s electrical resistivity and choose the best one that gives a better estimate of electrical resistivity. A validation study of the various models’ predictions was conducted using the following criteria: the model must be statistically valid; the percentage error measured and predicted should be very low; the RMSE, MAE, SI should be lower; and higher R2 values should be obtained.

3.2.1. Linear Regression Model

The linear regression model (LR) [44] is the most common approach to forecasting the electrical resistivity of cement paste, as seen in Equation (1)
ρ = a + b   ( w / c )
where ρ indicated the output result, a represents the intercept value with the y-axis, b is a slope, and w/c represents the input variable consequently. On the other hand, the equation above does not incorporate other components, and factors of cement paste modified with CNT that influence electrical resistivity, such as (CNT), and curing time. Equation (2) is then recommended to incorporate all other mixing quantities and factors that could affect electrical resistivity to have more accurate and scientific observations.
  ( ρ ) = a + b ( CNT ) + c ( t ) + d ( w c )
where ρ is the electrical resistivity, CNT is the carbon nanotube in %, t is curing time in (days), and ( w / c ) is water to cement ratio. In addition,   a ,   b ,   c ,   and   d are model parameters. The suggested Equation (2) can be viewed as an expansion of Equation (1) since all variables can be modified linearly. While all variables may influence electrical resistivity and interfere with each other, this may not always be the case in all contexts. Therefore, to accurately approximate the electrical resistivity with adequate precision, the model must always be updated.

3.2.2. Multi Logistic Regression Model

If the predictor variable has a parameter of more than two, it has been suggested that a multi logistic regression model be used (MLR). MLR can also be found equivalent to multiple linear regression, which is also a predictive method. It may also be used to describe the difference between the predictor variables and the independent variables (Equation (3)).
  ( ρ ) = a ( w c ) b ( t ) c ( CNT ) d
However, Equation (3) has a constraint that cannot be applied to forecast electrical resistivity without CNT content. Therefore, the CNT content of this model should be greater than zero (the constraint of Equation (3) is CNT content > 0 percent). The least-square method was also used to determine model parameters (a, b, c, and d) and model variables.

3.2.3. Nonlinear Regression Model

The subsequent Equation (4) may be utilized to construct a nonlinear regression model in general [45,46,47]. The connection between the variables in Equations (1) and (2) are shown in Equation (4), which is used to estimate the electrical resistivity of cement paste enhanced with carbon nanotubes.
( ρ ) = a ( w c ) b + c ( t ) d + e ( CNT ) f + g
where ρ is the electrical resistivity, CNT is the carbon nanotube in %, t is the curing time in (days), and ( w / c ) is water to cement ratio. In addition,   a ,   b ,   c ,   d ,   e ,   f ,   and   g are model parameters that are calculated based on the least square method.

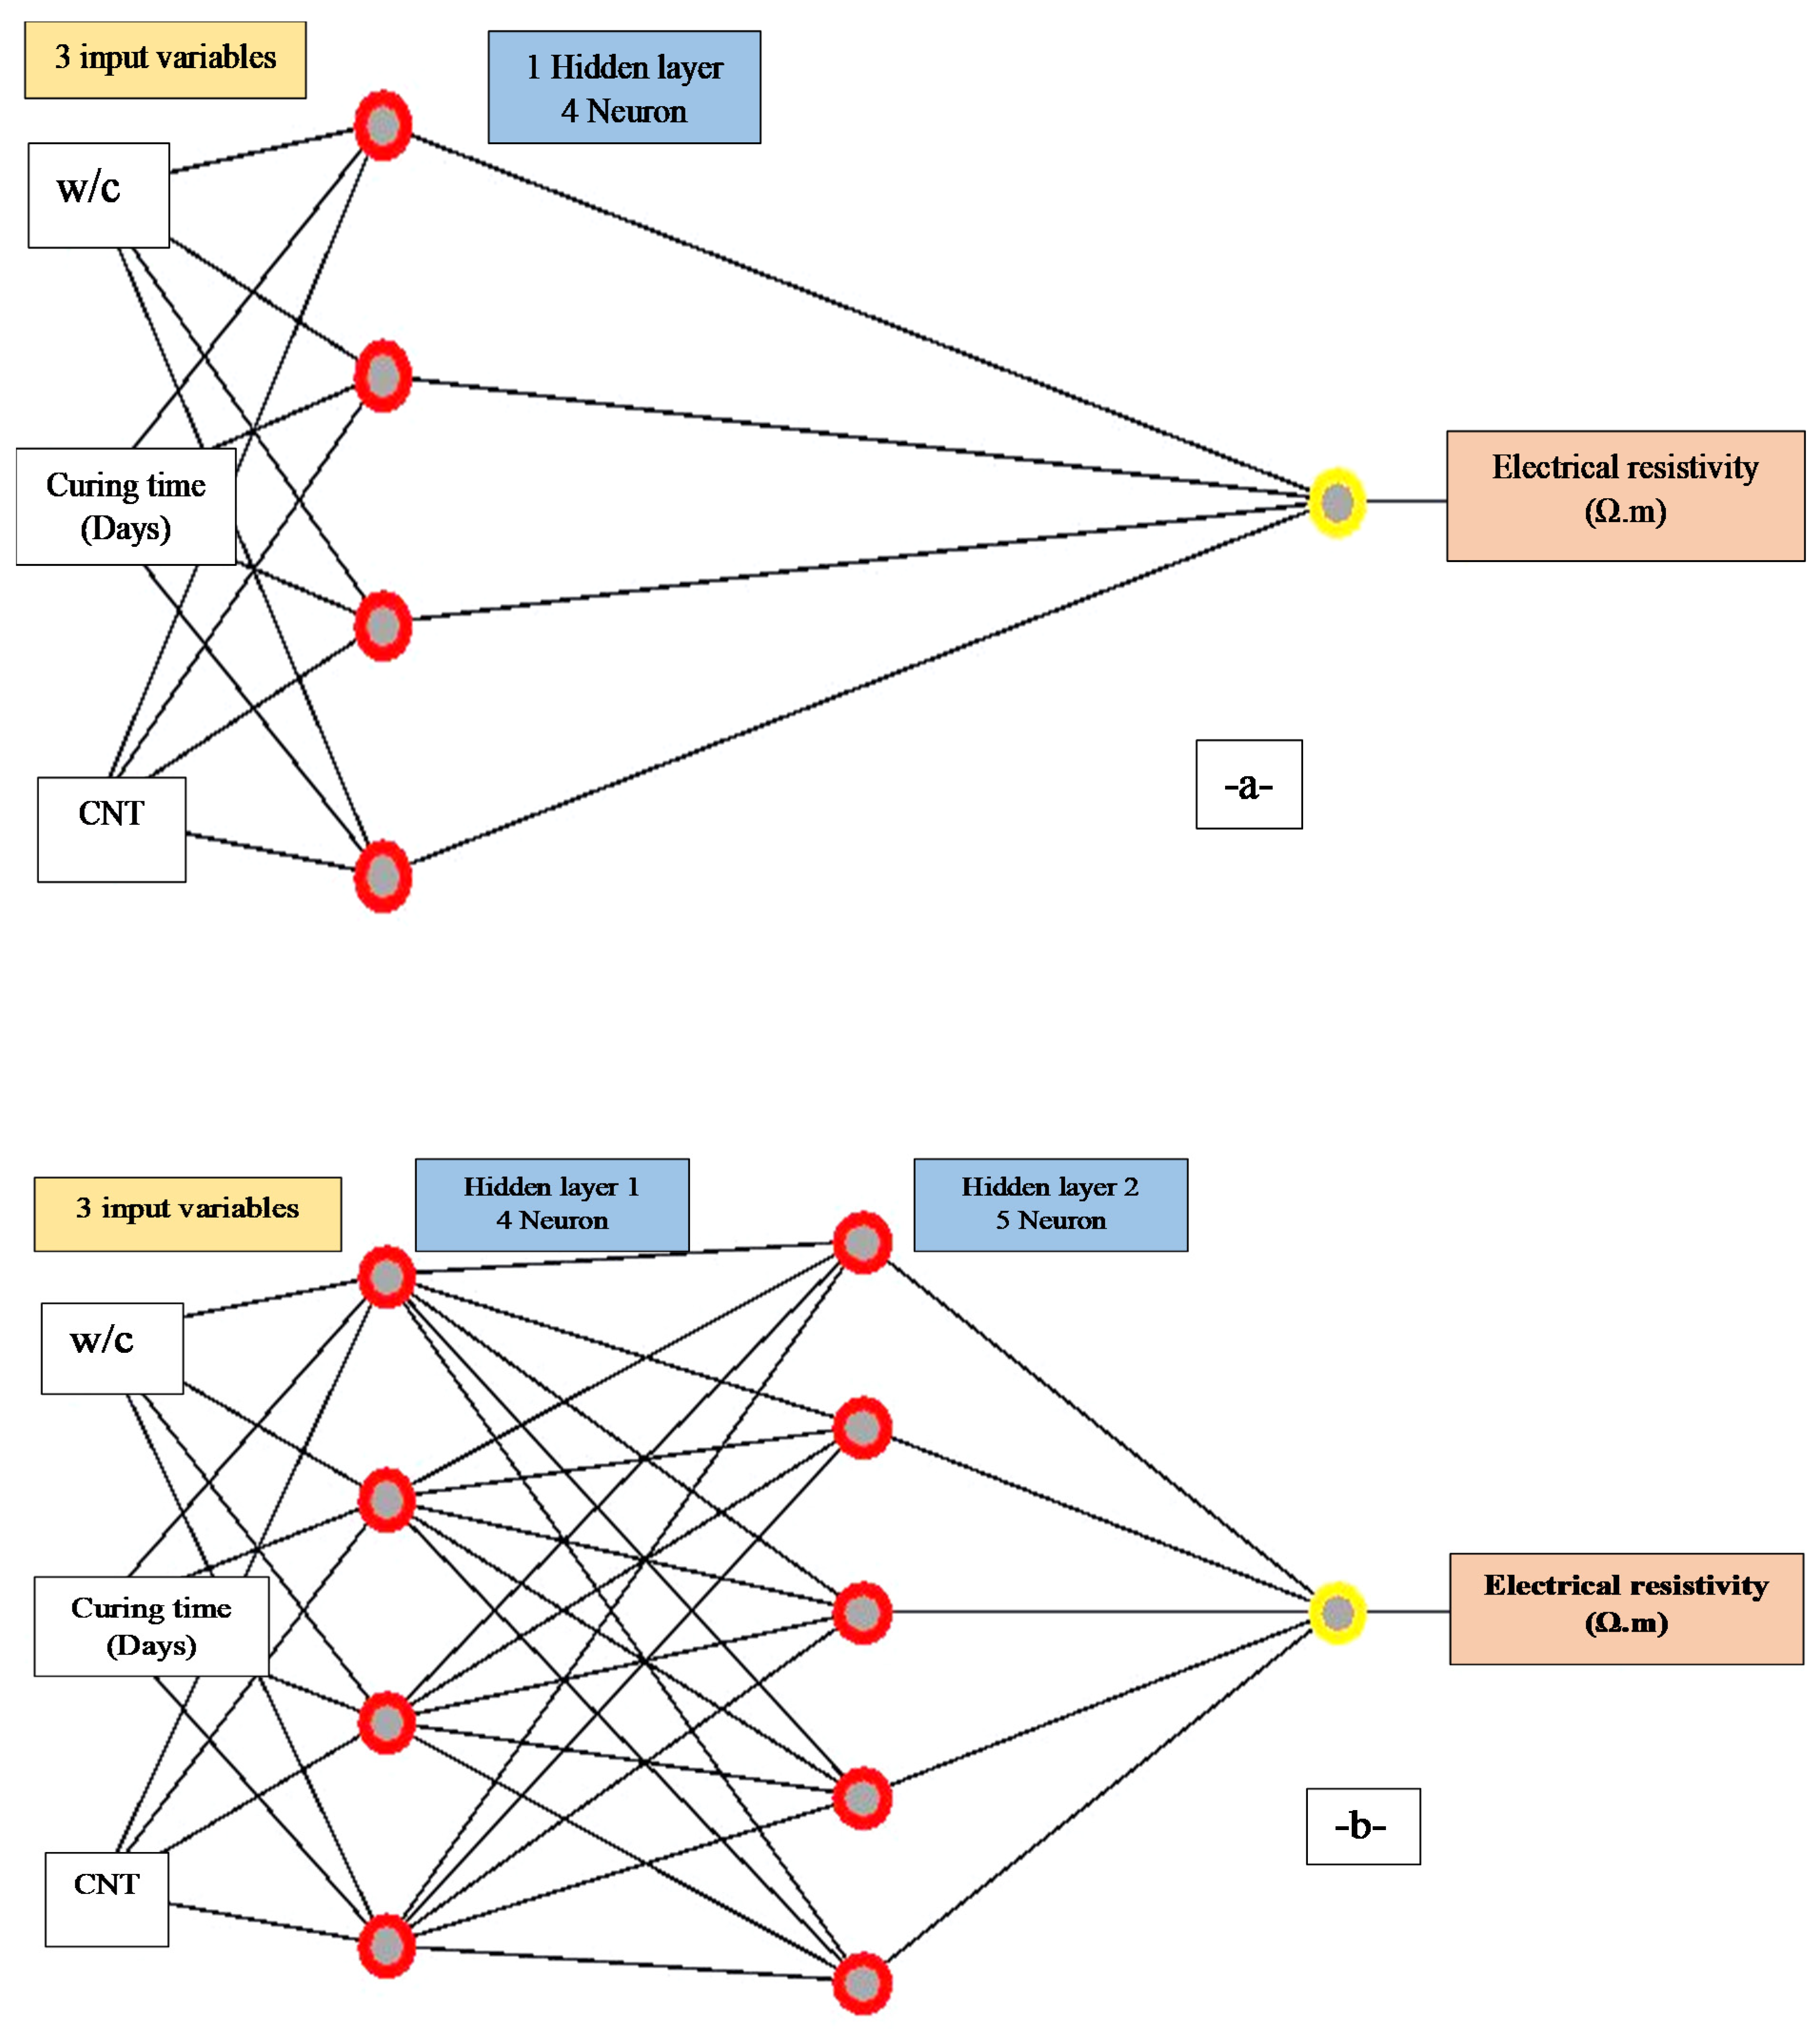
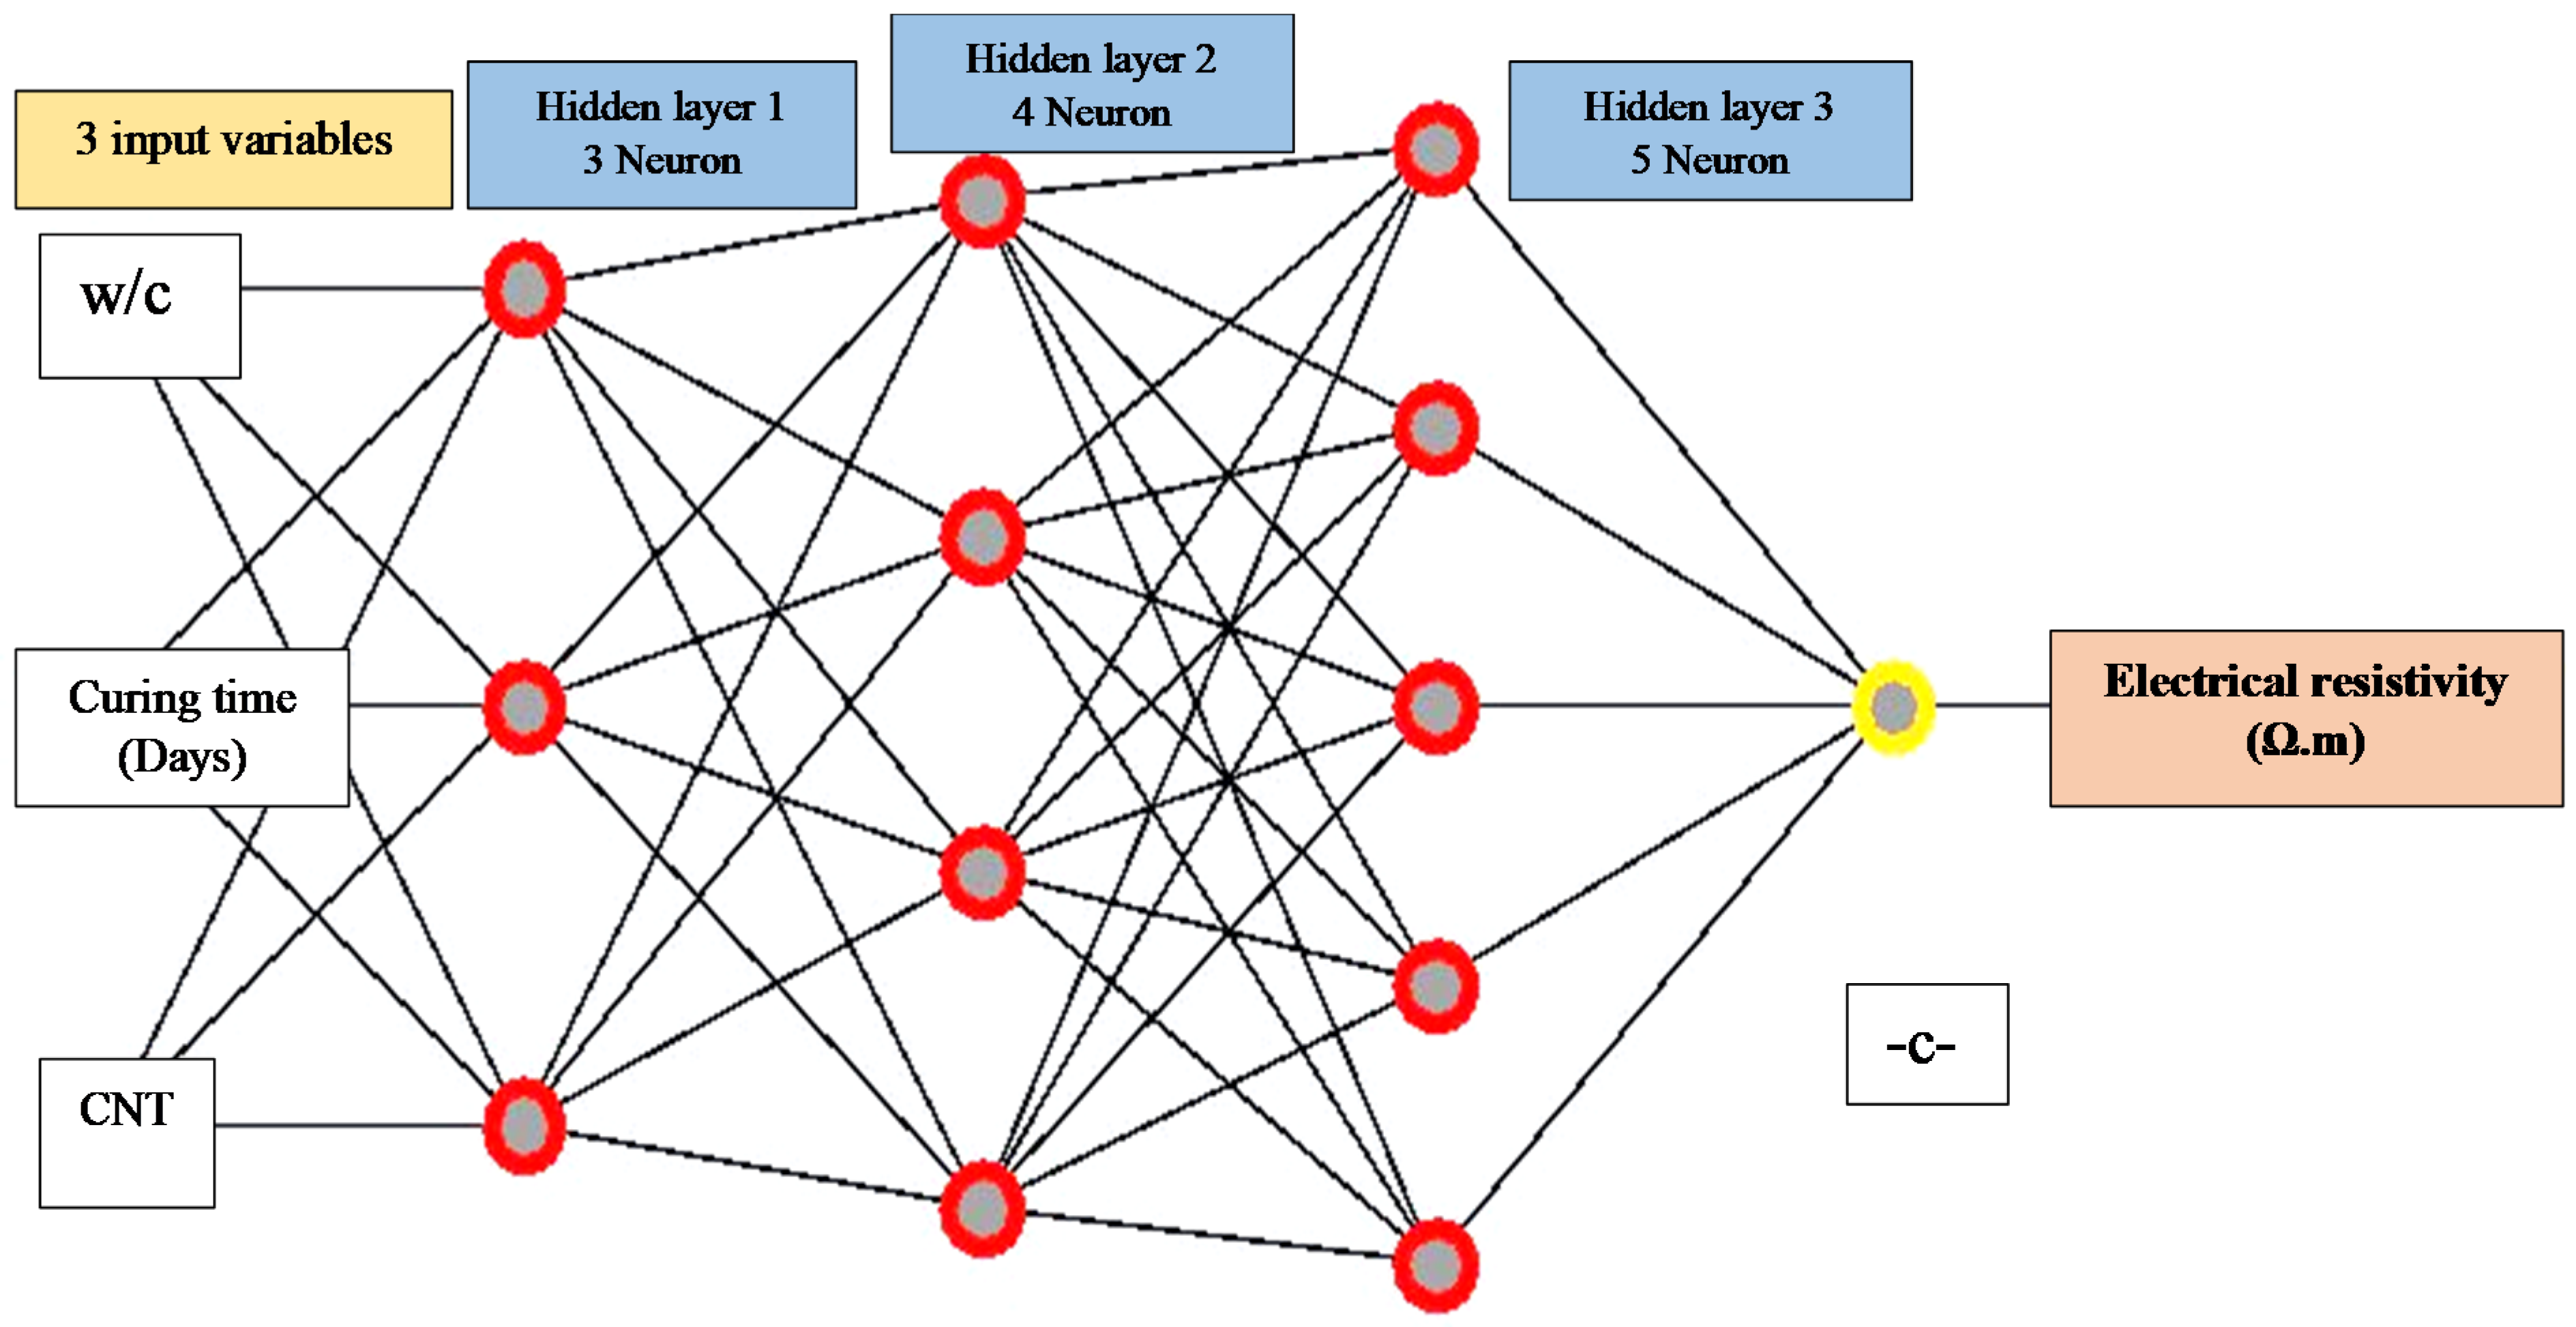
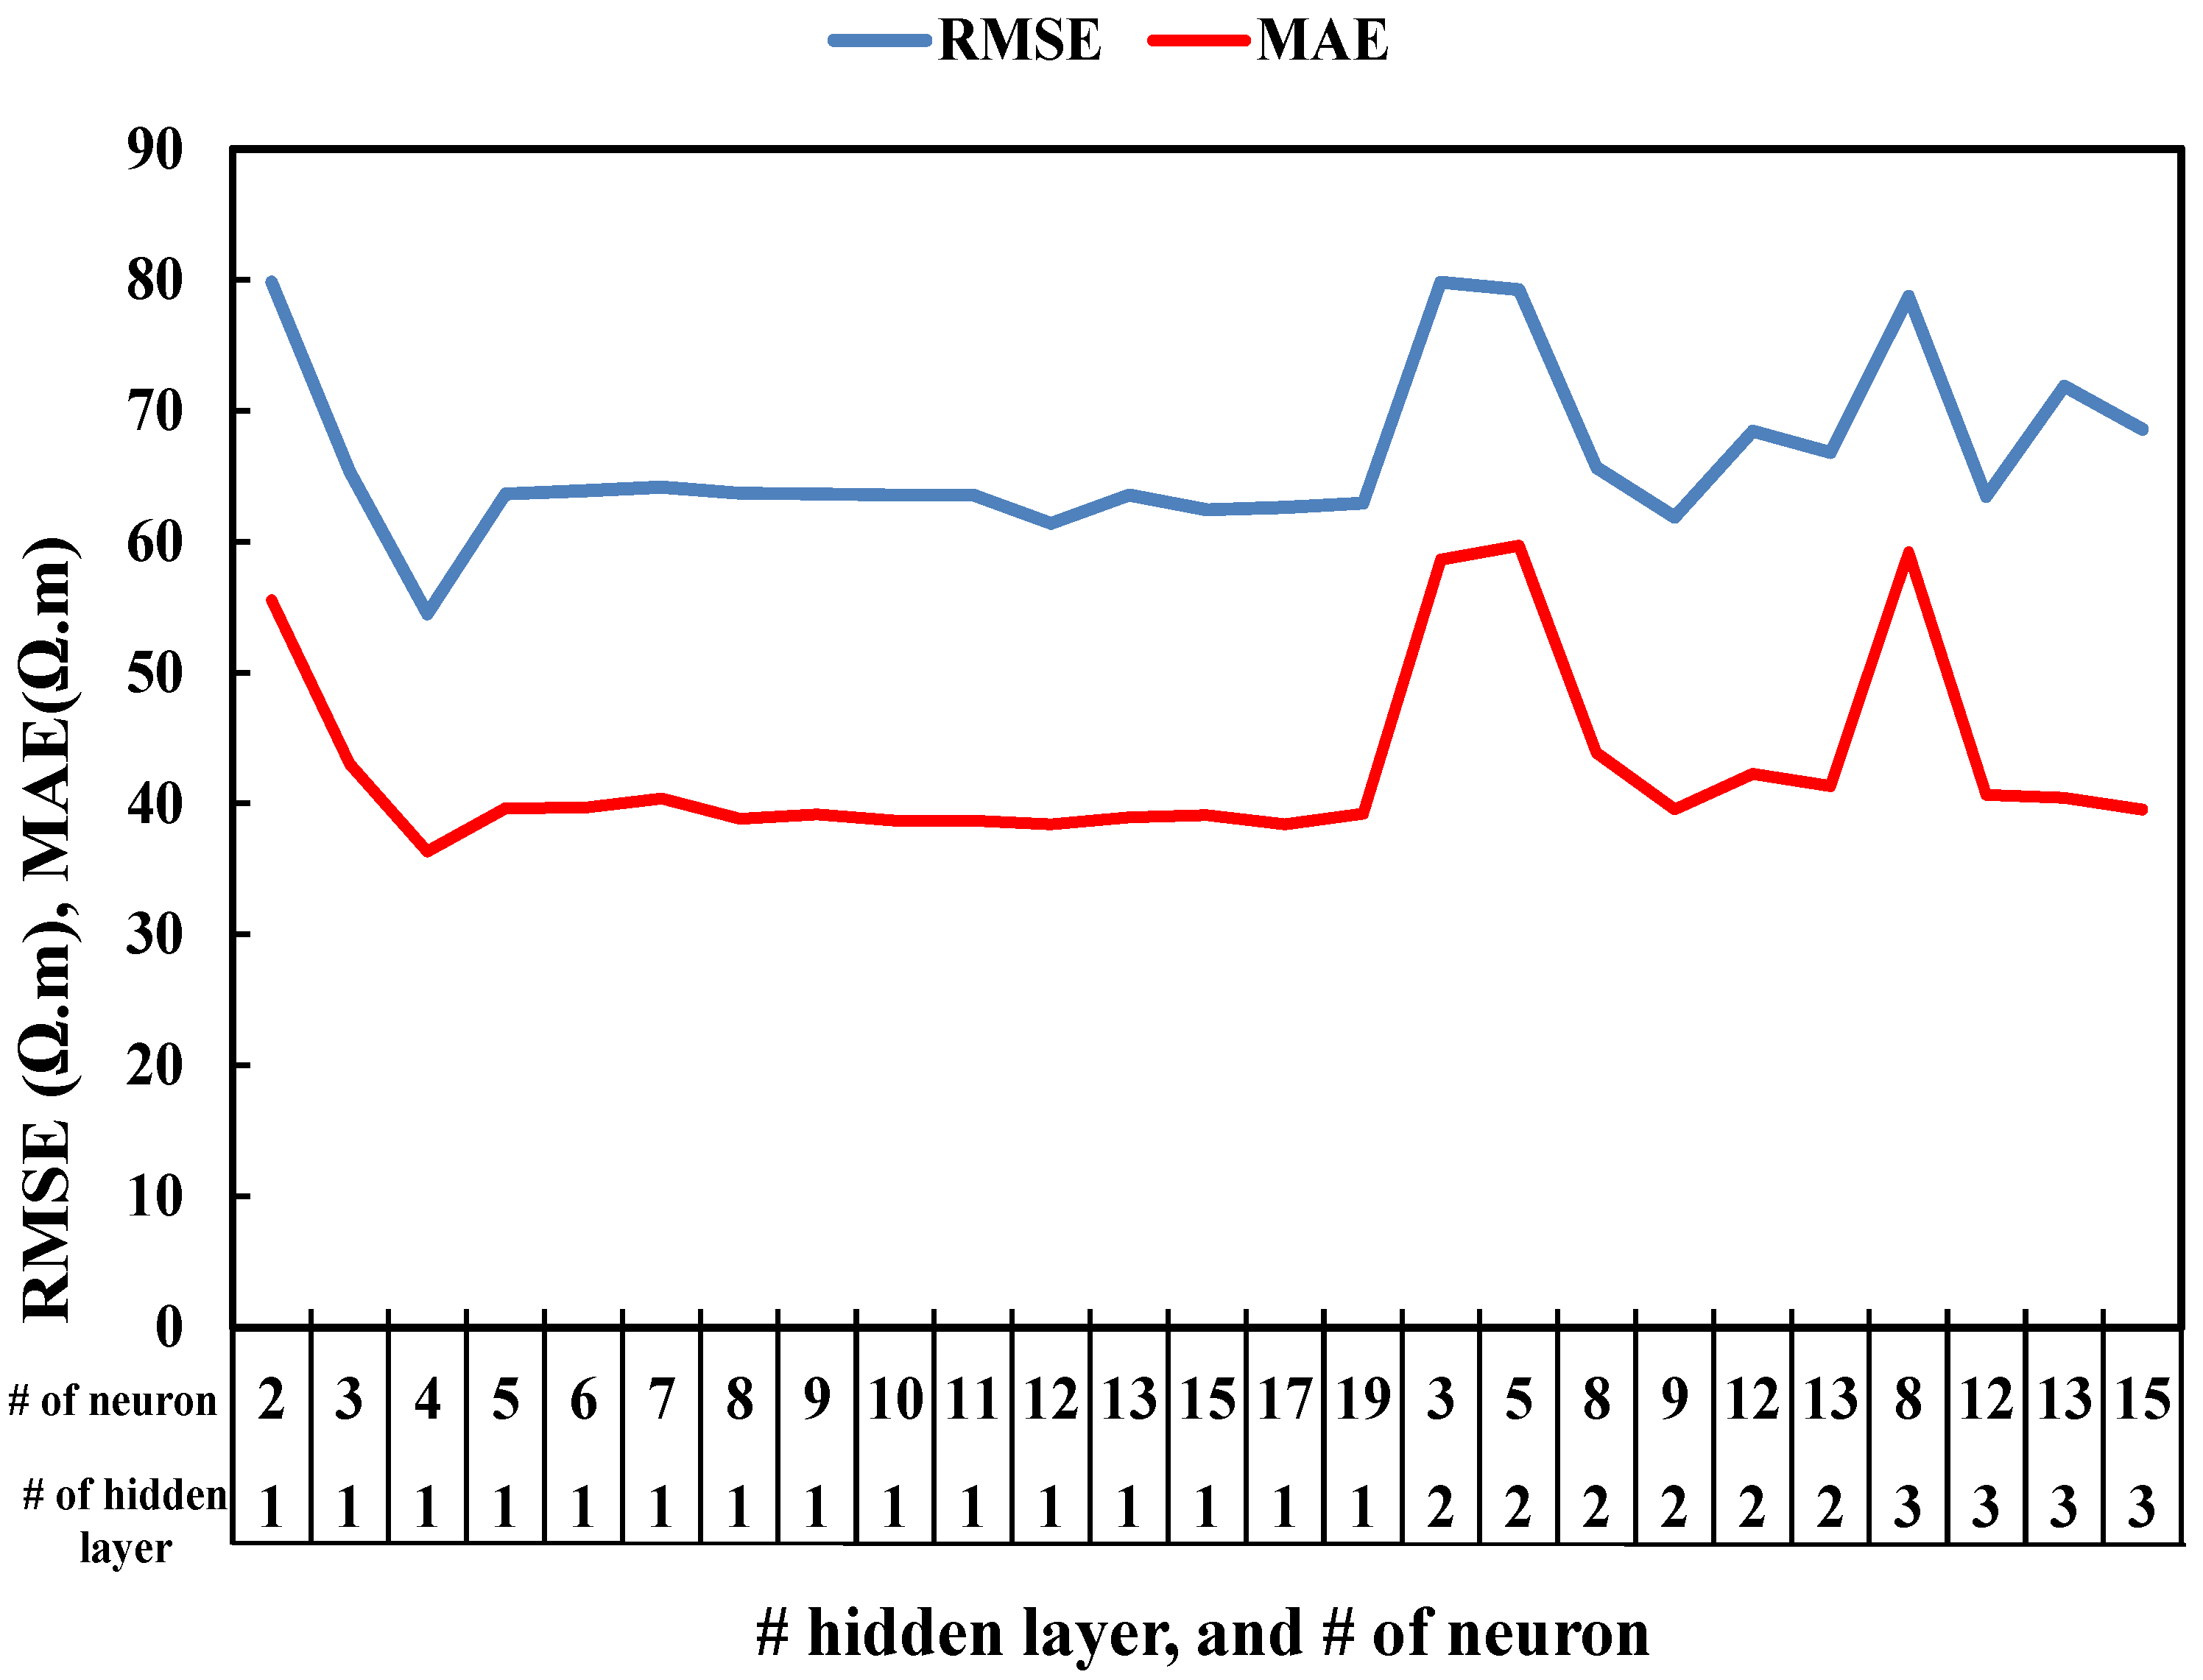
3.2.4. Artificial Neural Network

ANN is a counterpart to the forward neural network feed [48]. It comprises three layer types—the input layer, the output layer, and the hidden layer, which might consist of many layers as seen in Figure 5.
The input layer will receive the input signal to be analyzed. The requisite task, such as forecasting and classification, is conducted by the output layer. The real computational ANN engine is an arbitrary number of hidden layers positioned between the input and output layers. Similar to the feed-forward network in the ANN, the data flows forward from the input to the output layer. The multi hidden layer was given better output performance during trial iterations for choosing the best-hidden layer number for a model to minimize error and increase R2. However, due to a complication of equation of multi hidden layer, the single hidden layer with four neurons was chosen in this study based on trial and error to get minimum RMSE and lowest MAE Figure 6 and higher R2. Equation (5) shows the ANN for one hidden layer.
                                      ( ρ ) = N o d e 1 1 + e β 1 N o d e 2 1 + e β 2 N o d e 3 1 + e β 3 N o d e 4 1 + e β 4 + t h r e s h o l d          
Node1, Node2, Node3, Node4, and threshold can be determined directly from the WEKA software’s neural network machine. The values β1, β2, β3, and β4, can be determined by multiplying the attribution values which were given by software with each variable as shown below.
β 1 = 0.488 w / c   + 0.594 t + 2.01 CNT 2.07
β 2 = 1.288 w / c   1.287 t + 12.52 CNT + 14.4
β 3 = 2.02 w / c   1.49 t + 0.48 CNT 0.207
β 4 = 2.11 w / c   1.76 t 1.16 CNT 5.04

3.3. Assessment Criteria for Models

Various output parameters, including the R2, RMSE, MAE, SI, and OBJ which are specified, have been used to test and evaluate the efficiency of the suggested models.
R 2 = (   i ( x i x ¯ ) ( y i y ¯ ) i ( x i x ¯ ) 2 i ( y i y ¯ ) 2 ) 2
R M S E = i = 1 n ( y i x i ) 2 n            
M A E = i = 1 n ( y i x i ) 2 n      
S I = R M S E y i  
O B J = ( n t r n a l l R M S E t r + M A E t r R t r 2 + 1 ) + ( n t s t n a l l R M S E t s t + M A E t s t R t s t 2 + 1 )      
where y i   = experimental value; x i   = predicted value by the proposed model; y ¯ = the average value of experimental values; x ¯ = average of the predicted value; and n is the number of data points.

4. Analysis and Output

4.1. Predicted and Measured Electrical Resistivity Relationships

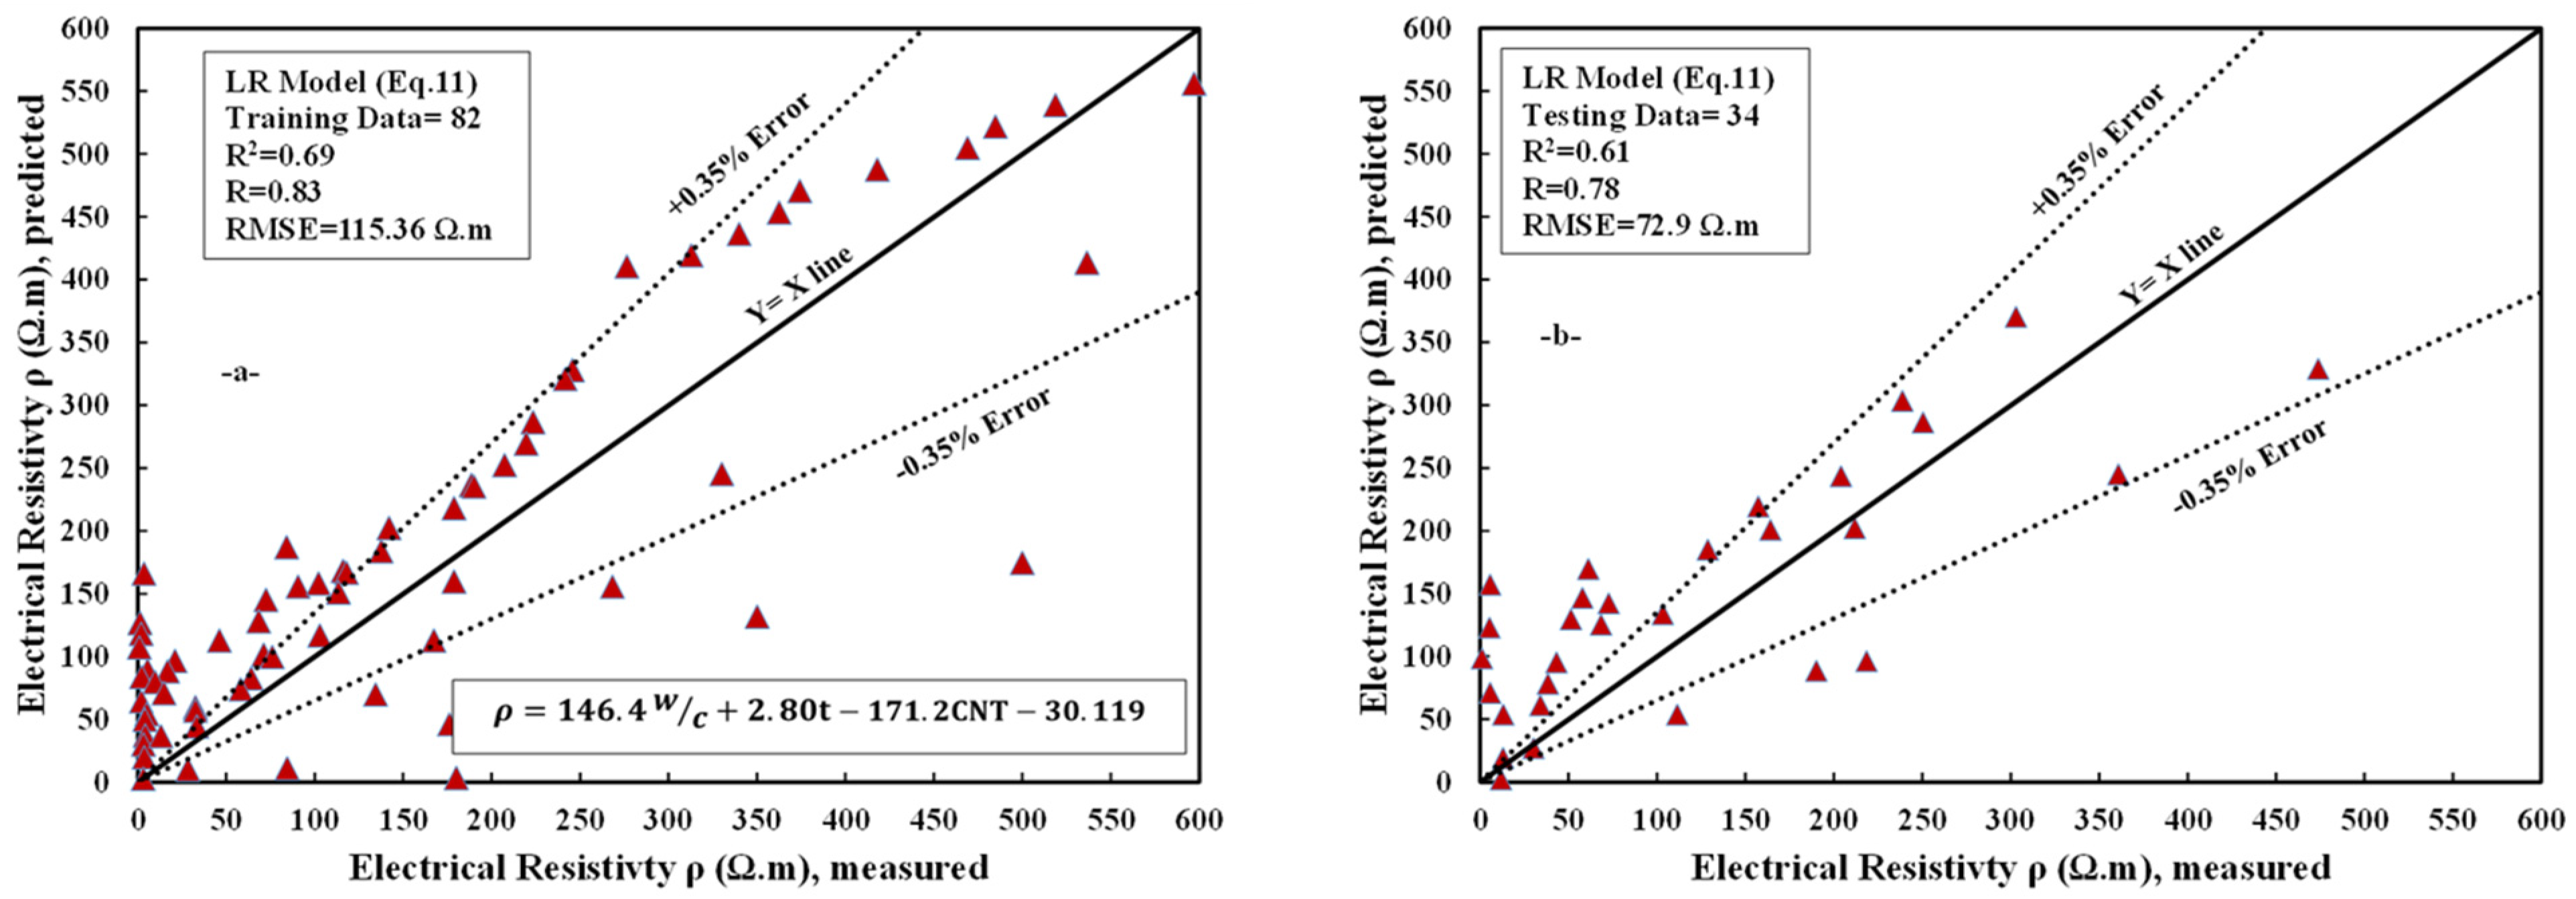
4.1.1. Linear Regression Model

The correlation between the calculated and experimental electrical resistivity of cement paste mixtures adjusted with CNTs for training and testing datasets is seen in Figure 7. Model parameters have shown that the w/c ratio material substantially affects the electrical resistivity of cement paste modified with CNTs. This is due to a low water to cement ratio because the electrical resistivity increases by decreasing the w/c ratio [49]. For the current model, each parameter’s weight was calculated by minimizing the sum of the error squares and the least square formula used by the Excel software to identify the optimal weight (a certain value, minimum or maximum) for the equation in a cell called the objective cell. The equation for the LR model with different weight parameters can be written as follow Equation (11)
( ρ ) = 146.4 w c + 2.80 t 171.2 CNT 30.119
where w c is water to cement ratio, t is a curing time (days), and CNT is a carbon nanotube in (wt % of cement).
As shown by the equation above, carbon nanotubes have a greater effect in lowering electrical resistance. At the same time, w/c is the second factor that influences the increment of electrical resistivity. Statistical evaluation for this model, such as R2, RMSE, and MAE for the training dataset, is 0.69, 115.37, and 77.43 Ω.m, respectively Figure 7. In addition, the scatter index for this model is 0.725 for the training dataset.

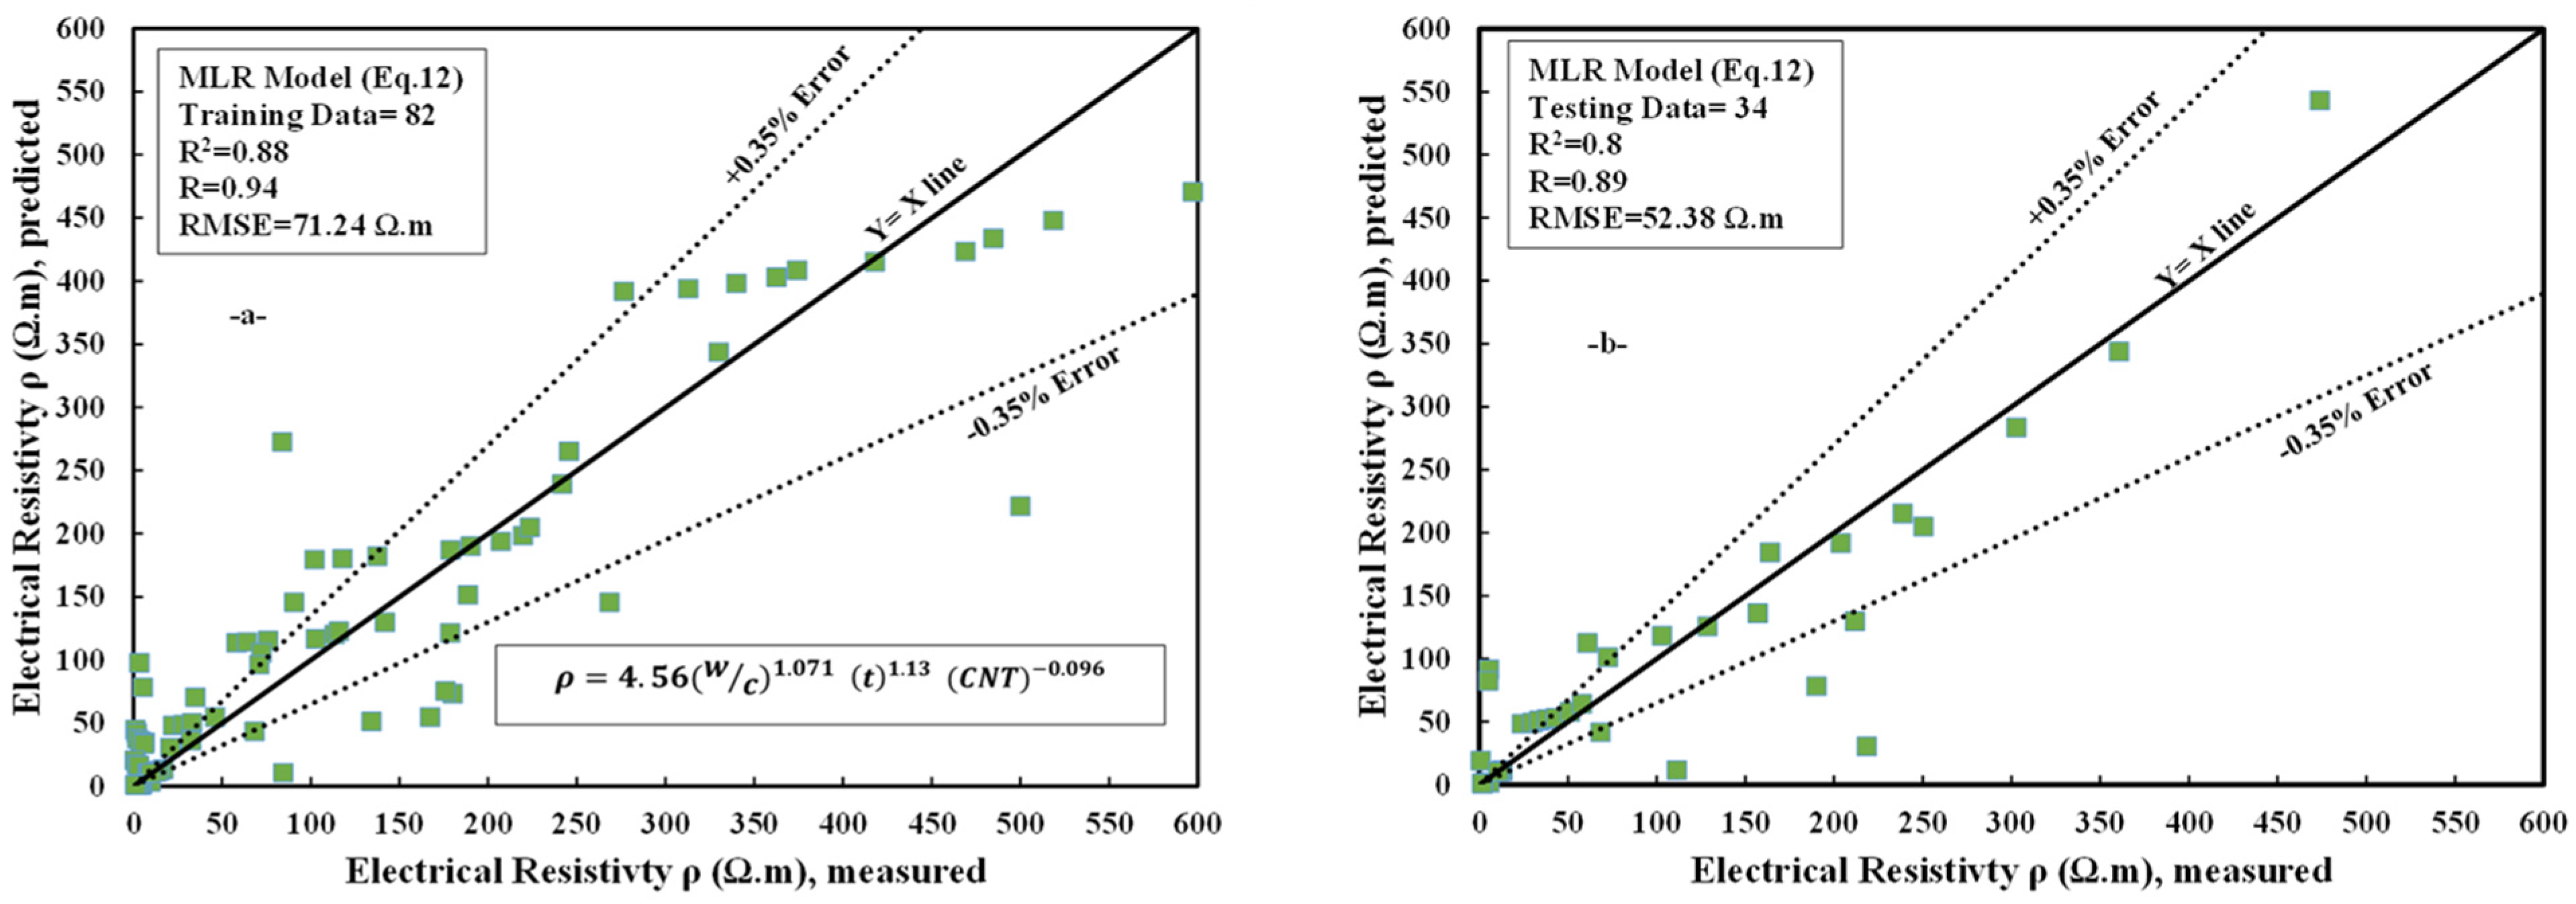
4.1.2. Multi Logistic Regression Model

The relation between calculated versus actual electrical resistivity of cement paste mixtures adjusted with CNT for training and test datasets is seen in Figure 8. Similar to other models, the most influential parameter affecting the electrical resistivity of cement paste is the CNTs that significantly decrease the value of electrical resistivity. In addition, the second parameter that directly affects the value of electrical resistivity is curing time. When the curing time is increased, the electrical resistivity is increased accordingly. The formula developed for the MLR model with different variable parameters can be written as
( ρ ) = 4.56 ( w c ) 1.071   t 1.13   CNT 0.096
The evaluation parameters for this model, such as R2, RMSE, and MAE, are 0.88, 71.24, and 44.79 Ω.m, respectively. Moreover, the SI values for the current model are 0.45 for the training dataset.

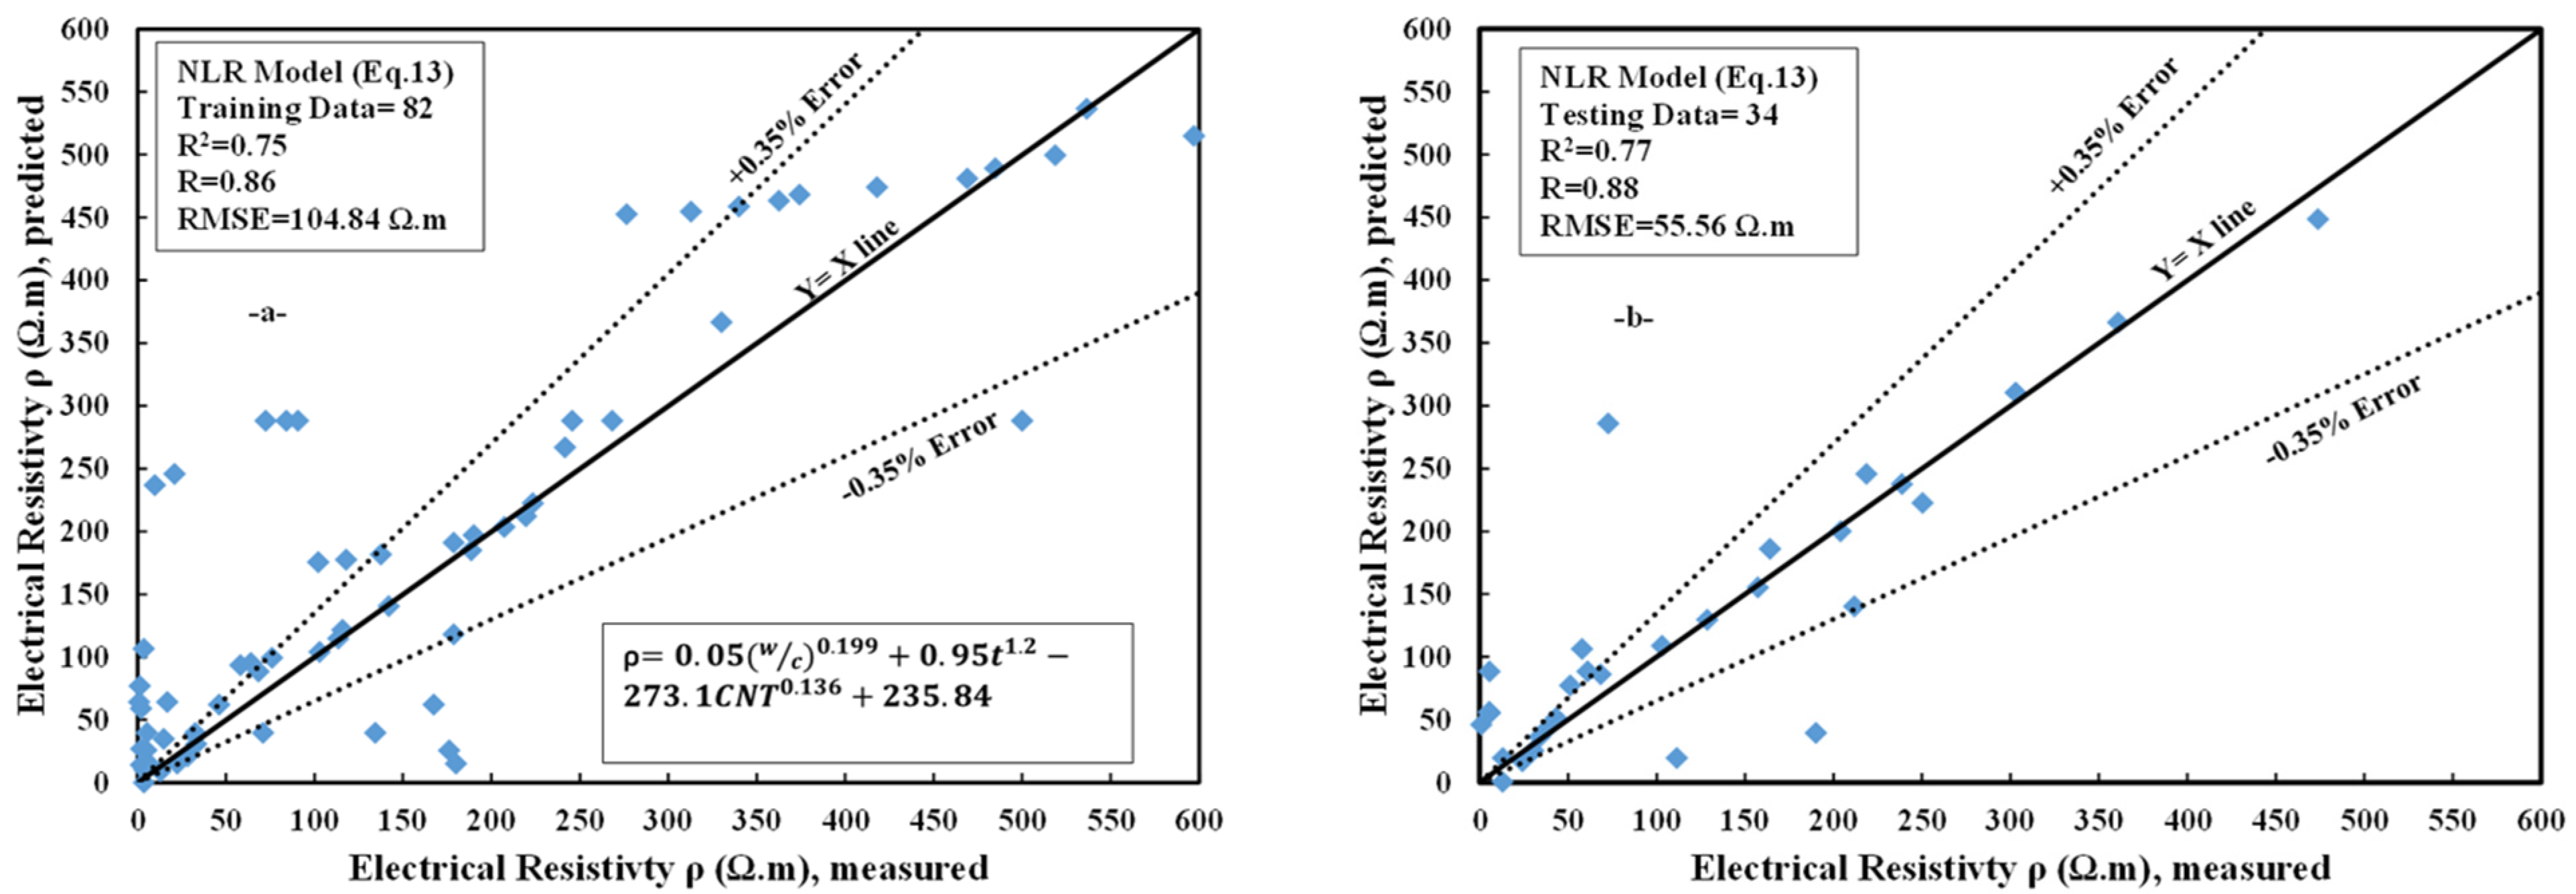
4.1.3. Nonlinear Regression Model

The relation between calculated versus experimental electrical resistivity from cement paste mixtures adjusted with CNTs for training and test datasets is seen in Figure 9. The model parameters indicate that the curing time significantly increases the electrical resistivity of CNTs in cement. The second parameter that directly affects the value of electrical resistivity is curing time; when the curing time increases, the electrical resistivity is increased accordingly. The formula developed for the NLR model with different variable parameters can be written as follows (Equation (13))
( ρ ) = 0.05 ( w c ) 0.199 + 0.95 t 1.2 273.1 C N T 0.136 + 235.84
The evaluation parameters for this model—such as R2, RMSE, and MAE—are 0.75, 104.84, and 62.45 Ω.m, respectively. Moreover, the SI values for the current model are 0.659 for the training dataset.

4.1.4. Artificial Neural Network Model

To predict the electrical resistivity values for the right input parameters, the network was given the training data set as well as the test data (Figure 10). The creation of the ANN model is a trial and error process (such as the number of hidden layer neurons, number of hidden layers, momentum, learning rate, and iteration). The number of hidden layers used in this study is one hidden layer with four neurons, the learning rate = 0.1, momentum = 0.1, and training time = 50,000. Furthermore, the number of epochs is a hyperparameter that specifies how many times the learning algorithm can process the entire training dataset. The higher epochs number will give higher R2, lower RMSE value, and lower MAE value because it will reduce the error. The predicted electrical resistivity vs. actual is shown in Figure 10, which indicates the main idea of generating data based on the ANN model.
The evaluation parameters for this model, such as R2, RMSE, and MAE, are 0.93, 54.48, and 36.37 Ω.m, respectively. Moreover, the SI values for the current model Equation (14) are 0.34 for the training dataset.
ρ = 0.659 1 + e β 1 4.81 1 + e β 2 1.02 1 + e β 3   4.216 1 + e β 4 + 4.85

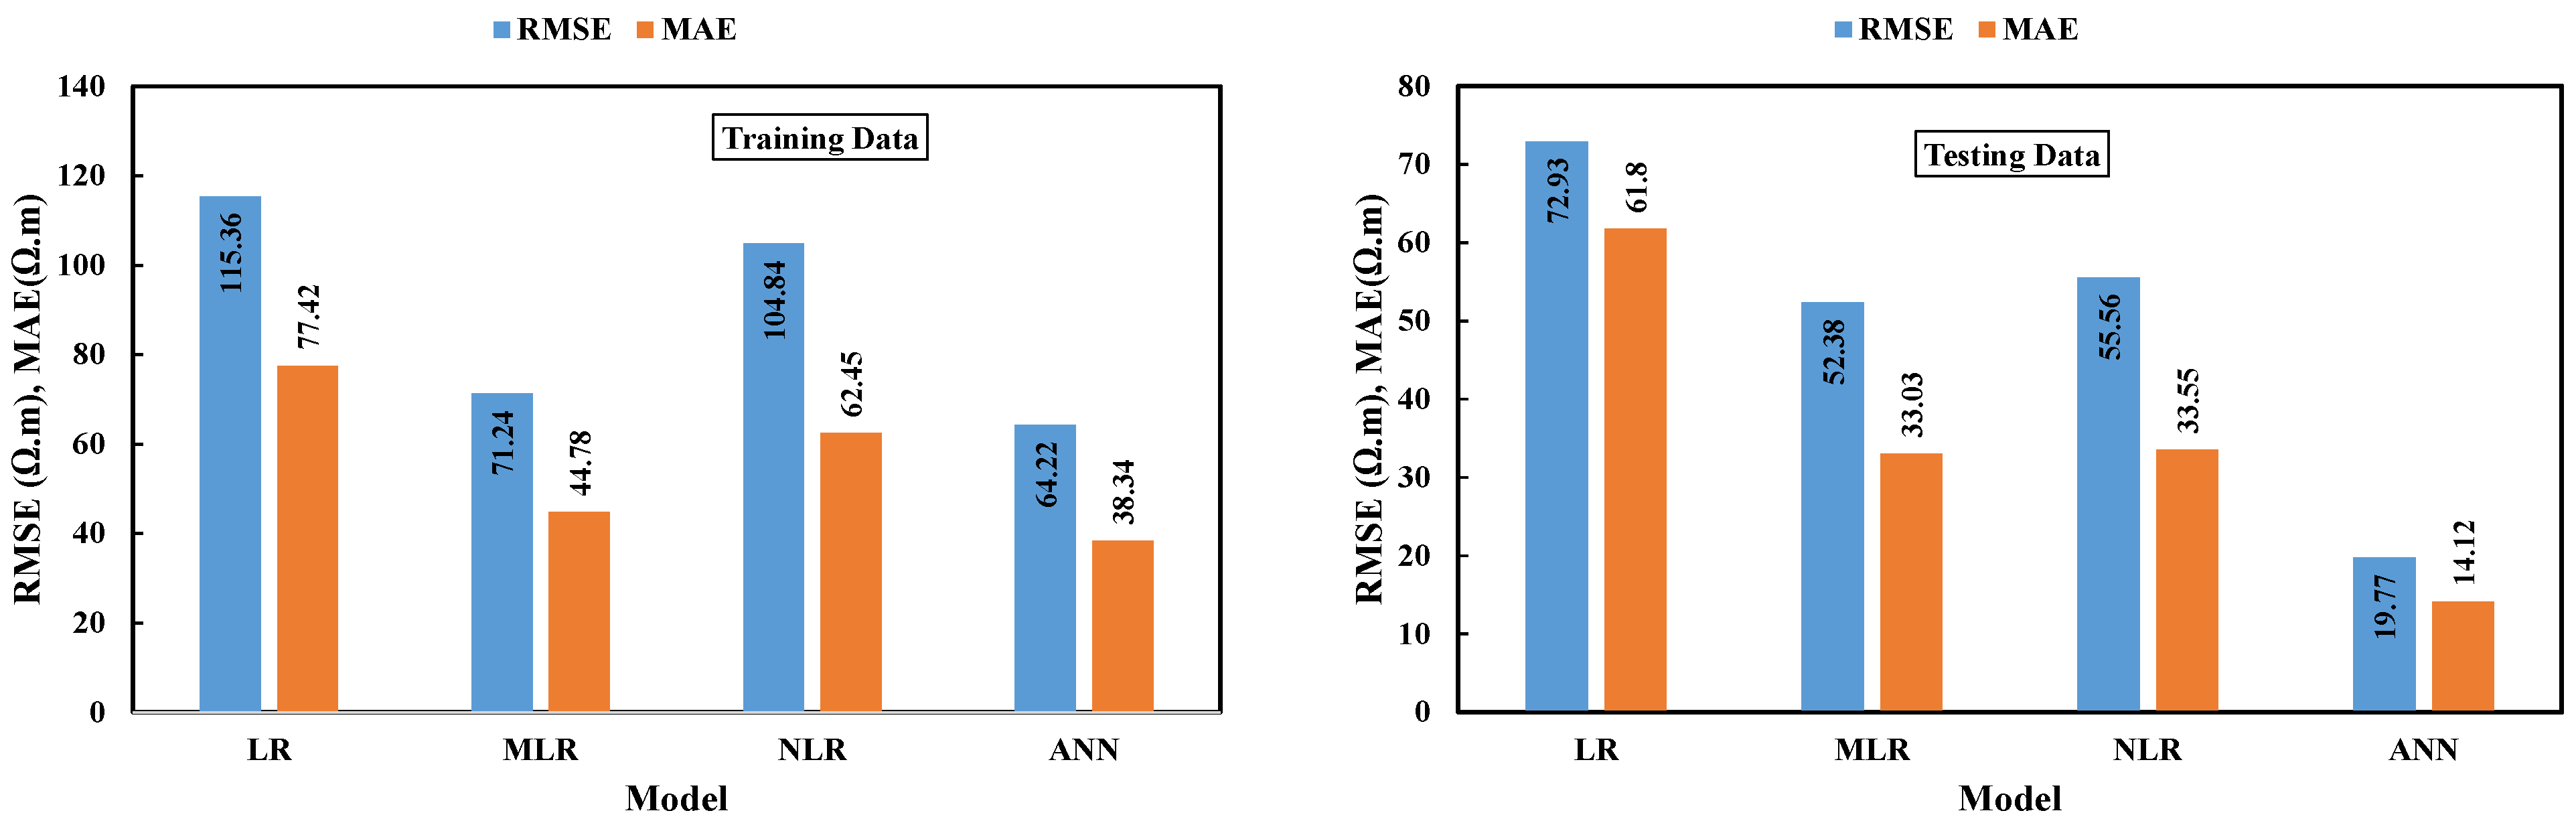
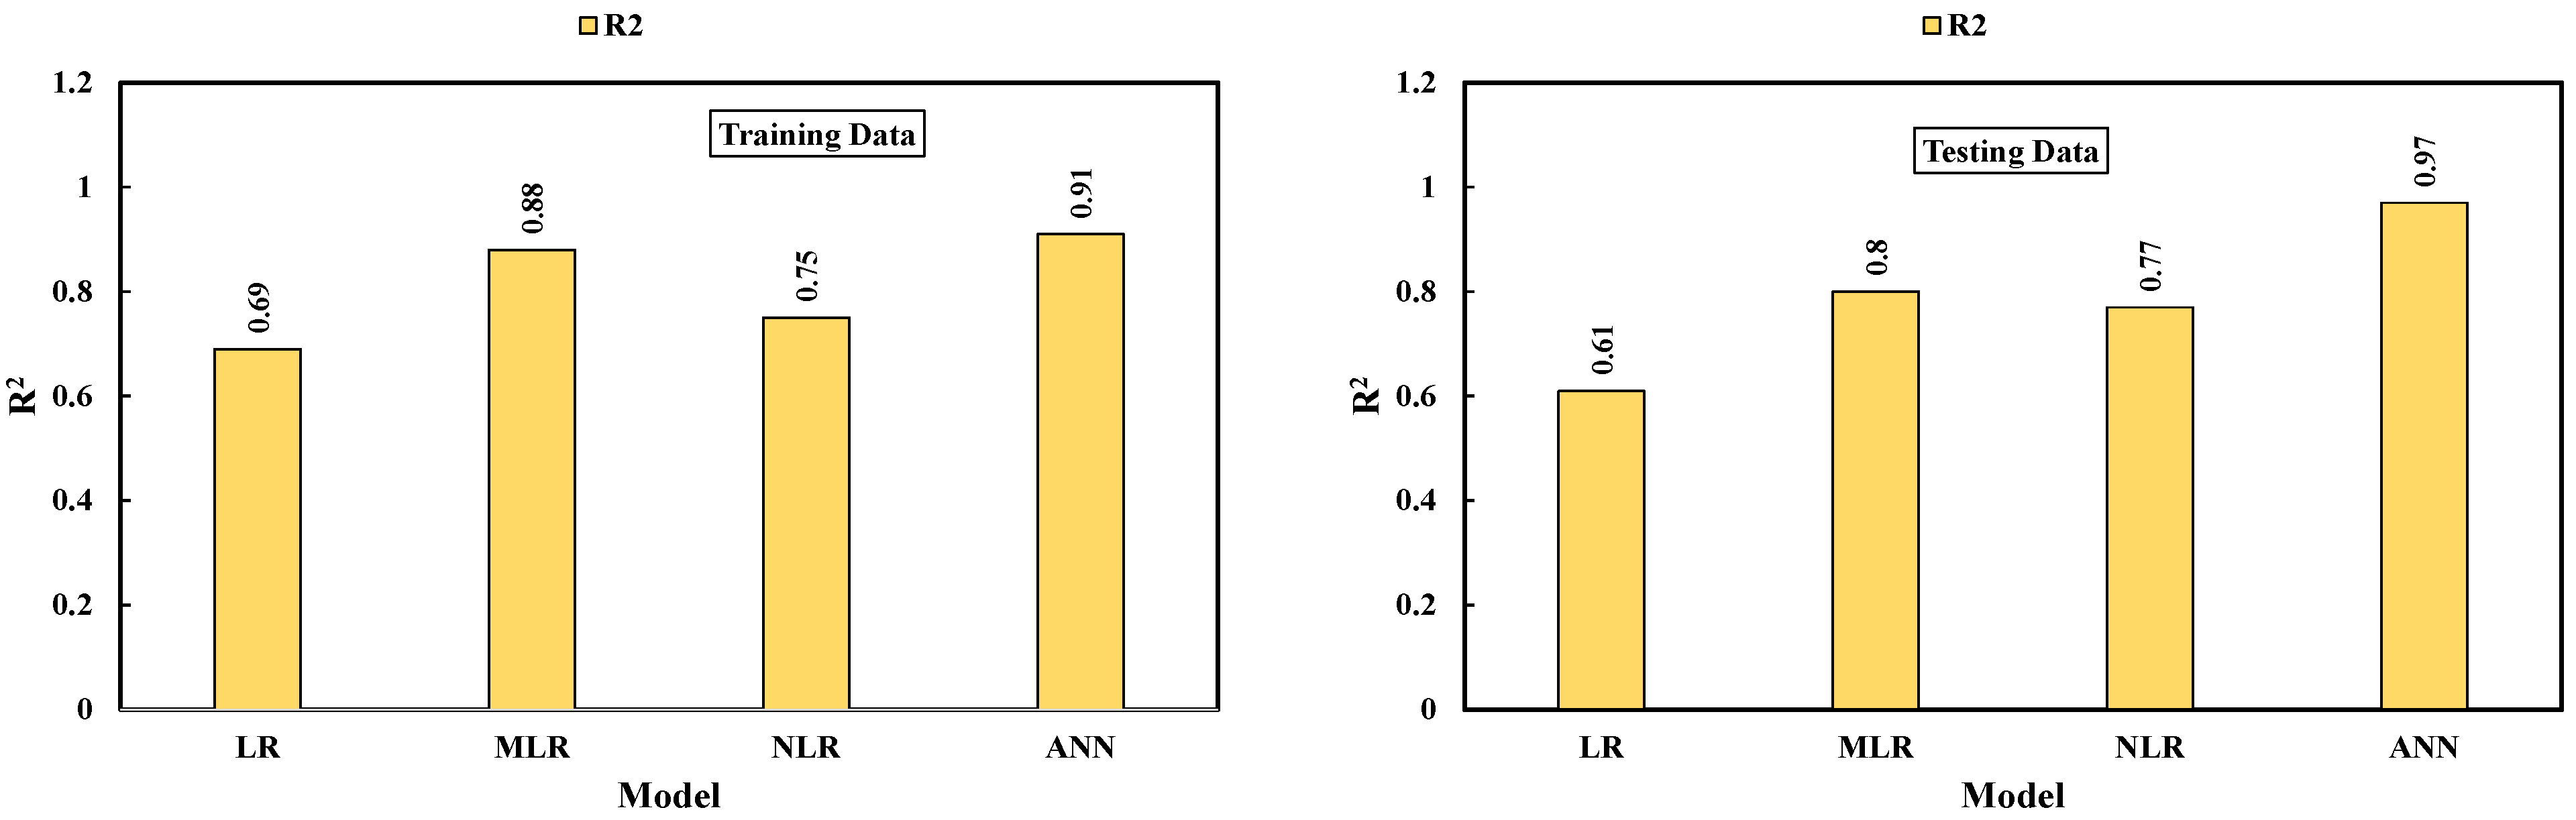
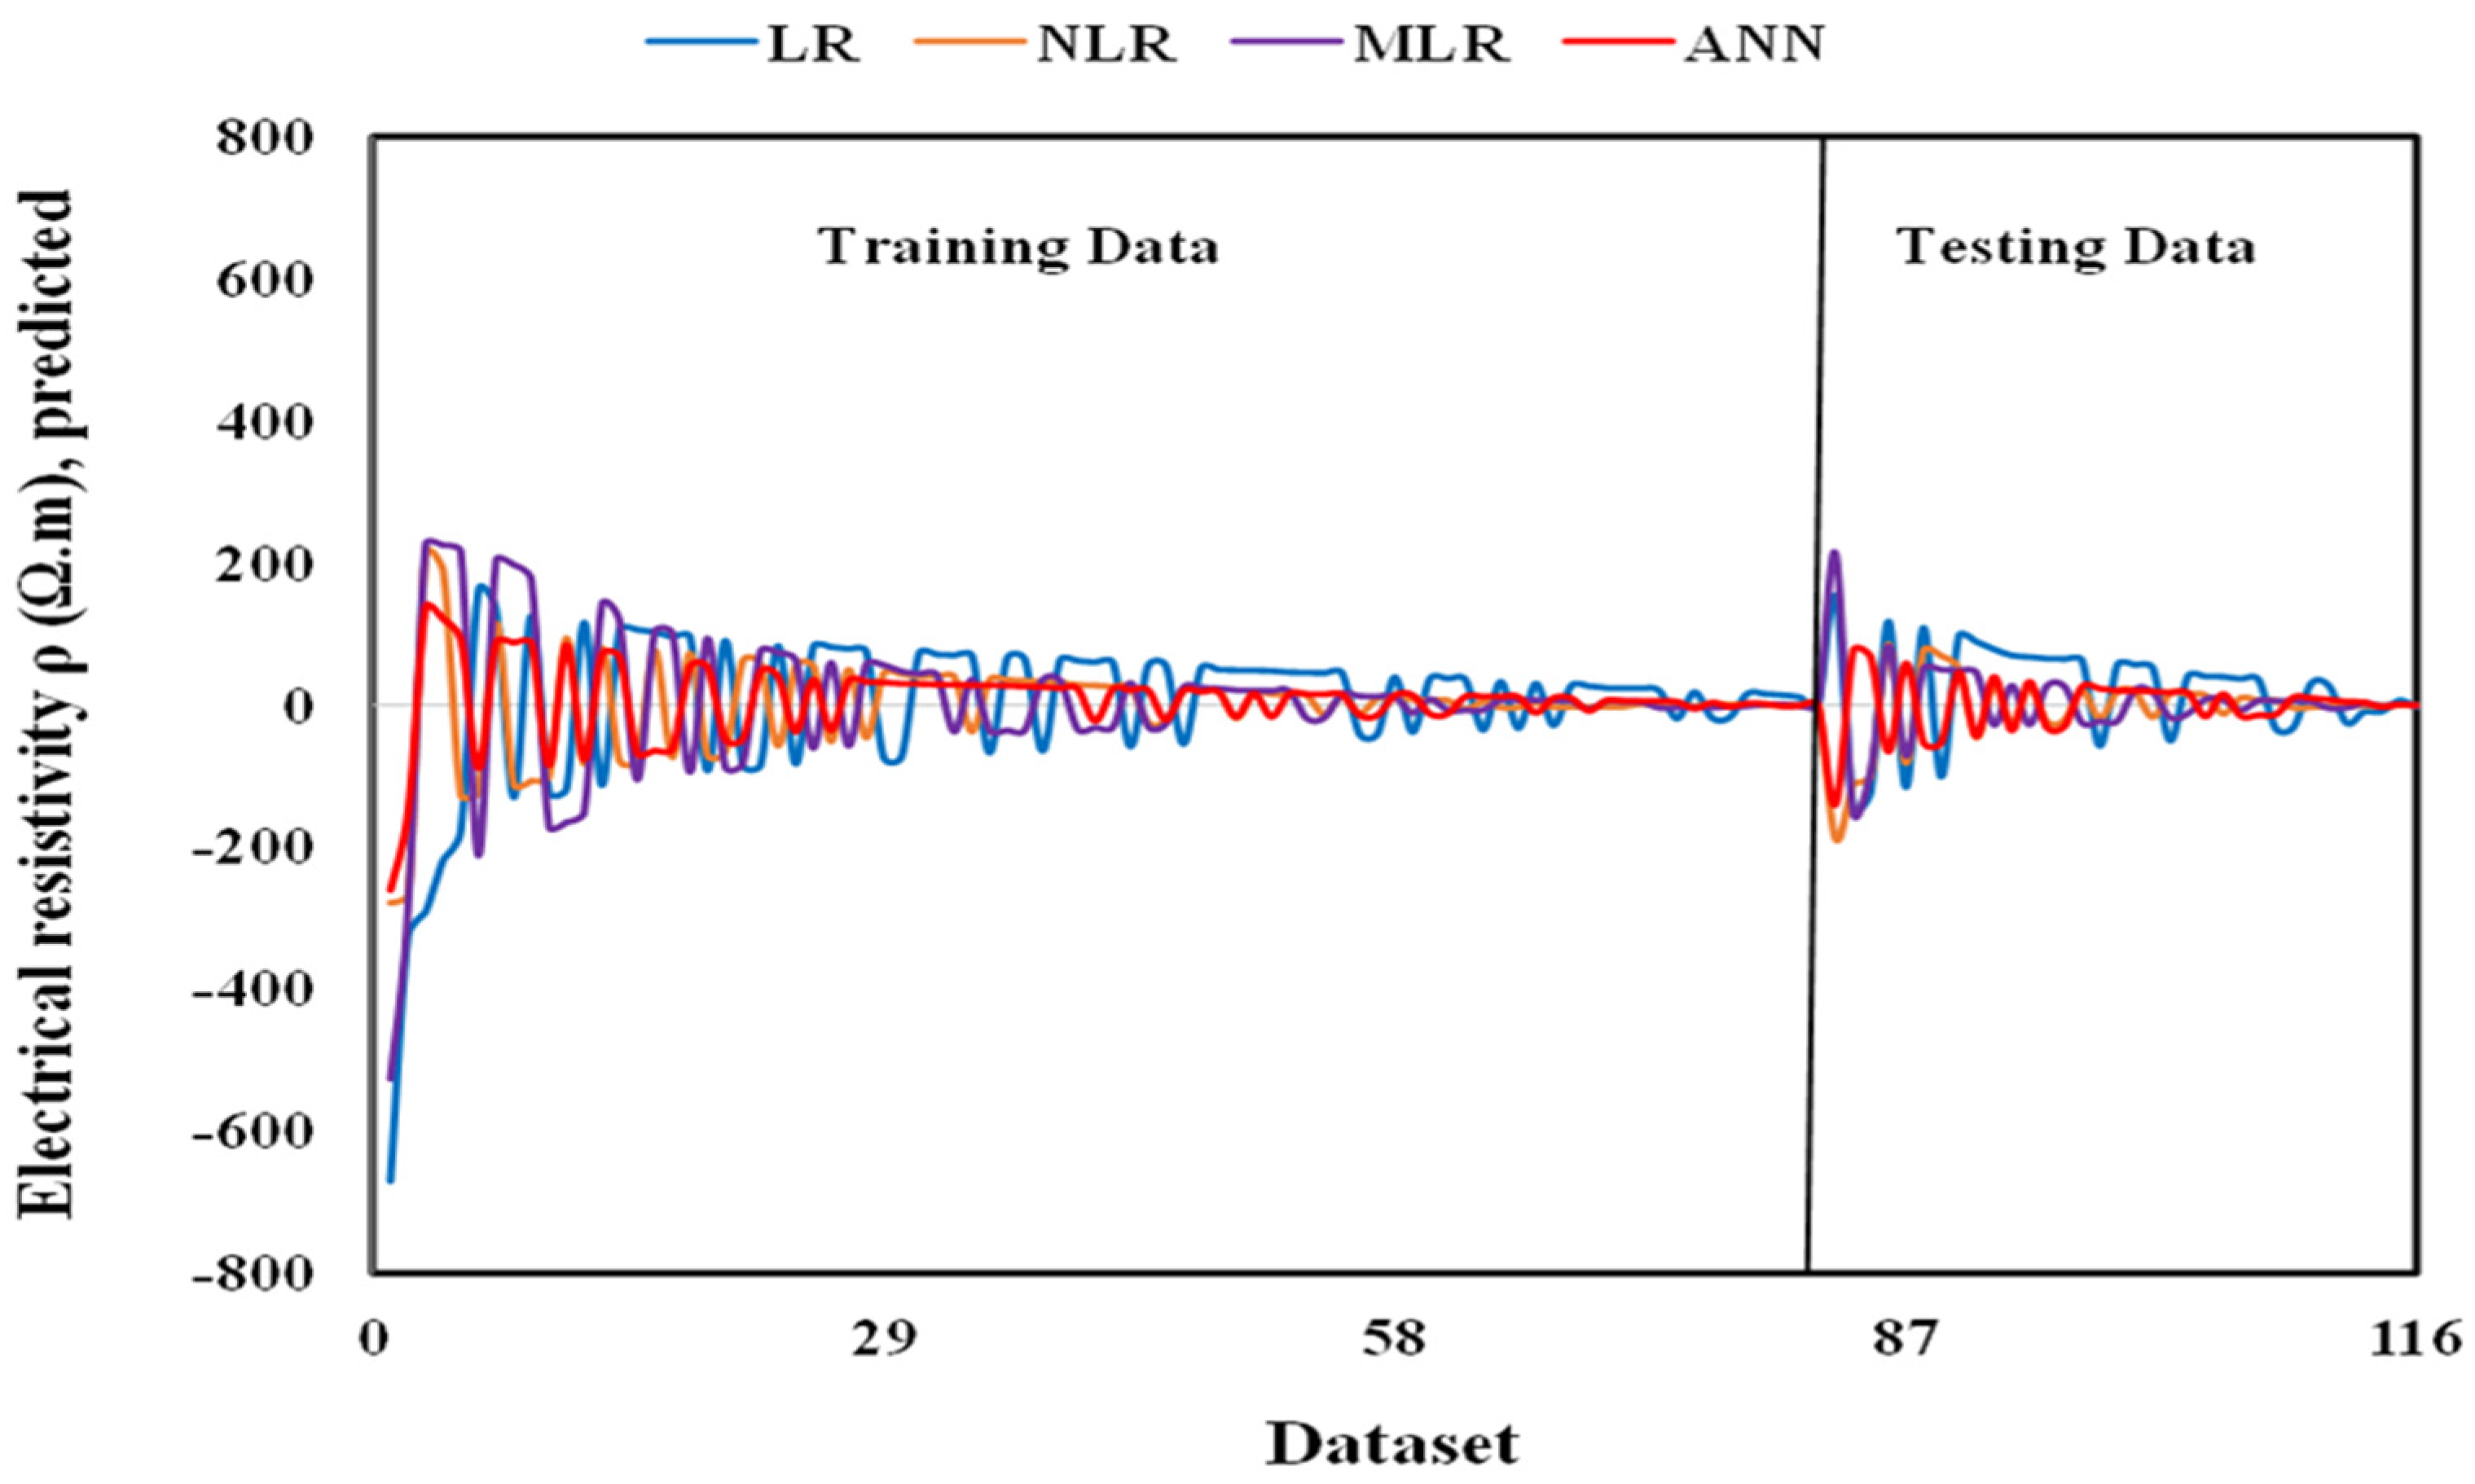
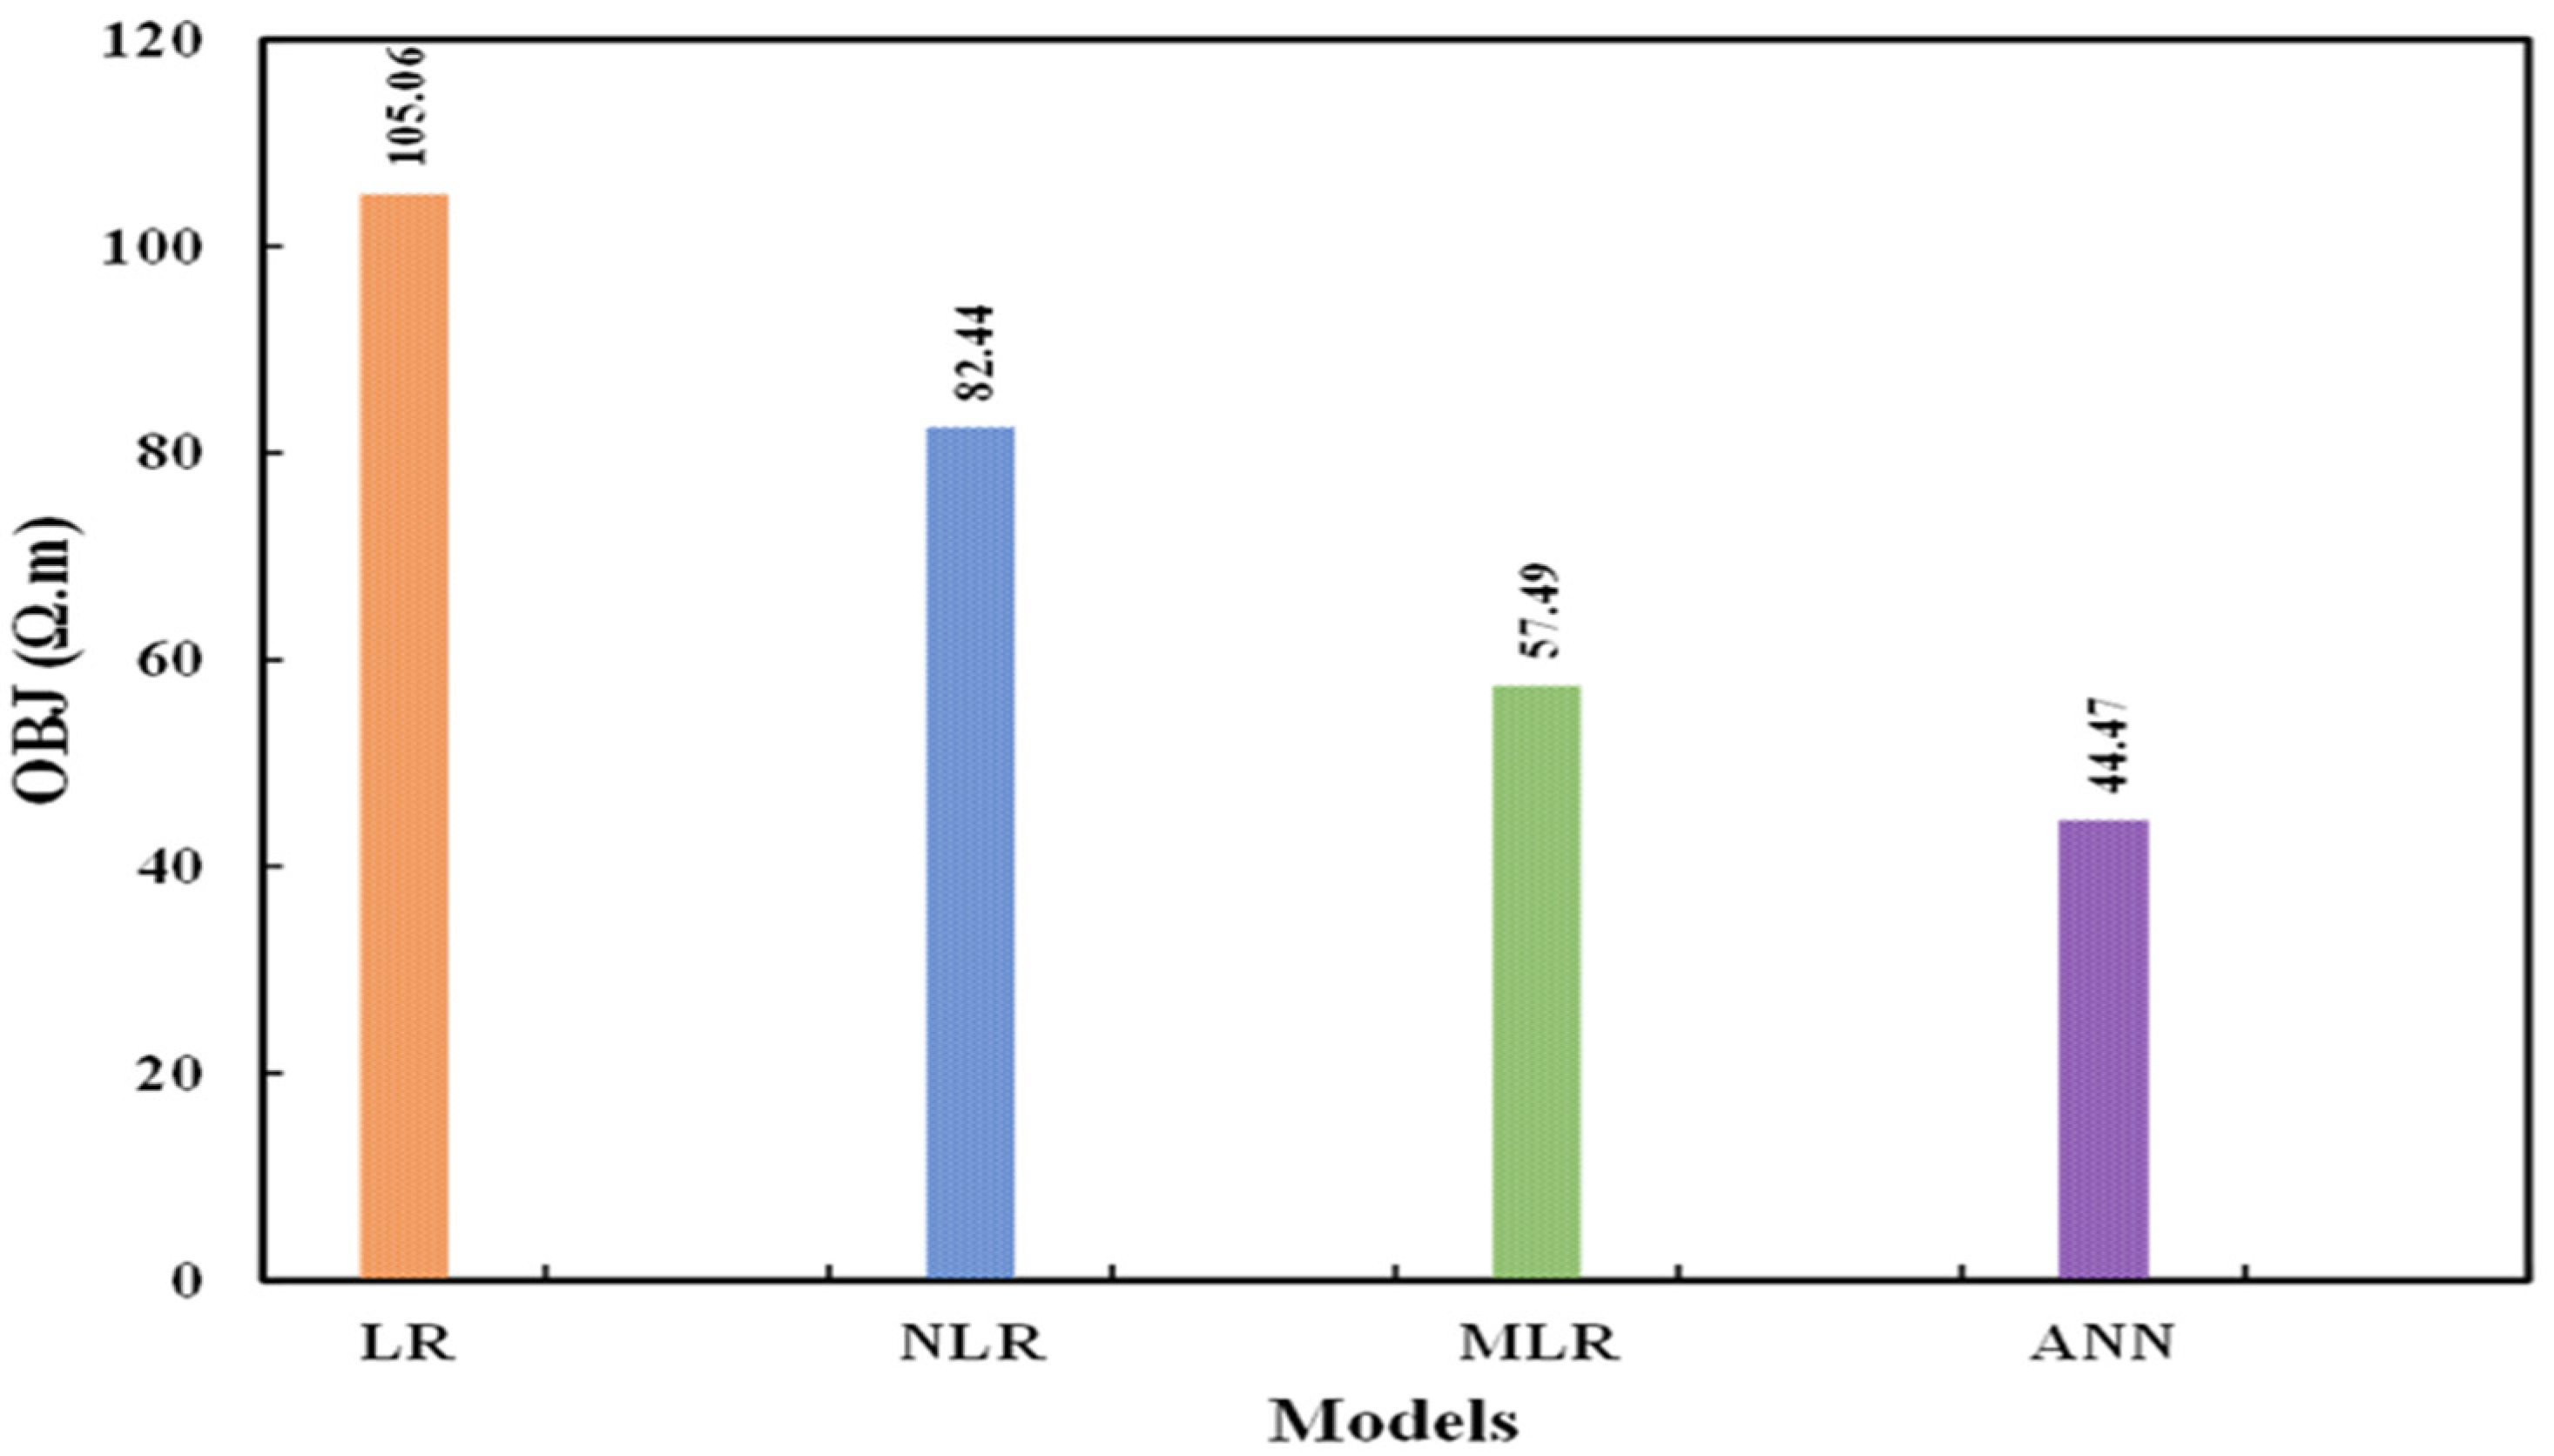
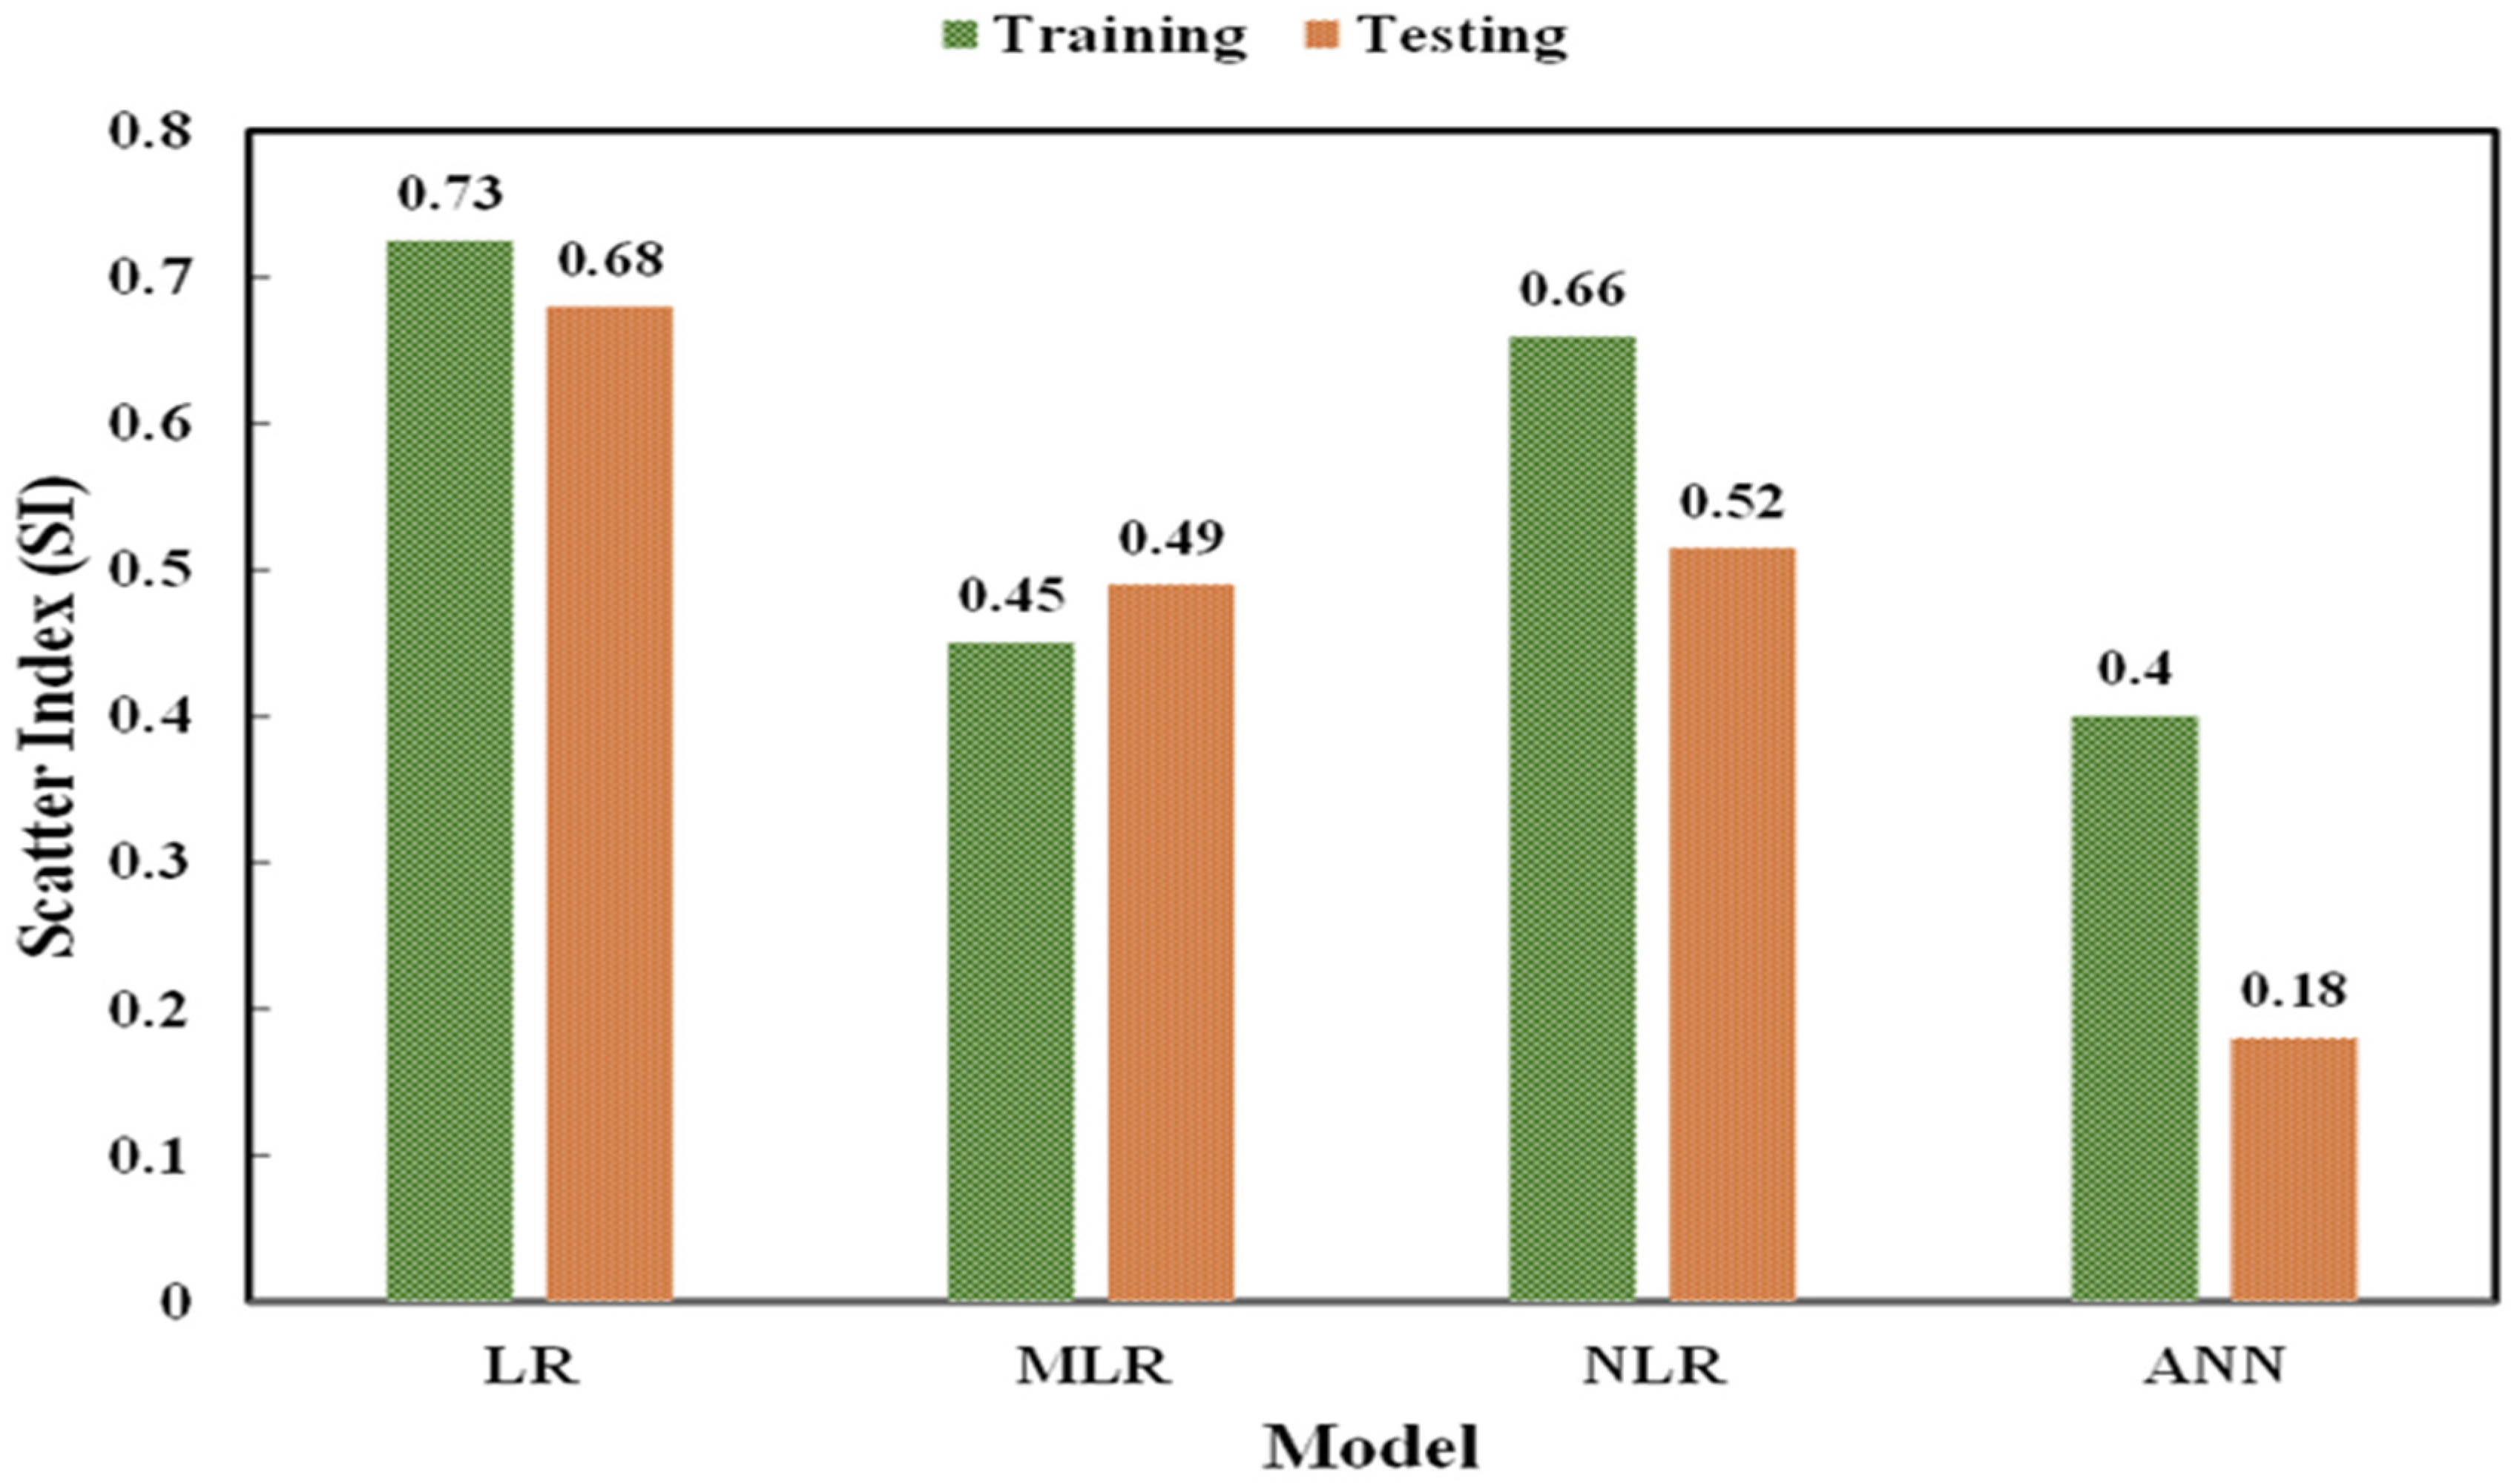
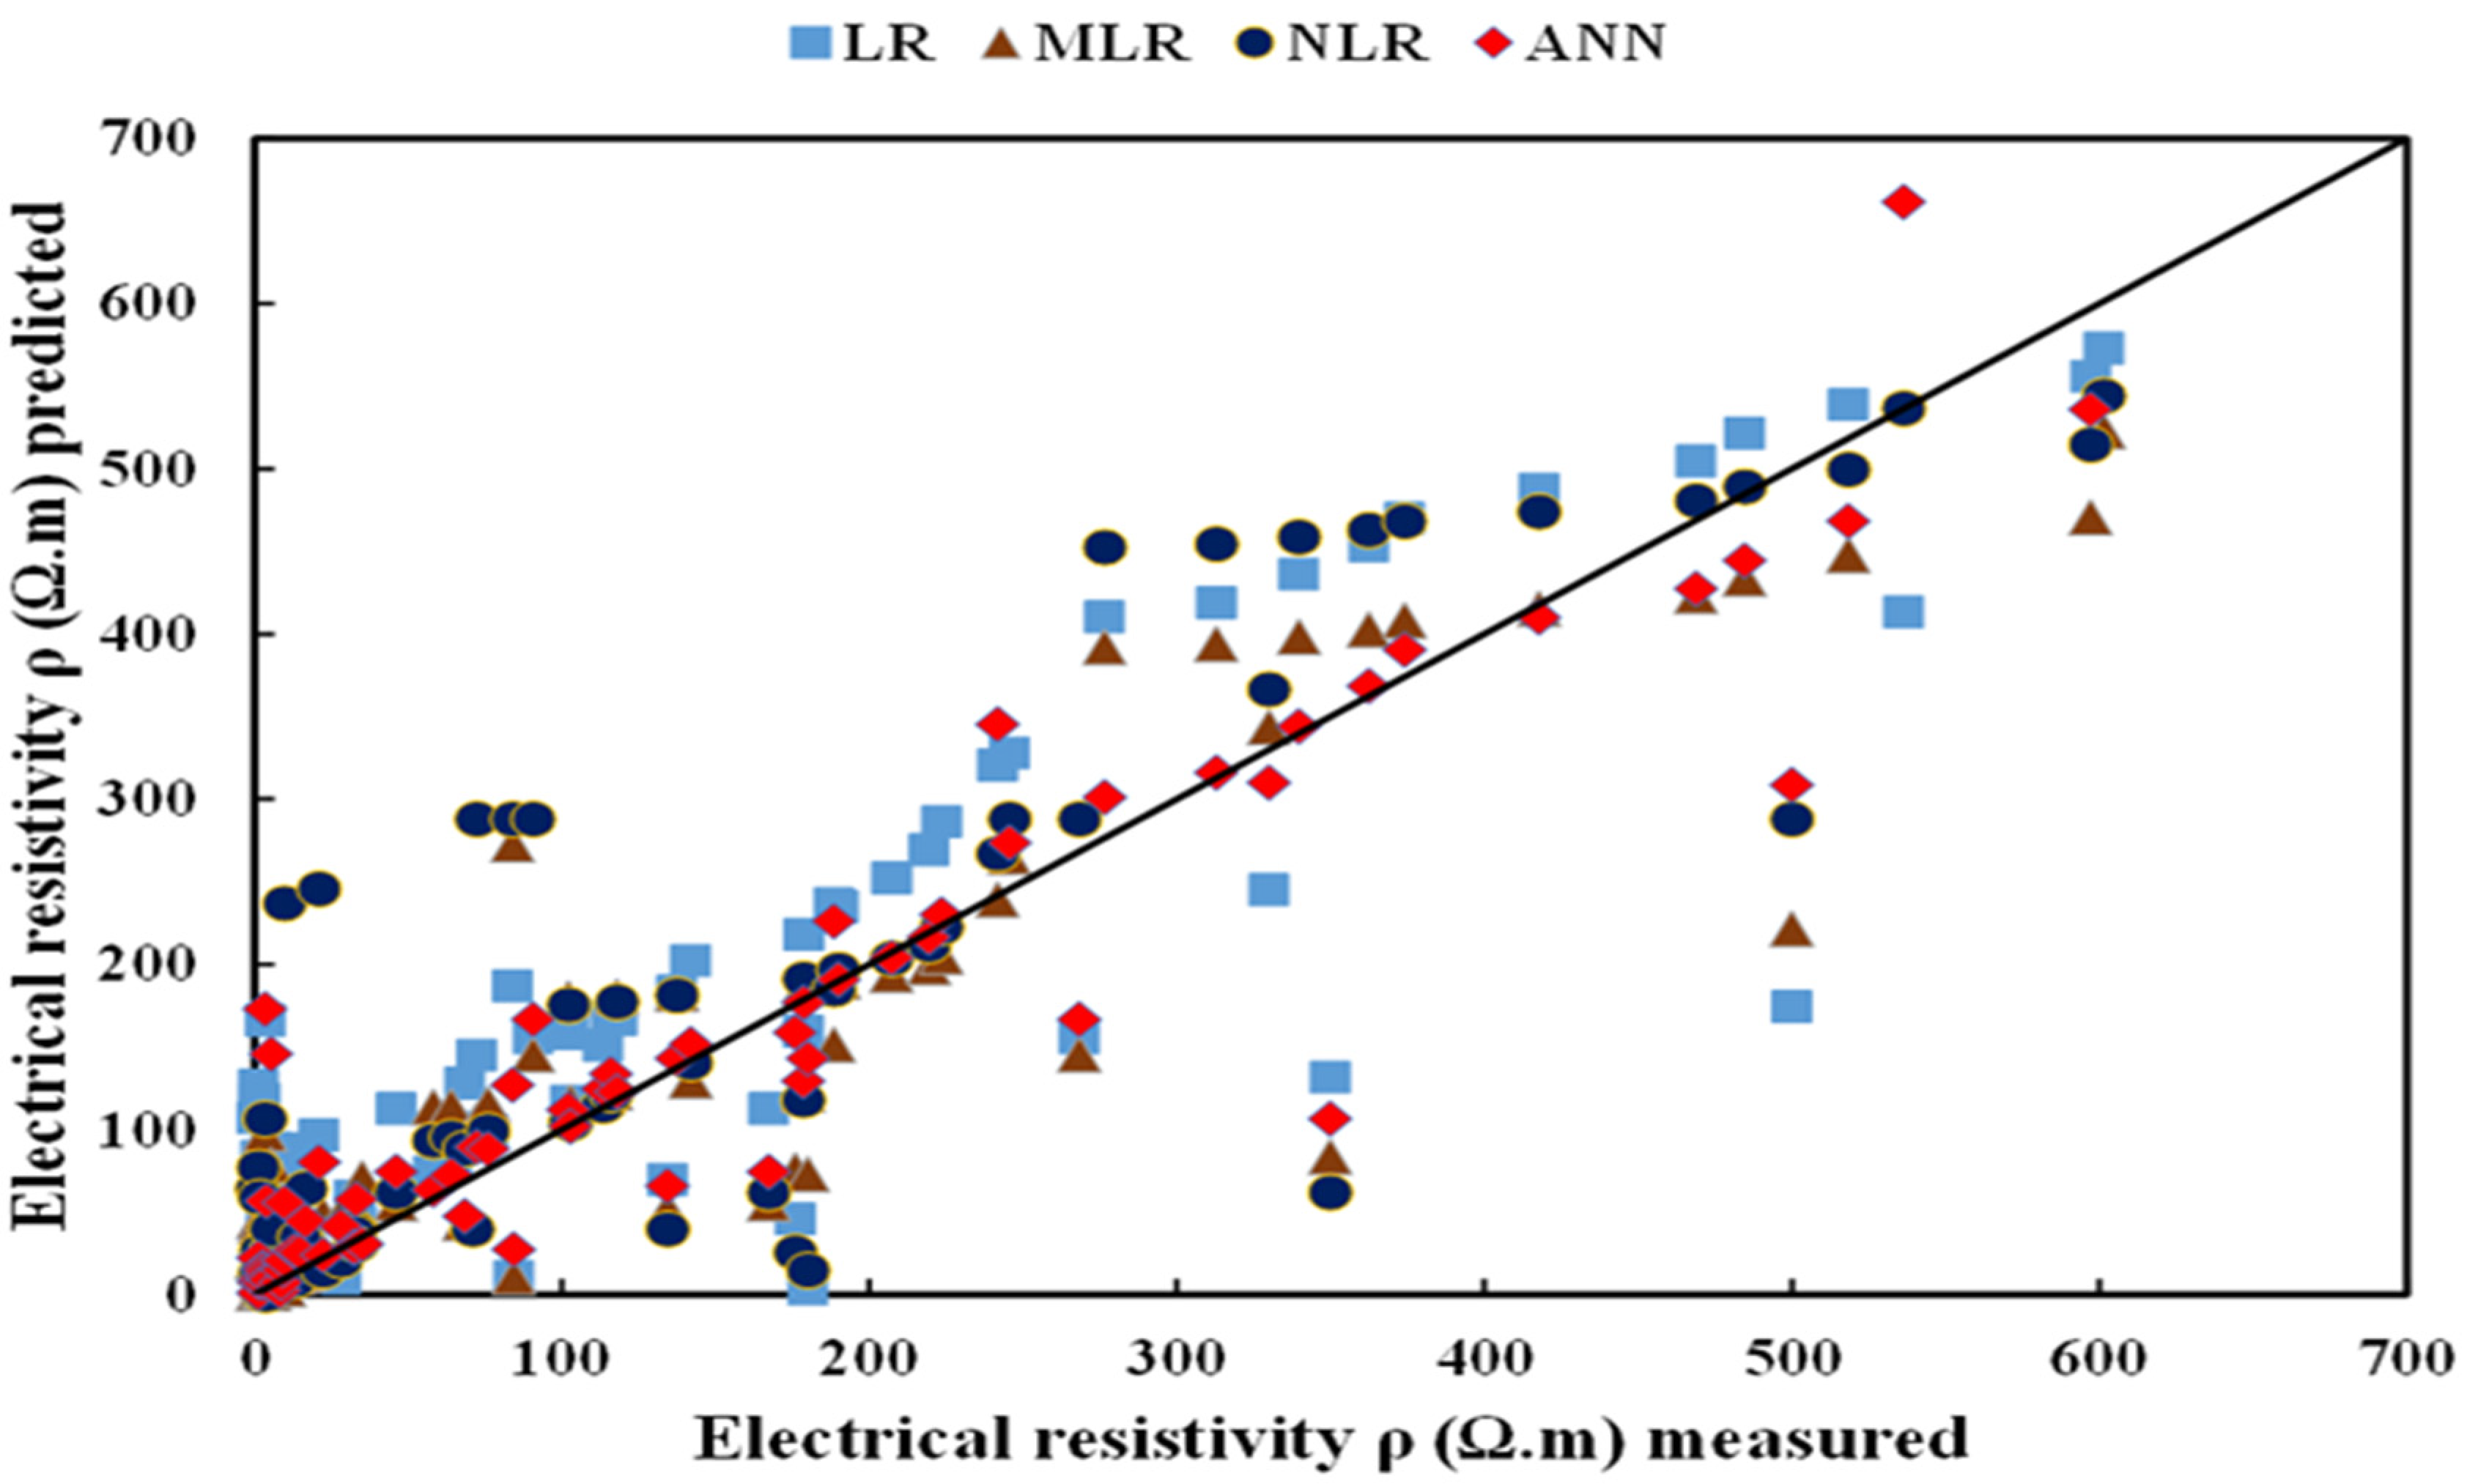
4.1.5. Comparison between Different Models

As described above, five separate statistical parameters, RMSE, MAE, SI, R2, and OBJ, have been placed to determine the efficacy of the proposed models. Figure 11 provides a comparison of the models based on RMSE and MAE, and Figure 12 indicates R2 for training and testing dataset of cement paste modified with CNTs. Among the four main models, the ANN model has higher R2 value and lower RMSE and MAE values relative to the LR, MLR, and NLR models, the previous study also used the ANN model for predicting compressive strength of cement mortar with R2 value slightly less than achieved from this study and the RMSE and MAE values are greater than this study results [50]. Another research used ANN model to predict the mechanical properties such as compressive strength of concrete modified with carbon nanotube which get R2 value slightly higher than achieved from this study and this might be due to the high data numbers used in this study [51]. In addition, Figure 13 indicates that the residual error for all models uses dataset preparation, training, and testing. It can be shown from both figures that the actual and calculated values of electrical resistivity are closer to the ANN model, suggesting the superior efficiency of the ANN compared to other models. The OBJ rates of all proposed models are given in Figure 14. The OBJ values for LR, NLR, MLR, and ANN are 105.06, 82.44, 57.49, and 43.10, respectively. The OBJ value of the ANN model is 59% less than the LR model, 47.7% lower than the NLR model, and 25% less than the MLR model. This also indicates that the ANN model is more efficient in estimating the electrical resistivity of cement paste mixtures modified with CNTs.
The SI assessment parameter values for the proposed models in the training and testing phases are presented in Figure 15. As can be seen from Figure 15, for all models and all stages (training and testing), the SI values were between 0.1 and 0.5, indicating excellent performance for all models. However, similarly to the other performance parameters, the ANN model has lower SI values than other models. The ANN model has a lower scatter index value than the LR model, which is 53% and a 44% lower scatter index value in the testing phase. Additionally, compared to the NLR model, the ANN model had reduced SI values in all stages, including 49% lower SI values in the training phase and 27% lower SI values in the testing phase. Additionally, compared to the MLR model, the ANN model had lower SI values throughout all stages, for instance, 24% smaller in the training phase and 23% less in the testing phase. Furthermore, this demonstrated that the ANN model is more effective and performed better than the LR, MLR, and NLR models when forecasting the electrical resistivity of cement paste mixes enhanced with carbon nanotubes. In addition, Figure 16 indicated the comparison between actual electrical resistivity versus predicted electrical resistivity among all different models using training data set.

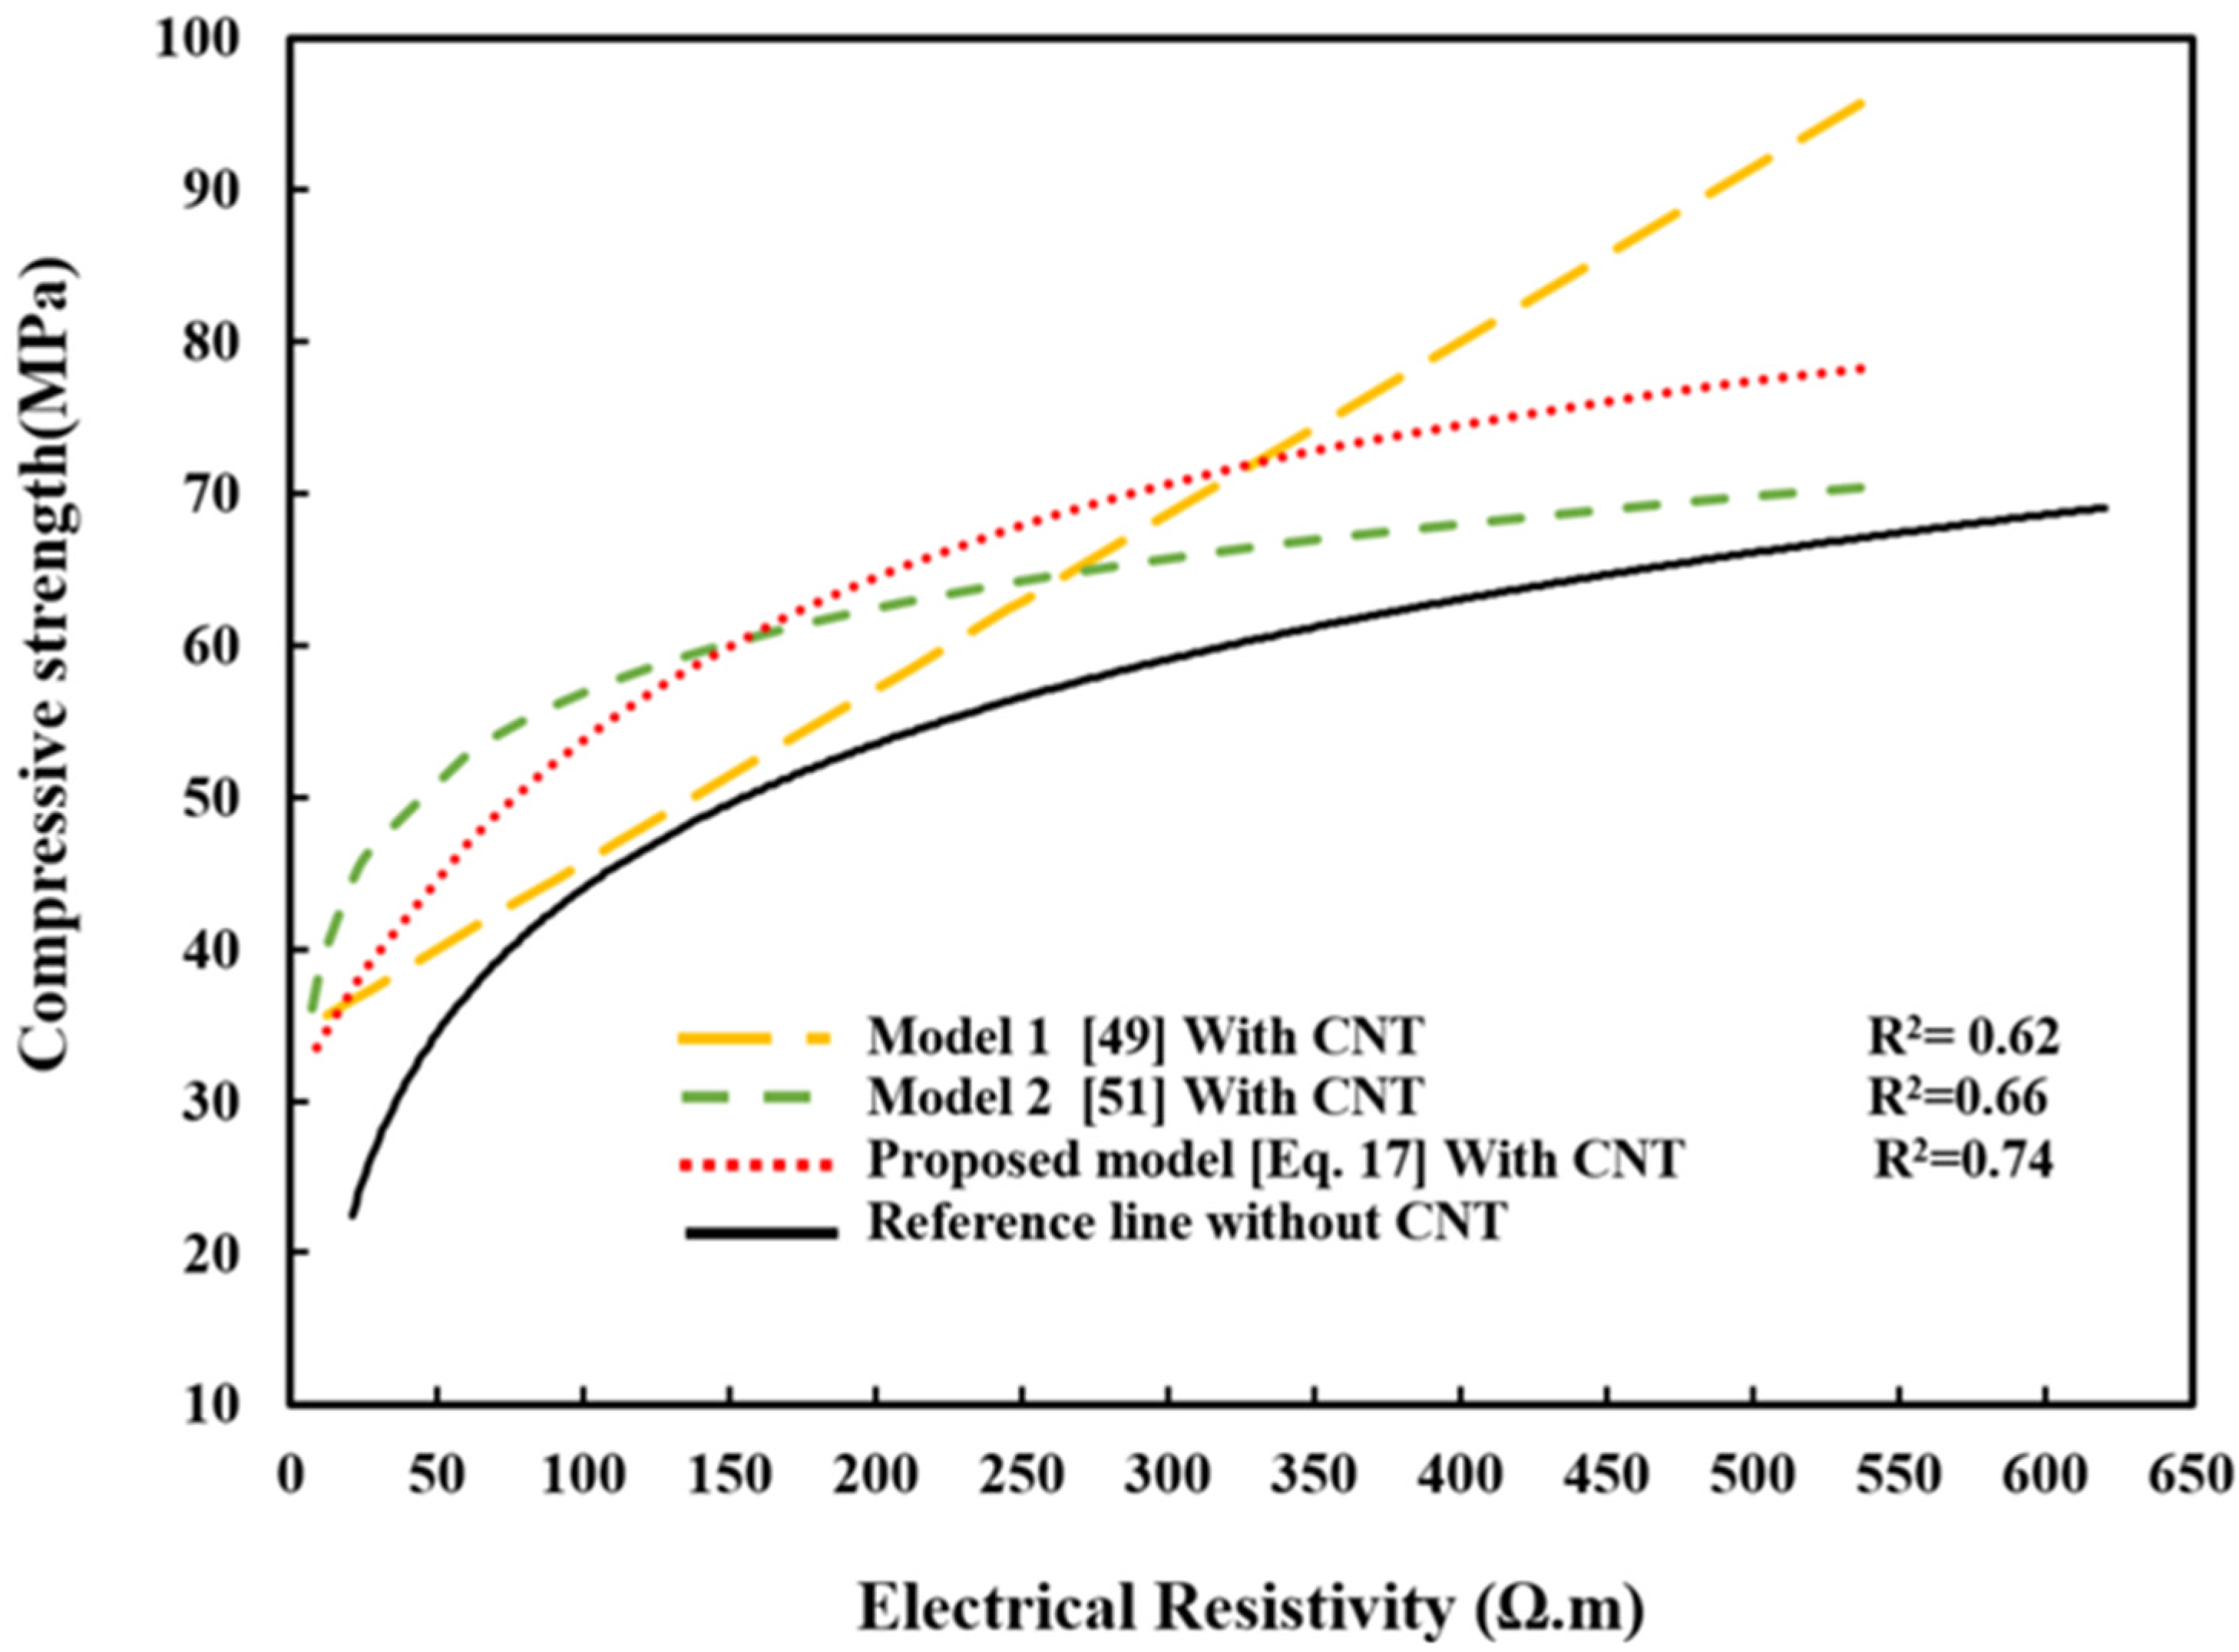
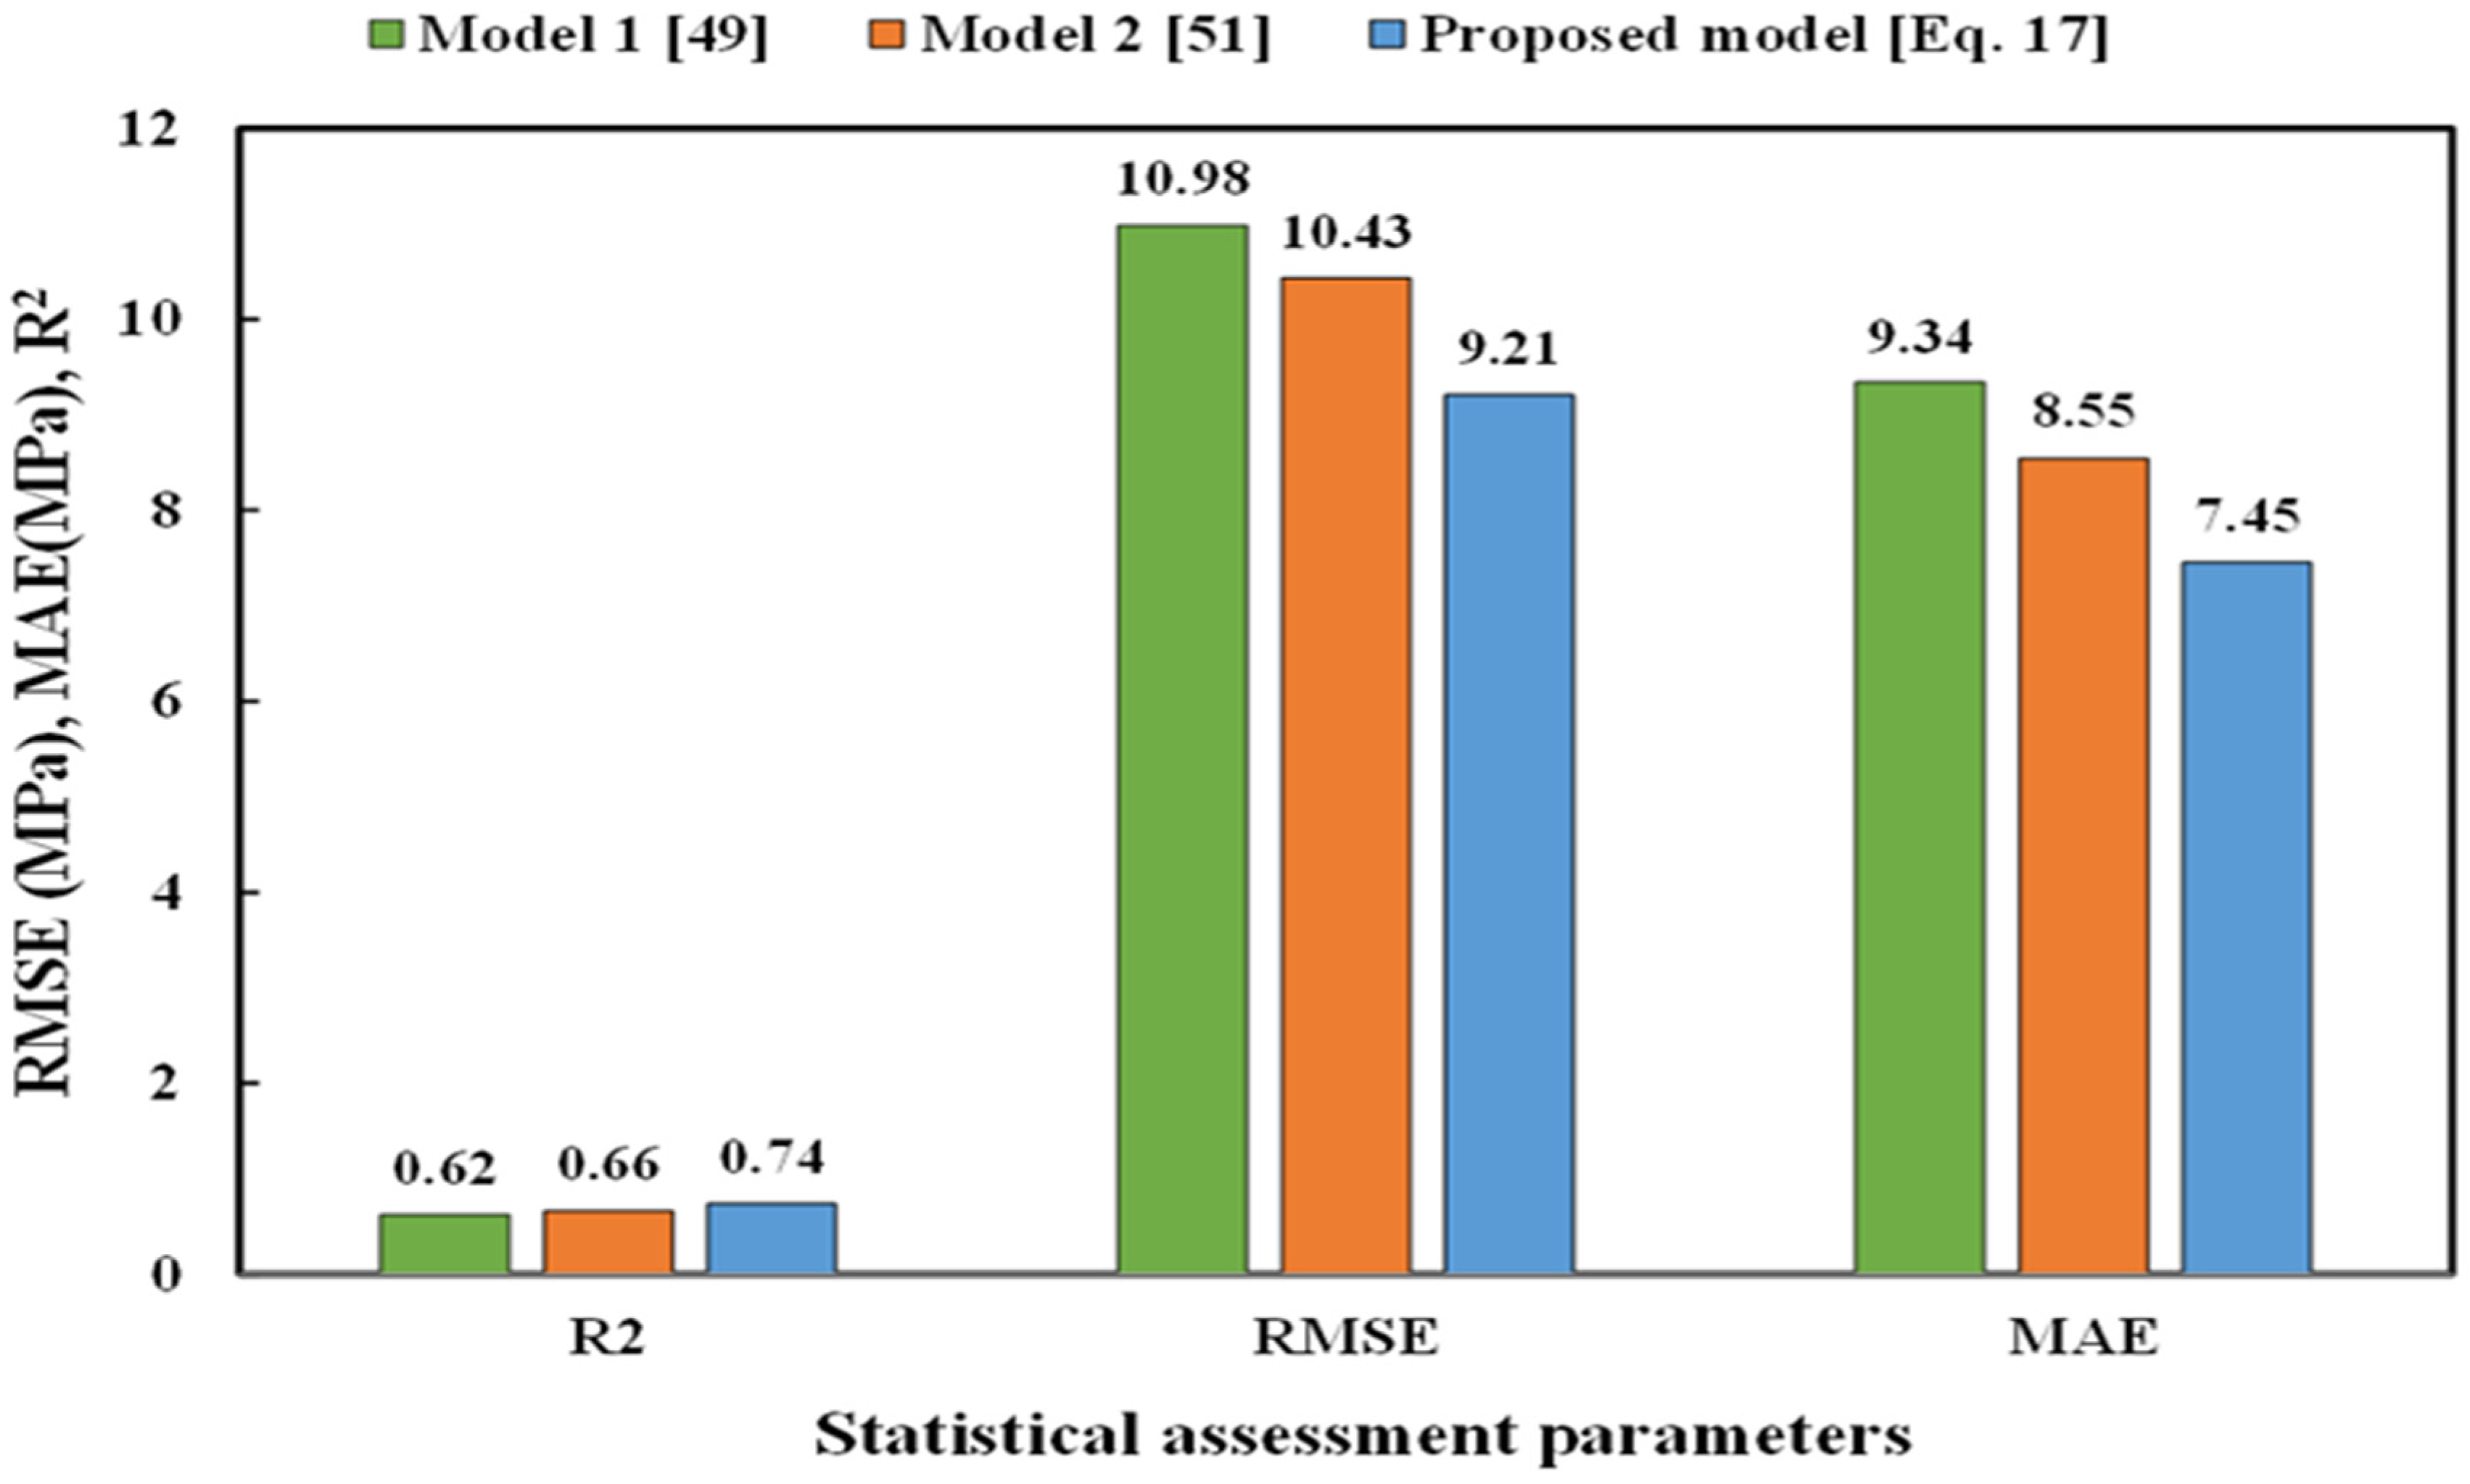
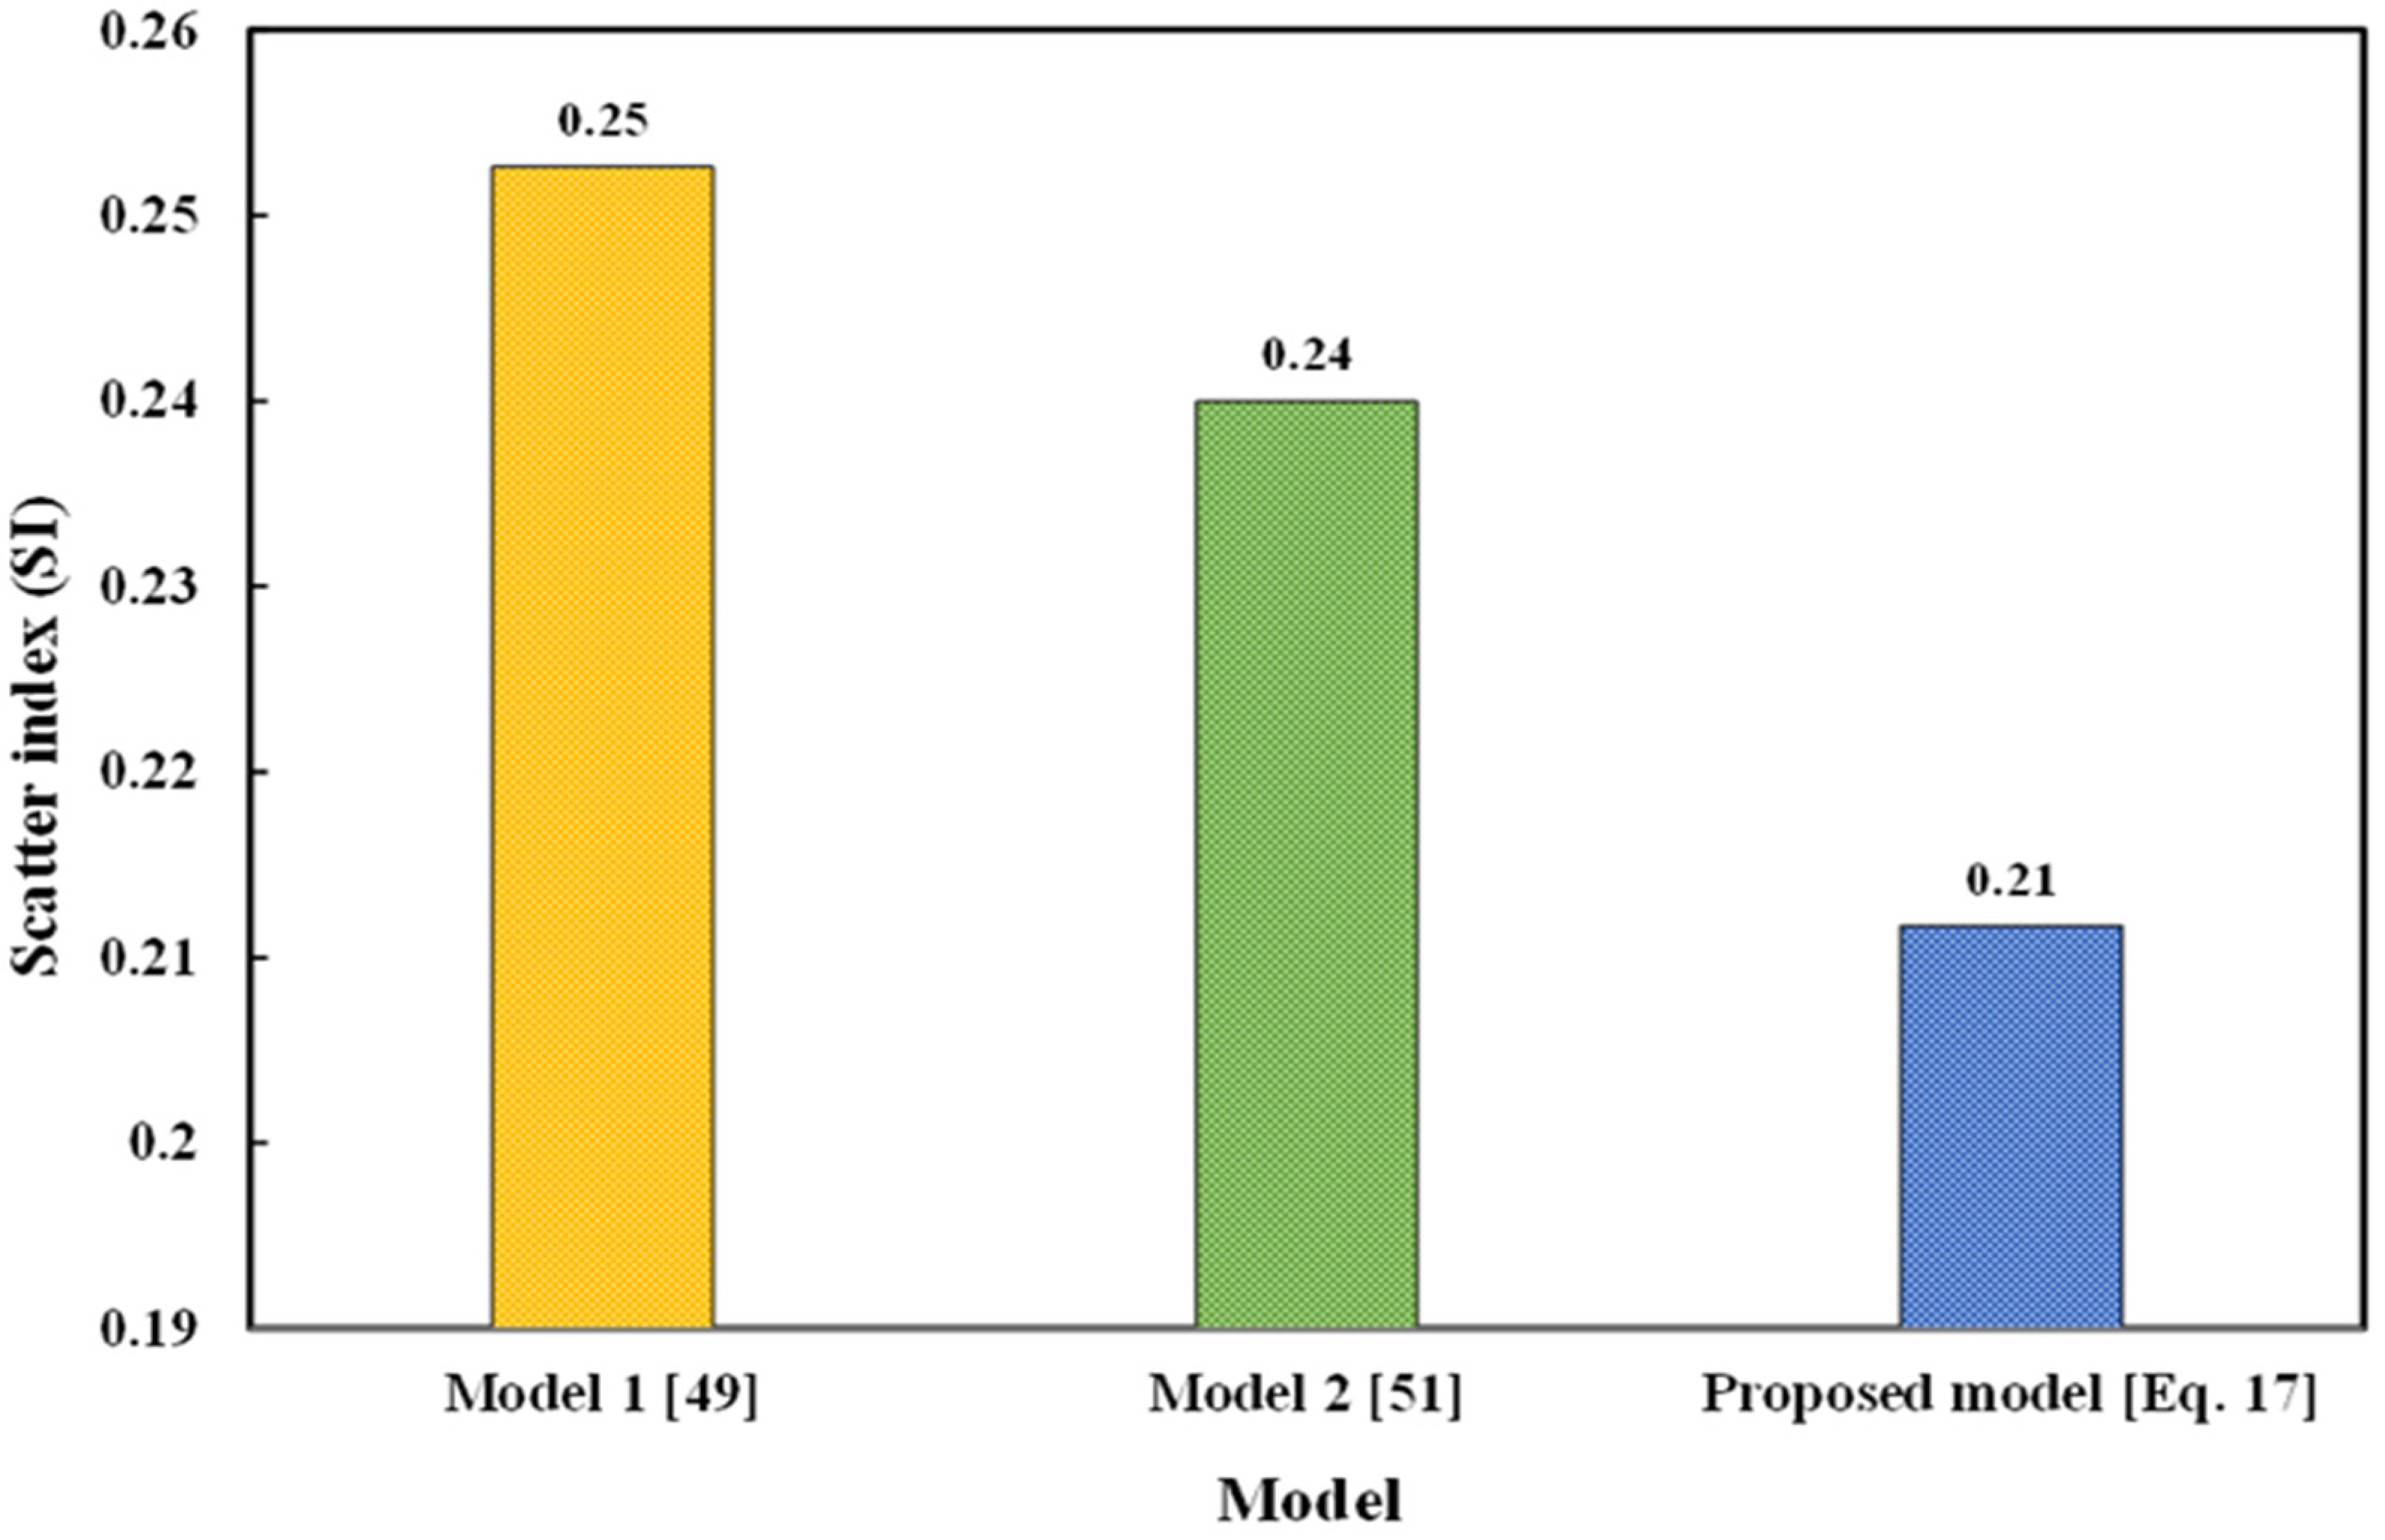
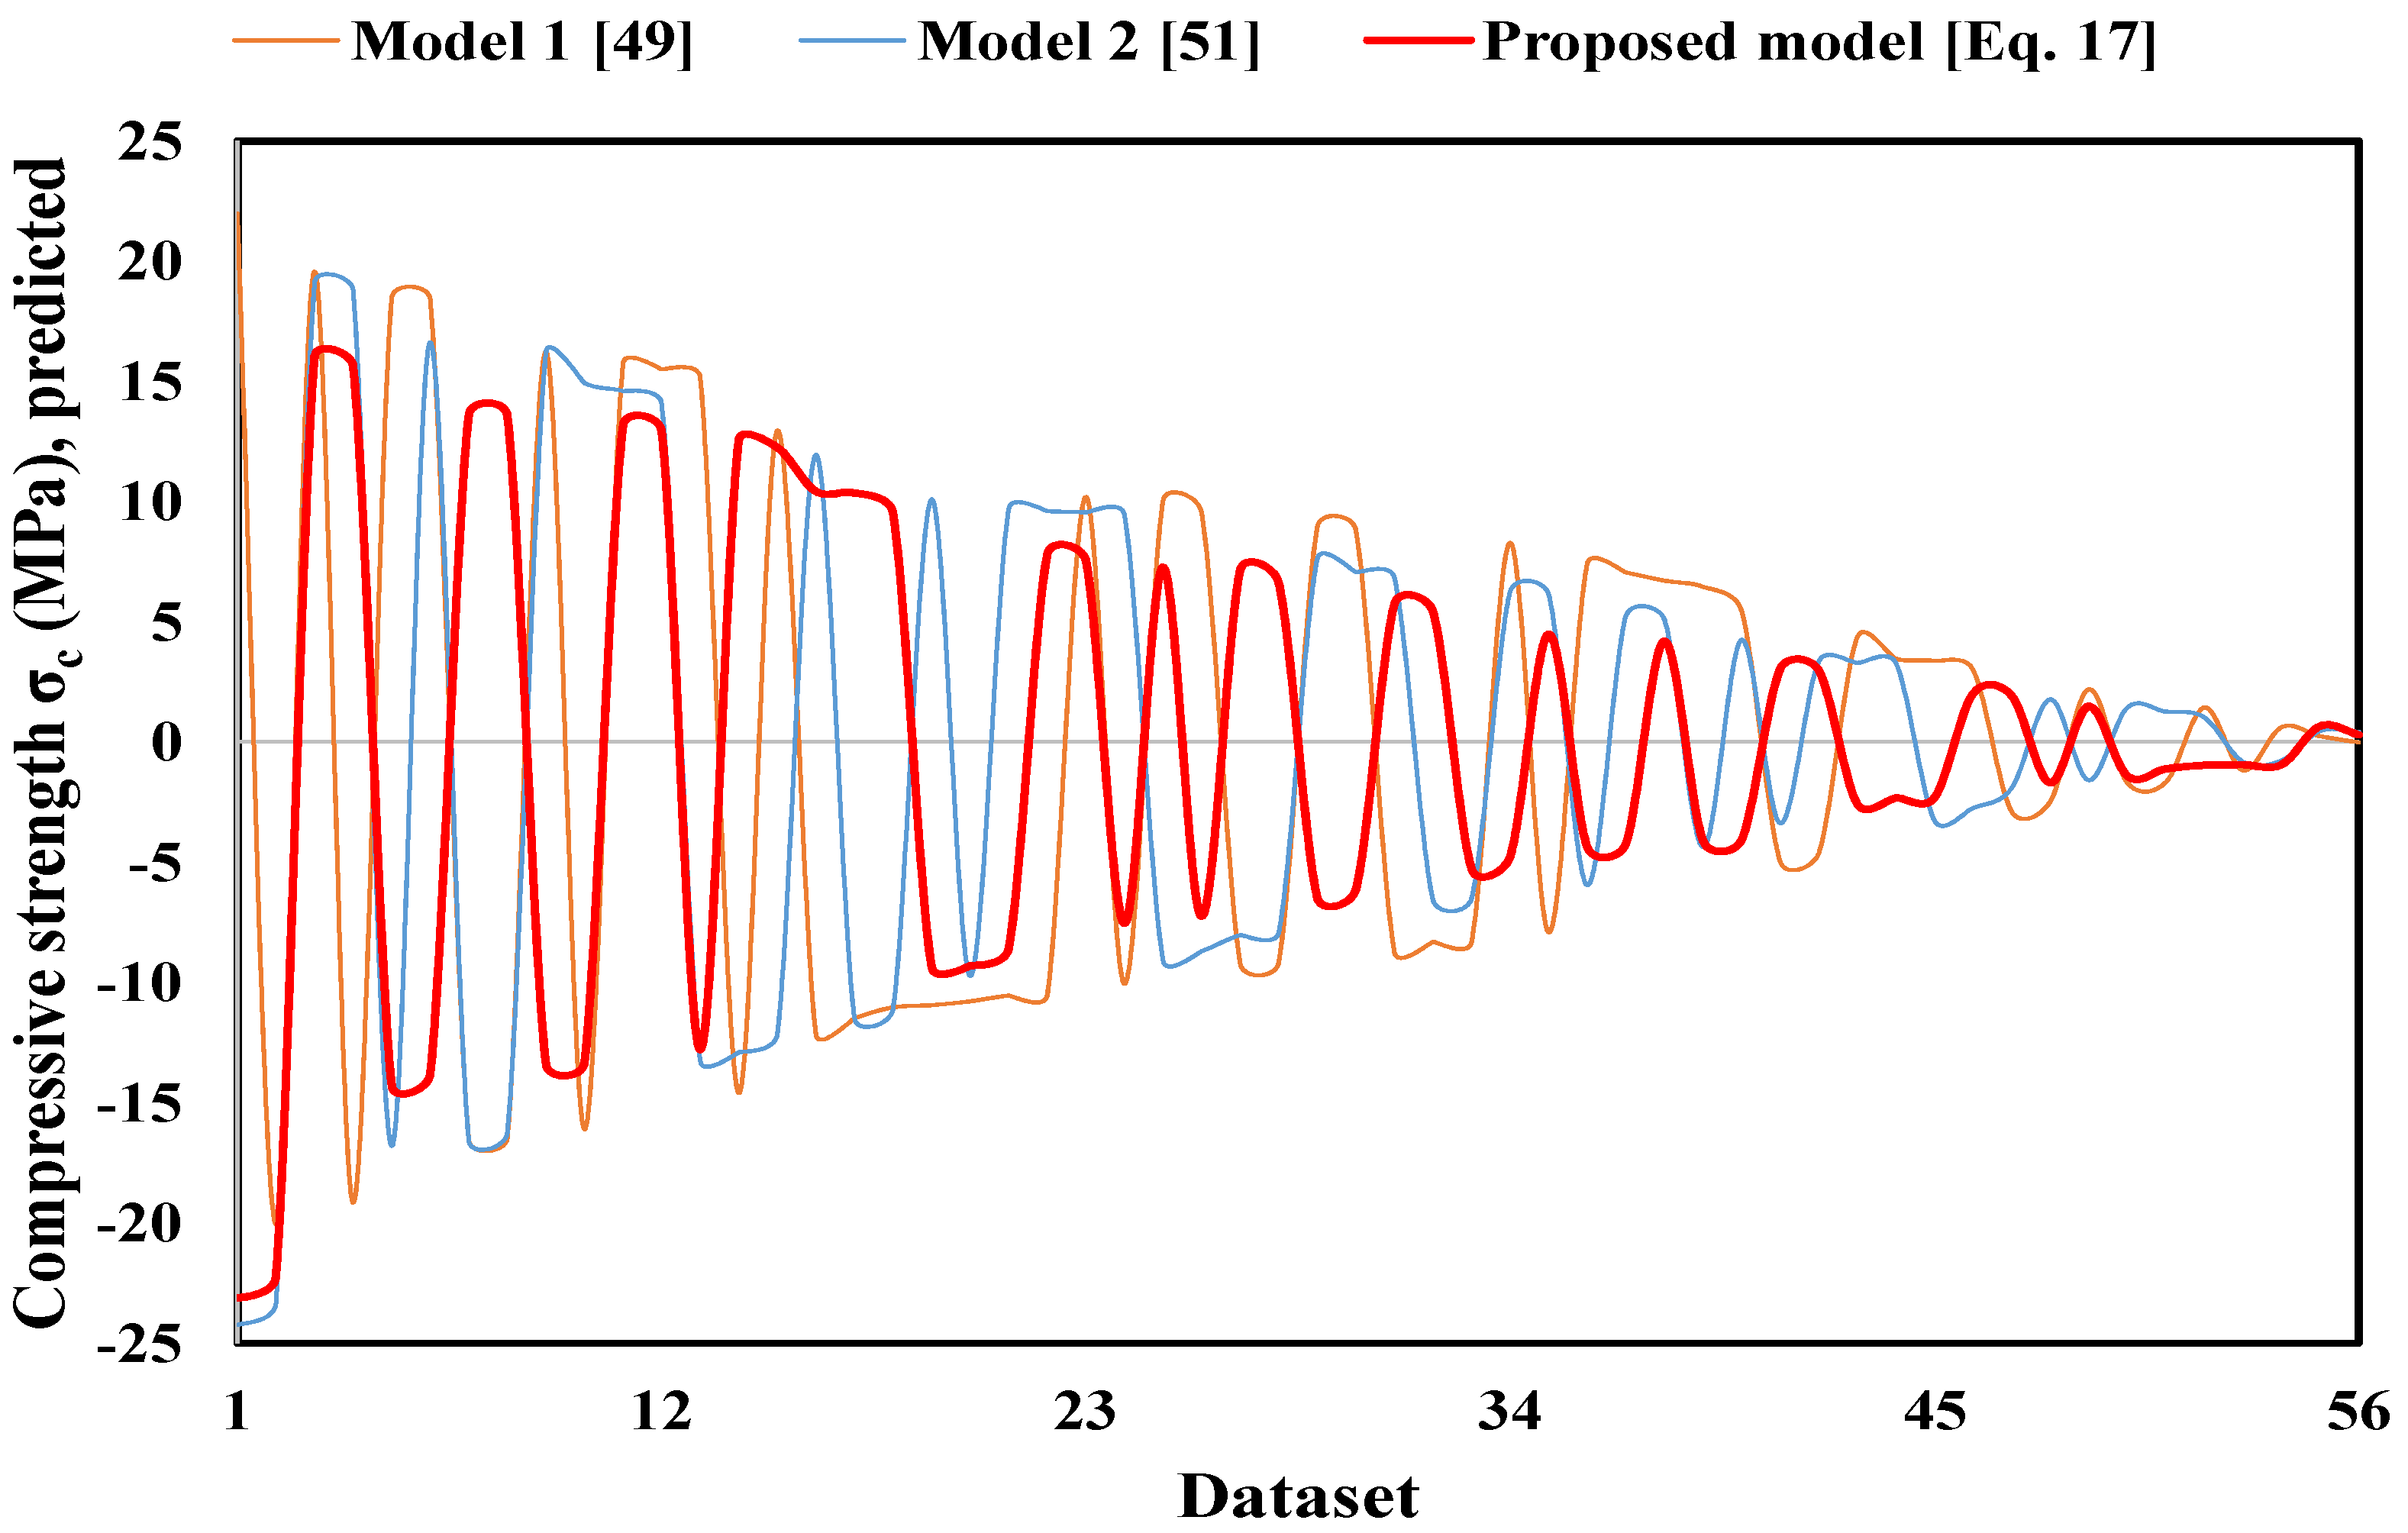
4.2. Correlation between Compressive Strength and Electrical Resistivity Based on the Proposed Model and Models from the Literature

As mentioned earlier, 56 data points were collected from literature review Table A2 [32,33,35,52,53,54,55] in order to create a correlation between compressive strength and electrical resistivity using models from literature review and proposed model. Based on data collected from the literature, the maximum compressive strength of cement paste has been recorded with the addition of CNTs with 0.5 wt % of cement and nano ferrite NF 4 wt % of cement was 94 MPa and 97 MPa, respectively [56,57]. Several experiments have proposed that the electrical resistivity of cementitious materials can be used to estimate compressive resistance at various levels of hydration [53,54,58,59]. Many studies have proposed linear correlation and logarithm models for predicting cement paste’s compressive strength in Equations (15) and (16) [4,53,55,59,60]. Equation (17a,b) shows the Vipulanandan correlation model and proposed model in this study for predicting compressive strength of cement paste as a function of electrical resistivity. Figure 17 indicates the correlation between cement paste’s compressive strength as a function of electrical resistivity for both the proposed model and models from the literature.
Based on statistical assessment parameters such as R2, RMSE, MAE, SI, and residual error, the proposed model gives better performance for predicting the compressive strength of cement paste compared to the models presented in the literature. The R2 value for the proposed model is 0.74, which is 10.80% larger than the logarithm function and 16.22% greater than the linear model Equation (15); the RMSE value is 13.04% lower than logarithm function and 19.35% lower than the linear function. In addition, the proposed model also has a lower MAE value than the other models, 14.77% lower than the logarithm model and 25.37% lower than the linear model Equation (15) as shown in Figure 18. The proposed model also has a lower scatter index value than the models proposed in the literature, which is 14.29% lower than the logarithm model Equation (16) and 20.48% lower than the linear model Equation (15) in Figure 19. The residual error for all three models is indicated in Figure 20. From Figure 20, the proposed model is also giving a better residual error compared to the other models.
General Equation Model 1
  σ c = 34.22 + 0.11 ρ
General Equation Model 2
σ c = 19.88 + 8.03 ln ( ρ )
General   equation   proposed   model       σ c = Y o + ρ A + B ρ  
σ c = 30.21 + ρ 2.67 + 0.015 ρ
where Yo, A, and B are models parameters, ρ is electrical resistivity, and σ c is compressive strength.
Based on the compressive strength of cement paste value reported in the literature review [56,57], the main disadvantage of linear model Equation (15) is that high electrical resistivity gives a high compressive strength beyond the limit value. However, the linear model Equation (15) can be applied for low electrical resistivity ranging between 1.57–200 Ω.m according to Figure 17 with the high performance of predicting compressive strength of cement paste [53,54,55,59,60]. The logarithm model Equation (16) proposed by the literature review cannot predict the compressive strength for very high electrical resistivity because it gives a value beyond the limited value mentioned in the literature review [56,57]. Furthermore, the logarithm model can predict cement paste’s compressive strength for electrical resistivity ranging from 1.57 to 600 Ω.m based on Figure 17. For example, assume the electrical resistivity reaches infinity by replacing the electrical resistivity value in both linear models Equation (15) and logarithm model Equation (16). Both models give infinite compressive strength, which is scientifically incorrect because the cement’s compressive strength never reaches infinity. While the Vipulanandan model Equation (17c,d) can predict the maximum compressive strength of cement paste.
When ρ → ꝏ
By replacing the infinity electrical resistivity into Equation (17b), the model can be rewritten as Equation (18a,b), which gives the maximum compressive strength 96.87 MPa, which is almost the same as the maximum compressive strength of cement paste indicated in the literature review [56,57].
σ c = 30.21 + lim ρ ρ 2.67 + 0.015 ρ  
The maximum power of resistivity ρ is one hence the parametrs must be divided by ρ in order to get a limit
      σ c = 30.21 + lim ρ ρ ρ 2.67 ρ + 0.015 ρ ρ
When ρ is going to ꝏ the equation can be written as
σ c , m a x = 30.21 + 1 0 + 0.015    
σ c , m a x = 30.21 + 1 0.015        

5. Sensitivity Examination

A sensitivity comparison was conducted for the models to determine the most affecting component that affects the electrical resistivity of cement paste mixtures modified with CNTs (Figure 21). For the sensitivity analysis, the most effective model, ANN, was selected using data from Table A1, and the result of sensitivity has been indicated in Table 1. Several separate training data sets were used in the sensitivity analysis, and each sample had a single input variable collected at a time. Each training dataset’s evaluation parameters—such as R2, RMSE, and MAE—were determined independently. In the first scenario, all parameters were considered to account for estimated electrical resistivity (scenario no. 1 in Table 1). For the second scenario, w/c was removed in order to see its effect on statistical. In the third scenario, the curing time was removed. Lastly, CNT was removed. From both Table 1 (Scenario 1–4) and Figure 21, it was noticed that the curing time is the most critical and sensitive parameter, which affects the output results by removing curing time, the R2 was reached the lower limit, and both RMSE and MAE have high magnitude. This happens because there is a significant difference between the performance of CNT-based paste at early and long ages [52]. The curing time for the collected data was varied from 1 to 180 days in this analysis. Increasing the curing time significantly improved the electrical resistivity of cement paste mixes containing CNTs. Almost all of the experimental findings listed in Table A1 (Appendix A) support this.

6. Conclusions

The sensitivity of smart materials can be achieved by adding a required amount of conductive nanomaterials, such as CNTs, to the mix composition that reduces the electrical resistivity and helps piezoresistive sensor to cover a large area regarding structural health monitoring. This is very important to save human life when catastrophic failures occur due to earthquakes and environmental effects in the structural building. There is no accurate model that has been proposed by literature to predict the electrical resistivity of cement paste containing CNTs. Therefore, valid and credible models for estimating electrical resistivity have been proposed in this study to save both costs and time in choosing a proper amount of nanoparticles. The following observations may be made based on the analysis and modeling of data from prior research.
1. The median proportion of carbon nanotubes used in the manufacture of cement paste mixes was 0.45%. Additionally, the amount of carbon nanotubes in the cement varied between 0 and 1.5 percent. The data from different experimental programs were cured for a period ranging from 1 to 180 days.
2. The LR, NLR, MLR, and ANN models were the models built in this research to forecast the electrical resistivity of cement paste mixtures. Based on the various evaluation parameters such as R2, RMSE, MAE, SI, and OBJ. Results indicated that the sequence of models are LR, NLR, MLR, and ANN, which means that the ANN was the best model proposed in this study based on data collected from literature which gives higher R2 and lower RMSE and MAE.
3. The ANN model’s OBJ value is 59% less than the LR model, 48% less than the NLR model, and 25% less than the MLR model. This also demonstrates that the ANN model is more effective in predicting the electrical resistivity of CNT-modified cement paste mixes.
4. The best model has been chosen based on the SI value, which must be as low as possible. In this study, the SI value for both LR and NLR models was between 0.50–0.75 for the training and testing data set, indicating poor quality of predicted models. Besides, the SI value for MLR was between 0.45 and 0.49 for the training and testing data set. The ANN model had less SI than all other models, which was 11 % lower than the MLR model, 45% lower than the LR model, and 39% less than the NLR model, respectively.
5. A sensitivity investigation demonstrates that the most significant input variable for predicting the electrical resistivity of cement paste mixtures modified with CNTs is the curing age. Increasing the curing age significantly changes the electrical resistivity of cement-based mixes with or without CNTs.
6. Based on statistical evaluation parameters such as R2, MAE, RMSE, SI, and residual error, the model proposed in this study gives better performance than that of the models proposed by literature to predicate the electrical resistivity of CNT-based paste as a function of electrical resistivity.

Author Contributions

Conceptualization, N.S.P. and A.S.M.; Methodology, N.S.P. and A.S.M.; Software, N.S.P. and A.S.M.; Validation, N.S.P. and A.S.M.; Formal analysis, N.S.P. and A.S.M.; Investigation, N.S.P. and A.S.M.; Resources, N.S.P.; Data curation, N.S.P.; Writing—original draft preparation, N.S.P.; Writing—review and editing, A.S.M. and S.M.H.; Visualization, A.S.M.; Supervision, A.S.M. and S.M.H.; Project administration, A.S.M. and S.M.H. All authors have read and agreed to the published version of the manuscript.

Funding

This research received no external funding.

Institutional Review Board Statement

Not applicable.

Informed Consent Statement

Not applicable.

Data Availability Statement

Not applicable.

Conflicts of Interest

The authors declare no conflict of interest.

Appendix A. Effect of Carbon Nanotubes on Cement Paste Resistivity at Different w/c Ratios and Different Curing Age

Table A1. Effect of carbon nanotubes on cement paste resistivity at different w/c ratios and different curing ages.
No. of
Data
Referencesw/cCuring Time
(day)
CNT
%
Electrical Resistivity
(Ω.m)
1[4]0.228072.33
20.2280.168.39
30.2280.532.54
40.22816.42
5[28]0.227072.53
60.2270.168.39
70.2270.532.54
80.22716
9[30]0.27109.67
100.277020.92
110.2728090.65
120.27600330
130.27900620.22
140.2718001252.23
150.2710.055.64
160.2770.0516.75
170.27280.0557.8
180.27600.05188.57
190.27900.05241.61
200.271800.05601.56
210.2710.154.97
220.2770.1514.78
230.27280.1551.17
240.27600.15157.14
250.27900.15238.66
260.271800.15597.14
270.2710.254.15
280.2770.2513.01
290.27280.2546.11
300.27600.25141.92
310.27900.25223.44
320.271800.25518.57
330.2710.353.59
340.2770.3512.95
350.27280.3543.12
360.27600.35128.66
370.27900.35219.51
380.271800.35484.69
390.2710.452.94
400.2770.4512.87
410.27280.4538.21
420.27600.45115.89
430.27900.45207.23
440.271800.45468.97
450.2710.552.87
460.2770.5511.79
470.27280.5533.93
480.27600.55113.44
490.27900.55190.04
500.271800.55417.9
510.2710.652.06
520.2770.6510.7
530.27280.6533.17
540.27600.65103.13
550.27900.65178.75
560.271800.65374.2
570.2710.751.57
580.2770.759.7
590.27280.7530.08
600.27600.75102.83
610.27900.75164.02
620.271800.75362.41
630.2710.851.42
640.2770.859.3
650.27280.8528.24
660.27600.8575.97
670.27900.85137.5
680.271800.85339.82
690.2710.951.37
700.2770.958.72
710.27280.9524.01
720.27600.9564.13
730.27900.95117.86
740.271800.95312.81
750.27111.2
760.27718.23
770.2728122.25
780.2760158.19
790.27901102.14
800.271801276.47
81[31]0.2770218.5
820.27280268.3
830.27600360.8
840.27900473.8
850.271200536.4
860.2770.25111.4
870.27280.25167.3
880.27600.25211.7
890.27900.25250.4
900.271200.25302.9
910.2770.584.5
920.27280.5134.3
930.27600.5178.6
940.27900.5203.9
950.271200.5245.6
96[32]0.470.050.798
970.4140.051.225
980.4280.053.46
990.470.10.897
1000.4140.11.84
1010.4280.15.52
1020.470.31.9
1030.4140.32.18
1040.4280.35.22
1050.470.53.29
1060.4140.53.9
1070.4280.55.34
108[33]0.48528084
1090.485280.161
1100.485280.571
111[36]0.4280500
1120.4280.25350
1130.4280.5190
1140.4280.75176
1150.4281180
1160.4281.535
Remarks Ranged between
0.2–0.485
varied
between
1–180 (days)
Ranged between
0–1.5 (%)
varied
between
0.798–1252.23 (Ω.m)
Table A2. Electrical and compressive strength correlation data.
No. DataReferencesElectrical Resistivity (Ω.m)Compressive (MPa)
1[32]536.473.7
2473.870.1
3360.865.37
4302.976.85
5268.358.51
6250.472.125
7245.676.96
8211.769.425
9203.974.04
10196.4868.22
11190.0464.74
12178.671.225
13167.362.56
14134.365.71
15111.448.16
16105.97856.88
1790.6549.23
1884.552.21
19[35]20.9227.66
2011.7947.72
211.5732.2
2211.8747.72
2333.9359.53
24190.0464.74
25[33]8431.7
266133.8
277135.3
28[53]2.0918.73
298.2945.95
302.4125.68
315.2736.49
323.7331.27
331.7914.86
34[54]3.0445.6
352.9445.1
362.8844.6
373.7454.7
383.7453.8
397.0837.51
407.0625.48
415.6319.7
42[55]7135.3
436133.8
4460.7349.49
4528.0437.19
46[52]6.9935.03
476.9234.39
486.8131.99
496.5433.53
506.4530.6
516.2329.47
526.1824.9
536.0528.2
545.9826.62
555.7919.38
565.7121.92
Remarks Electrical resistivity
ranged between
(1.57–536.4) Ω.m
Compressive strength
varied between
(14.86–76.86) MPa

References

  1. Bartos, P.J. Nanotechnology in Construction: A Roadmap for Development, in Nanotechnology in Construction 3; Springer: Berlin/Heidelberg, Germany, 2009; pp. 15–26. Available online: https://link.springer.com/chapter/10.1007/978-3-642-00980-8_2 (accessed on 5 November 2021).
  2. Bentur, A.; Mindess, S. Fibre Reinforced Cementitious Composites. 2006. Available online: https://books.google.co.jp/books?hl=zh-CN&lr=&id=z0NZDwAAQBAJ&oi=fnd&pg=PP1&dq=Fibre+reinforced+cementitious+composites.&ots=bhtJopb-wN&sig=5v3vLY-bMBp8-nLtoQblgCO76fo#v=onepage&q=Fibre%20reinforced%20cementitious%20composites.&f=false (accessed on 5 November 2021).
  3. Dong, S.; Han, B.; Qu, J.; Li, Z.; Han, L.; Yu, X. Electrically conductive behaviors and mechanisms of short-cut super-fine stainless wire reinforced reactive powder concrete. Cem. Concr. Compos. 2016, 72, 48–65. [Google Scholar] [CrossRef] [Green Version]
  4. Jiang, S.; Zhou, D.; Zhang, L.; Ouyang, J.; Yu, X.; Cui, X.; Han, B. Comparison of compressive strength and electrical resistivity of cementitious composites with different nano-and micro-fillers. Arch. Civ. Mech. Eng. 2018, 18, 60–68. [Google Scholar] [CrossRef]
  5. Raki, L.; Beaudoin, J.; Alizadeh, R.; Makar, J.; Sato, T. Cement and concrete nanoscience and nanotechnology. Materials 2010, 3, 918–942. [Google Scholar] [CrossRef] [Green Version]
  6. Tuan, C.Y.; Yehia, S.A. Implementation of Conductive Concrete Overlay for Bridge Deck Deicing at Roca, Nebraska. 2004. Available online: https://digitalcommons.unomaha.edu/civilengfacproc/3/ (accessed on 5 November 2021).
  7. Zhang, L.; Han, B.; Ouyang, J.; Yu, X.; Sun, S.; Ou, J. Multifunctionality of cement based composite with electrostatic self-assembled CNT/NCB composite filler. Arch. Civ. Mech. Eng. 2017, 17, 354–364. [Google Scholar] [CrossRef]
  8. Han, B.; Ding, S.; Yu, X. Intrinsic self-sensing concrete and structures: A review. Measurement 2015, 59, 110–128. [Google Scholar] [CrossRef]
  9. Loh, K.J.; Gonzalez, J. Cementitious Composites Engineered with Embedded Carbon Nanotube Thin Films for Enhanced Sensing Performance. 2015. Available online: https://iopscience.iop.org/article/10.1088/1742-6596/628/1/012042/meta (accessed on 5 November 2021).
  10. Materazzi, A.L.; Ubertini, F.; D’Alessandro, A. Carbon nanotube cement-based transducers for dynamic sensing of strain. Cem. Concr. Compos. 2013, 37, 2–11. [Google Scholar] [CrossRef]
  11. Boschetti-de-Fierro, A.; Pardey, R.; Savino, V.; Müller, A.J. Piezoresistive behavior of epoxy matrix-carbon fiber composites with different reinforcement arrangements. J. Appl. Polym. Sci. 2009, 111, 2851–2858. [Google Scholar] [CrossRef]
  12. Chung, D. Cement reinforced with short carbon fibers: A multifunctional material. Compos. Part B: Eng. 2000, 31, 511–526. [Google Scholar] [CrossRef]
  13. Vipulanandan, C.; Prashanth, P. Impedance spectroscopy characterization of a piezoresistive structural polymer composite bulk sensor. J. Test. Eval. 2013, 41, 898–904. [Google Scholar] [CrossRef]
  14. Vipulanandan, C.; Sett, K. Development and characterization of piezoresistive smart structural materials. Eng. Constr. Oper. Challenging Environ. Earth Space 2004, 2004, 656–663. [Google Scholar]
  15. Vipulanandan, C.; Mohammed, A. Rheological properties of piezoresistive smart cement slurry modified with iron-oxide nanoparticles for oil-well applications. J. Test. Eval. 2017, 45, 2050–2060. [Google Scholar] [CrossRef]
  16. Ubertini, F.; Laflamme, S.; D’Alessandro, A. Smart cement paste with carbon nanotubes. In Innovative Developments of Advanced Multifunctional Nanocomposites in Civil and Structural Engineering; Elsevier: Amsterdam, The Netherlands, 2016; pp. 97–120. Available online: https://www.sciencedirect.com/science/article/pii/B9781782423263000063 (accessed on 5 November 2021).
  17. Vipulanandan, C.; Mohammed, A. Smart cement modified with iron oxide nanoparticles to enhance the piezoresistive behavior and compressive strength for oil well applications. Smart Mater. Struct. 2015, 24, 125020. [Google Scholar] [CrossRef]
  18. Zolotarev, A.A.; Lushin, I.A.; Charykov, A.N.; Semenov, N.K.; Namazbaev, I.V.; Keskinov, A.V.; Kritchenkov, A.S. Impact resistance of cement and gypsum plaster nanomodified by water-soluble fullerenols. Ind. Eng. Chem. Res. 2013, 52, 14583–14591. [Google Scholar] [CrossRef]
  19. Bawa, R.; Bawa, S.R.; Maebiuset, S.B.; Flynn, T.; Wei, C. Protecting new ideas and inventions in nanomedicine with patents. Nanomed. Nanotechnol. Biol. Med. 2005, 1, 150–158. [Google Scholar] [CrossRef] [PubMed]
  20. Rajabipour, F.; Weiss, J. Electrical conductivity of drying cement paste. Mater. Struct. 2007, 40, 1143–1160. [Google Scholar] [CrossRef]
  21. Chiarello, M.; Zinno, R. Electrical conductivity of self-monitoring CFRC. Cem. Concr. Compos. 2005, 27, 463–469. [Google Scholar] [CrossRef]
  22. Chen, B.; Liu, J.; Wu, K. Electrical responses of carbon fiber reinforced cementitious composites to monotonic and cyclic loading. Cem. Concr. Res. 2005, 35, 2183–2191. [Google Scholar] [CrossRef]
  23. Kim, G.M.; Yang, B.J.; Cho, K.J.; Kim, E.M.; Lee, H.K. Influences of CNT dispersion and pore characteristics on the electrical performance of cementitious composites. Compos. Struct. 2017, 164, 32–42. [Google Scholar] [CrossRef]
  24. Wen, S.; Chung, D.D.L. Partial replacement of carbon fiber by carbon black in multifunctional cement–matrix composites. Carbon 2007, 45, 505–513. [Google Scholar] [CrossRef]
  25. Chung, D.D.L. Piezoresistive Cement-Based Materials for Strain Sensing. J. Intell. Mater. Syst. Struct. 2016, 13, 599–609. [Google Scholar] [CrossRef]
  26. Gao, X.; Wang, H.; Li, S.; Lu, L.; Mo, Y. Piezoresistive effect of carbon nanofiber concrete exposed to different environmental conditions. Rev. Romana Mater.-Rom. J. Mater. 2015, 45, 341–347. [Google Scholar]
  27. Tumidajski, P.J. Electrical conductivity of Portland cement mortars. Cem. Concr. Res. 1996, 26, 529–534. [Google Scholar] [CrossRef]
  28. Hong, S.; Myung, S. A flexible approach to mobility. Nat. Nanotechnol. 2007, 2, 207–208. [Google Scholar] [CrossRef] [PubMed]
  29. Obitayo, W.; Liu, T. A review: Carbon nanotube-based piezoresistive strain sensors. J. Sens. 2012, 2012. [Google Scholar] [CrossRef] [Green Version]
  30. Sasmal, S.; Ravivarman, N.; Sindu, B.S.; Vigneshet, K. Electrical conductivity and piezo-resistive characteristics of CNT and CNF incorporated cementitious nanocomposites under static and dynamic loading. Compos. Part A Appl. Sci. Manuf. 2017, 100, 227–243. [Google Scholar] [CrossRef]
  31. Treacy, M.J.; Ebbesen, T.W.; Gibson, J.M. Exceptionally high Young’s modulus observed for individual carbon nanotubes. Nature 1996, 381, 678–680. [Google Scholar] [CrossRef]
  32. Siad, H.; Lachemi, M.; Sahmaran, M.; Mesbah, H.A.; Mesbah, K.A. Advanced engineered cementitious composites with combined self-sensing and self-healing functionalities. Constr. Build. Mater. 2018, 176, 313–322. [Google Scholar] [CrossRef]
  33. Konsta-Gdoutos, M.S.; Batis, G.; Danoglidis, P.A.; Zacharopoulou, A.K.; Zacharopoulou, E.K.; Falara, M.G.; Shah, S.P. Effect of CNT and CNF loading and count on the corrosion resistance, conductivity and mechanical properties of nanomodified OPC mortars. Constr. Build. Mater. 2017, 147, 48–57. [Google Scholar] [CrossRef]
  34. Zhang, W.; Ouyang, J.; Ruan, Y.; Zheng, Q.; Wang, J.; Yu, X.; Han, B. Effect of mix proportion and processing method on the mechanical and electrical properties of cementitious composites with nano/fiber fillers. Mater. Res. Express. 2018, 5, 015706. [Google Scholar] [CrossRef]
  35. Al-Dahawi, A.; Sarwary, M.H.; Öztürk, O.; Yıldırım, G.; Akın, A.; Şahmaran, M.; Lachemi, M. Electrical percolation threshold of cementitious composites possessing self-sensing functionality incorporating different carbon-based materials. Smart Mater. Struct. 2016, 25, 105005. [Google Scholar] [CrossRef]
  36. D’Alessandro, A.; Rallini, M.; Ubertini, F.; Materazzi, A.L.; Kenny, J.M. Investigations on scalable fabrication procedures for self-sensing carbon nanotube cement-matrix composites for SHM applications. Cem. Concr. Compos. 2016, 65, 200–213. [Google Scholar] [CrossRef]
  37. McCarter, W.J. Monitoring the influence of water and ionic ingress on cover-zone concrete subjected to repeated absorption. Cem. Concr. Aggreg. 1996, 18, 55–63. [Google Scholar]
  38. Vipulanandan, C.; Heidari, M.; Qu, Q.; Farzam, H.; Pappas, J.M. Behavior of Piezoresistive Smart Cement Contaminated with oil Based Drilling mud. In Offshore Technology Conference. 2014. Available online: https://onepetro.org/OTCONF/proceedings-abstract/14OTC/3-14OTC/D031S030R007/172097 (accessed on 5 November 2021).
  39. Wei, X.; Xiao, L.; Li, Z. Electrical measurement to assess hydration process and the porosity formation. J. Wuhan Univ. Technol.-Mater. Sci. Ed. 2008, 23, 761–766. [Google Scholar] [CrossRef]
  40. McCarter, W.J.; Starrs, G.; Chrisp, T.M. Electrical conductivity, diffusion, and permeability of Portland cement-based mortars. Cem. Concr. Res. 2000, 30, 1395–1400. [Google Scholar] [CrossRef]
  41. Vinotha, G.; Sundar, T.V.; Amuthalakshmi, D.; Vivek, M. Two new molecular preprocessing schemes for machine learning and their evaluation using some DT algorithms. AIP Conf. Proc. 2019, 2117. [Google Scholar] [CrossRef]
  42. Qadir, W.; Ghafor, K.; Mohammed, A. Characterizing and modeling the mechanical properties of the cement mortar modified with fly ash for various water-to-cement ratios and curing times. Adv. Civ. Eng. 2019, 2019. [Google Scholar] [CrossRef] [Green Version]
  43. Shariati, M.; Mafipour, M.S.; Ghahremani, B.; Azarhomayun, F.; Ahmadi, M.; Trung, N.T.; Shariati, A. A novel hybrid extreme learning machine–grey wolf optimizer (ELM-GWO) model to predict compressive strength of concrete with partial replacements for cement. Eng. Comput. 2020, 1–23. [Google Scholar] [CrossRef]
  44. FM Zain, M.; Abd, S.M. Multiple regression model for compressive strength prediction of high performance concrete. J. Appl. Sci. 2009, 9, 155–160. [Google Scholar] [CrossRef]
  45. Mohammed, A.; Mahmood, W.; Ghafor, K. TGA, rheological properties with maximum shear stress and compressive strength of cement-based grout modified with polycarboxylate polymers. Constr. Build. Mater. 2020, 235, 117534. [Google Scholar] [CrossRef]
  46. Sarwar, W.; Ghafor, K.; Mohammed, A. Modeling the rheological properties with shear stress limit and compressive strength of ordinary Portland cement modified with polymers. J. Build. Pathol. Rehabil. 2019, 4, 1–12. [Google Scholar] [CrossRef]
  47. Vipulanandan, C.; Mohammed, A.; Ganpatye, A. Smart cement performance enhancement with NanoAl 2 O 3 for real time monitoring applications using Vipulanandan models. In Proceedings of the Offshore Technology Conference, Houston, TX, USA, 30 April–3 May 2018. [Google Scholar]
  48. Mohammed, A.; Rafiqet, S.; Sihag, P.; Kurda, R.; Mahmood, W. Soft computing techniques: Systematic multiscale models to predict the compressive strength of HVFA concrete based on mix proportions and curing times. J. Build. Eng. 2020, 33, 101851. [Google Scholar] [CrossRef]
  49. Biglari, M.; Azami, A.S.; Kahidan, A.; Ghafari, E.; Ghasemi, M.A. Investigating the Effects of Cement Type and W/C Ratio on the Concrete Corrosion Using the Electrical Resistance Assessment Method. Civ. Eng. J. 2018, 4, 1897–1906. [Google Scholar] [CrossRef]
  50. Mohammed, A.; Rafiq, S.; Sihag, P.; Kurda, R.; Mahmood, W.; Mahmood, K.; Sarwar, W. ANN, M5P-tree and nonlinear regression approaches with statistical evaluations to predict the compressive strength of cement-based mortar modified with fly ash. J. Mater. Res. Technol. 2020, 9, 12416–12427. [Google Scholar] [CrossRef]
  51. Kekez, S.; Kubica, J. Application of Artificial Neural Networks for Prediction of Mechanical Properties of CNT/CNF Reinforced Concrete. Materials 2021, 14, 5637. [Google Scholar] [CrossRef]
  52. Hawreen, A.; Alexandre Bogas, J.; Guedes, M.; Pereira, M.F.C. Mechanical Characterization of Cement Pastes Reinforced with Pristine and Functionalized MWCNTs. In Materiais, XVIII Congresso da Sociedade Portuguesa de Materiais; University of Aveiro: Aveiro, Portugal, 2017; Available online: https://www.researchgate.net/publication/317348788_Mechanical_characterization_of_cement_pastes_reinforced_with_pristine_and_functionalized_multi-walled_carbon_nanotubes (accessed on 5 November 2021).
  53. Wei, X.; Tian, K.; Xiao, L. Prediction of compressive strength of Portland cement paste based on electrical resistivity measurement. Adv. Cem. Res. 2010, 22, 165–170. [Google Scholar] [CrossRef]
  54. Wei, X.; Xiao, L.; Li, Z. Prediction of standard compressive strength of cement by the electrical resistivity measurement. Constr. Build. Mater. 2012, 31, 341–346. [Google Scholar] [CrossRef]
  55. Dong, B.; Zhang, J.; Wang, Y.; Fang, G.; Liu, Y.; Xing, F. Evolutionary trace for early hydration of cement paste using electrical resistivity method. Constr. Build. Mater. 2016, 119, 16–20. [Google Scholar] [CrossRef]
  56. Mohsen, M.O.; Taha, R.; Taqa, A.A.; Shaat, A. Optimum carbon nanotubes’ content for improving flexural and compressive strength of cement paste. Constr. Build. Mater. 2017, 150, 395–403. [Google Scholar] [CrossRef]
  57. Kamal, M.; Safan, M.A.; Eltabey, M.; Zaki, E.I.S.; El-hassan, K.A. Compressive strength of Portland Cement Pastes and Mortars Containing Cu-Zn Nano-Ferrite. 2012. Available online: https://www.sid.ir/en/journal/ViewPaper.aspx?ID=262359 (accessed on 5 November 2021).
  58. Ferreira, R.M.; Jalali, S. NDT measurements for the prediction of 28-day compressive strength. NDT E Int. 2010, 43, 55–61. [Google Scholar] [CrossRef]
  59. Chi, L.; Wang, Z.; Lu, S.; Zhao, D.; Yao, Y. Development of mathematical models for predicting the compressive strength and hydration process using the EIS impedance of cementitious materials. Constr. Build. Mater. 2019, 208, 659–668. [Google Scholar] [CrossRef]
  60. Xiao, L.; Wei, X. Early age compressive strength of pastes by electrical resistivity method and maturity method. J. Wuhan Univ. Technol. Mater. Sci. Ed. 2011, 26, 983–989. [Google Scholar] [CrossRef]
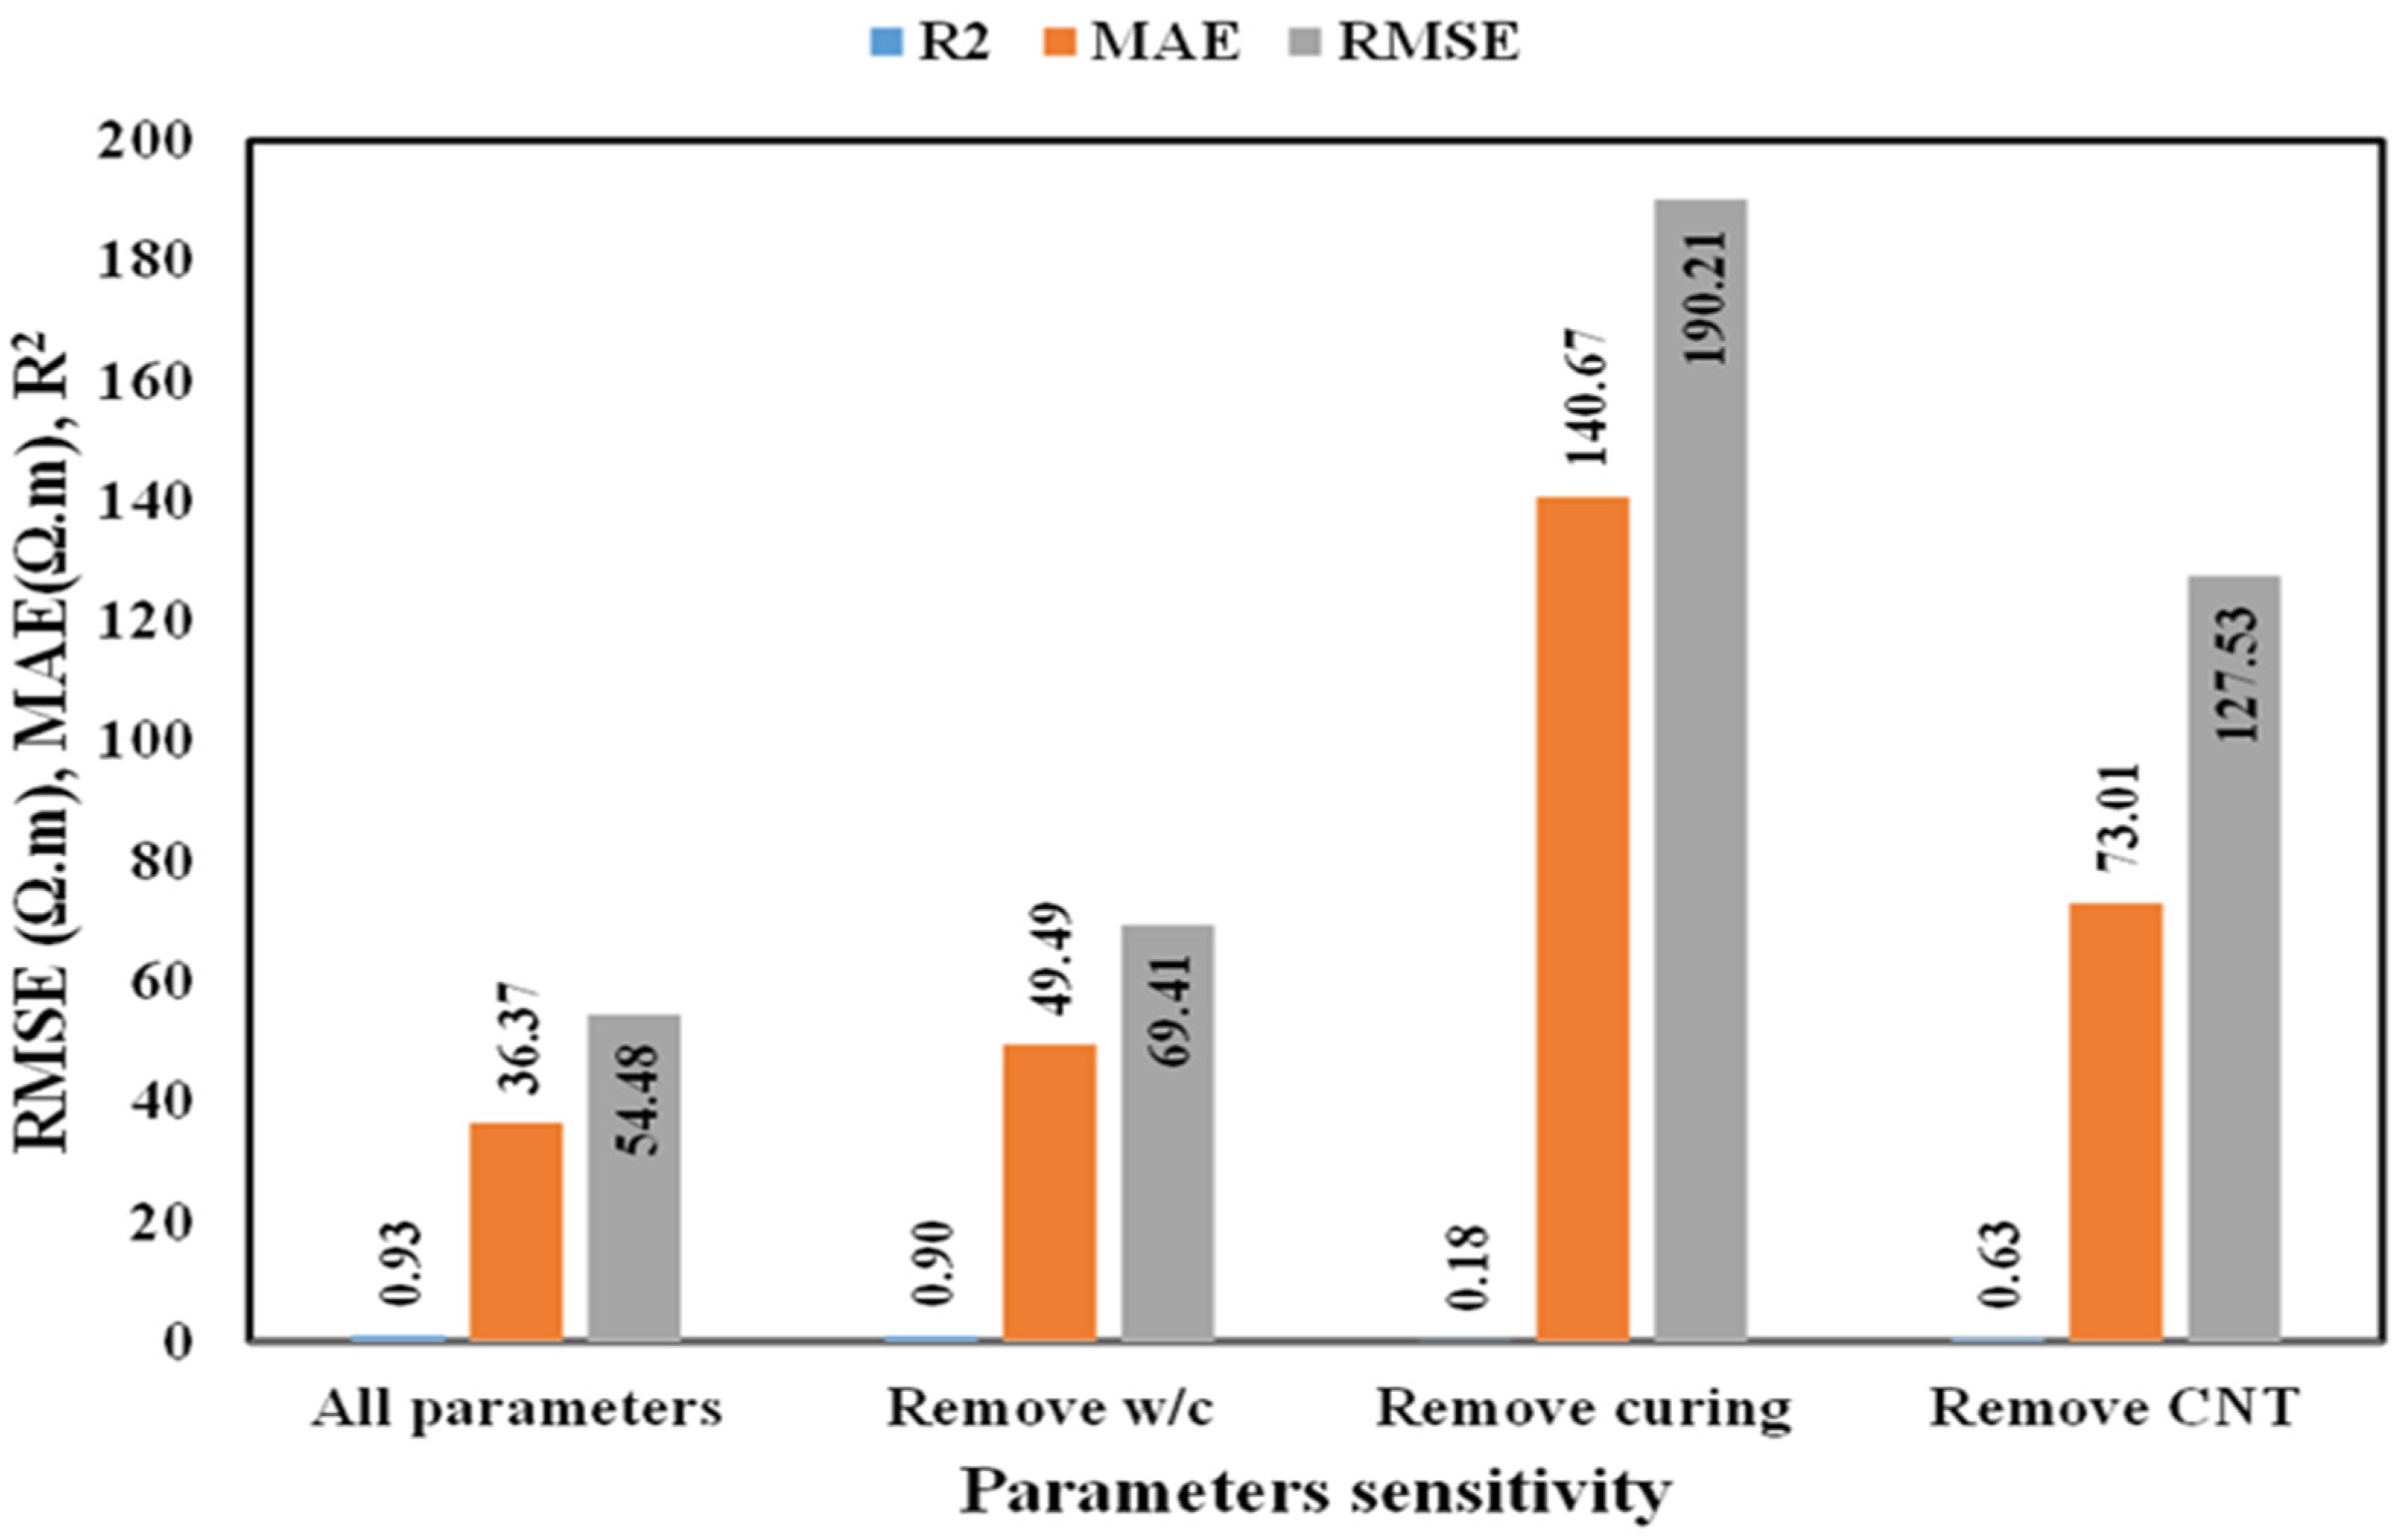
Figure 1. This study follows the flow chart diagram process (R2 is coefficient of determination; root mean square, RMSE; mean absolute error, MAE; scatter index, SI; and objective, OBJ).
Sustainability 13 12544 g001
Figure 2. Histogram for CNT% and the electrical resistivity of cement paste.
Sustainability 13 12544 g002
Figure 3. Histogram for w/c and the electrical resistivity of cement paste.
Sustainability 13 12544 g003
Figure 4. Histogram for curing time and the electrical resistivity of cement paste.
Sustainability 13 12544 g004
Figure 5. Optimal ANN structure based on RMSE and R2: (a) one hidden layer; (b) two hidden layers; (c) three hidden layers.
Sustainability 13 12544 g005aSustainability 13 12544 g005b
Figure 6. Choosing best-hidden layer and neurons for Artificial Neural Network model based on lower RMSE and MAE values.
Sustainability 13 12544 g006
Figure 7. Comparison between measured and predicted the electrical resistivity using Linear. Regression (LR) model (a) training dataset, (b) testing dataset.
Sustainability 13 12544 g007
Figure 8. Comparison between measured and predicted the electrical resistivity using Multi Linear Regression (MLR) model (a) training dataset, (b) testing dataset.
Sustainability 13 12544 g008
Figure 9. Comparison between measured and predicted the electrical resistivity using Non Linear Regression (NLR) model (a) training dataset, (b) testing dataset.
Sustainability 13 12544 g009
Figure 10. Comparison between measured and predicted the electrical resistivity using ANN model (a) training dataset, (b) testing dataset.
Sustainability 13 12544 g010
Figure 11. Comparison of the RMSE and MAE performance parameters of different developed models for training data and testing data.
Sustainability 13 12544 g011
Figure 12. Comparison of the R2 performance parameters of different developed models for training data and testing data.
Sustainability 13 12544 g012
Figure 13. Residual error of electrical resistivity using training and testing data set.
Sustainability 13 12544 g013
Figure 14. OBJ values for all developed models.
Sustainability 13 12544 g014
Figure 15. Comparison of the SI performance parameter of different developed models for training data and testing data.
Sustainability 13 12544 g015
Figure 16. Variation in predicted and measured values of electrical resistivity based five different approaches using training data set.
Sustainability 13 12544 g016
Figure 17. Correlation between Model 1 [48], Model 2 [50], proposed model (Equation (17 a and b)), reference line, and actual=data.
Sustainability 13 12544 g017
Figure 18. Comparison of the Model 1 [48], Model 2 [50], proposed model (Equation (17a,b)), and actual = data.
Sustainability 13 12544 g018
Figure 19. Comparison of the Model 1 [48], Model 2 [50], proposed model (Equation (17a,b)), and actual = data.
Sustainability 13 12544 g019
Figure 20. Residual error Model 1 [48], Model 2 [50], and proposed model (Equation (17a,b)).
Sustainability 13 12544 g020
Figure 21. Sensitivity analysis using ANN-based model.
Sustainability 13 12544 g021
Table 1. Sensitivity analysis using ANN-based model.
Scen. No.Input CombinationRemoved ParameterR2MAE (Ω.m)RMSE (Ω.m)Ranking
1w/c, CNT, curing time-0.9336.3754.48-
2CNT, curing timew/c0.8949.4969.413
3w/c, CNTCuring time0.18140.67190.211
4w/c, curing timeCNT0.6373.01127.532
Publisher’s Note: MDPI stays neutral with regard to jurisdictional claims in published maps and institutional affiliations.

