Abstract
Pile foundations of long-span bridges are often deeply buried in soil, and their structural condition is difficult to accurately diagnose by conventional methods. To address this issue, a method for diagnosing the structural condition of bridge pile foundations based on the spatial correlation of high-density strain measurement points is proposed. The strain data of the high-density measurement points of a bridge pile foundation are obtained by using distributed optical fiber sensing technology based on Brillouin scattering, and then an algorithm for diagnosing the structural condition of the pile foundation based on geographically weighted regression analysis is presented. On this basis, aiming at the scour of the pile foundation of long-span bridges, an algorithm for estimating the scour depth of the pile foundation based on sliding plane clustering is proposed. Finally, the effectiveness of the proposed method is verified by numerical simulation and actual bridge data.
1. Introduction
The pile foundation is a key component of the substructure of bridges, which affects the safety and stability of the whole bridge structure. Therefore, pile foundation safety cannot be ignored. However, pile foundations are subjected to complex loads and environmental factors, and they are susceptible to earthquakes, corrosion, and scour. Pile foundations are deeply buried in soil, and it is often difficult to comprehensively and accurately evaluate the structural condition of pile foundations using general detection methods. Therefore, it is of great importance to effectively diagnose the structural condition of pile foundations to ensure operational safety.
The pile foundation is buried in soil, and the stress state of the structure is different from that of other parts of the bridge. Many scholars have studied the mechanical behavior and pile–soil interaction of pile foundation structures under scouring and earthquakes. In terms of scouring influence, with the help of three-dimensional finite element models of pile foundations and field tests, the effects of fluid–structure interactions on bridge pile foundations [1], scour depth and width concerning the responses of laterally loaded piles in soft clay [2], and scour holes on the lateral responses of piles [3] have been studied. In addition, Jiang et al. [4] proposed a method for calculating the size of the scour hole. The influence of earthquakes, the nonlinear behavior of pile foundations [5,6], the pile–soil interaction of pile foundations under earthquake motions [7,8], and the liquefaction-induced settlement of buildings [9] have been studied. In the study of pile–soil interactions, many scholars have focused on the failure mode of pile foundations under extreme environments [10,11], the interaction between frozen soil and pile foundations [12,13,14], and the analysis of pile–soil interactions under normal environments [15,16,17,18,19]. In addition to the mechanical behavior of pile foundation structures under scouring and earthquakes, many scholars have conducted targeted research on the special stress mode of pile foundations. The deformation of pile foundations under vertical loading, lateral loading, and inclined loading has been studied [20,21,22,23,24]. The method for predicting the deformation of pile foundations has been widely studied [25,26,27], and a numerical model with greater load conditions and a wider range has been further developed [28,29,30,31,32]. The mechanical characteristics of pile foundations have been studied by many scholars, and the state of pile foundations can be judged by theoretical calculations and numerical models. However, due to the complexity of the environment, it is still necessary to use more direct and effective means to detect and monitor pile foundations to diagnose the state of pile foundations. In addition, the above research studies on pile–soil interactions and the response of pile foundations under different loads have helped determine detection and monitoring methods for pile foundations and the limit value of the collected data.
In recent years, with the progress of sensor technology, especially the development of distributed optical fiber sensors [33] and the improvement in the theory of structural health monitoring [34,35], many scholars have studied detection and monitoring methods for pile foundations. Concerning the application of point strain sensors in pile foundation monitoring, Shu et al. [36] proposed a damage identification method for pile foundations by using two symmetrically arranged strain sensor arrays. Acoustic emission monitoring is an effective approach that has been widely used for pile foundation monitoring [37,38,39], a method that can be used to detect damage directly. Moreover, monitoring the dynamic characteristics of pile foundations and superstructures is also effective [40,41,42]. In addition, many scholars have used a variety of sensors and new sensors to monitor pile foundations and have studied diagnosis methods for pile foundations [43,44,45]. At present, research on diagnosing the structural condition of the pile foundation has mainly focused on two aspects: directly identifying the damage by using acoustic waves, and identifying the damage based on structural modal information obtained by acceleration sensors. However, methods based on acoustic waves have difficulty realizing long-term real-time monitoring. The method based on modal information can only use the dynamic response characteristics of bridge superstructures and piers, which may not directly reflect the state of pile foundations.
The progress of distributed optical fiber sensing technology based on Brillouin scattering [46,47] has provided a new and effective means for pile foundation monitoring. The principle of distributed optical fiber sensing technology based on Brillouin scattering is that the Brillouin frequency shift in the optical fiber has a linear correlation with the temperature and strain of the optical fiber. The temperature influence coefficient and strain influence coefficient of the optical fiber can be obtained using constant pressure and constant temperature tests. The strain of optical fiber sensors can be obtained by measuring the Brillouin frequency shift. This technology overcomes the drawback of a small number of measuring points and the difficult installation of traditional point sensors. Therefore, to effectively diagnose the structural condition of pile foundations, a method based on the spatial correlation of high-density strain measurement points is proposed. First, a method for diagnosing the pile foundation structural condition based on geographically weighted regression analysis is proposed. Second, aiming at the scour of the pile foundation of long-span bridges, a method for estimating the scour depth of the pile foundation based on sliding plane clustering is presented. Finally, the effectiveness of the proposed method is verified by using numerical simulation and actual bridge data. The proposed method has two advantages: it directly collects strain information from pile foundation structures, which is more direct and effective than collecting acceleration information from bridge superstructures and pier columns; and the method is quite sensitive to scour because it is based on the spatial correlation of high-density strain measurement points.
2. Method for Diagnosing the Structural Condition of Pile Foundations
2.1. Method for Diagnosing the Structural Condition of Pile Foundations Based on Geographically Weighted Regression Analysis
In the structure construction stage of the bridge, distributed optical fiber sensors with high-density strain measurement points are embedded in a pile foundation to obtain the strain monitoring data of the pile foundation, and the structural condition of the pile foundation is diagnosed by using the spatial correlation of high-density measuring points.
The strain monitoring data S of the bridge pile foundation under the reference state can be expressed as:
where is the monitoring data of the ith measuring point in the reference state, ; is the strain monitoring data of the ith measuring point at time m; N is the total number of measuring points; and t is the total number of monitoring data points of a measuring point in the reference state.
The spatial regression model of strain at the high-density measuring points of the pile foundation is constructed based on geographically weighted regression (GWR) technology. The strain space composed of other measuring points outside the ith measuring point can be expressed as:
The residual error of the ith measurement point in the regression model can be calculated as follows:
where is the intercept term of the Equation and is the regression coefficient of the GWR model, which can be calculated as follows:
where is the estimate of and is the weighting coefficient matrix set according to the spatial distance of the measuring points of the pile foundation structure.
Since the boundaries at both ends of the pile foundation have a great impact on the overall structure, the weighting coefficient matrix is defined in the form of a piecewise conic. The depth of the measuring point corresponding to is , and the depth of the ith measuring point is . The distance between the two measuring points is . The weighting coefficient corresponding to can be calculated as follows:
where is the distance from the ith measuring point to the top of the pile foundation, is the distance from the ith measuring point to the bottom of the pile foundation, and ξ is the adjustment parameter, which can generally be taken as 0.7.
Then, the weighting coefficient matrix can be expressed as:
The intercept term can be calculated as follows:
where mean(·) represents calculating the mean value of the data.
The residual error of the measuring points can be expressed as:
where is the residual error of the ith measuring point in the reference state, ; and is the residual error of the ith measuring point at time t.
Taking the Mahalanobis distance of the residual error as the diagnosis index of the structural condition of the pile foundation, the diagnosis factor D of the structural condition can be calculated as follows:
All diagnostic factors calculated in the reference state can be expressed as follows:
Vector D can be rearranged from small to large to obtain the new vector as follows:
Then, the diagnostic threshold of the structural condition of the pile foundation can be calculated as follows:
where is the safety factor, which can generally be taken as 1.3.
The diagnostic factor of the structural condition of the pile foundation under the operating state can be expressed as:
By comparing the diagnosis factors under the operating state with the corresponding diagnosis threshold, if , then the pile foundation is considered to be healthy; otherwise, the pile foundation is considered to be in an abnormal state.
2.2. Method for Estimating the Scour Depth of the Pile Foundation Based on Sliding Plane Clustering
By calculating the diagnosis factor D of the structural condition of the pile foundation, the discrimination of the structural condition can be realized. One of the most important reasons for the change in the structural condition of the pile foundation is scouring, and the spatial correlation of the strain of the pile foundation may change when a scouring phenomenon occurs. To identify the scour depth of the pile foundation, a method for estimating the scour depth of the pile foundation based on sliding plane clustering is proposed.
The pile foundation is divided into two parts by plane sliding from top to bottom. The distance of the strain of the measuring points for the two parts is calculated as follows:
where represents the rth category and is the mean vector of the rth category.
When distance E is the smallest, the sliding plane is considered the best classification plane, and the depth of the best classification plane is the estimated value of the scouring depth. The specific steps are as follows:
(i) The estimated scouring depth of the pile foundation is h m, and the initial value of h is 1.
(ii) The strain monitoring data of each measuring point whose depth does not exceed h can be expressed as:
where is the monitoring data of the pth measuring point, ; is the strain monitoring data of the pth measuring point at time m; u is the number of the last measuring point from top to bottom whose depth does not exceed h; and t is the total amount of the monitoring data of a measuring point.
The strain monitoring data of each measuring point whose depth exceeds h can be expressed as:
The distance of the strain of the measuring points for the two parts is calculated as follows:
where and are the mean vectors of the first and second categories, respectively, which can be calculated as follows:
(iii) If h = 1, make Ee = E, he = h. Otherwise, compare Ee with E, if E < Ee, make Ee = E, he = h.
(iv) Make h = h + 1 and repeat steps (ii) to (iv) until h is equal to the buried depth of the pile foundation.
(v) Finally, he is the estimated depth of the scouring depth of the pile foundation.
3. Numerical Example
3.1. Brief Description of an Actual Bridge
The Fenghuang bridge is located in Jinan, China. It is a three-tower, self-anchored suspension bridge and an important passage across the Yellow River. The span combination of the bridge is 70 m + 168 m + 428 m + 428 m + 168 m + 70 m, and the A-type cable tower is adopted for the bridge tower. A bored pile foundation is adopted for the bridge, and a photo of the bridge is shown in Figure 1.

Figure 1.
Schematic diagram and photos of the bridge.
3.2. Generation of a Bridge Finite Element Model
ANSYS (version 16.0) software (a commercial product by ANSYS, Inc.) was applied to establish the finite element model of the Fenghuang bridge. To save calculation resources, only the pile foundation under the middle tower and the superstructure of the bridge were researched. The materials of stiffening beam, main tower, main cable, and suspender are steel, and the material of the pile foundations is concrete. The parameters of these materials are shown in Table 1. The stiffening beam, main tower, and pile foundations were simulated by beam188 elements. The main cable and suspender were simulated by link10 elements. To improve the speed of calculation, the soil was simulated by spring elements. The substructure of the bridge is a pile group, incorporating 35 single piles. The diameter of the pile is 2 m, and the length of the pile is 100 m. The finite element model of the bridge and pile foundation are shown in Figure 2 and Figure 3, respectively. The comparison between the suspenders tension under the gravity load results obtained by the finite element model and the designed suspenders tension is shown in Figure 4. The results of the finite element model analysis are close to the design values, which proves the correctness of the established finite element model.

Table 1.
Mechanical parameters used in finite element model.
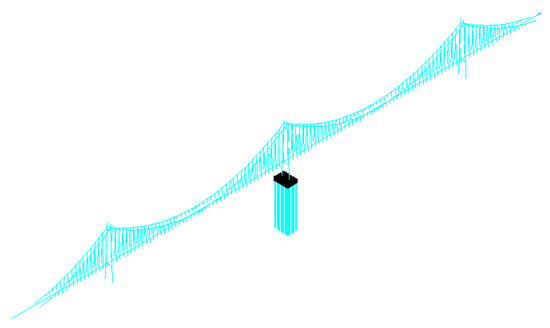
Figure 2.
Finite element model of the entire bridge.
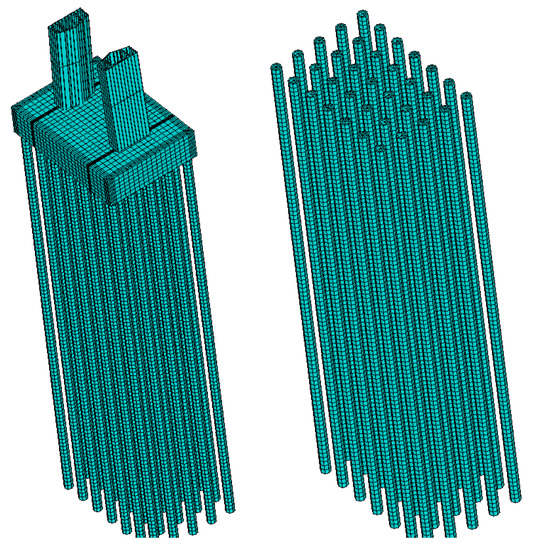
Figure 3.
Finite element model of the pile foundation.
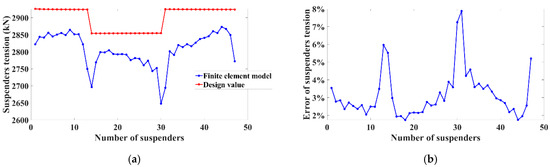
Figure 4.
Comparison of the suspenders tension under the gravity load using results obtained by the finite element model and the designed suspenders tension: (a) results of the suspenders tension under gravity load; (b) errors between the results obtained by finite element model and the designed suspenders tension.
A random load was applied to the bridge, and the COMBIN14 element was used to simulate the soil layer around the pile foundation. All degrees of freedom were constrained at the bottom of the side tower. The parameters of the soil layer are shown in Table 1. Each pile was divided into 100 units with 100 effective measuring points. The geometric dimensions of the soil layers and the locations of the measuring points are shown in Figure 5 and Figure 6, respectively.
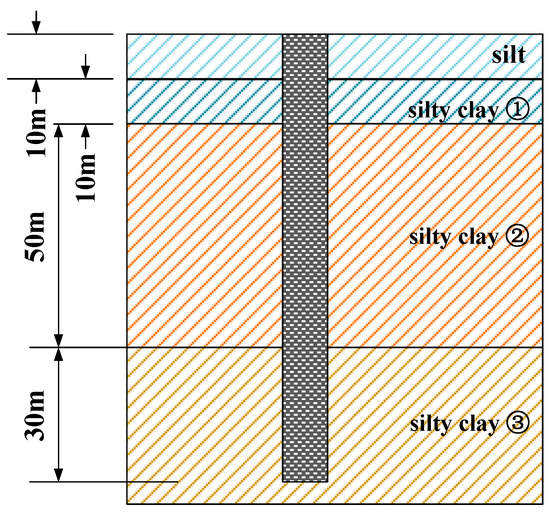
Figure 5.
The geometric parameters of the soil.
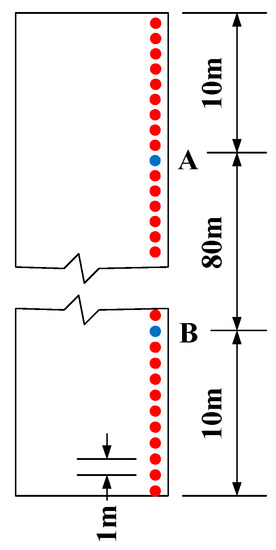
Figure 6.
The locations of the measuring points.
3.3. Verification of the Effectiveness of the Proposed Method
The strain of the pile foundation under a random load is shown in Figure 7. The erosion of the pile foundation was simulated by removing the soil layer. The damage conditions are shown in Table 2.
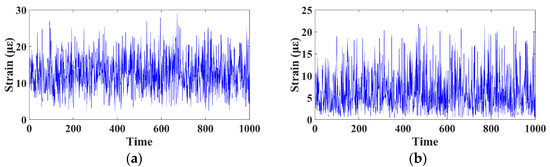
Figure 7.
Strain data of the pile foundation under a healthy state: (a) strain at measuring point A; (b) strain at measuring point B.
Table 2.
Damage conditions.
The weight calculated by using Equation (5) is shown in Figure 8. The influence of the boundary on the pile foundation can be considered using this weight.
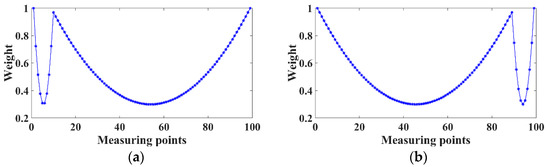
Figure 8.
Weight distribution: (a) measuring point A; (b) measuring point B.
A total of 1000 simulation sample points were obtained for the healthy state, damage condition 1, damage condition 2, and damage condition 3. The regression model was constructed using Equations (2)–(7) based on the first 500 simulation sample points for the healthy state. The residual error of measuring point A and measuring point B is shown in Figure 9.
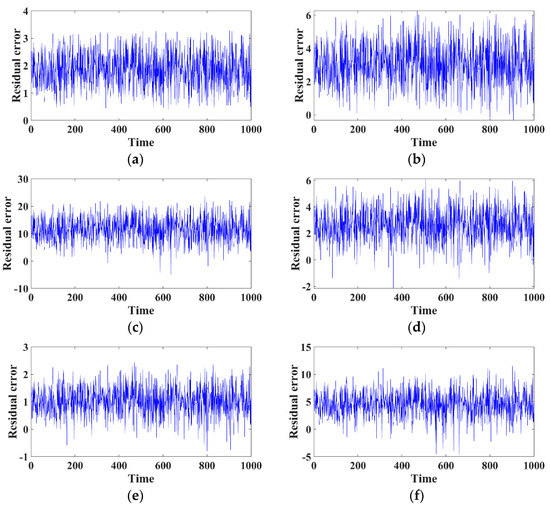
Figure 9.
Residual error: (a) measuring point A (damage condition 1); (b) measuring point A (damage condition 2); (c) measuring point A (damage condition 3); (d) measuring point B (damage condition 1); (e) measuring point B (damage condition 2); and (f) measuring point B (damage condition 3).
The change in the residual error is relatively stable under the same conditions. However, the residual error of the same measuring point under different damage conditions is very different, especially the mean value of the residual error. Therefore, it is reasonable to use the residual error of the regression model as the basis in the construction of a damage diagnosis factor. The diagnosis results of the pile foundation by using Equations (8)–(13) are shown in Figure 10.
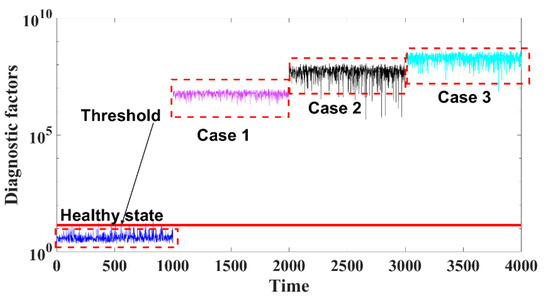
Figure 10.
Diagnosis results of the pile foundation.
Figure 10 shows that the diagnosis factor increases with increasing scouring depth, and the proposed algorithm based on GWR analysis is effective for diagnosing the structural condition of the pile foundation of bridges. However, the proposed algorithm based on GWR analysis cannot reflect the specific extent of damage. The algorithm results for estimating the scour depth of the pile foundation based on sliding plane clustering are shown in Table 2. Although the proposed method cannot accurately identify the scouring depth of the pile foundation, the calculated estimated value can correctly reflect the change in the scouring depth of the pile foundation. The difference between the estimated value and the actual value is approximately 5 m. Therefore, the calculation results of the proposed method based on sliding plane clustering can qualitatively reflect the scouring degree of the pile foundation.
4. Example of an Actual Bridge
Distributed optical fiber sensing technology based on Brillouin scattering was used to obtain the strain monitoring data of pile foundations of the Fenghuang Bridge, with a depth of no more than 60 m and a resolution of 20 cm. The detailed parameters of the distributed optical fiber sensors are shown in Table 3. The optical fiber sensors were arranged along the longitudinal length of the pile foundation, as shown in Figure 11.
Table 3.
The detailed parameters of the distributed optical fiber sensors.
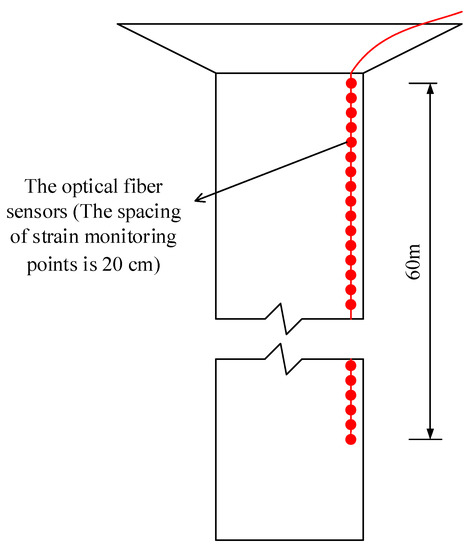
Figure 11.
Position of the optical fiber sensors.
The optical fiber sensors were bound to the reinforcement and kept straight when the reinforcement cage was sunk. The spacing of the strain monitoring points of the pile foundation was 20 cm. The field layout of the distributed optical fiber sensors is shown in Figure 12.
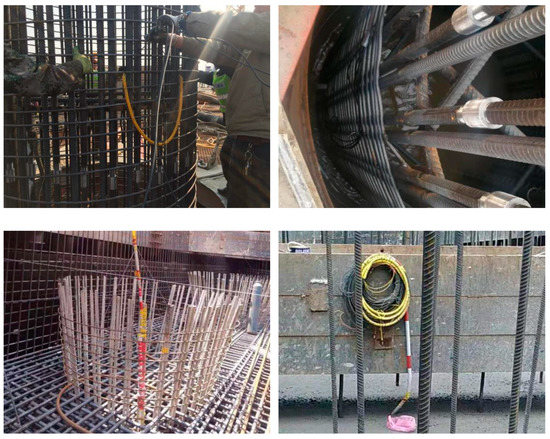
Figure 12.
Photos of the installation for the optical fiber sensors.
The strain variation trend at different monitoring points of the pile foundation from October to November 2020 is shown in Figure 13. The strain change at each measuring point from October to November was stable, indicating that the pile foundation was in a stable state. Therefore, the strain monitoring data at this stage can be used as reference data for the healthy state of the pile foundation.
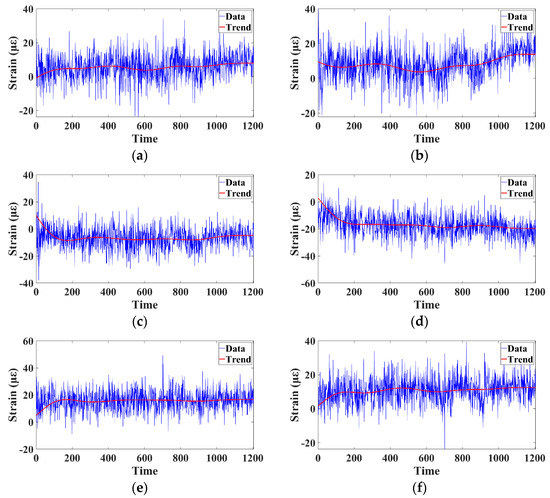
Figure 13.
Strain of the pile foundation at different measuring points: (a) measuring point with a depth of −10 m; (b) measuring point with a depth of −20 m; (c) measuring point with a depth of −30 m; (d) measuring point with a depth of −40 m; (e) measuring point with a depth of −50 m; and (f) measuring point with a depth of −60 m.
The parameters of the regression model were calculated by using the first three-quarters of the data from October to November. The residual error of strain at different measuring points is shown in Figure 14.
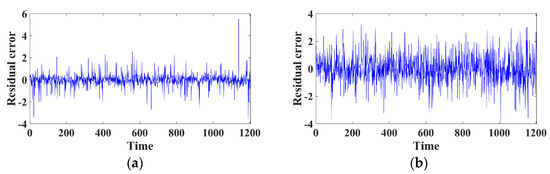
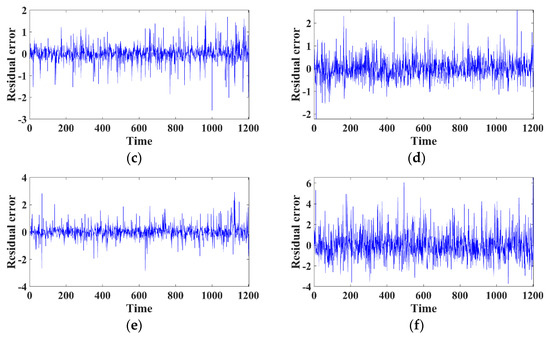
Figure 14.
Residual error for the strain of the pile foundation at different measuring points: (a) measuring point with a depth of −10 m; (b) measuring point with a depth of −20 m; (c) measuring point with a depth of −30 m; (d) measuring point with a depth of −40 m; (e) measuring point with a depth of −50 m; and (f) measuring point with a depth of −60 m.
Figure 14 shows that the residual error of strain at different measuring points was small and that the change was stable, indicating that the established GWR model is effective. The first three-quarters were taken as reference data, and the last quarter was taken as the data to be diagnosed. The diagnosis results of the proposed method are shown in Figure 15. The proposed method exhibits no false detection phenomenon, and the effectiveness of the proposed method is verified from the perspective of misdiagnosis.
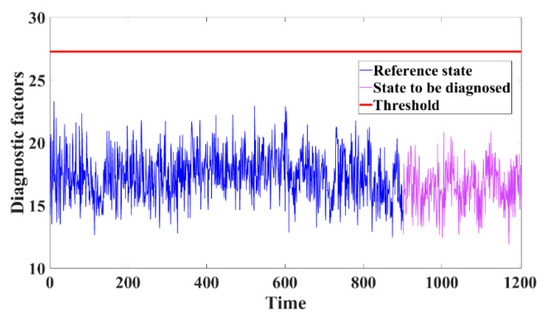
Figure 15.
Diagnosis results of the pile foundation of Fenghuang bridge.
5. Conclusions
To effectively diagnose the structural condition of the pile foundation of bridges, a method for diagnosing the structural condition of bridge pile foundations based on the spatial correlation of high-density strain measurement points was proposed in this paper. The following conclusions were drawn:
- The high-density strain data of the pile foundation can be obtained by using distributed optical fiber sensing technology based on Brillouin scattering, which provides data support for diagnosing the structural condition of bridge pile foundations.
- The results of the numerical simulation and the monitoring data of the pile foundation of an actual bridge showed that the regression model constructed by GWR analysis can effectively reflect the spatial correlation of the strain measurement points of the pile foundation.
- The results of numerical simulation and the monitoring data of an actual bridge showed that the proposed method based on GWR analysis can effectively identify the structural condition of the pile foundation.
- The results of numerical simulation show that the proposed method for identifying the scouring depth based on sliding plane clustering can qualitatively reflect the scouring degree of the pile foundation, and that the difference between the calculated scouring depth and the actual value is approximately 5 m.
Author Contributions
Conceptualization, F.L. and Y.L.; methodology, F.L.; validation, F.L., Q.X. and Y.L.; investigation, F.L.; resources, Y.L.; data curation, Q.X.; writing—original draft preparation, F.L. and Q.X.; writing—review and editing, Y.L.; supervision, Y.L.; project administration, Y.L.; funding acquisition, Y.L. All authors have read and agreed to the published version of the manuscript.
Funding
This research was funded by the Heilongjiang Provincial Key Research & Development Program, grant number GA21A303.
Institutional Review Board Statement
Not applicable.
Informed Consent Statement
Not applicable.
Data Availability Statement
Not applicable.
Conflicts of Interest
The authors declare no conflict of interest.
References
- Wei, K.; Yuan, W.; Bouaanani, N. Experimental and Numerical Assessment of the Three-Dimensional Modal Dynamic Response of Bridge Pile Foundations Submerged in Water. J. Bridge Eng. 2013, 18, 1032–1041. [Google Scholar] [CrossRef]
- Zhang, H.; Chen, S.; Liang, F. Effects of scour-hole dimensions and soil stress history on the behavior of laterally loaded piles in soft clay under scour conditions. Comput. Geotech. 2017, 84, 198–209. [Google Scholar] [CrossRef]
- Lin, Y.; Lin, C. Effects of scour-hole dimensions on lateral behavior of piles in sands. Comput. Geotech. 2019, 111, 30–41. [Google Scholar] [CrossRef]
- Jiang, W.; Lin, C. Scour effects on vertical effective stresses and lateral responses of pile groups in sands. Ocean Eng. 2021, 229, 109017. [Google Scholar] [CrossRef]
- Zhang, X.; Tang, L.; Ling, X.; Chan, A.H.C.; Lu, J. Using peak ground velocity to characterize the response of soil-pile system in liquefying ground. Eng. Geol. 2018, 240, 62–73. [Google Scholar] [CrossRef]
- Garala, T.K.; Madabhushi, G.S.P. Role of Pile Spacing on Dynamic Behavior of Pile Groups in Layered Soils. J. Geotech. Geoenviron. Eng. 2021, 147, 04021005. [Google Scholar] [CrossRef]
- Li, C.-H.; Lin, M.-L.; Huang, W.-C. Interaction between pile groups and thrust faults in a physical sandbox and numerical analysis. Eng. Geol. 2019, 252, 65–77. [Google Scholar] [CrossRef]
- Xie, W.; Sun, L. Experimental and numerical investigations on transverse seismic responses of soil-cable-stayed-bridge system subjected to transverse near-fault ground motions. Eng. Struct. 2021, 226. [Google Scholar] [CrossRef]
- Zheng, G.; Zhang, W.; Zhou, H.; Yang, P. Multivariate adaptive regression splines model for prediction of the liquefaction-induced settlement of shallow foundations. Soil Dyn. Earthq. Eng. 2020, 132, 106097. [Google Scholar] [CrossRef]
- Yu, J.; Zhou, J.; Gong, X.; Xu, R.; Li, J.; Xu, S. Centrifuge study on behavior of rigid pile composite foundation under embankment in soft soil. Acta Geotech. 2021, 16, 1909–1921. [Google Scholar] [CrossRef]
- Varghese, R.; Boominathan, A.; Banerjee, S. Investigation of pile-induced filtering of seismic ground motion considering embedment effect. Earthq. Eng. Struct. Dyn. 2021, 50, 3201–3219. [Google Scholar] [CrossRef]
- Naghibi, F.; Fenton, G.; Griffiths, D. Serviceability limit state design of deep foundations. Géotechnique 2014, 64, 787–799. [Google Scholar] [CrossRef]
- You, Y.; Wang, J.; Wu, Q.; Yu, Q.; Pan, X.; Wang, X.; Guo, L. Causes of pile foundation failure in permafrost regions: The case study of a dry bridge of the Qinghai-Tibet Railway. Eng. Geol. 2017, 230, 95–103. [Google Scholar] [CrossRef]
- Gao, Q.; Wen, Z.; Zhou, Z.; Brouchkov, A.; Wang, D.; Shi, R. A creep model of pile-frozen soil interface considering damage effect and ice effect. Int. J. Damage Mech. 2021. [Google Scholar] [CrossRef]
- Pal, A.S.; Baidya, D.K. Dynamic Analysis of Pile Foundation Embedded in Homogeneous Soil Using Cone Model. J. Geotech. Geoenviron. Eng. 2018, 144, 06018007. [Google Scholar] [CrossRef]
- Leung, Y.; Lo, M. Probabilistic assessment of pile group response considering superstructure stiffness and three-dimensional soil spatial variability. Comput. Geotech. 2018, 103, 193–200. [Google Scholar] [CrossRef]
- Ai, Z.Y.; Li, P.C.; Song, X.; Shi, B.K. Analysis of an axially loaded pile in saturated multi-layered soils with anisotropic permeability and elastic superstrata. Comput. Geotech. 2018, 98, 93–101. [Google Scholar] [CrossRef]
- Park, H.-J.; Ko, K.-W.; Song, Y.-H.; Song, M.-J.; Jin, S.; Ha, J.-G.; Kim, D.-S. Centrifuge modeling of disconnected piled raft using vertical pushover tests. Acta Geotech. 2020, 15, 2637–2648. [Google Scholar] [CrossRef]
- Zhao, Z.; Ye, S.; Zhu, Y.; Tao, H.; Chen, C. Scale model test study on negative skin friction of piles considering the collapsibility of loess. Acta Geotech. 2021. [Google Scholar] [CrossRef]
- Kitiyodom, P.; Matsumoto, T. A simplified analysis method for piled raft and pile group foundations with batter piles. Int. J. Numer. Anal. Methods Géoméch. 2002, 26, 1349–1369. [Google Scholar] [CrossRef]
- Nguyen, V.; Hassen, G.; de Buhan, P. A multiphase approach for evaluating the horizontal and rocking impedances of pile group foundations. Int. J. Numer. Anal. Methods Géoméch. 2016, 40, 1454–1471. [Google Scholar] [CrossRef]
- Sheil, B.B.; McCabe, B.A.; Comodromos, E.M.; Lehane, B. Pile groups under axial loading: An appraisal of simplified non-linear prediction models. Géotechnique 2019, 69, 565–579. [Google Scholar] [CrossRef]
- Li, Y.; Zhang, W. Investigation on passive pile responses subject to adjacent tunnelling in anisotropic clay. Comput. Geotech. 2020, 127, 103782. [Google Scholar] [CrossRef]
- Peng, W.; Zhao, M.; Zhao, H.; Yang, C. A two-pile foundation model in sloping ground by finite beam element method. Comput. Geotech. 2020, 122, 103503. [Google Scholar] [CrossRef]
- Moayedi, H.; Raftari, M.; Sharifi, A.; Jusoh, W.A.W.; Rashid, A.S.A. Optimization of ANFIS with GA and PSO estimating alpha ratio in driven piles. Eng. Comput.-Germany 2020, 36, 227–238. [Google Scholar] [CrossRef]
- Liu, J.; Shi, C.; Cao, C.; Lei, M.; Wang, Z. Improved analytical method for pile response due to foundation pit excavation. Comput. Geotech. 2020, 123, 103609. [Google Scholar] [CrossRef]
- Aly, A.M.; Dougherty, E. Bridge pier geometry effects on local scour potential: A comparative study. Ocean Eng. 2021, 234, 109326. [Google Scholar] [CrossRef]
- Sheil, B. Numerical simulations of the reuse of piled raft foundations in clay. Acta Geotech. 2017, 12, 1047–1059. [Google Scholar] [CrossRef][Green Version]
- Sharafkhah, M.; Shooshpasha, I. Physical modeling of behaviors of cast-in-place concrete piled raft compared to free-standing pile group in sand. J. Rock Mech. Geotech. Eng. 2018, 10, 703–716. [Google Scholar] [CrossRef]
- Gerolymos, N.; Giannakos, S.; Drosos, V. Generalised failure envelope for laterally loaded piles: Analytical formulation, numerical verification and experimental validation. Geotechnique 2020, 70, 248–267. [Google Scholar] [CrossRef]
- Ma, L.; Yang, K.; Yuan, W.; Li, L.; Wei, Y.; Ma, C.; Luo, F.; Zhang, G. Centrifuge modeling of the pile foundation reinforcement on slopes subjected to uneven settlement. Bull. Eng. Geol. Environ. 2020, 79, 2647–2658. [Google Scholar] [CrossRef]
- Liu, J.; Wan, Z.; Dai, X.; Jeng, D.; Zhao, Y. Experimental Study on Whole Wind Power Structure with Innovative Open-Ended Pile Foundation under Long-Term Horizontal Loading. Sensors 2020, 20, 5348. [Google Scholar] [CrossRef] [PubMed]
- Liu, Y.; Li, H.; Wang, Y.; Men, Y.; Xu, Q. Damage detection of tunnel based on the high-density cross-sectional curvature obtained using strain data from BOTDA sensors. Mech. Syst. Signal Process. 2021, 158, 107728. [Google Scholar] [CrossRef]
- Zhang, S.; Liu, Y. Damage detection of bridges monitored within one cluster based on the residual between the cumulative distribution functions of strain monitoring data. Struct. Health Monit. 2020, 19, 1764–1789. [Google Scholar] [CrossRef]
- Cao, J.; Liu, Y.; Li, C. Damage cross detection between bridges monitored within one cluster using the difference ratio of projected strain monitoring data. Struct. Health Monit. 2021. [Google Scholar] [CrossRef]
- Shu, Y.; Wu, J.; Zhou, S.; Wang, J.; Wang, W. Pile damage identification method for high-pile wharfs based on axial static strain distribution. Measurement 2021, 180, 109607. [Google Scholar] [CrossRef]
- Vélez, W.; Matta, F.; Ziehl, P. Acoustic emission monitoring of early corrosion in prestressed concrete piles. Struct. Control. Health Monit. 2014, 22, 873–887. [Google Scholar] [CrossRef]
- Kim, Y.-M.; Han, G.; Kim, H.; Oh, T.-M.; Kim, J.-S.; Kwon, T.-H. An Integrated Approach to Real-Time Acoustic Emission Damage Source Localization in Piled Raft Foundations. Appl. Sci. 2020, 10, 8727. [Google Scholar] [CrossRef]
- Chen, B.; Yang, Y.; Zhou, J.; Zhuang, Y.; McFarland, M. Damage detection of underwater foundation of a Chinese ancient stone arch bridge via sonar-based techniques. Measurement 2020, 169, 108283. [Google Scholar] [CrossRef]
- Dackermann, U.; Yu, Y.; Niederleithinger, E.; Li, J.; Wiggenhauser, H. Condition Assessment of Foundation Piles and Utility Poles Based on Guided Wave Propagation Using a Network of Tactile Transducers and Support Vector Machines. Sensors 2017, 17, 2938. [Google Scholar] [CrossRef]
- Gelman, L.; Kırlangıç, A.S. Novel vibration structural health monitoring technology for deep foundation piles by non-stationary higher order frequency response function. Struct. Control. Health Monit. 2020, 27. [Google Scholar] [CrossRef]
- Chen, X.; Niu, X.; Xu, Q.; Qiu, Z.; Lu, G.; Xie, A. Method for Monitoring Scour Depth of Pile Foundations Based on Modal Identification. Smart Mater. Struct. 2021. [Google Scholar] [CrossRef]
- Feng, Q.; Kong, Q.; Song, G. Damage detection of concrete piles subject to typical damage types based on stress wave measurement using embedded smart aggregates transducers. Measurement 2016, 88, 345–352. [Google Scholar] [CrossRef]
- Acikgoz, S.; Pelecanos, L.; Giardina, G.; Aitken, J.; Soga, K. Distributed sensing of a masonry vault during nearby piling. Struct. Control. Health Monit. 2016, 24, e1872. [Google Scholar] [CrossRef]
- Cao, X.; Li, J. A shear damage model of the interface between soil and sulfate-corroded concrete. Constr. Build. Mater. 2021, 293, 123450. [Google Scholar] [CrossRef]
- Sun, Y.; Li, X.; Ren, C.; Xu, H.; Han, A. Distributed Fiber Optic Sensing and Data Processing of Axial Loaded Precast Piles. IEEE Access 2020, 8, 169136–169145. [Google Scholar] [CrossRef]
- Pang, C.; Hua, Z.; Zhou, D.; Zhang, H.; Chen, L.; Bao, X.; Dong, Y.K. Opto-mechanical time-domain analysis based on coherent forward stimulated Brillouin scattering probing. Optica 2020, 7, 176. [Google Scholar] [CrossRef]
Publisher’s Note: MDPI stays neutral with regard to jurisdictional claims in published maps and institutional affiliations. |
© 2021 by the authors. Licensee MDPI, Basel, Switzerland. This article is an open access article distributed under the terms and conditions of the Creative Commons Attribution (CC BY) license (https://creativecommons.org/licenses/by/4.0/).