
Assessment of Seasonal Variability of Extreme Temperature in Mainland China under Climate Change


Abstract
:1. Introduction
2. Data and Methodology
2.1. Data
2.2. Methodology
2.2.1. Seasonal Trend Analysis of Extreme Air Temperature
2.2.2. Extreme Air Temperature Indices
3. Results
3.1. Seasonal Trends in Temperature
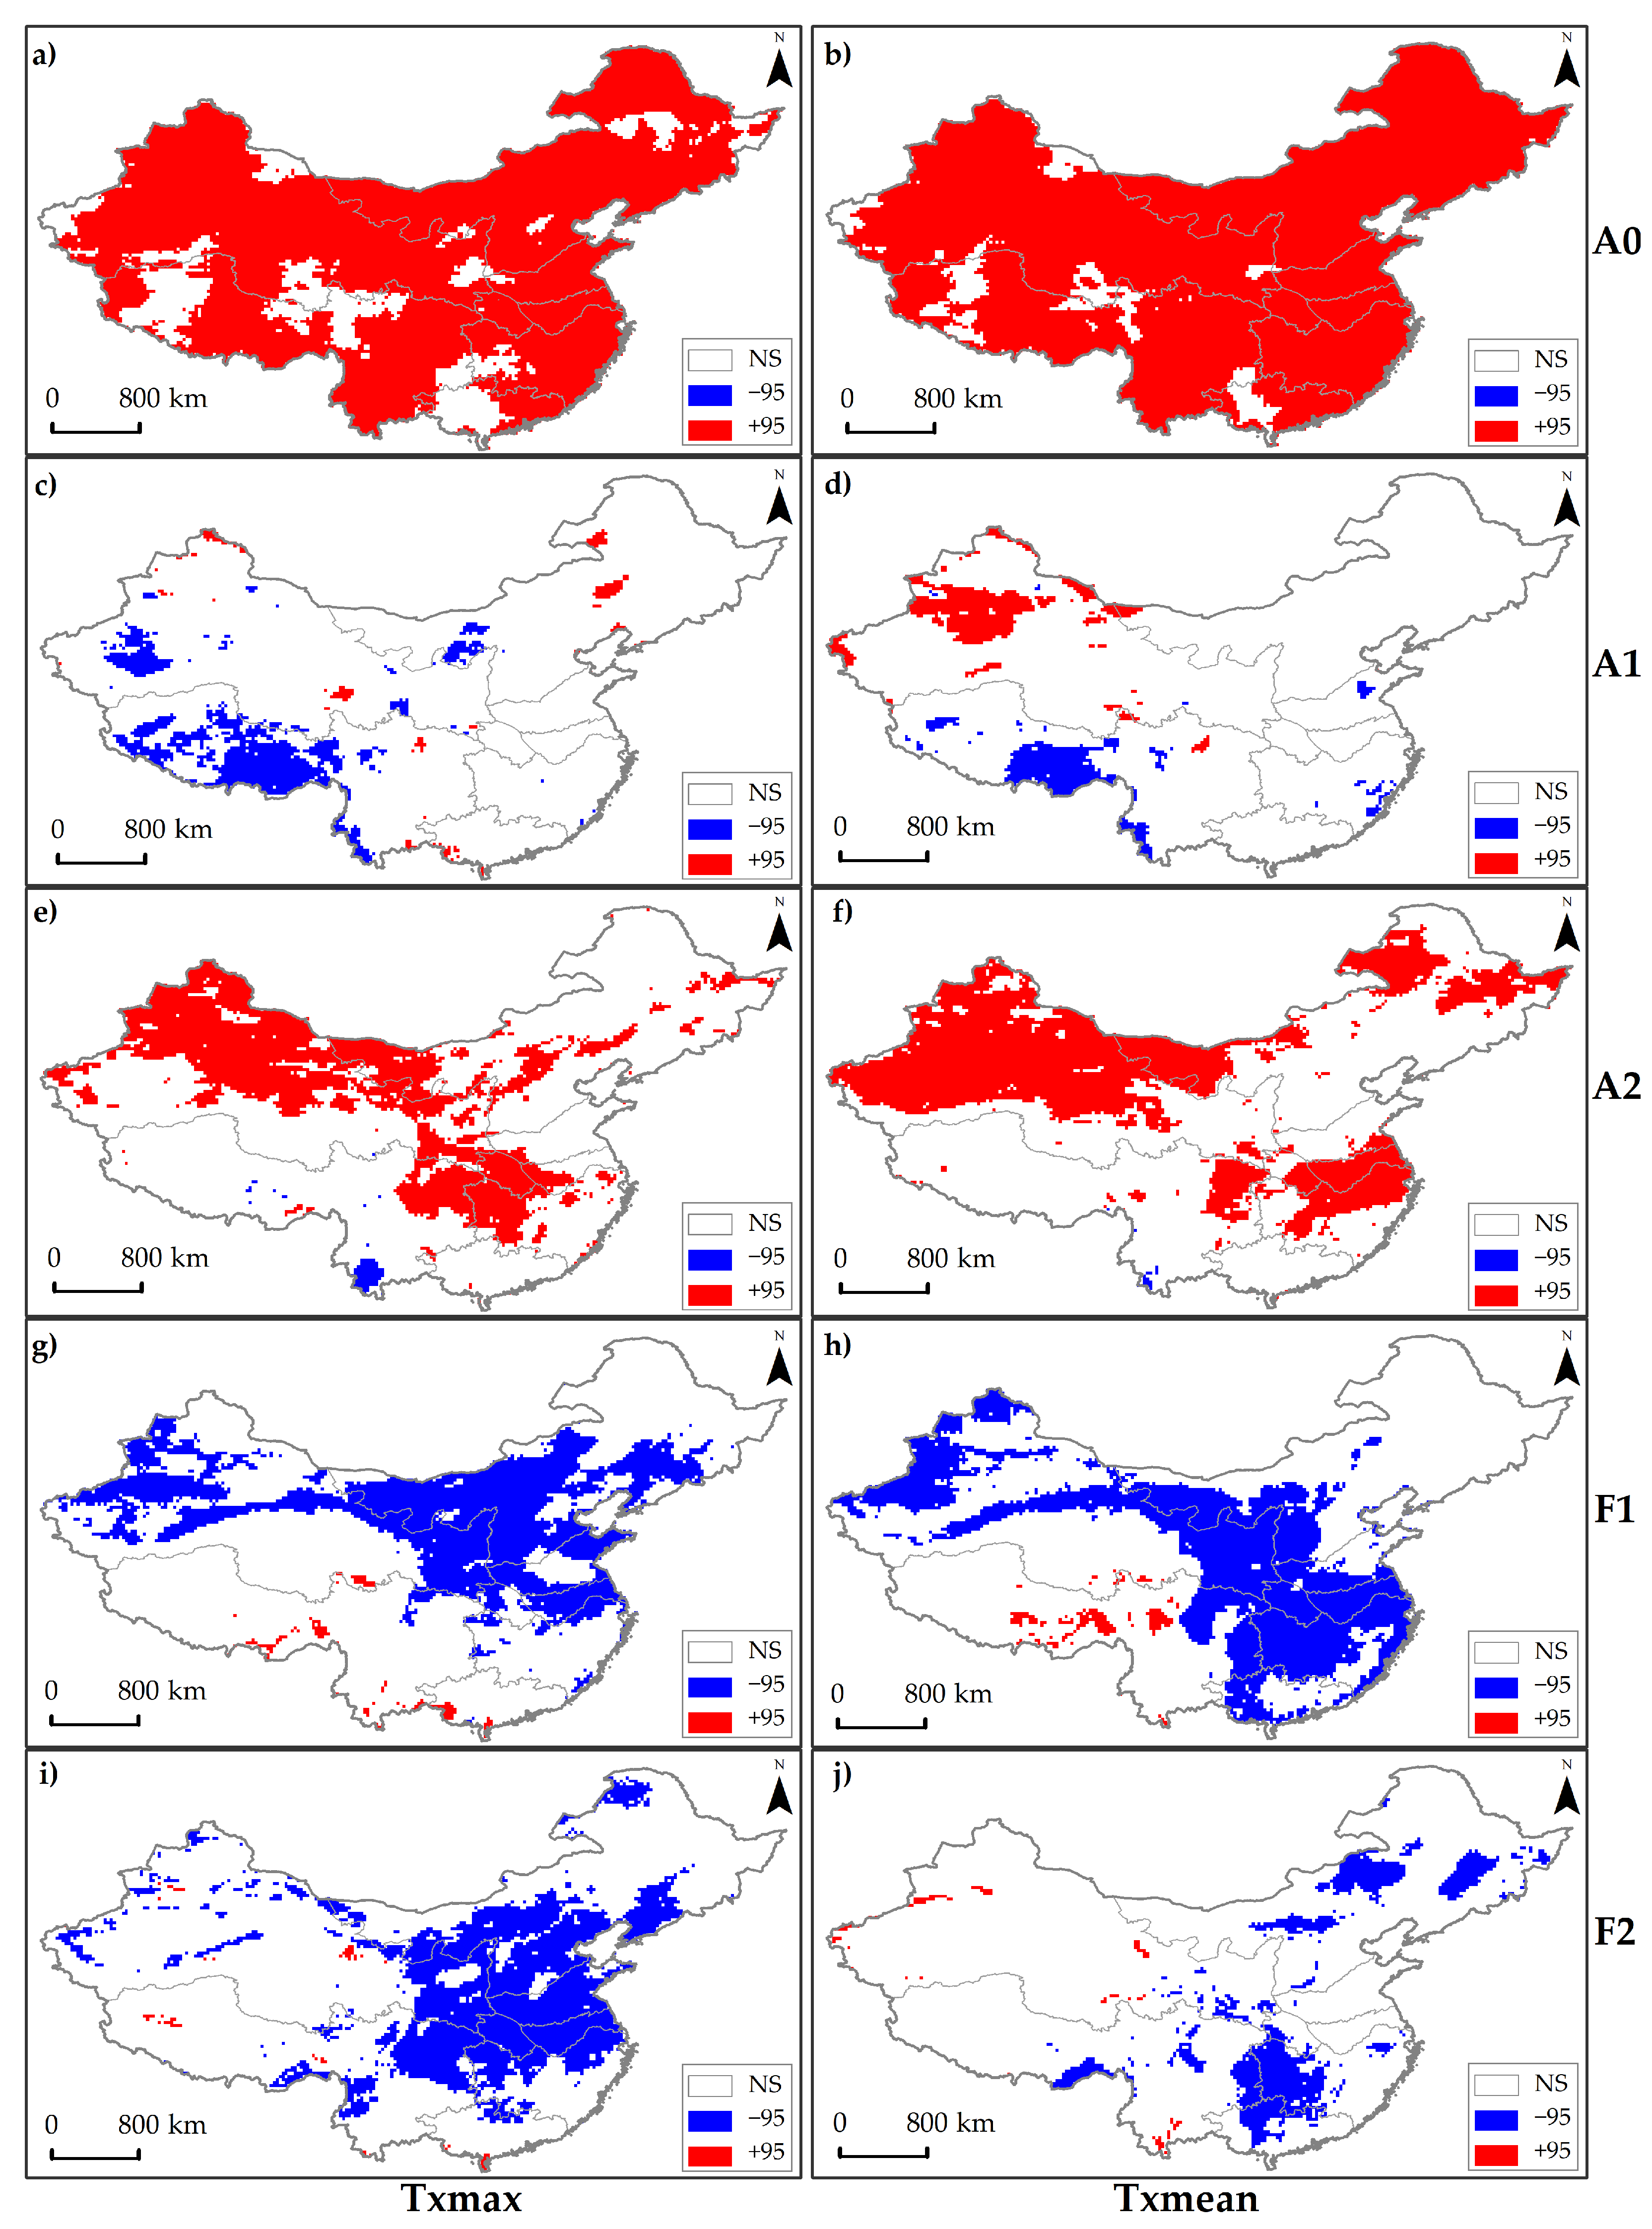
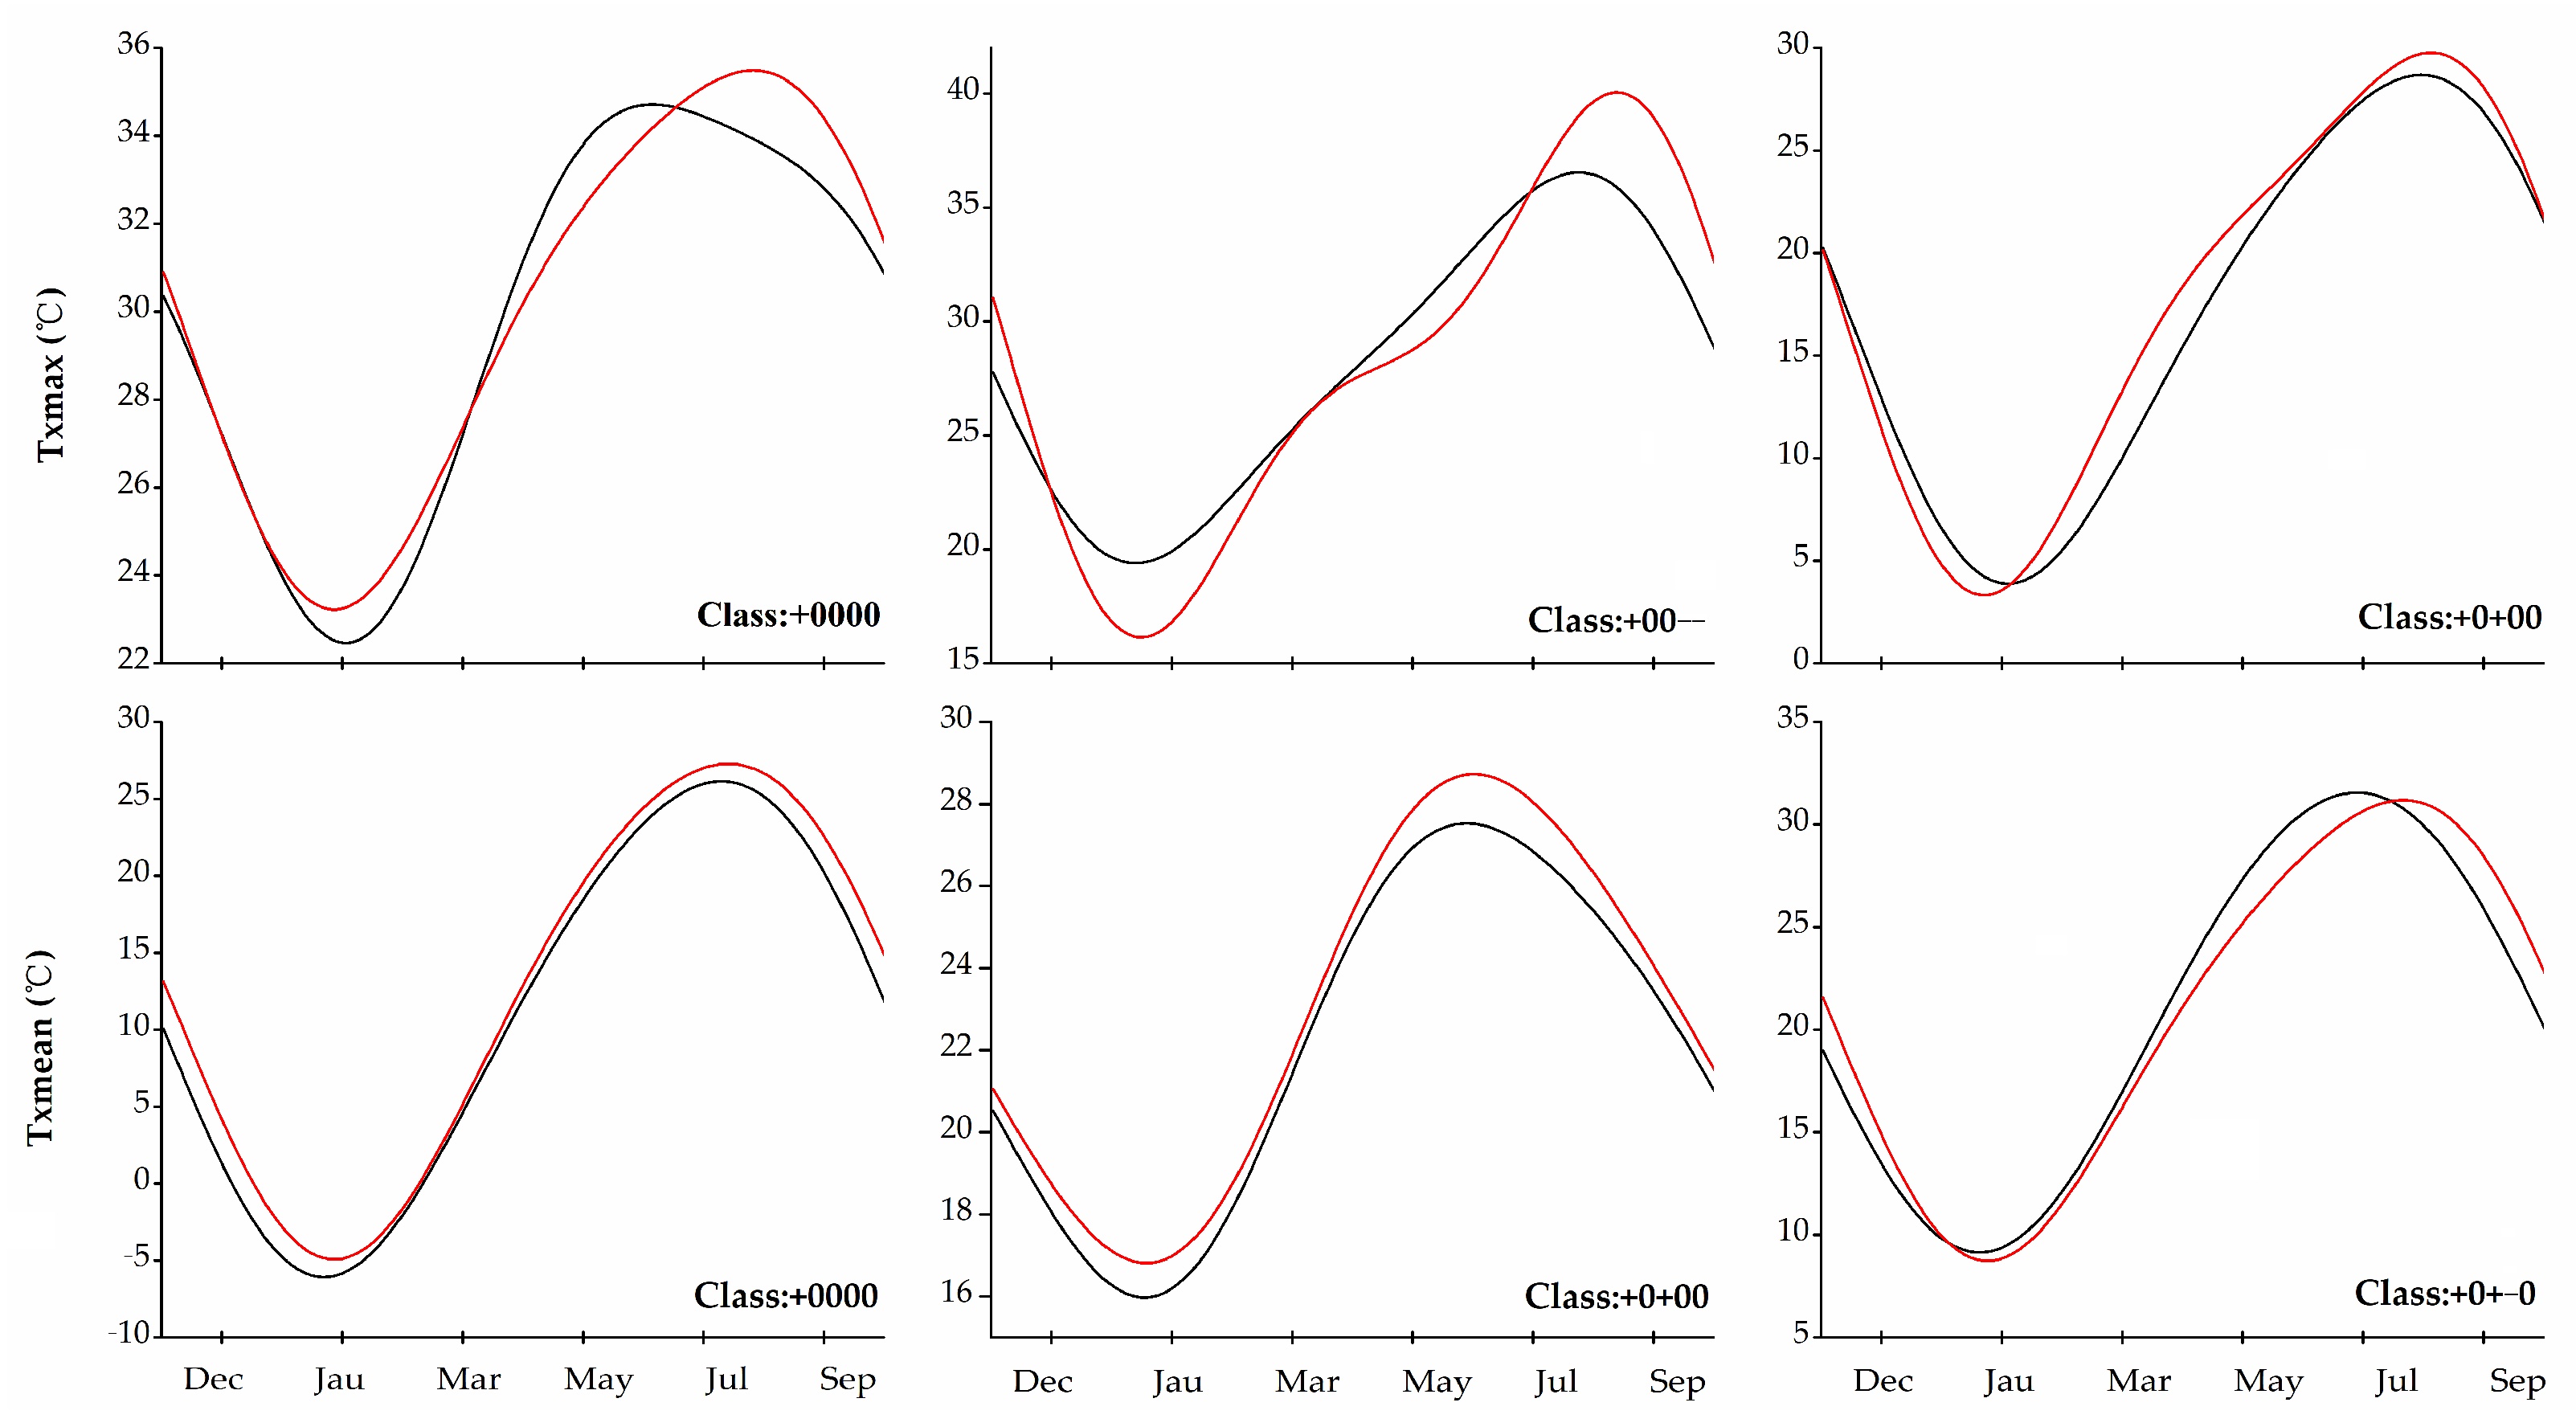
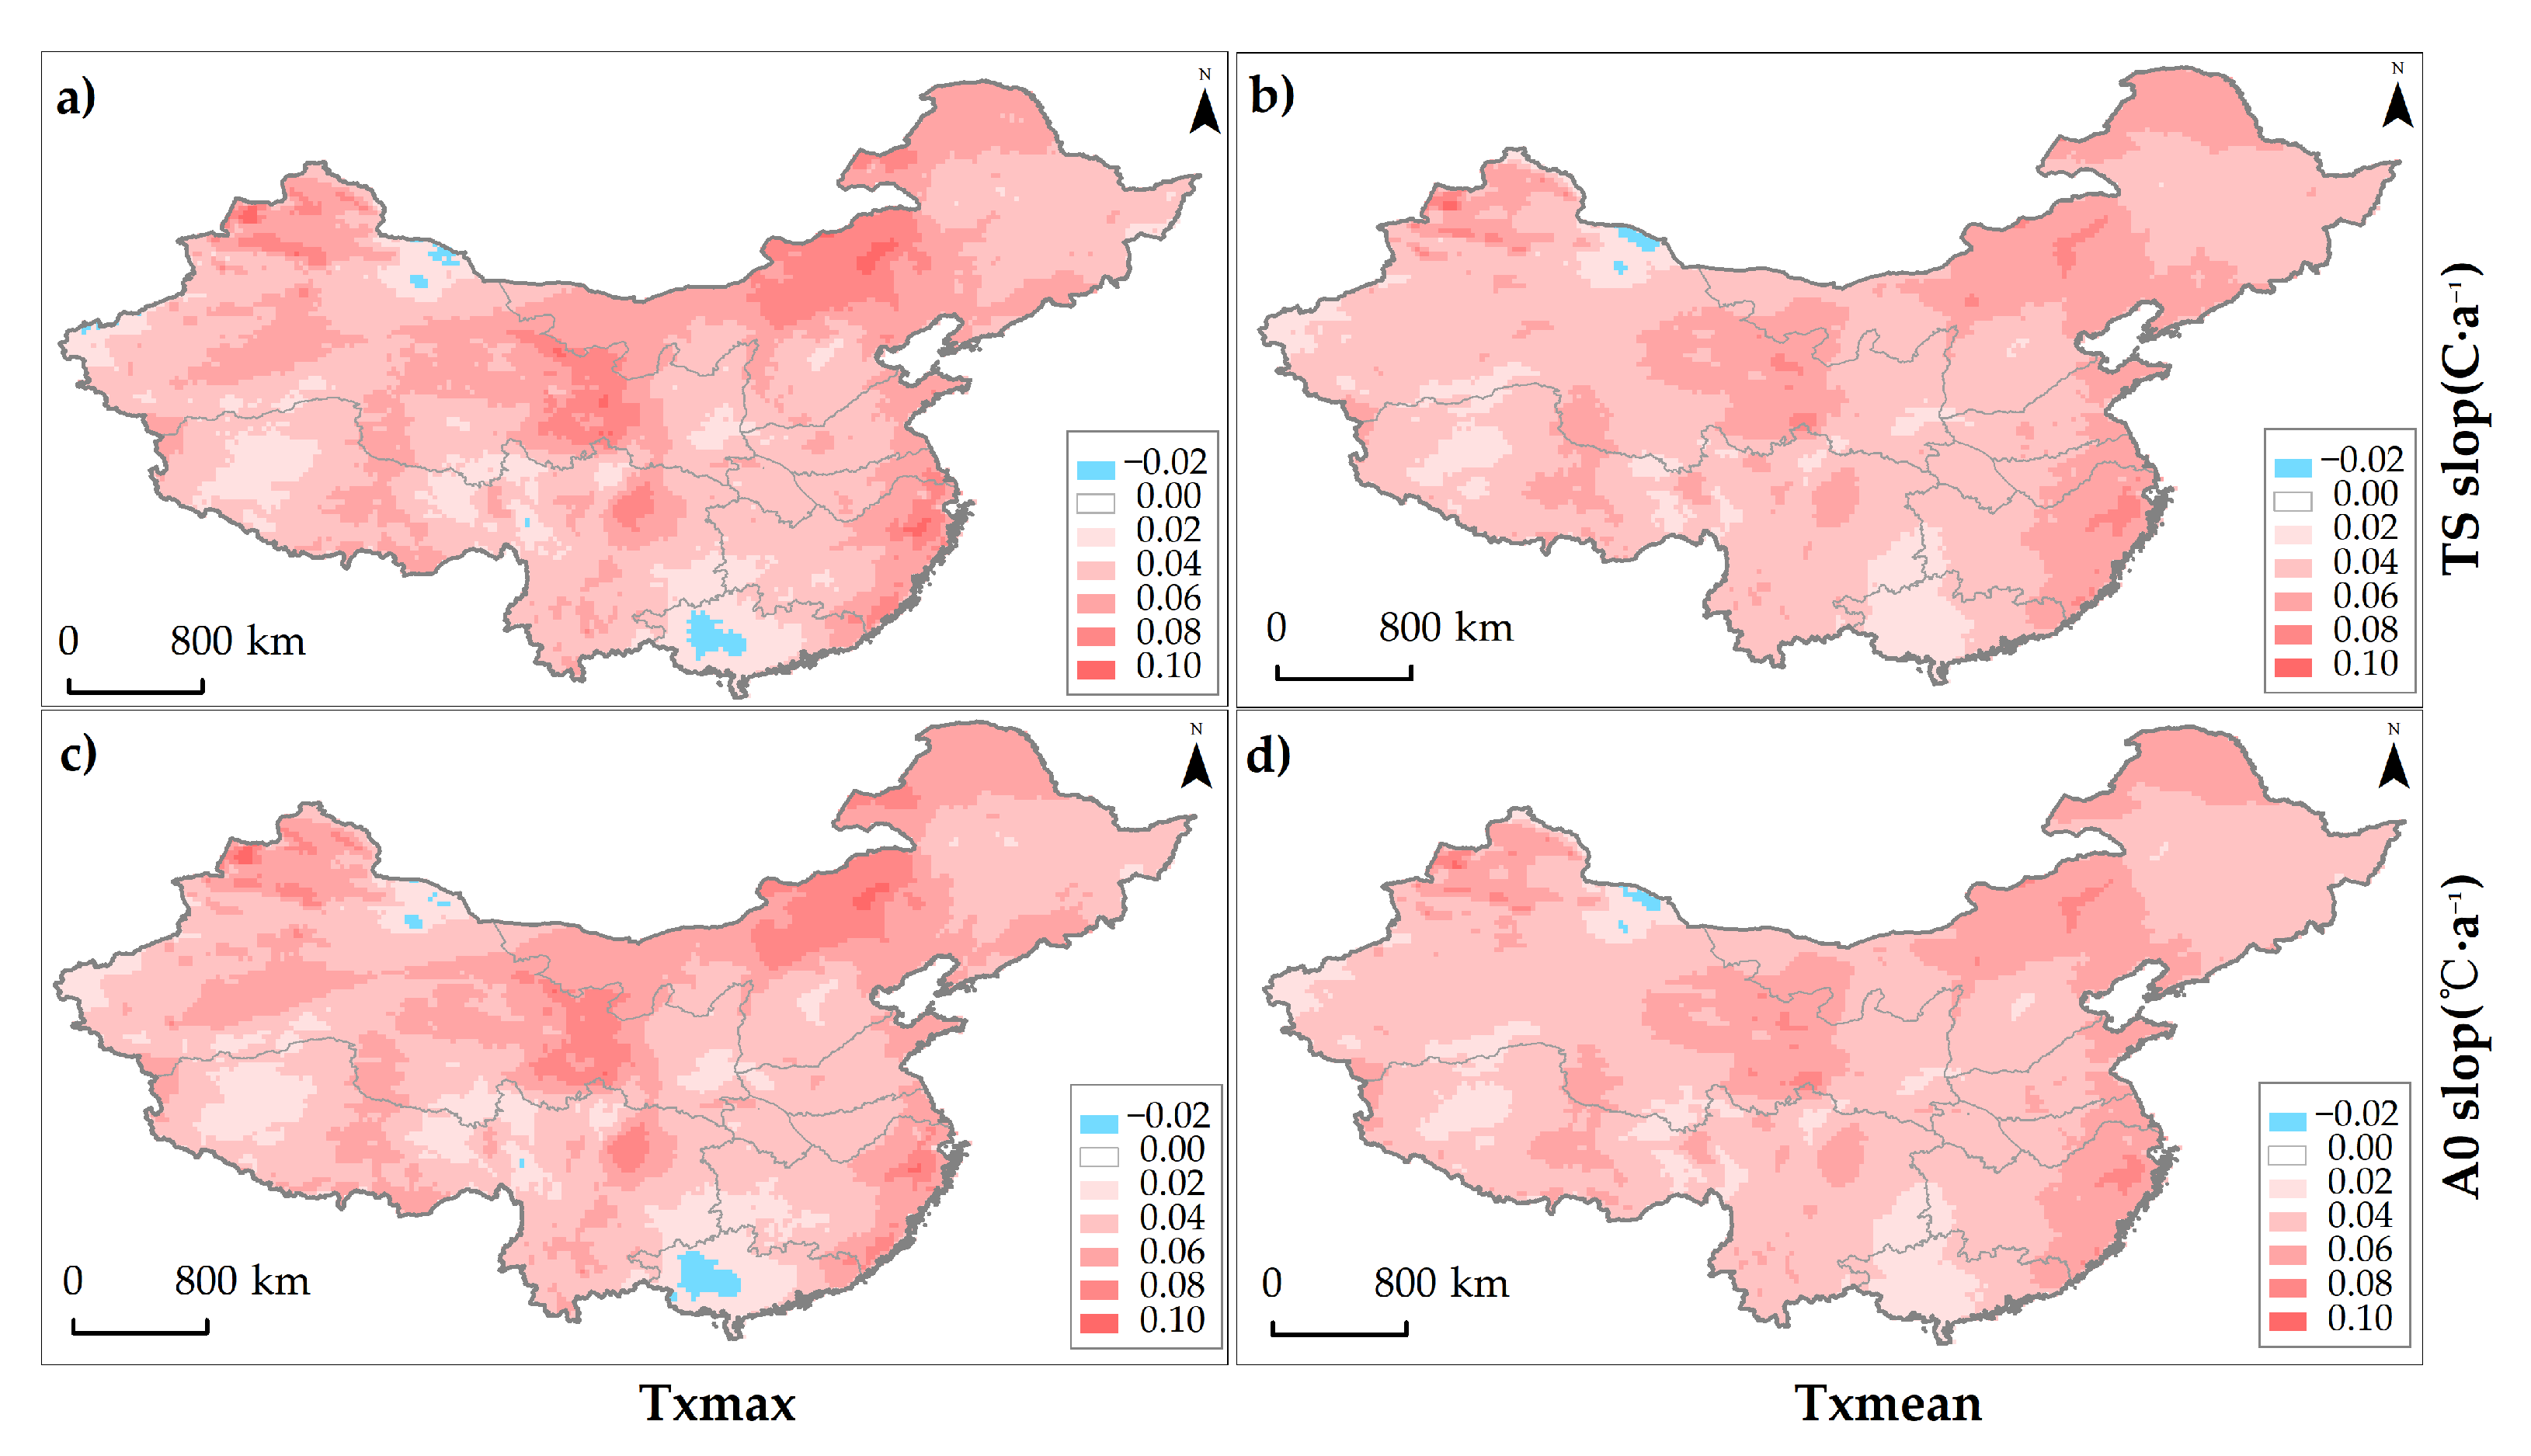
3.1.1. Maximum Temperature
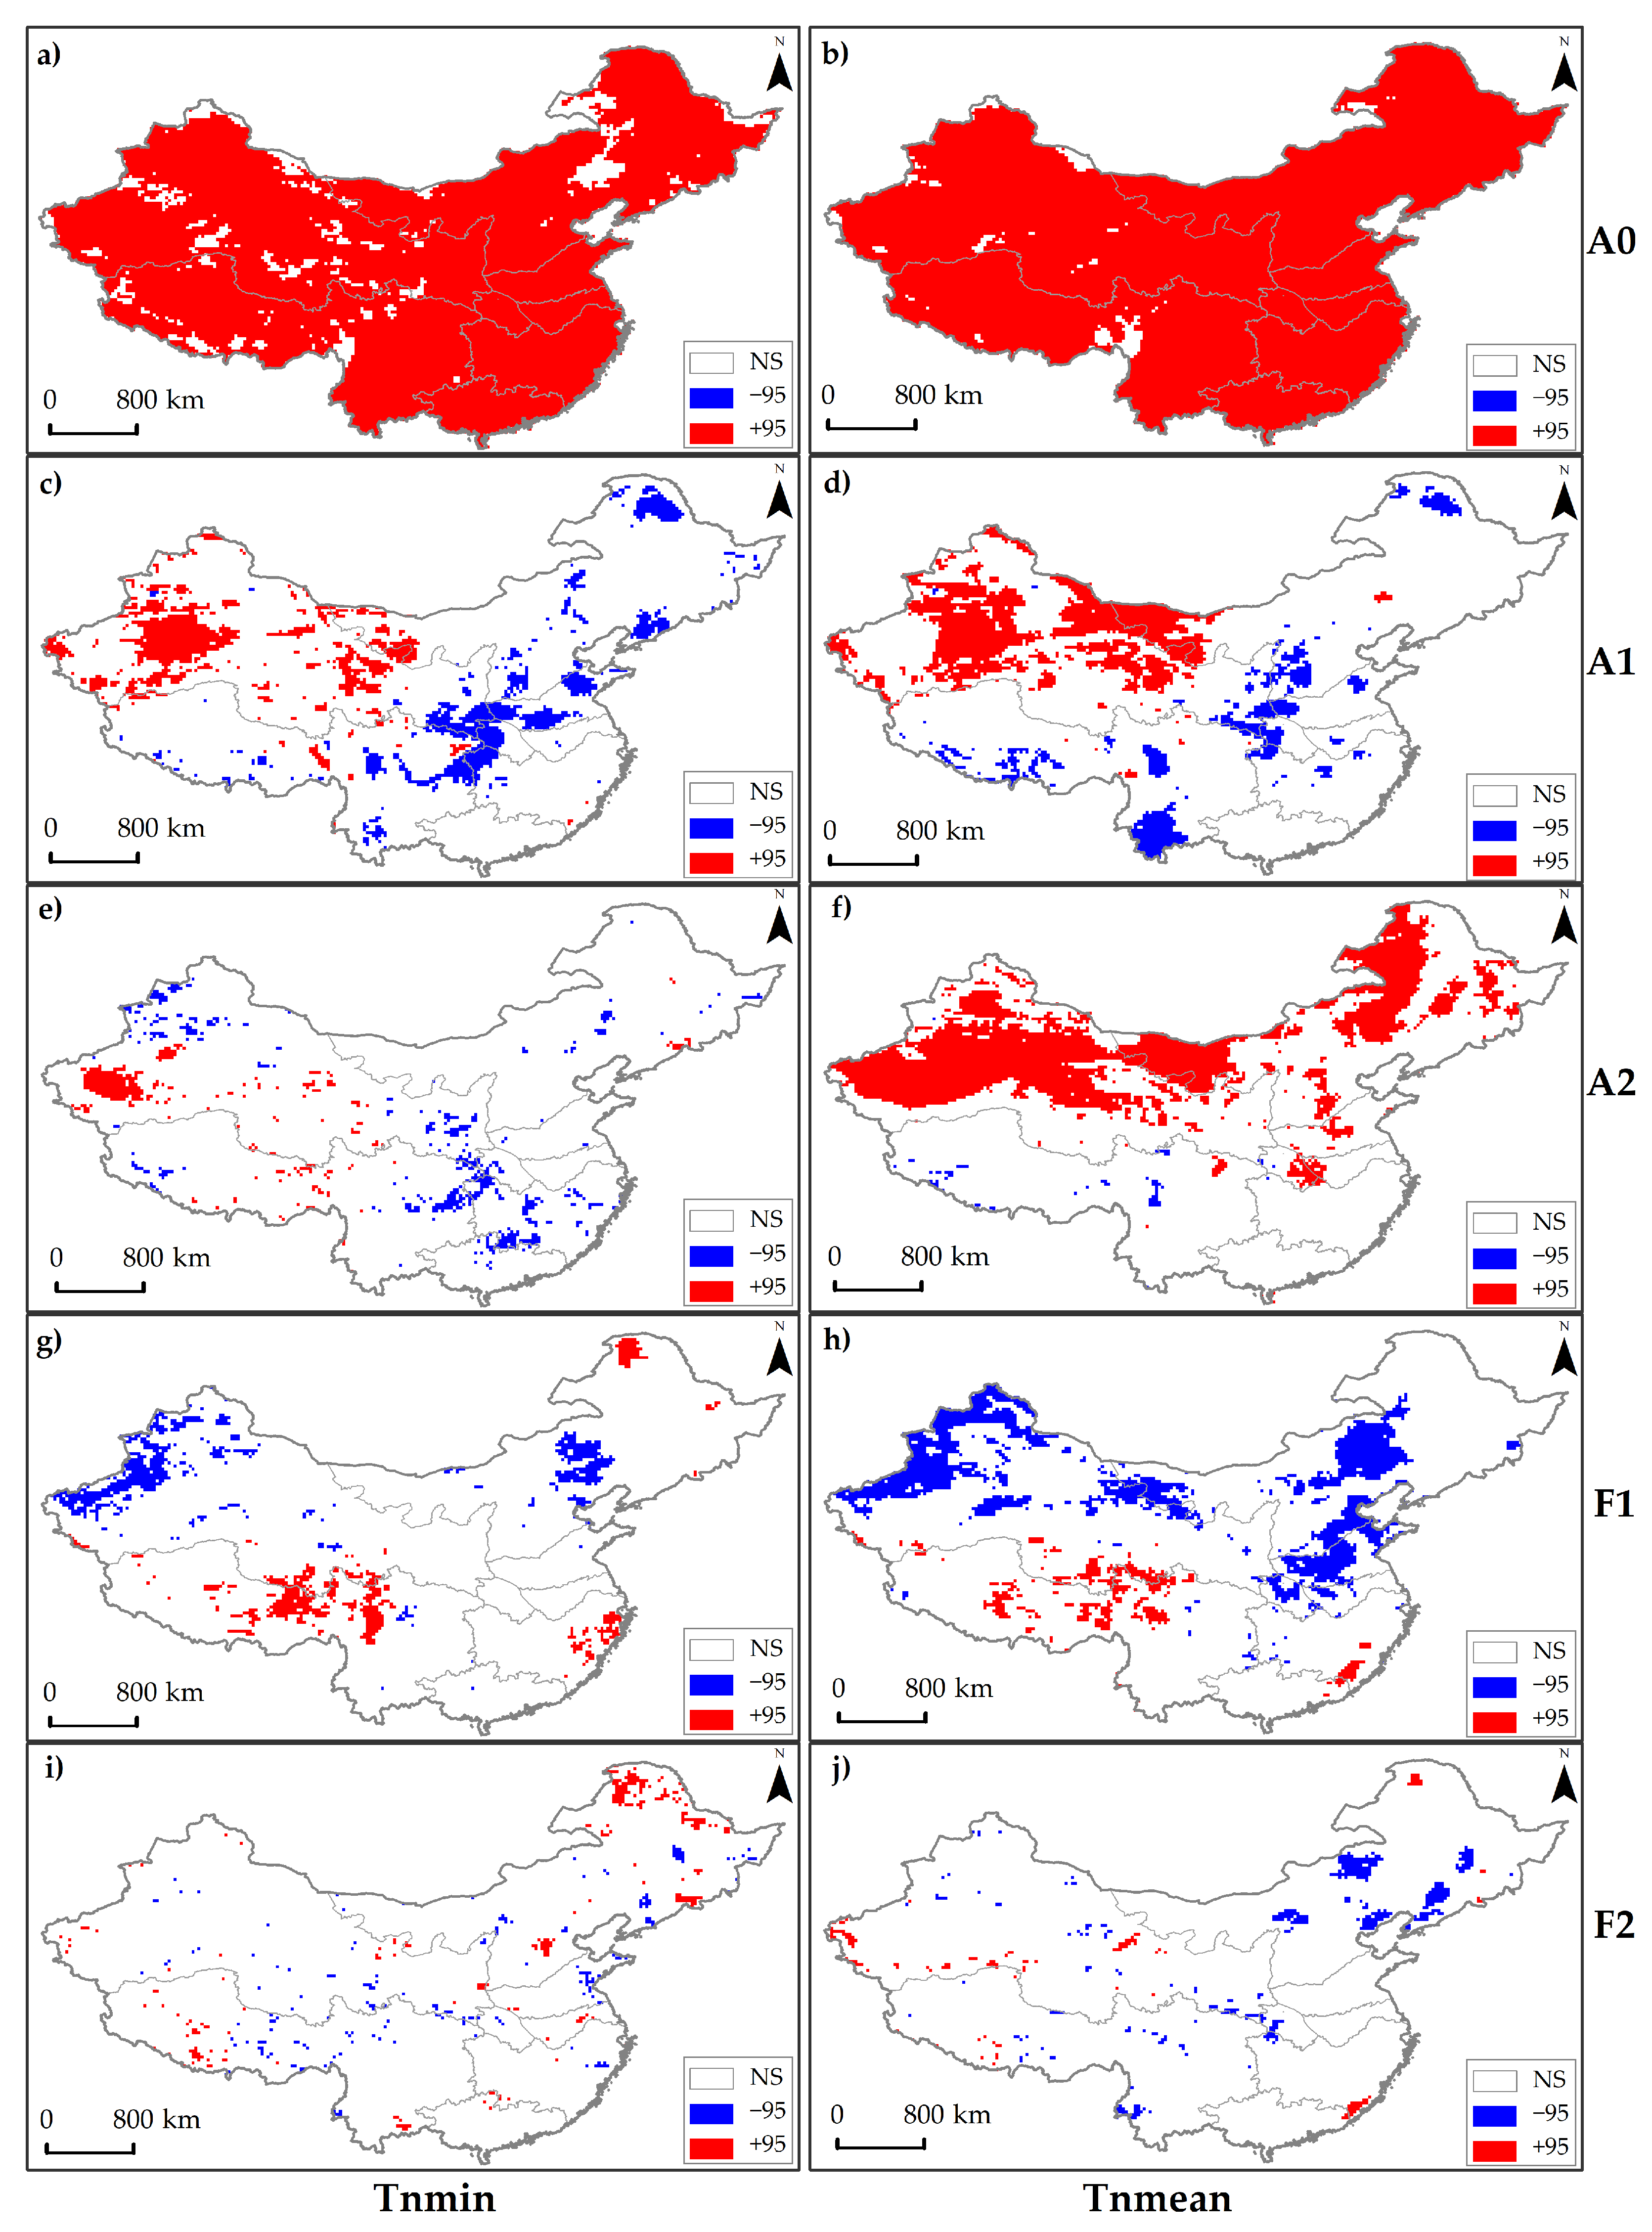
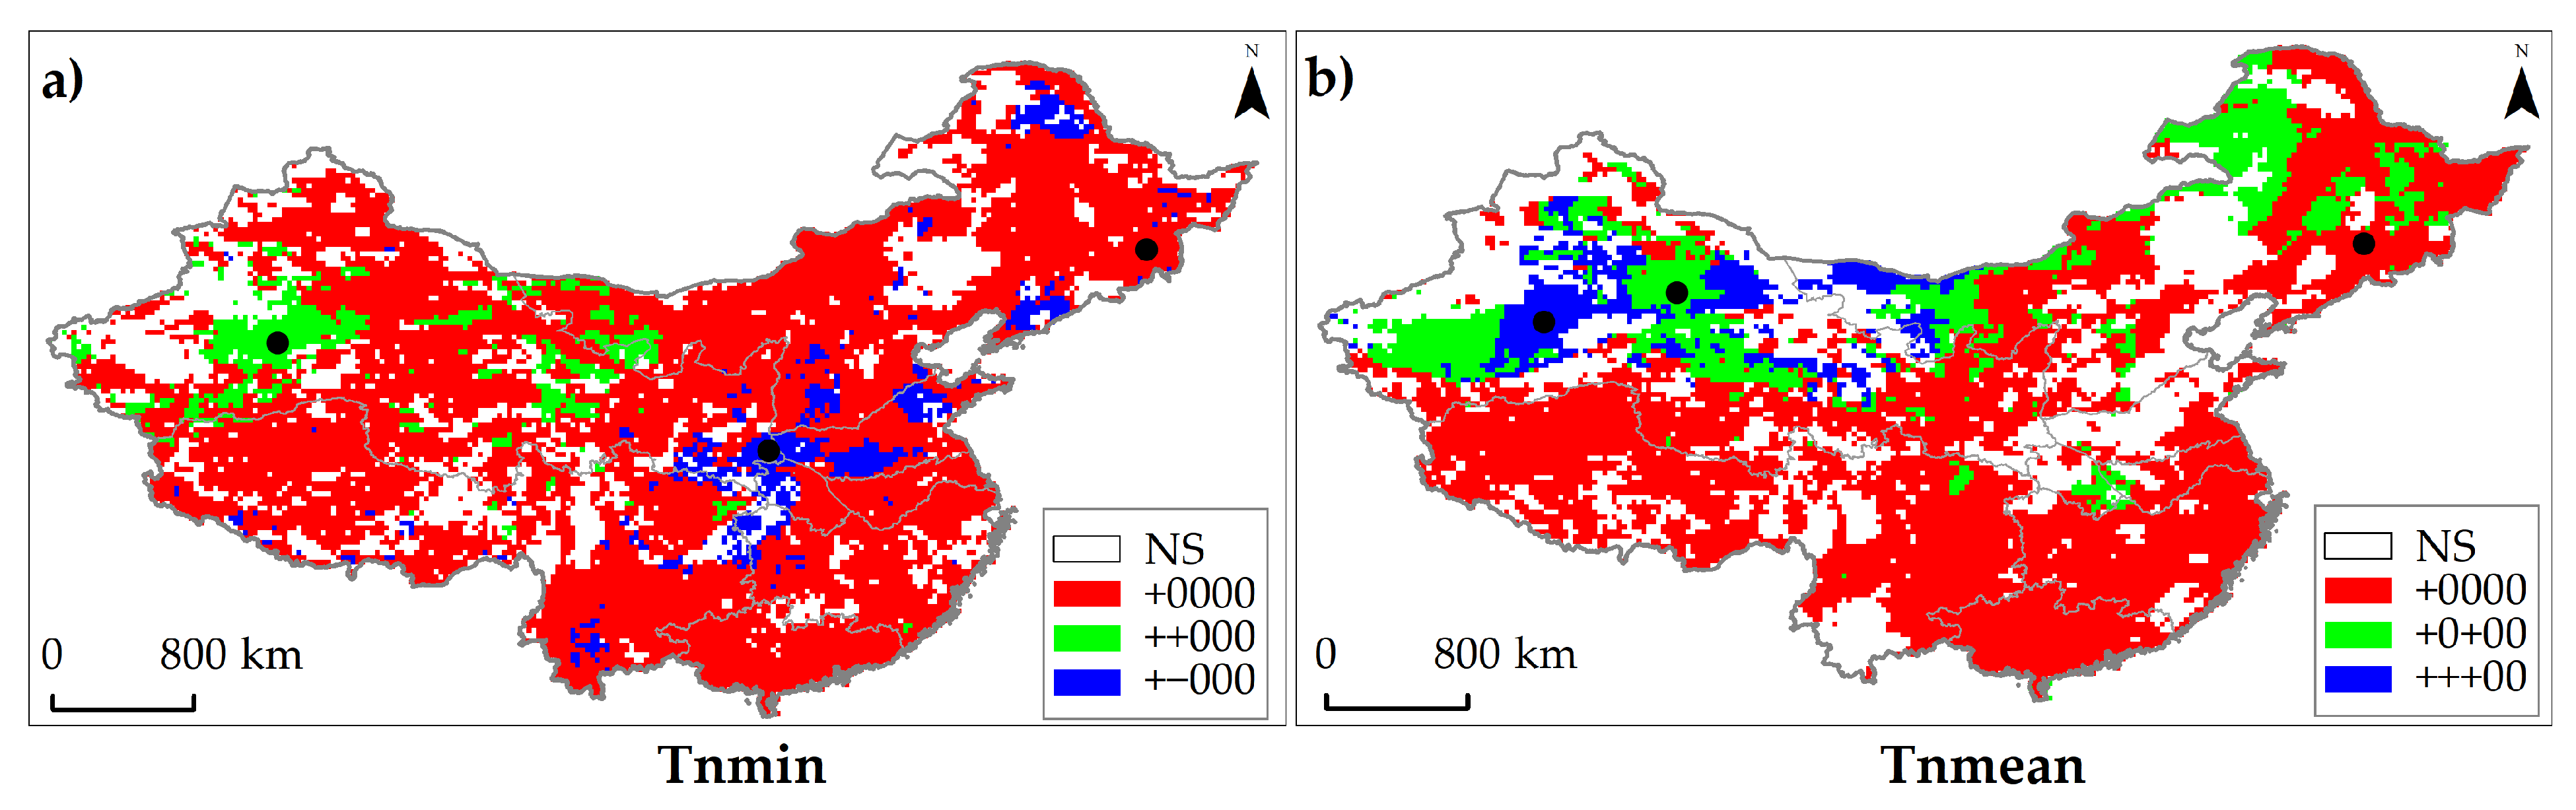
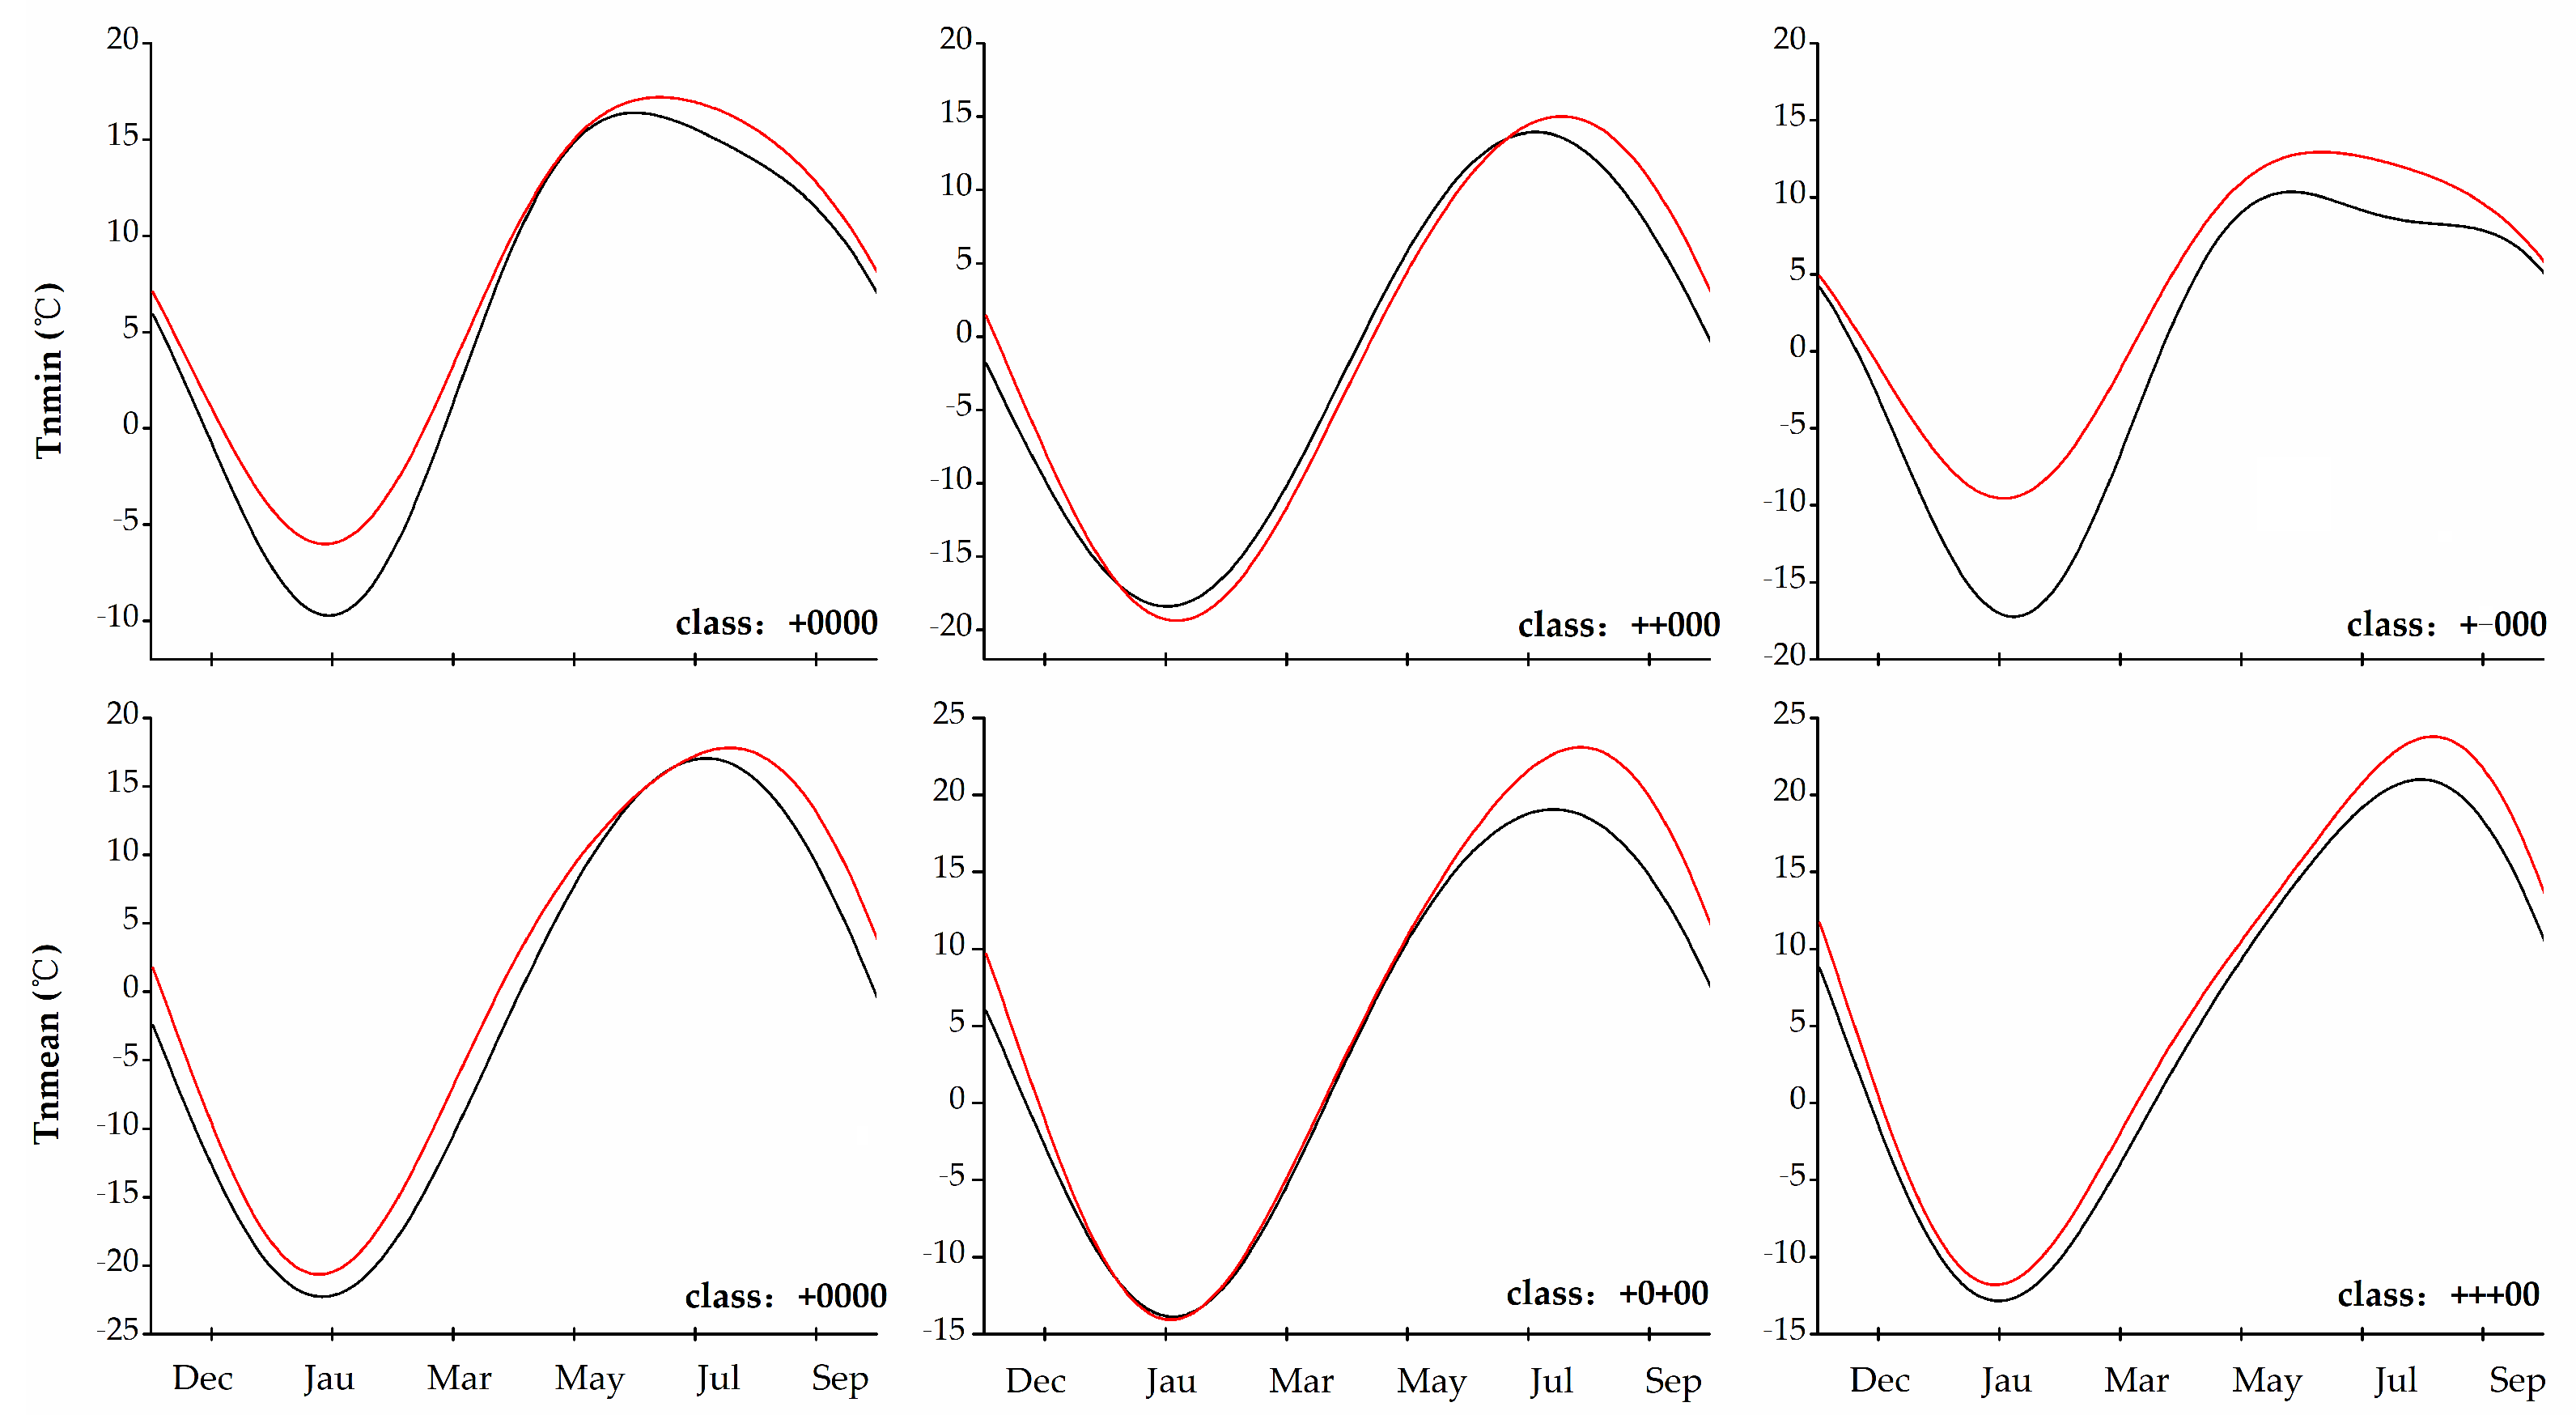
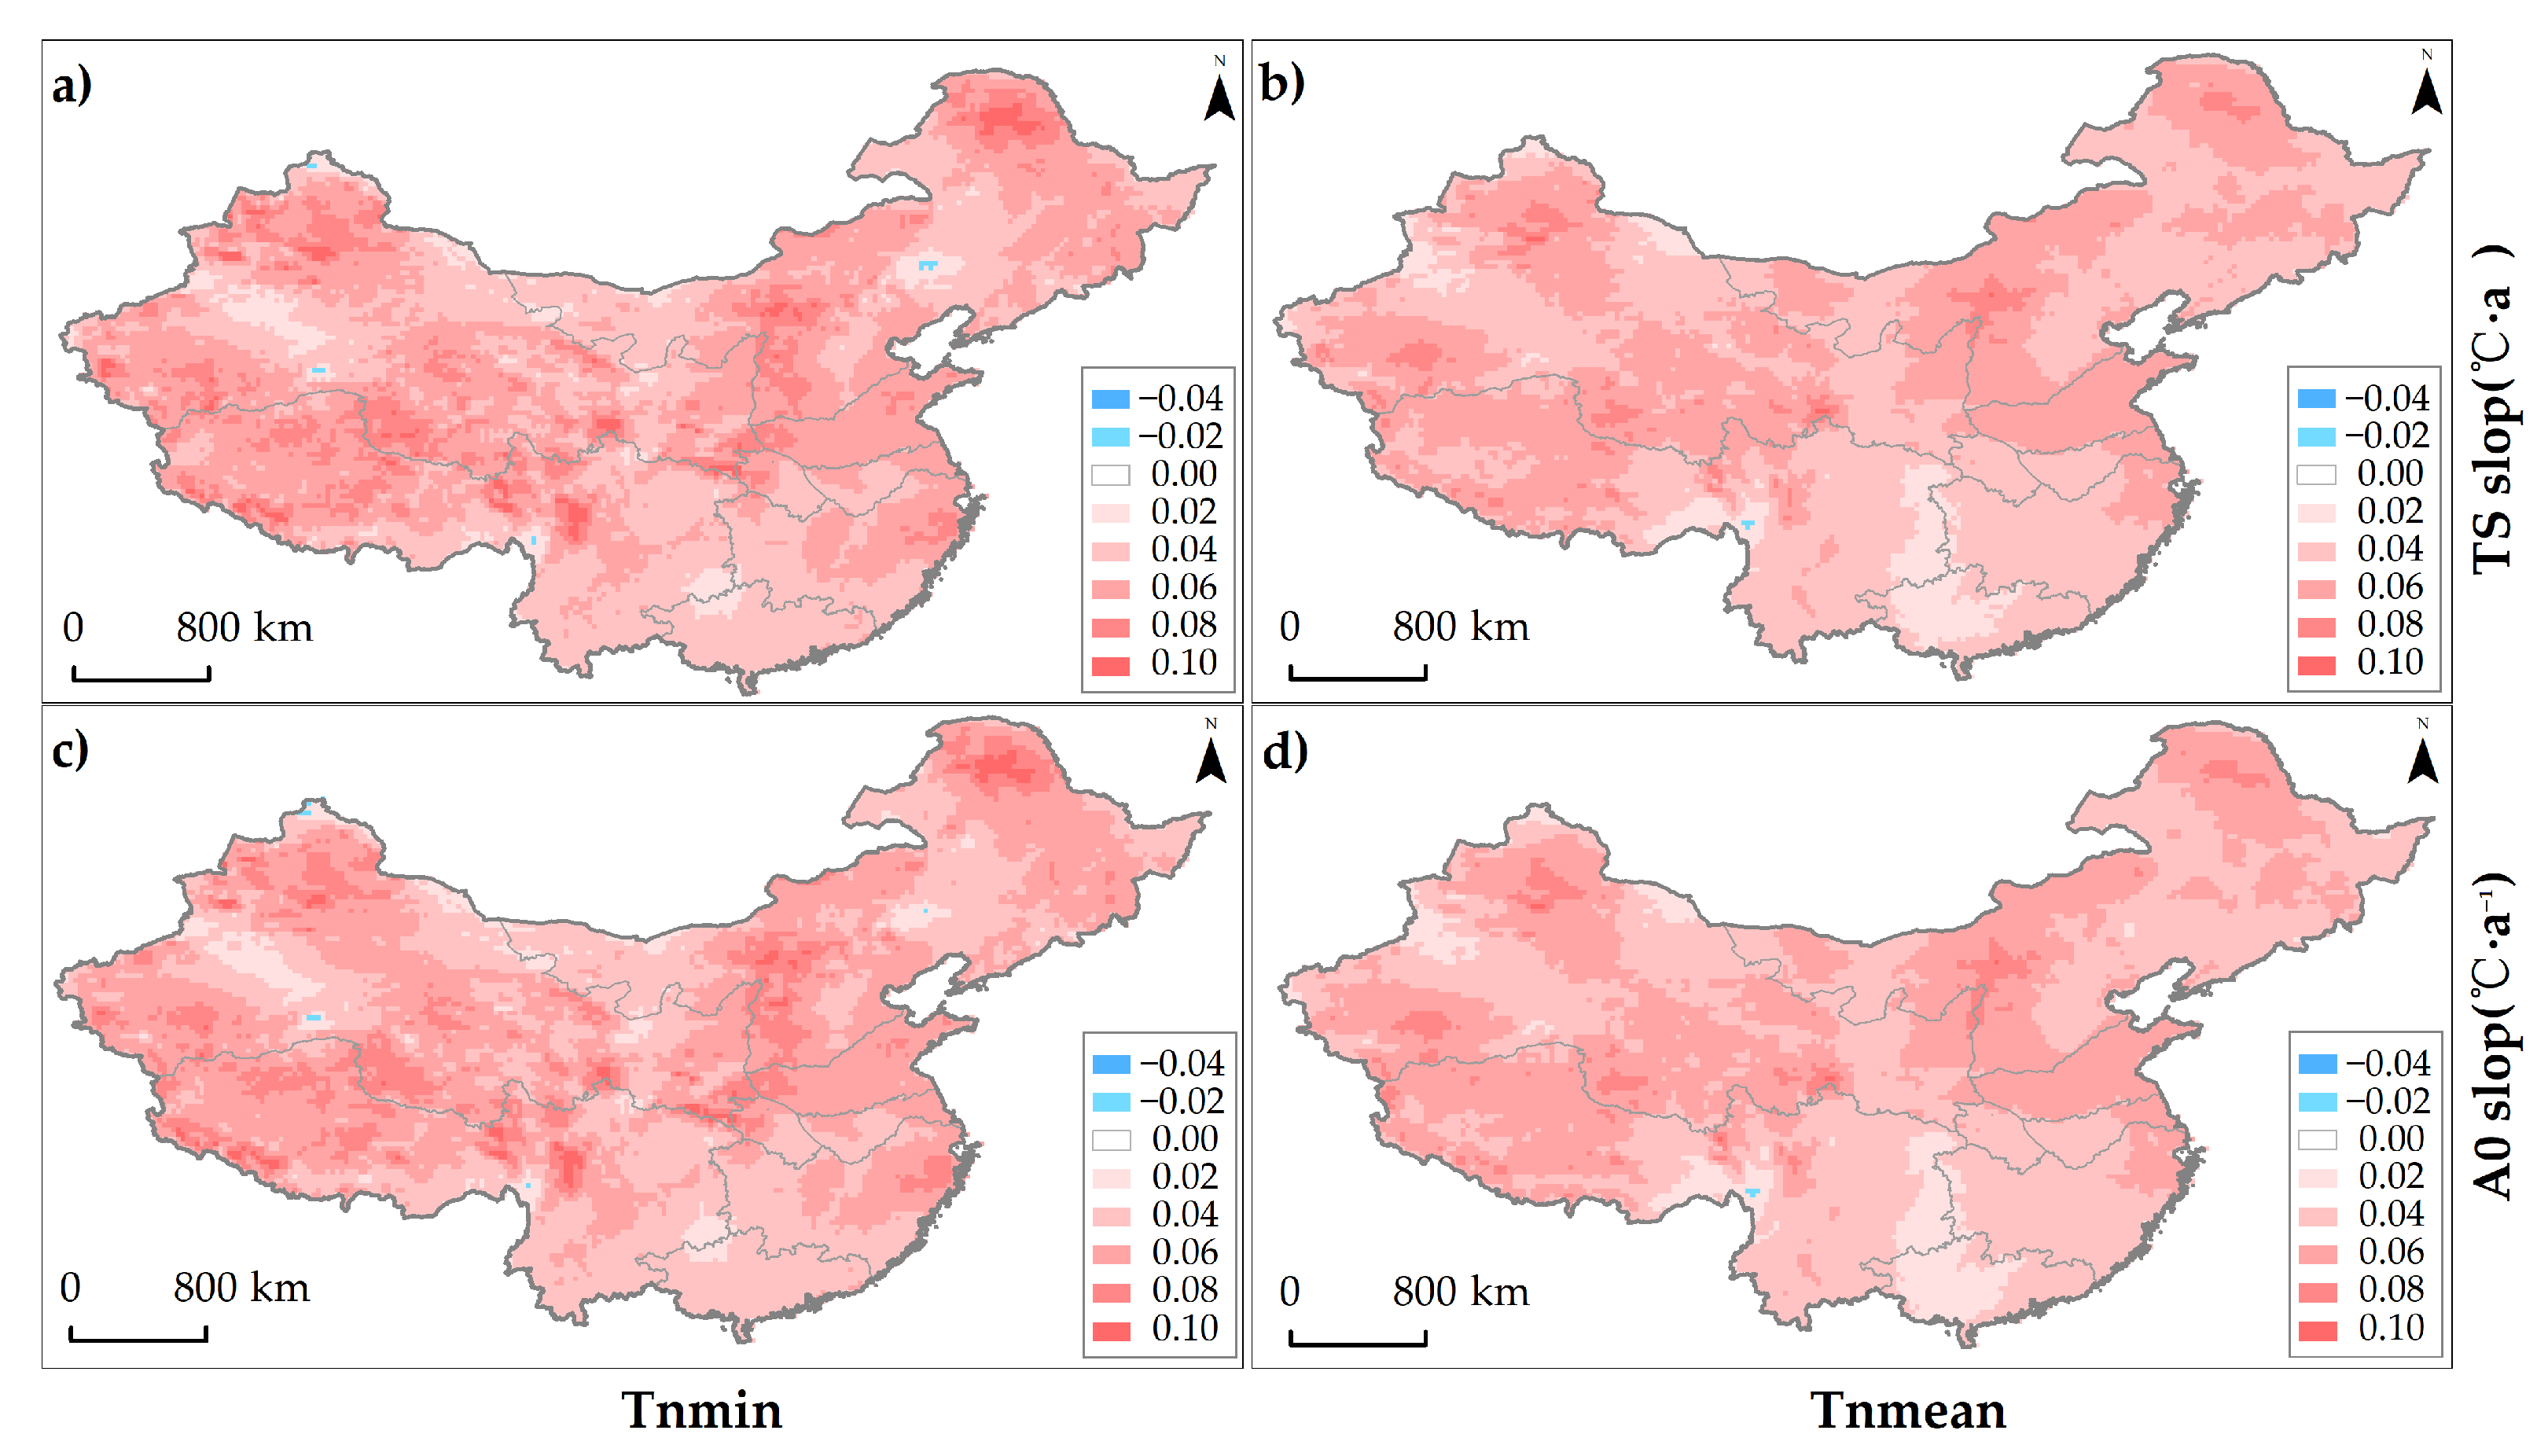
3.1.2. Minimum Temperature
3.2. Change of Extreme Air Temperature Days
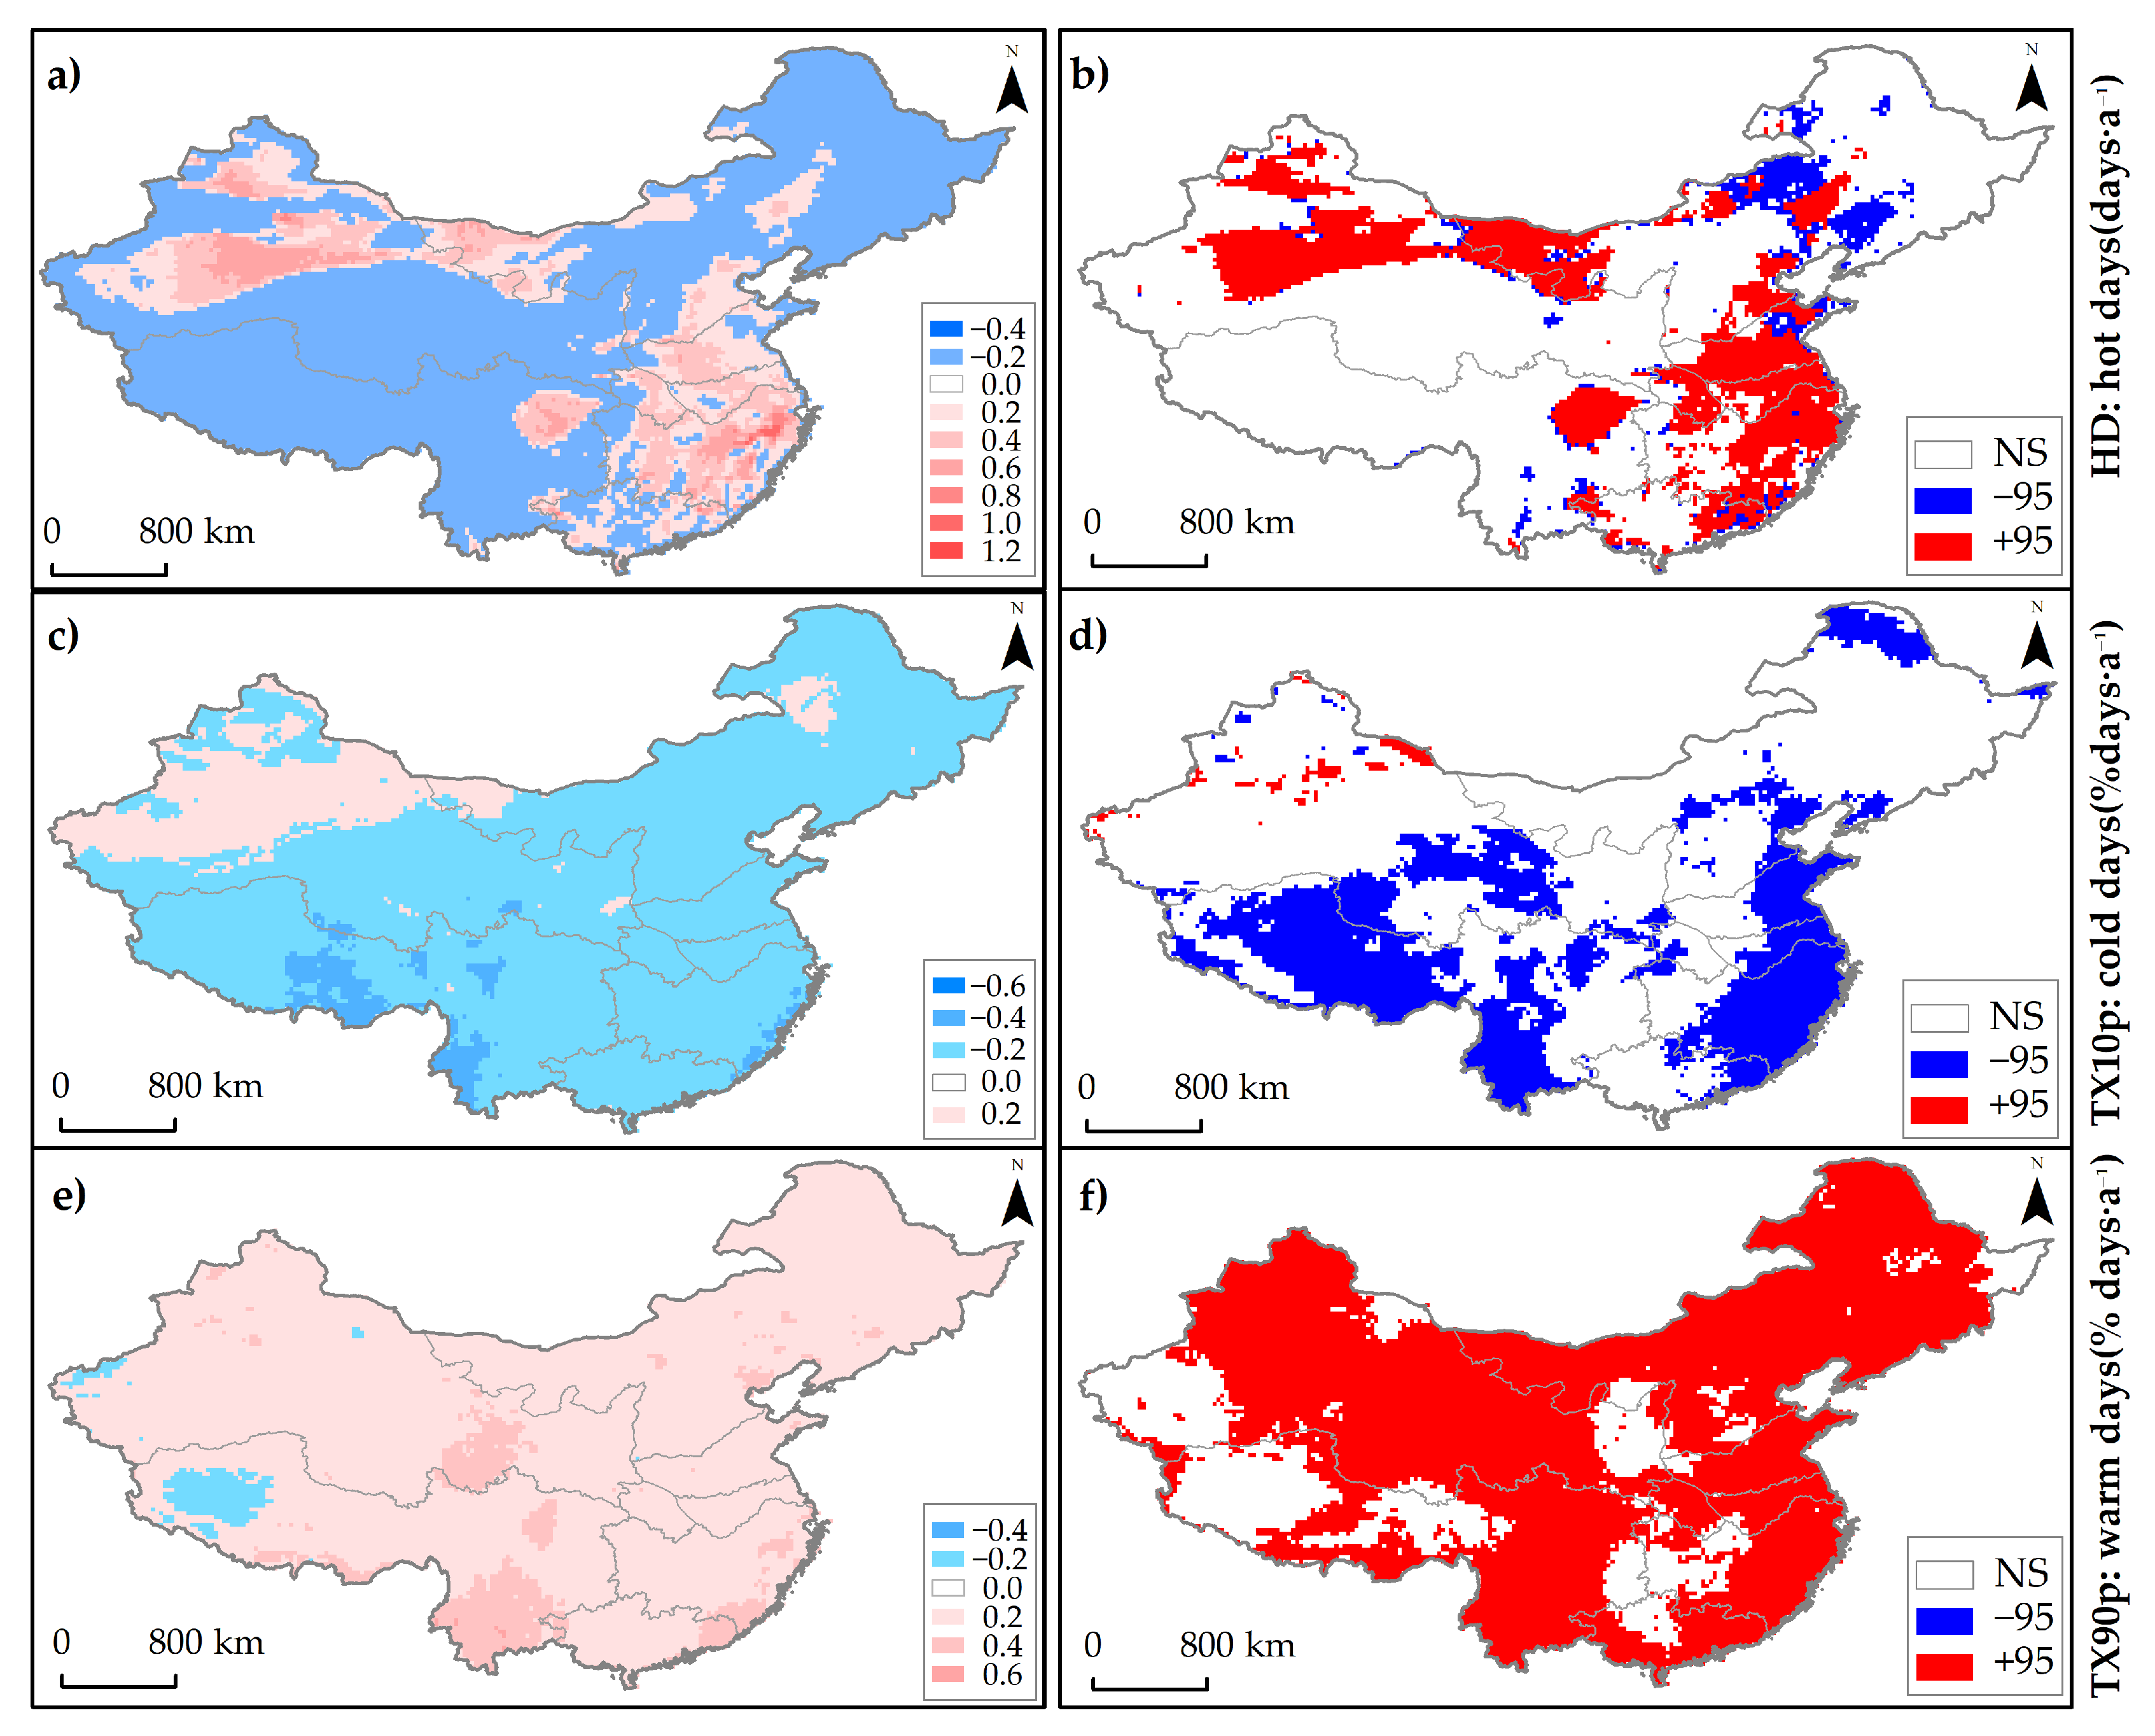
3.2.1. Hot Days, Cold Days, and Warm Days
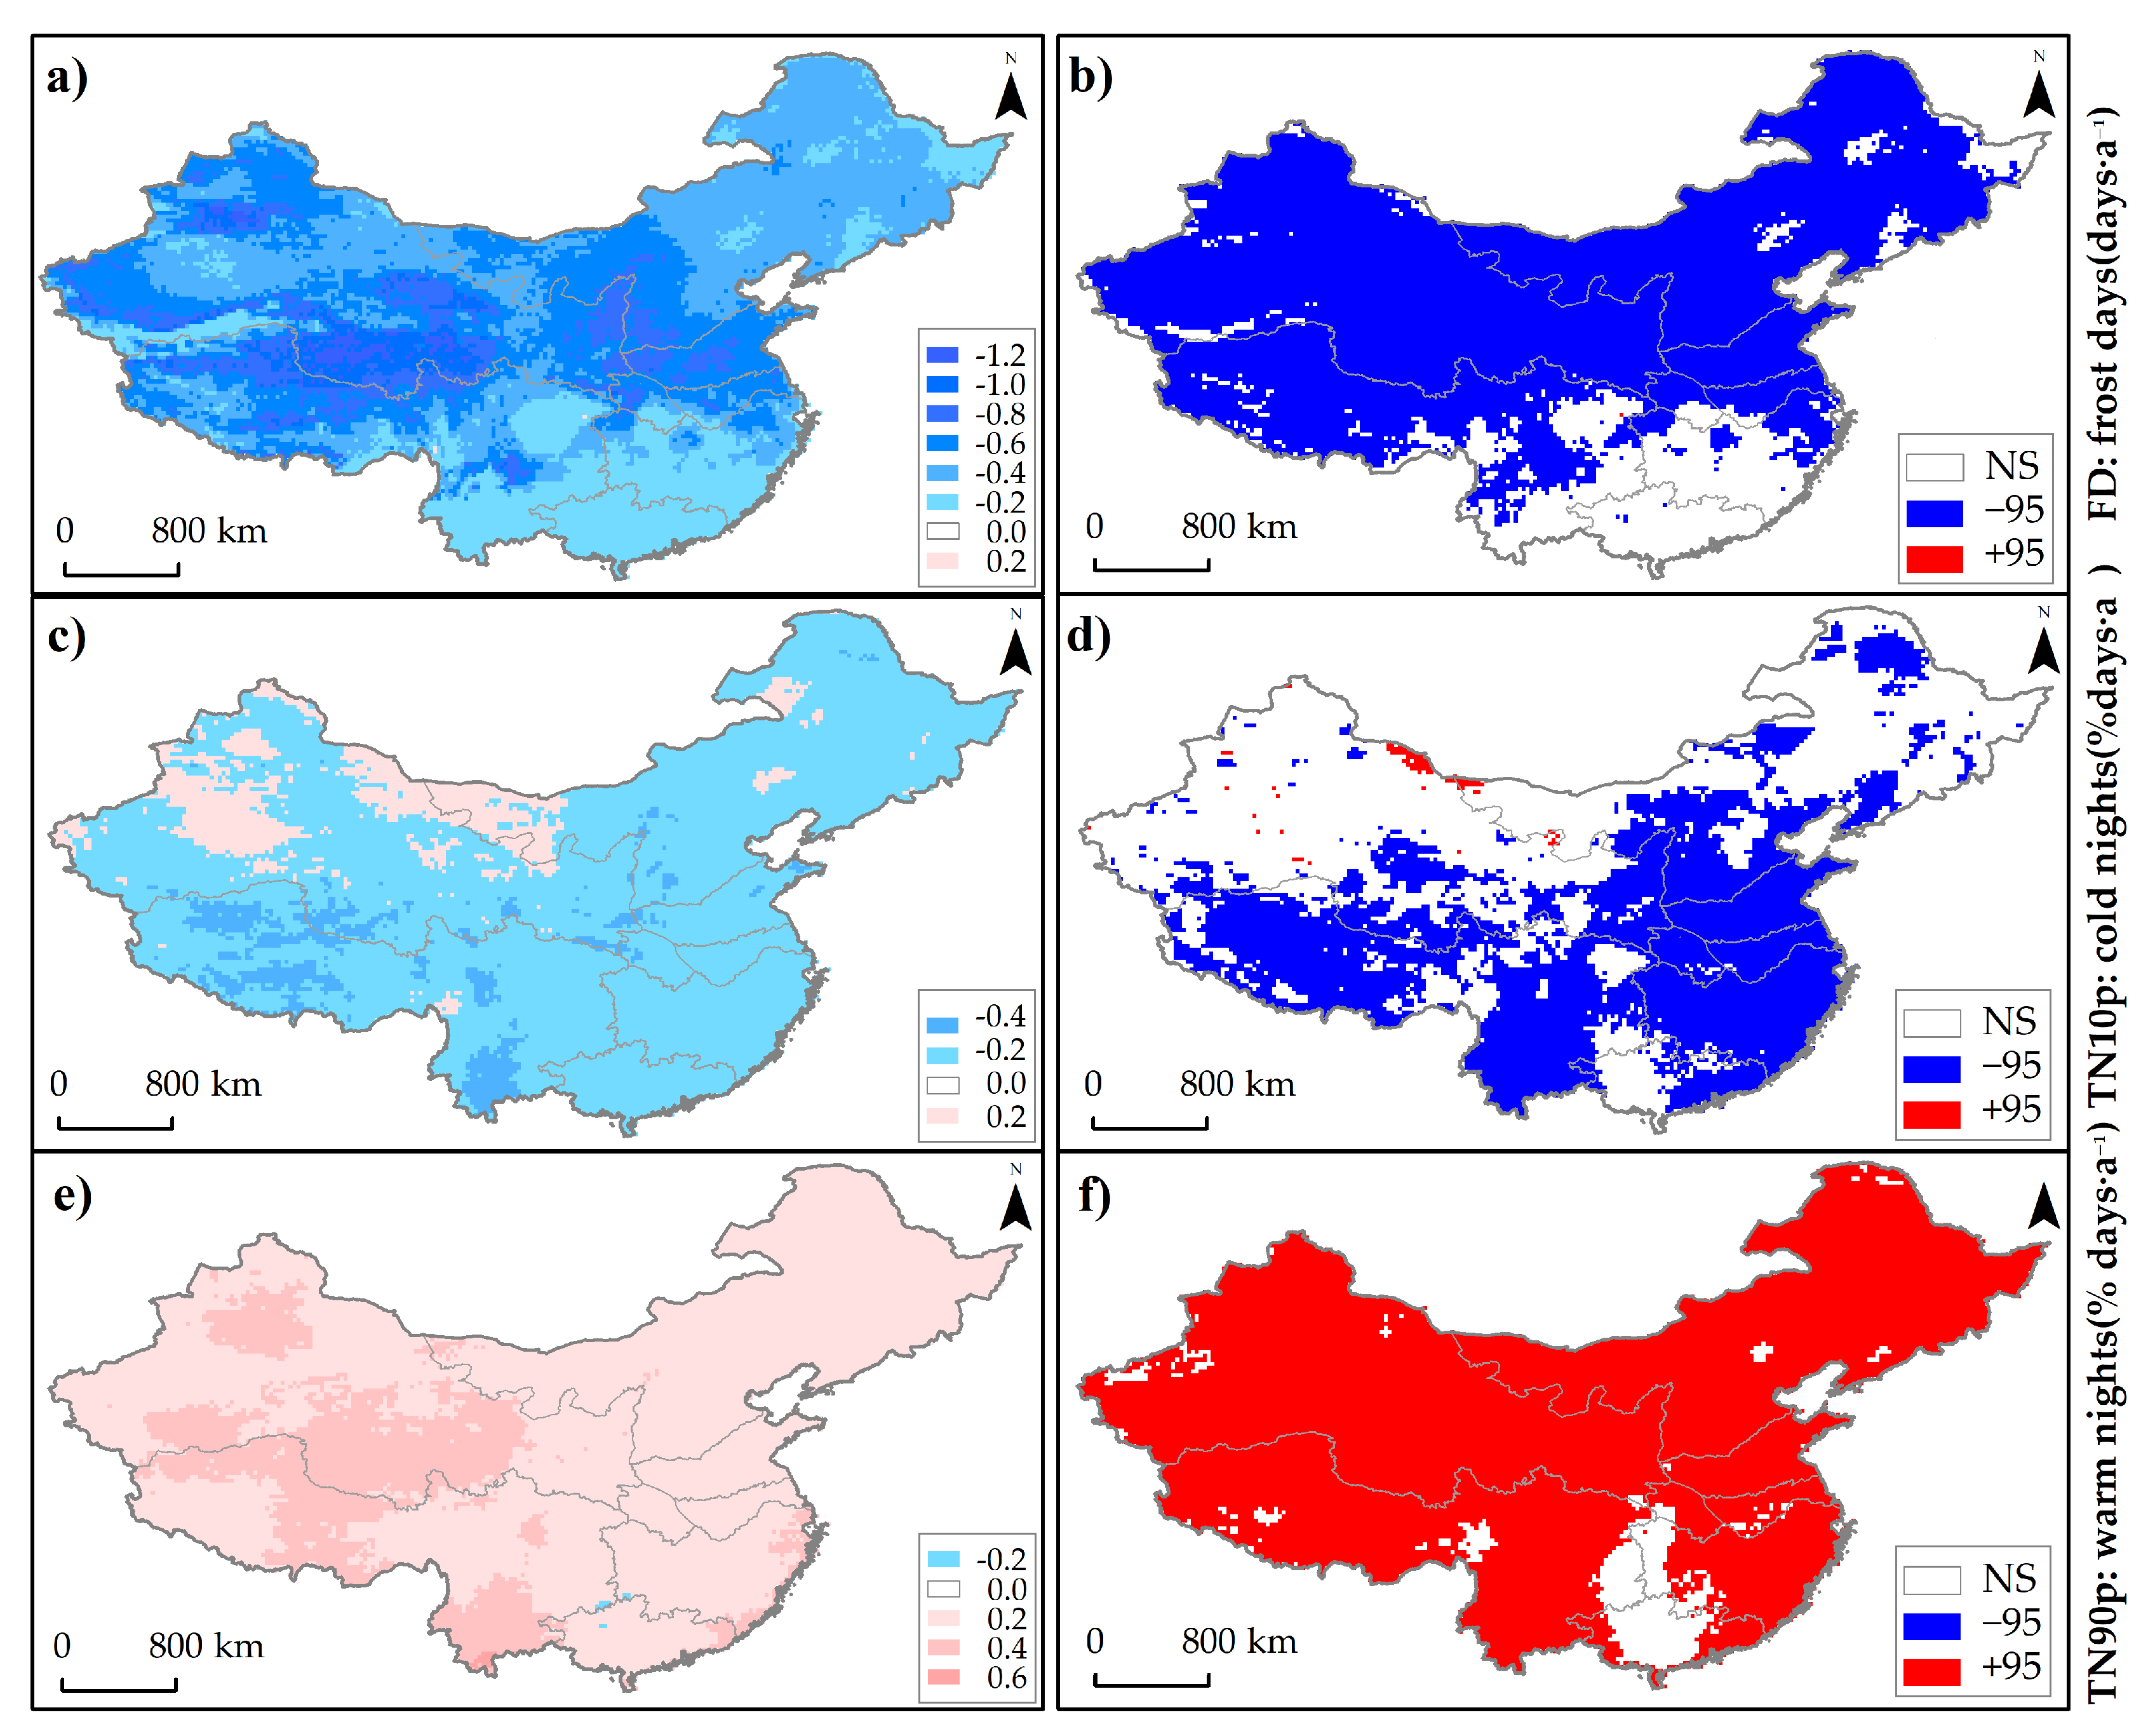
3.2.2. Frost Days, Cold Nights, and Warm Nights
4. Discussion
5. Conclusions
Supplementary Materials
Author Contributions
Funding
Institutional Review Board Statement
Informed Consent Statement
Data Availability Statement
Acknowledgments
Conflicts of Interest
References
- Arias, P.A. Coauthors. Technical Summary. In Climate Change 2021: The Physical Science Basis; Cambridge University Press: Cambridge, UK, 2021. [Google Scholar]
- Guo, J. Advances in impacts of climate change on agricultural production in China. J. App. Meteor. Sci. 2015, 26, 1–11. (In Chinese) [Google Scholar] [CrossRef]
- National Bureau of Statistics of China. Statistical Communiqué of the People’s Republic of China on the 2020 National Economic and Social Development; China Statistics Press: Beijing, China, 2020; pp. 50–51. (In Chinese) [Google Scholar]
- Lobell, D.B.; Schlenker, W.; Costa-Roberts. Climate Trends and Global Crop Production since 1980. Science 2011, 333, 616–620. [Google Scholar] [CrossRef] [Green Version]
- Lv, Z.; Zhu, Y.; Liu, X.; Ye, H.; Tian, Y.; Li, F. Climate change impacts on regional rice production in China. Clim. Chang. 2018, 147, 523–537. [Google Scholar] [CrossRef]
- Anderson, W.B.; Seager, R.; Baethgen, W.; Cane, M.; You, L. Synchronous crop failures and climate-forced production variability. Sci. Adv. 2019, 5, 1976. [Google Scholar] [CrossRef] [PubMed] [Green Version]
- Khalili, P.; Masud, B.; Qian, B.; Mezbahuddin, S.; Dyck, M.; Faramarzi, M. Non-stationary response of rain-fed spring wheat yield to future climate change in northern latitudes. Sci. Total Environ. 2021, 772, 145474. [Google Scholar] [CrossRef]
- Lobell, D.B.; Gourdji, S.M. The Influence of Climate Change on Global Crop Productivity. Plant. Phys. 2012, 160, 1686–1697. [Google Scholar] [CrossRef] [PubMed] [Green Version]
- Goyal, M.K. Understanding the climate change impact on crop yield over Eastern Himalayan Region: Ascertaining GCM and scenario uncertainty. Theor. Appl. Climatol. 2020, 142, 467–482. [Google Scholar] [CrossRef]
- Zhao, C.; Liu, B.; Piao, S.; Wang, X.; Lobell, D.B.; Huang, Y.; Huang, M.; Yao, Y.; Bassu, S.; Ciais, P.; et al. Temperature increase reduces global yields of major crops in four independent estimates. Proc. Natl. Acad. Sci. USA 2017, 114, 9326–9331. [Google Scholar] [CrossRef] [Green Version]
- Liu, Y.; Li, N.; Zhang, Z.; Huang, C.; Chen, X.; Wang, F. The central trend in crop yields under climate change in China: A systematic review. Sci. Total Environ. 2020, 704, 135355. [Google Scholar] [CrossRef] [PubMed]
- Liu, W.; Ye, T.; Shi, P. Decreasing wheat yield stability on the North China Plain: Relative contributions from climate change in mean and variability. Int. J. Clim. 2021, 41, 2820–2833. [Google Scholar] [CrossRef]
- Zhang, Y.; Shou, W.; Maucieri, C.; Lin, F. Rainfall increasing offsets the negative effects of nighttime warming on GHGs and wheat yield in North China Plain. Sci. Rep. 2021, 11, 6505. [Google Scholar] [CrossRef] [PubMed]
- Ding, Y.; Wang, H. Newly acquired knowledge on the scientific issues related to climate change over the recent 100 years in China. Chin. Sci. Bull. 2016, 61, 1029–1041. (In Chinese) [Google Scholar] [CrossRef] [Green Version]
- Ren, G.; Zhao, Z.; Zheng, J.; Wu, T.; Tang, G.; Xu, Y. Recent Progress in studies of climate change in China. Adv. Atoms Sci. 2012, 29, 958–977. [Google Scholar] [CrossRef]
- Wu, B.; Jiang, D.; Wang, X. Changes in the Growing Season Across China during 1961–2018. Chin. J. Atmos. Sci. 2021, 45, 424–434. (In Chinese) [Google Scholar] [CrossRef]
- Chen, H.; Sun, J. Anthropogenic influence has increased climate extreme occurrence over China. Sci. Bull. 2021, 66, 749–752. [Google Scholar] [CrossRef]
- Kong, F. The change of extreme cold and warm events in China from 1961 to 2018 and their spatial differences. Water Resour. Hydropower Eng. 2020, 51, 34–44. (In Chinese) [Google Scholar] [CrossRef]
- Wei, X.; Wang, P.; Zhang, Z.; Chen, Y.; Song, X.; Shuai, J.; Shi, P.; Tao, F. Assessing the Impact of Climate Change on Crop Yield Based on Three-interval Temperature Theory: A Case Study of Maize in Heilongjiang Province (1960–2009). J. Nat. Resour. 2015, 30, 470–479. (In Chinese) [Google Scholar] [CrossRef]
- Vogel, M.M.; Zscheischler, J.; Wartenburger, R.; Dee, D.; Seneviratne, S.R. Concurrent 2018 Hot Extremes Across Northern Hemisphere Due to Human-Induced Climate Change. Earths Future 2019, 7, 692–703. [Google Scholar] [CrossRef] [PubMed]
- Avotniece, Z.; Klavins, M.; Rodinovs, V. Changes of Extreme Climate Events in Latvia. Environ. Clim. Technol. 2012, 9, 4–11. [Google Scholar] [CrossRef] [Green Version]
- Xue, Y.; Chen, Q.; Zhang, J.; Huang, P. Trends in extreme high temperature at different altitudes of Southwest China during 1961–2014. Atmos. Ocean. Sci. Lett. 2020, 13, 417–425. [Google Scholar] [CrossRef]
- Gourdji, S.M.; Sibley, A.M.; Lobell, D.B. Global crop exposure to critical high temperatures in the reproductive period: Historical trends and future projections. Environ. Res. Lett. 2013, 8, 024041. [Google Scholar] [CrossRef]
- Zhang, Y.; Zhao, Y.; Sun, Q. Increasing maize yields in Northeast China are more closely associated with changes in crop timing than with climate warming. Environ. Res. Lett. 2021, 16, 054052. [Google Scholar] [CrossRef]
- Gao, M.; Tang, L.; Wu, Z.; Zhang, X.; Sun, Z.; Sun, N.; Gao, Y.; Zhang, C. Response of wheat yield components in global climatic zones to the warming during reproductive period. J. Plant Nutr. Fertil. 2019, 25, 1247–1256. (In Chinese) [Google Scholar] [CrossRef]
- Gao, M.; Zhang, X.; Sun, Z.; Sun, N.; Li, S.; Gao, Y.; Zhang, C. Wheat yield and growing period in response to field warming in different climatic zones in China. Sci. Agric. Sin. 2018, 51, 386–400. (In Chinese) [Google Scholar] [CrossRef]
- He, D.; Fang, S.; Liang, H.; Wang, E.; Wu, D. Contrasting yield responses of winter and spring wheat to temperature rise in China. Environ. Res. Lett. 2020, 15, 124038. [Google Scholar] [CrossRef]
- Sparks, T.; Menzel, A. Observed changes in seasons: An overview. Int. J. Climatol. 2020, 22, 1715–1725. [Google Scholar] [CrossRef]
- Kucharik, C.J.; Barford, C.; Maayar, E.; Wofsy, S.C.; Monson, R.K.; Baldocchi, D. A multiyear evaluation of a dynamic global model at three AmeriFlux forest sites: Vegetation structure, phenology, soil temperature, and CO2 and H2O vapor exchange. Ecol. Modell. 2006, 196, 1–31. [Google Scholar] [CrossRef]
- Eastman, J.R.; Sangermano, F.; Machado, E.; Rogan, J.; Anyamba, A. Global Trends in seasonality of normalized difference vegetation index (IDVI), 1982–2011. Remote Sens. 2013, 5, 4799–4818. [Google Scholar] [CrossRef] [Green Version]
- Karl, T.R.; Nicholls, N.; Ghazi, A. Clivar/GCOS/WMO Workshop on Indices and Indicators for Climate Extremes Workshop Summary. Clim. Chang. 1999, 42, 3–7. [Google Scholar] [CrossRef]
- Zhao, B.; Zhang, B.; Shi, C.; Liu, J.; Jiang, L. Comparison of the Global Energy Cycle between Chinese Reanalysis Interim and ECMWF Reanalysis. J. Meteorol. Res. 2019, 33, 563–575. [Google Scholar] [CrossRef]
- Kalney, E. The NCEP/NCAR 40-year reanalysis project. Bull. Am. Meteorol. Soc. 1996, 74, 789–799. [Google Scholar] [CrossRef] [Green Version]
- Kanamitsu, M.; Ebisuzaki, W.; Woollen, J.; Yang, K.; Hnilo, J.; Fiorino, M.; Potter, G.-L. NCEP-DOE AMIP-II Reanalysis (R-2). Bull. Am. Meteorol. Soc. 2020, 74, 1631–1643. [Google Scholar] [CrossRef]
- Onogi, K.; Tsutsui, J.; Koide, H.; Sakamoto, M.; Kobayashi, S.; Hatsushika, H.; Matsumoto, T.; Yamazaki, N.; Kamahori, H.; Takahashi, K.; et al. The JRA-25 Reanalysis. J. Meteor. Soc. Jpn. 2007, 85, 369–432. [Google Scholar] [CrossRef] [Green Version]
- Kobayashi, S.; Ota, Y.; Harada, Y.; Ebita, A.; Moriya, M.; Onoda, H.; Onogi, K.; Kamahori, H.; Kobayashi, C.; Endo, H.; et al. The JRA-55 Reanalysis: General specifications and basic characteristics. J. Meteor. Soc. Jpn. 2015, 93, 5–48. [Google Scholar] [CrossRef] [Green Version]
- Rienecker, M.M.; Suarez, M.J.; Gelaro, R.; Todling, R.; Bacmeister, J.; Liu, E.; Bosilovich, M.G.; Schubert, S.D.; Takacs, L.; Kim, G.K.; et al. MERRA: NASA’s Modern-Era Retrospective Analysis for Research and Applications. J. Clim. 2011, 24, 3624–3648. [Google Scholar] [CrossRef]
- Gelaro, R.; McCarty, W.; Suárez, M.J.; Todling, R.; Molod, A.; Takacs, L.; Randles, C.A.; Darmenov, A.; Bosilovich, M.G.; Reichle, R.; et al. The Modern-Era Retrospective Analysis for Research and Applications, Version 2 (MERRA-2). J. Clim. 2017, 30, 5419–5454. [Google Scholar] [CrossRef] [PubMed]
- Zhang, J.; Zhao, T.; Li, Z.; Li, C.; Li, Z.; Ying, K.; Shi, C.; Jiang, L.; Zhang, W. Evaluation of Surface Relative Humidity in China from the CRA-40 and Current Reanalyses. Adv. Atmos. Sci. 2021, 38, 1958–1976. [Google Scholar] [CrossRef]
- Hersbach, H.; Bell, B.; Berrisford, P.; Hirahara, S.; Horányi, A.; Muñoz-Sabater, J.; Nicolas, J.; Peubey, C.; Radu, R.; Schepers, D.; et al. The ERA5 global reanalysis. Q. J. R. Meteor. Soc. 2020, 146, 1999–2049. [Google Scholar] [CrossRef]
- Hu, G.J.; Zhao, L.; Wu, X.; LI, R.; Wu, T.; Su, Y.; Hao, J. Evaluation of reanalysis air temperature products in permafrost regions on the -Tibetan Plateau. Theor. Appl. Climatol. 2019, 138, 1457–1470. [Google Scholar] [CrossRef]
- Wang, X.; Prigent, C. Comparisons of Diurnal Variations of Land Surface Temperatures from Numerical Weather Prediction Analyses, Infrared Satellite Estimates and In Situ Measurements. Remote Sens. 2020, 12, 583. [Google Scholar] [CrossRef] [Green Version]
- Eastman, J.R.; Sangermano, F.; Ghimire, B.; Ghimire, H. Seasonal trend analysis of image time series. Int. J. Remote Sens. 2009, 30, 2721–2726. [Google Scholar] [CrossRef]
- Cogliati, M.G.; Müller, G.; Lovino, M.A. Seasonal trend analysis of minimum air temperature in La Plata river basin. Theor. Appl. Climatol. 2021, 144, 25–37. [Google Scholar] [CrossRef]
- Duan, D. Harmonic analysis and its application to weather forecast. J. Cnuwrep 1986, 1, 72–84. (In Chinese) [Google Scholar]
- Hamed, K. Exact distribution of the Mann-Kendall trend test statistic for persistent data. J. Hydrol. 2009, 365, 86–94. [Google Scholar] [CrossRef]
- Sen, P.K. Estimates of the Regression Coefficient Based on Kendall’s Tau. J. Am. Stat. Assoc. 1968, 63, 1379–1389. [Google Scholar] [CrossRef]
- Neeti, N.; Eastman, J.R. A contextual Mann-Kendall approach for the assessment of trend significance in image time series. Trans. GIS 2011, 15, 599–611. [Google Scholar] [CrossRef]
- Zhai, P.; Pan, X. Trends in temperature extremes during 1951–1999 in China. Geophys. Res. Lett. 2003, 30, 1913. [Google Scholar] [CrossRef]
- Lin, Z.; Yu, Z.; Zhang, H.; Wu, C. Quantifying the attribution of model bias in simulating summer hot days in China with IAP AGCM 4.1. Atmos. Ocean. Lett. 2016, 9, 436–442. [Google Scholar] [CrossRef] [Green Version]
- Editing Commission of the Third National Report on Climate Change of China. In The Third National Report on Climate Change; Science Press: Beijing, China, 2015; pp. 20–21.
- Jin, Q.; Yang, J.; Chen, H.; He, Q.; Tang, F. Comprehensive analysis of temperature variations over Tibet Plateau from 1961 to 2015. J. Lanzhou Univ. Nat. Sci. 2020, 56, 755–764. (In Chinese) [Google Scholar] [CrossRef]
- Stine, A.; Huybers, P.; Fung, I. Change in the phase of the annual cycle of surface temperature. Nature 2009, 457, 435–440. [Google Scholar] [CrossRef] [PubMed]
- Wang, L.; Liu, B.; Henderson, M.; Shen, X.; Yang, L. Warming across decades and deciles: Minimum and maximum daily temperatures in China, 1955–2014. Int. J. Climatol. 2018, 38, 2325–2332. [Google Scholar] [CrossRef]
- Wu, X.; Wang, Z.; Zhou, X.; Lai, C.; Chen, X. Trends in temperature extremes over nine integrated agricultural regions in China, 1961–2011. Theor. Appl. Climatol. 2017, 129, 1279–1294. [Google Scholar] [CrossRef]
- Qian, C.; Zhang, X.; Li, Z. Linear trends in temperature extremes in China, with an emphasis on non-Gaussian and serially dependent characteristics. Clim. Dyn. 2019, 53, 533–550. [Google Scholar] [CrossRef] [Green Version]
- Shen, X.; Liu, B.; Lu, X.; Fan, G. Spatial and temporal changes in daily temperature extremes in China during 1960–2011. Theor. Appl. Climatol. 2017, 130, 933–943. [Google Scholar] [CrossRef]
- Zhang, J.; Qian, C. Linear Trends in Occurrence of High Temperature and Heat Waves in China for the 1960–2018 Period: Method and Analysis Results. Clim. Environ. Res. 2020, 25, 225–239. (In Chinese) [Google Scholar] [CrossRef]
- Xing, P.; Yang, R.; Du, W.; Dang, B.; Xuan, C.; Xiong, F. Spatiotemporal variation of high temperature day and heat wave in North China during 1961–2017. Sci. Geogr. Sin. 2020, 40, 1365–1376. (In Chinese) [Google Scholar] [CrossRef]
- Reda, K.W.; Liu, X.; Tang, Q.; Gebremicael, T.G. Evaluation of Global Gridded Precipitation and Temperature Datasets against Gauged Observations over the Upper Tekeze River Basin, Ethiopia. J. Meteorol. Res. 2021, 35, 673–689. [Google Scholar] [CrossRef]
- Zheng, Y. A Preliminary Analysis on the Applicability of ERA5 Reanalysis Data in Guangdong Province. Meteorol. Environ. Res. 2020, 11, 37–42, 48. [Google Scholar] [CrossRef]
- Zhou, G.; He, Q.B. Assessment Report of Climate Hazard of Agricultural Production in China, 1st ed.; Social Sciences Academic Press: Beijing, China, 2020; pp. 17–20. [Google Scholar]
- Zhang, Z.; Chen, Y.; Wang, C.; Wang, P.; Tao, F. Future extreme temperature and its impact on rice yield in China. Int. J. Climatol. 2017, 37, 4814–4827. [Google Scholar] [CrossRef]
- Schleussner, C.F.; Lissner, T.K.; Fischer, E.M.; Wohland, J.; Perrette, M.; Golly, A.; Rogelj, J.; Childers, K.; Schewe, J.; Frieler, K.; et al. Differential climate impacts for policy-relevant limits to global warming: The case of 1.5 °C and 2 °C. Earth Syst. Dynam. 2016, 6, 2447–2505. [Google Scholar] [CrossRef] [Green Version]
- Guo, X.; Huang, J.; Luo, Y.; Zhao, Z.; Xu, Y. Projection of heat waves over China for eight different global warming targets using 12 CMIP5 models. Theor. Appl. Climatol. 2017, 128, 507–522. [Google Scholar] [CrossRef]
- Xiao, S.; Zhang, Z.; Chen, Y.; Wang, P.; Xiang, M.; Shi, P.; Tao, F. Spatiotemporal changes of global extreme temperature events (ETEs) since 1981 and the meteorological causes. Nat. Hazards. 2014, 70, 975–994. [Google Scholar] [CrossRef]
- Zhang, G.; Zeng, G.; Yang, X.; Jiang, Z. Future Changes in Extreme High Temperature over China at 1.5 °C–5 °C Global Warming Based on CMIP6 Simulations. Adv. Atmos. Sci. 2021, 38, 256–267. [Google Scholar] [CrossRef]
- Zhang, Q.; Yang, Z. Impact of Extreme Heat on Corn Yield in Main Summer Corn Cultivating Area of China at Present and Under Future Climate Change. Int. J. Plant. Prod. 2019, 13, 267–274. [Google Scholar] [CrossRef]
- Lobell, D.B.; Bänziger, M.; Magorokosho, C.; Vivek, B. Nonlinear heat effects on African maize as evidenced by historical yield trials. Nat. Clim. Chang. 2011, 1, 42–45. [Google Scholar] [CrossRef]
- Chen, X.; Wang, L.; Niu, Z.; Zhang, M.; Li, C.; Li, J. The effects of projected climate change and extreme climate on maize and rice in the Yangtze River Basin, China. Agric. Forest Meteorol. 2020, 282, 107867. [Google Scholar] [CrossRef]
- Bai, Y.; Wang, J.; Zhang, B.; Zhang, Z.; Liang, J. Comparing the impact of cloudiness on carbon dioxide exchange in a grassland and a maize cropland in northwestern China. Ecol. Res. 2012, 27, 615–623. [Google Scholar] [CrossRef]
- Valjarević, A.; Morar, C.; Živković, J.; Niemets, L.; Kićović, D.; Golijanin, J.; Gocić, M.; Bursać, N.M.; Stričević, L.; Žiberna, I.; et al. Long Term Monitoring and Connection between Topography and Cloud Cover Distribution in Serbia. Atmosphere 2021, 12, 964. [Google Scholar] [CrossRef]
- Jones, P.A.; Henderson-Sellers, A. Historical Records of Cloudiness and Sunshine in Australia. J. Clim. 1992, 5, 260–270. [Google Scholar] [CrossRef] [Green Version]
- Kaiser, D.P. Decreasing cloudiness over China: An updated analysis examining additional variables. Geophys. Res. Lett. 2000, 27, 2193–2196. [Google Scholar] [CrossRef] [Green Version]
- Bucchignani, E.; Zollo, A.L.; Cattaneo, L.; Montesarchio, M.; Mercogliano, P. Extreme weather events over China: Assessment of COSMO-CLM simulations and future scenarios. Int. J. Climatol. 2017, 37, 1578–1594. [Google Scholar] [CrossRef]
- Xie, W.; Zhou, B.; You, Q.; Zhang, Y.; Ullah, S. Observed changes in heat waves with different severities in China during 1961–2015. Theor. Appl. Climatol. 2020, 141, 1529–1540. [Google Scholar] [CrossRef]
- Xu, F.; Chan, T.; Ming, L. Different changes in dry and humid heat waves over China. Int. J. Climatol. 2020, 41, 1369–1382. [Google Scholar] [CrossRef]
- Wang, J.; Yan, Z. Rapid rises in the magnitude and risk of extreme regional heat wave events in China. Weather Clim. Extrem. 2021, 34, 100379. [Google Scholar] [CrossRef]


| ID | Name | Definition/Meaning |
|---|---|---|
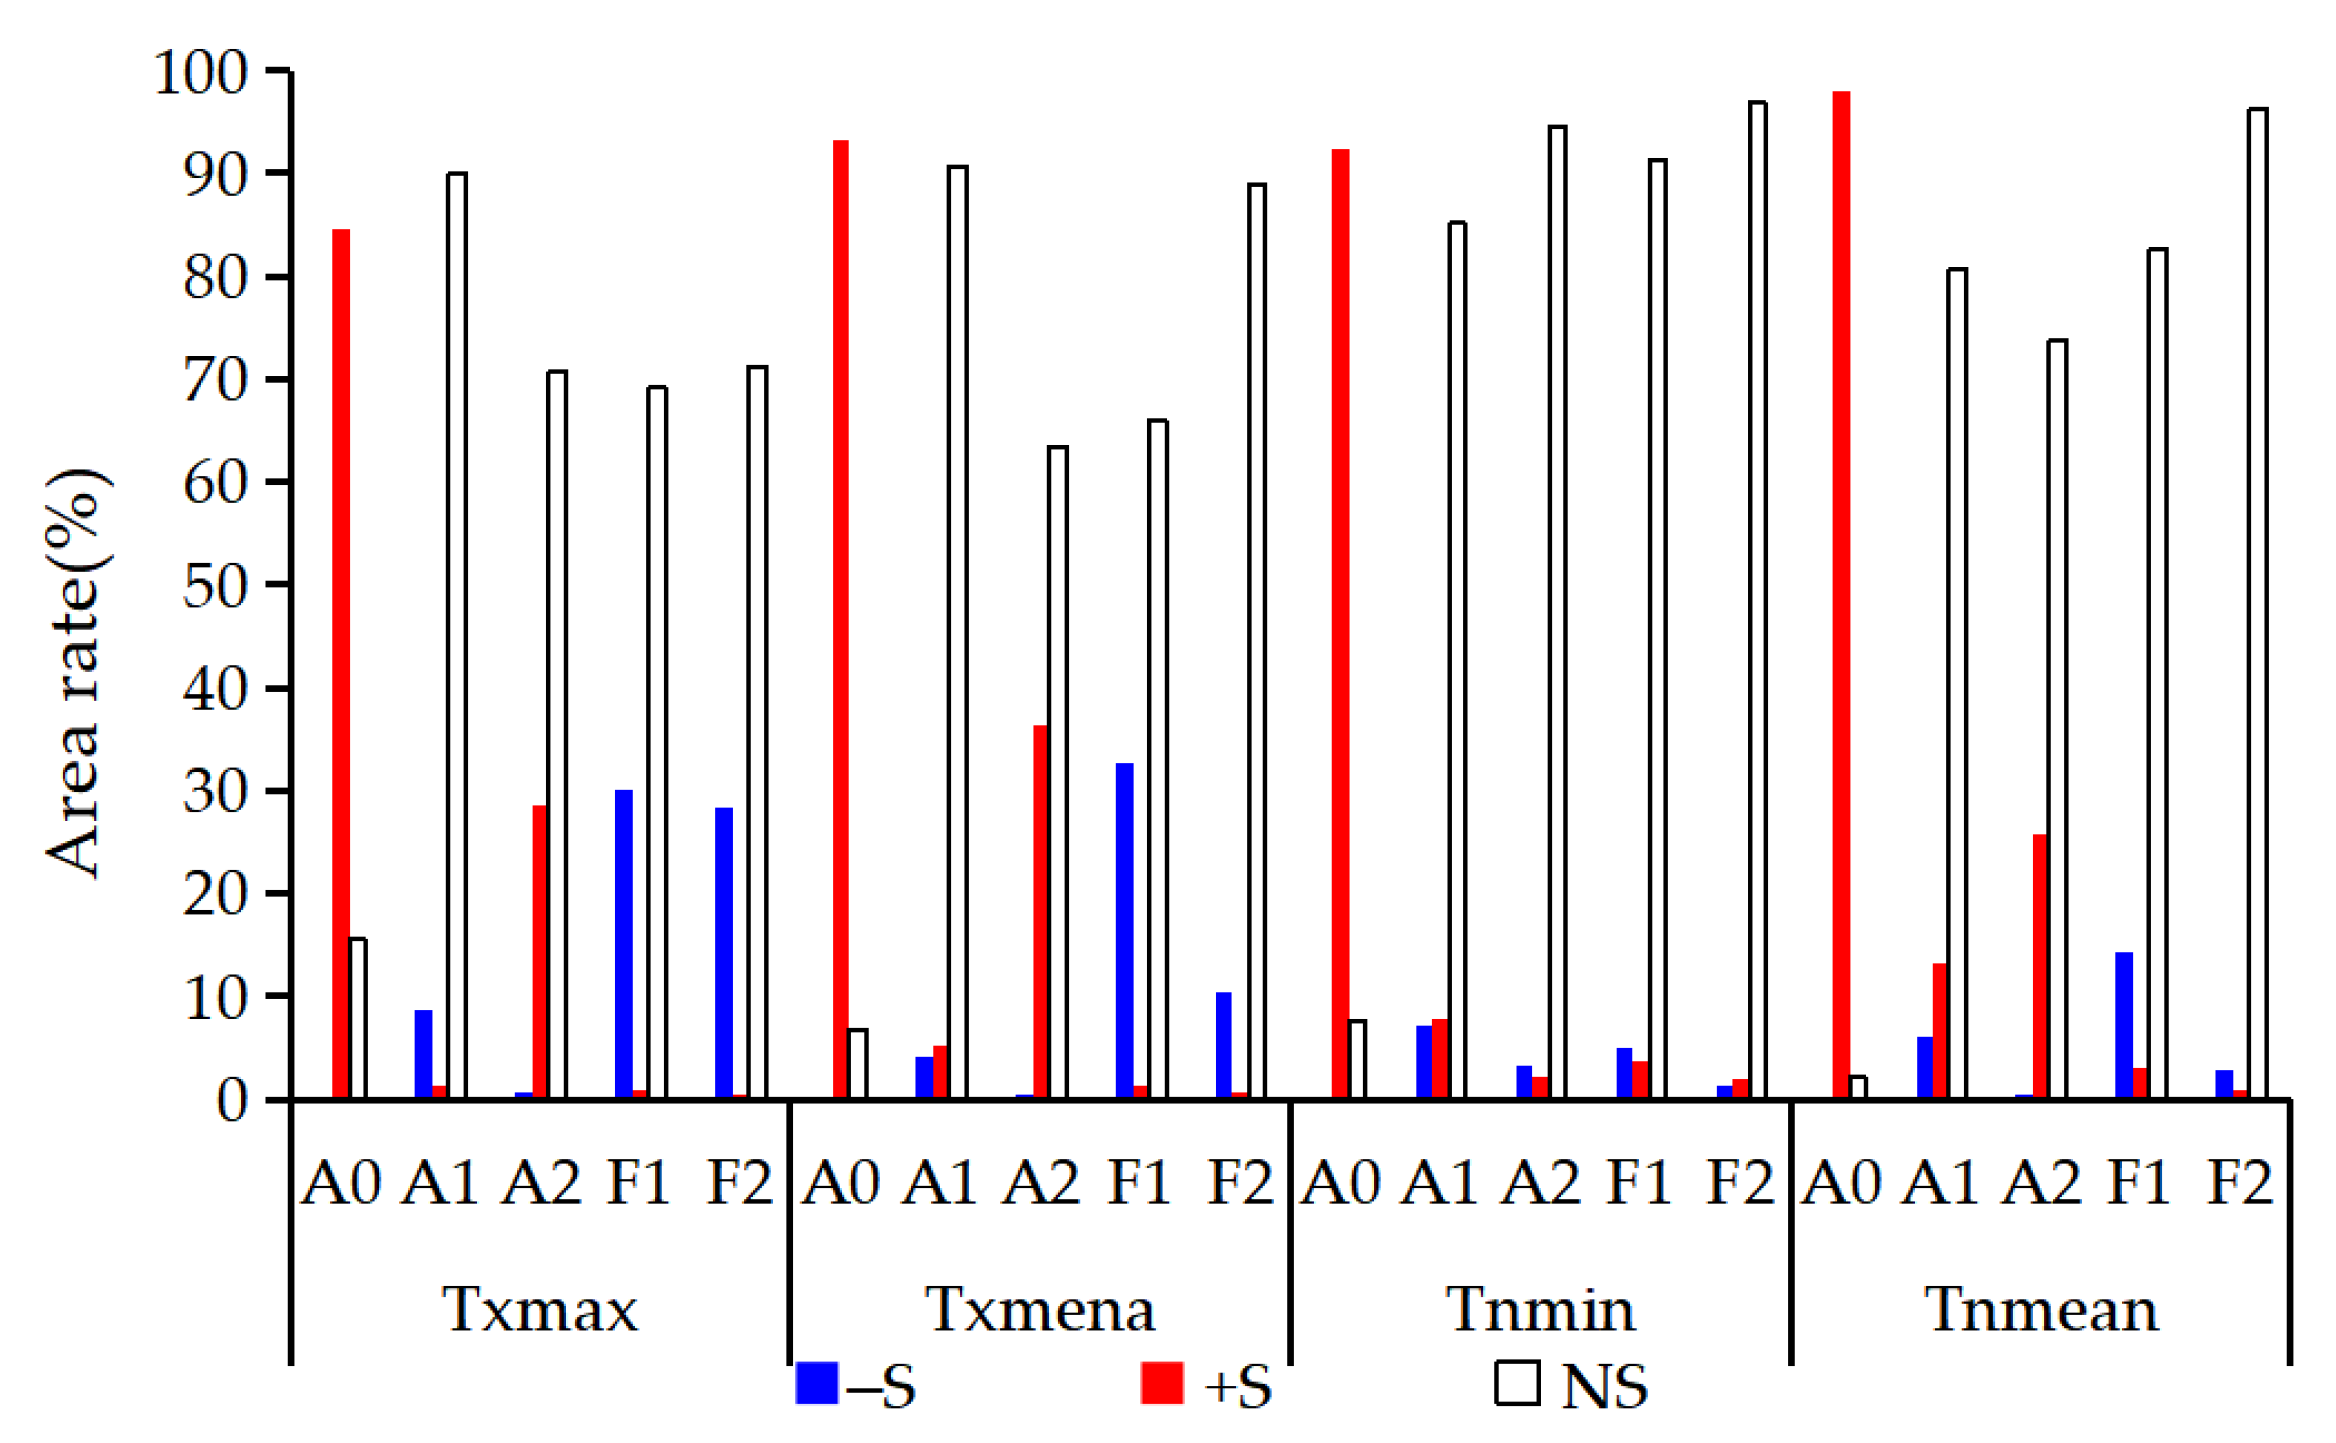
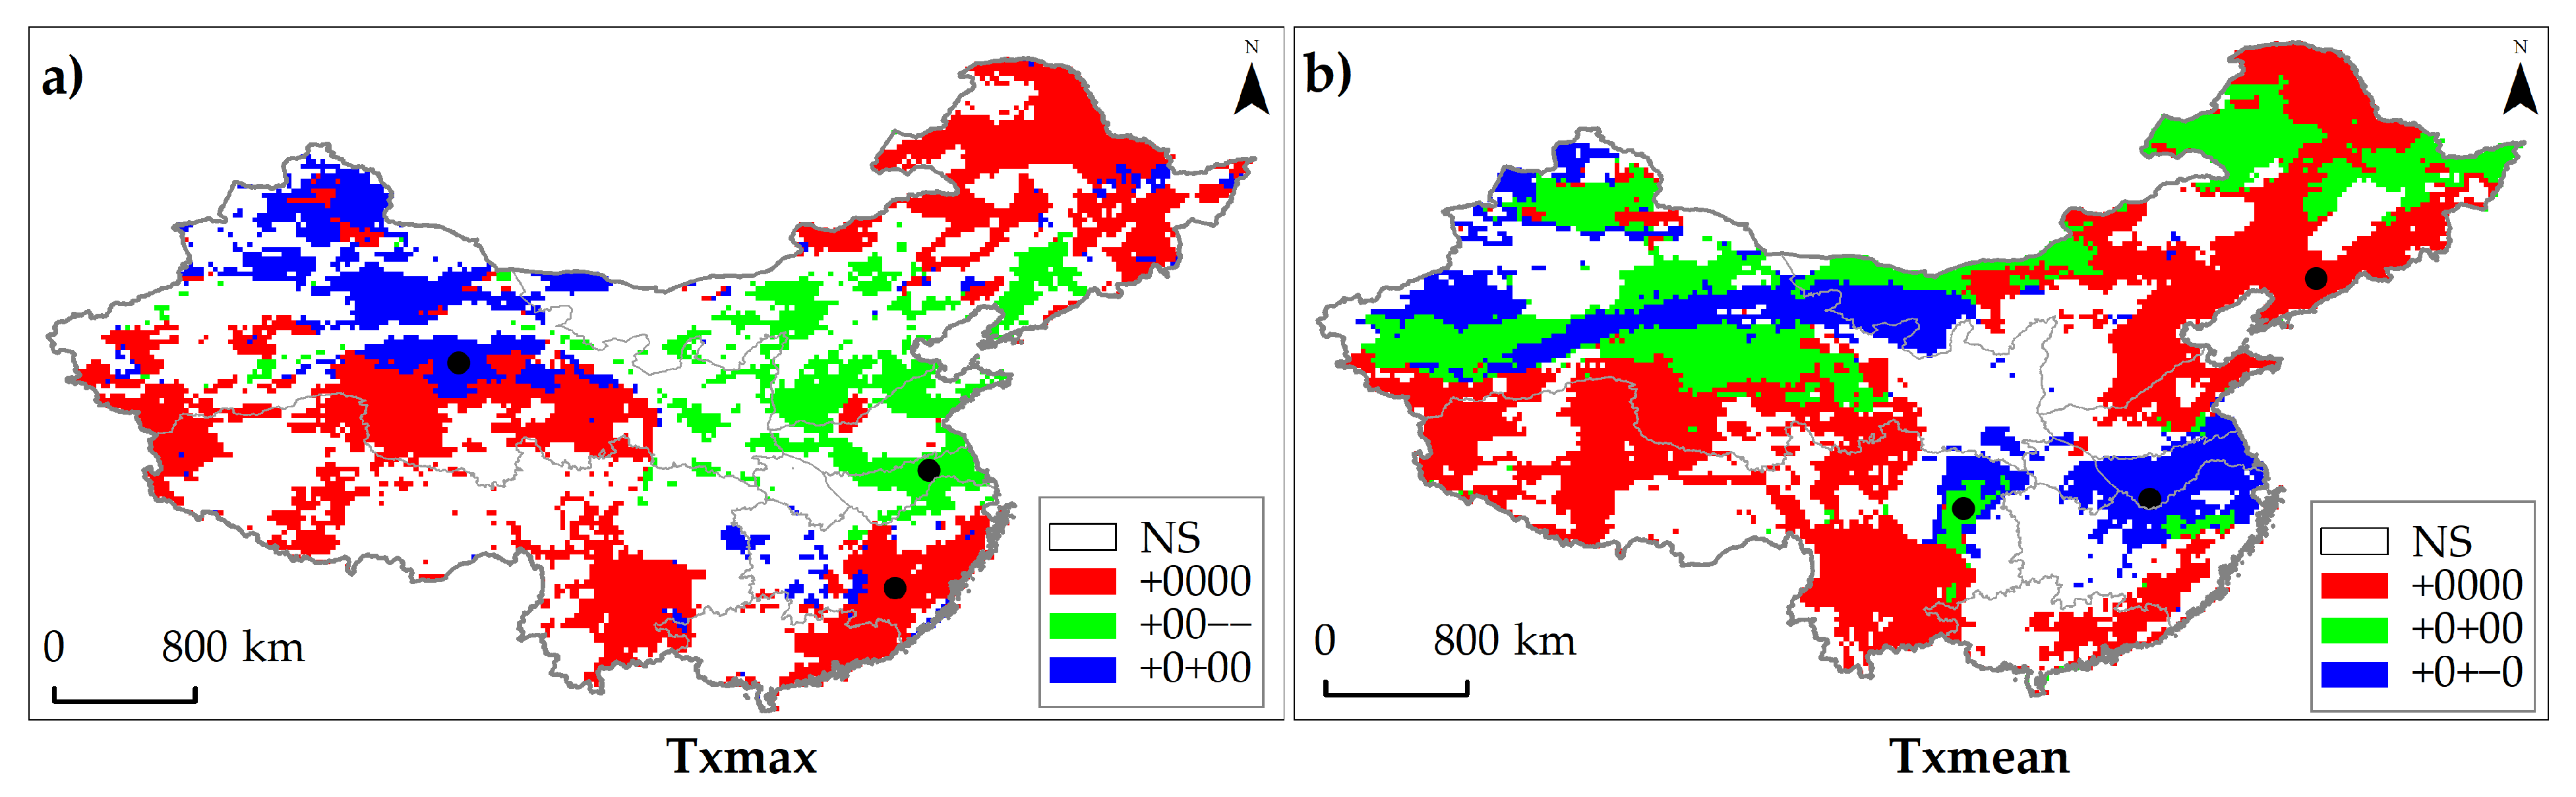
| A0 | annual average amplitude | the arithmetic average value of the original series/annual average temperature |
| A1 | amplitude of annual cycle | difference between maximum and minimum of the 1st harmonic/annual temperature range |
| A2 | amplitude of semi-annual cycle | difference between maximum and minimum of the 2nd harmonic/can be regarded as the shape factor of annual curve |
| F1 | phase of annual cycle | start phase angle of the 1st harmonic/indicate the time when the sine waves reaches a peak |
| F2 | phase of semi-annual cycle | start phase angle of the 2nd harmonic/can be regarded as the shape factor of annual curve |
| ID | Name | Definition | Units |
|---|---|---|---|
| HD | hot days | Annual count of days when TX ≥ 35 °C | days |
| FD | frost days | Annual count of days when TN < 0 °C | days |
| TN10p | cold nights | Percentage of days when TN < 10th percentile 1 | % |
| TN90p | warm night | Percentage of days when TN > 90th percentile | % |
| TX10p | cold days | Percentage of days when TX < 10th percentile 1 | % |
| TX90p | warm days | Percentage of days when TX > 90th percentile | % |
Publisher’s Note: MDPI stays neutral with regard to jurisdictional claims in published maps and institutional affiliations. |
© 2021 by the authors. Licensee MDPI, Basel, Switzerland. This article is an open access article distributed under the terms and conditions of the Creative Commons Attribution (CC BY) license (https://creativecommons.org/licenses/by/4.0/).
Share and Cite
Yan, W.; Zhao, J.; Li, J.; Wang, Y. Assessment of Seasonal Variability of Extreme Temperature in Mainland China under Climate Change. Sustainability 2021, 13, 12462. https://doi.org/10.3390/su132212462
Yan W, Zhao J, Li J, Wang Y. Assessment of Seasonal Variability of Extreme Temperature in Mainland China under Climate Change. Sustainability. 2021; 13(22):12462. https://doi.org/10.3390/su132212462
Chicago/Turabian StyleYan, Weixiong, Junfang Zhao, Jianping Li, and Yunxia Wang. 2021. "Assessment of Seasonal Variability of Extreme Temperature in Mainland China under Climate Change" Sustainability 13, no. 22: 12462. https://doi.org/10.3390/su132212462
APA StyleYan, W., Zhao, J., Li, J., & Wang, Y. (2021). Assessment of Seasonal Variability of Extreme Temperature in Mainland China under Climate Change. Sustainability, 13(22), 12462. https://doi.org/10.3390/su132212462