Article

Investigation of Potential of Solar Photovoltaic System as an Alternative Electric Supply on the Tropical Island of Mantanani Sabah Malaysia

by
Ag Sufiyan Abd Hamid
1,2,*,
Mohamad Zul Hilmey Makmud
1,
Abu Bakar Abd Rahman
1,
Zuhair Jamain
1 and
Adnan Ibrahim
2,*
1
Faculty of Science and Natural Resources, Universiti Malaysia Sabah, Kota Kinabalu 88400, Malaysia
2
Solar Energy Research Institute, Universiti Kebangsaan Malaysia, Bangi 43600, Malaysia
*
Authors to whom correspondence should be addressed.
Sustainability 2021, 13(22), 12432; https://doi.org/10.3390/su132212432
Submission received: 19 August 2021 / Revised: 25 October 2021 / Accepted: 29 October 2021 / Published: 11 November 2021
(This article belongs to the Section Energy Sustainability)

Abstract

:
This article reports on the potential use of a photovoltaic solar system on Mantanani Island. This island has its attractions in terms of flora and fauna as well as the uniqueness of its local community. The electricity supply status of the island is minimal, and the local electricity provider only provides two units of electrical generator that only supply energy from 18:00 to 06:00. This study is motivated by the hypothesis that if the target resident can obtain a better electricity supply, they can generate higher income and improve their standard of living. This study aims to identify the status of solar energy sources, estimate the basic electrical load, and conduct a techno-economic analysis of homestay enterprises of residents. Geostationary satellite data on solar energy resources were gathered and analyzed using Solargis. The electricity load was calculated based on the daily routine activities of the residents and usage of primary electrical appliances. Techno-economic analysis was done by determining the key parameters to calculate the return on investment and payback period. The results showed that Mantanani Island had great potential for implementing a photovoltaic system, by the estimated value of the total annual solar energy and peak sun hour of 1.447 MWh/m2/y and 4.05 h, respectively. The variation in total monthly solar energy was minimal, with a range of only 61.3 Wh/m2. The calculated electrical load was 7.454 kWh/d. The technoeconomic assessment showed that the return on investment was MYR 3600 per year. However, the value of the payback period varies according to the value of the cost of capital spent. Regarding the cost of capital of this study, the shortest and longest payback periods achievable were 2.78 and 13.89 years, respectively. This calculation is in line with a photovoltaic system with a capacity of 2.2 kWp.

1. Introduction

Solar energy is a renewable energy that is easy to obtain. This energy can be divided into three, namely electricity (photovoltaic “PV”), thermal, and photovoltaic–thermal PVT [1]. The PV system is used to supply electricity and is divided into grid-connected, off-grid (standalone), and hybrid. The thermal system utilizes the heat from solar radiation for purposes such as drying [2,3]. A study by Evangelisti et al. found various types of collectors in the thermal solar system [4]. The PV–T system is more complex, involving both outputs (electricity and heat), and is widely used in research to obtain the best balance [5]. The standalone solar system has become the top choice for places far from the grid network and remote, such as on islands. Despite requiring a relatively high initial cost compared to other energy resources, easily accessible solar resources with simple maintenance are the main factors in selecting this energy resource. A preliminary study on solar energy resources and local energy needs must be conducted so that the system to be installed can meet the needs and operate optimally.
The geographical conditions of the island cause difficulties in accessing energy sources. Marine energy has the potential, yet it is constrained in technological maturity and high costs [6]. Aguiar et al. and Diez et al. conducted a study on the Canary Islands of Spain [7,8]. A report by Aguiar et al. was focused on gridded satellite data suitability for global horizontal irradiation (GHI) modeling [7]. Information on solar radiation was obtained from the SAF and McClear CM models and then compared with the data from 22 measuring stations. Various procedures were applied based on different solar radiation conditions (sunny and cloudy), the station’s position (divided into two clusters according to climate), and the season. The results of this study found that both models provided good spatial and temporal resolution. Adaptation to the information obtained from the station also allows for better solar radiation prediction. Diez et al. conducted a feasibility study on solar systems combined with wind energy [8]. This study considered the effects of grants, investment rates, and energy and water sales on two desalination technologies. The results showed that this solar–wind system could supply energy up to 40–60% to the existing energy network, a decrease of 11% of greenhouse gas emissions, and a decrease in energy costs by 11-euro cent per kWh.
An investigation on Nicaragua’s Ometepe Island by Canales et al. estimated the optimal size and evaluated the performance of a solar–wind off-grid system using a mathematical model [9]. The model considered the cost of capital and the probability of a power outage, which will impact energy costs. This model stated that the optimal energy cost obtained is between €0.047/kWh and €0.095/kWh. Another study conducted in Mauritius aimed to identify the best site location for a PV solar system using a combination of multiple criteria decision making (MCDM) and analytical hierarchy process (AHP) analyses. Solargis and PVGIS validated this information. This study found a higher resolution of the annual PV solar mean map and identified suitable sites in the island’s northern part [10].
The success of the implementation in the energy sector, including the renewables industry, is related to local and foreign direct investment (FDI). This impact can be seen at the Malaysian level and globally. In Malaysia, a report emphasized that foreign direct investment (FDI) was not the only significant factor in developing a sustainable economy, including the energy sector [11]. The FDI inflows use stimulus instruments in short-term economic development. The same report stated that Malaysia should focus on investment in the workforce, new technology, and infrastructure, as this will contribute to long-term economic growth rather than generating new incentive schemes [12]. The determinants of FDI in Malaysia have been reviewed by Ang, J.B., who stated that increased financial development, infrastructure development, and trade openness would promote FDI inflow rate from a policy perspective [13].
On the other hand, tax and foreign exchange rates are seen to discourage FDI inflows. Malaysia has implemented the feed-in-tariff (FiT) program to provide incentives to renewable power producers. The effect of FiT under this Green Energy Policy on FDI was reported by Bakhtyar et al., who found a decrease in the FDI rate in oil and gas, followed by an increase in the rate of FDI in renewable energy [14]. The impact of FDI on the energy sector is more challenging internationally. Boamah et al. reported a case in Ghana and supported efforts to increase and efficiently use energy products among the population [15]. Arminen et al. and Creţan et al. provided a unique view by linking FDI to corruption and internal conflicts of the country [16,17]. Arminen’s [16] study assessed the relationship between economic growth, energy consumption, and CO2 gas emissions. The findings showed that high-income and upper–middle-income countries have the basis of economic development related to energy consumption; hence, the pollution level has not reached the maximum level.
Further findings state that climate and weather variations are more important than corruption in determining energy consumption and CO2 emissions. Creţan et al. describe the specific tragedy in Bucharest that has crippled the Romanian government [17]. This incident has directly harmed the country’s energy sector. The implementation of solar energy can be seen as more than just an environmentally-friendly alternative energy source. There is potential for solar energy to be a tool for alternative development by rejuvenating former mining areas that are now included in world heritage sites in Romania and rejuvenating former poor or less-favored regions in China [18,19,20].
A study using the smart energy system concept conducted by Cabrera et al. on Lanzoorate Island in Spain was aimed to determine the contribution of the solar system combined with wind towards the existing energy system [21]. This study reported that the solar–wind system could contribute between 5.14–24.6% of total energy generation, which is equivalent to 35% of electricity demand in 2018. Mialhe et al. found that the use of SARAH-E data with measuring stations between 2011 and 2015 showed a difference of around 15% for diurnal–seasonal variation [22]. The difference between the coastal and mountainous areas was 100 W/m2, and the island area had 20% lower solar resources than the value of the nearby seas. The study was conducted on Reunion Island in France by exploring solar energy sources using satellite-derived Solar Surface Radiation Heliosat-East (SARAH-E) data.
Another study conducted by Kumar et al. in the Andaman and Nicobar Islands of India evaluated the performance of a PV solar system with a 10 kWp capacity, as shown in Figure 1 [23]. The results found that the annual capacity factor and performance ratios were 13.71–14.61% and 64.70–64.93%, respectively. In Bangladesh, Saim and Khan investigated the solar system on Hatiya island and found that 83% was for lighting and 17% for both lighting and telephone chargers [24]. The use of this solar system became complicated due to the frequency of changing the lights and charge controllers. Other studies have been conducted by simulating the use of solar energy in island mode. The study included a control on the inverter that showed output distortion below 5% as recommended by IEEE 519-1992 standards [25]. Furthermore, Choi et al. showed that floating photovoltaic simulation integrated with hydroelectric systems minimize battery consumption, stabilize, and maximize power output based on demand response [26].
This study evaluated the suitability of solar energy on Mantanani Island, Malaysia, which is an island with great potential to become a tourist attraction. This 203.7-hectare island is located in the state of Sabah at coordinates 06°42′23″, 116°21′28″. The island group is divided into three, namely Mantanani Besar, Mantanani Kecil, and Lungisan. Figure 2 shows the position and cluster of the Mantanani islands.
The number of residents of this island is estimated at 1200 people, most of whom are Ubian. Their primary sources of income are from working as fishermen, working at resorts on the island, and working as homestay operators. There are 17 resident-owned homestays, and nine resorts identified, but the global COVID-19 disaster has affected their operations. All infrastructure and residential facilities are only available on Mantanani Besar. Among the facilities available on the island are schools, a security forces camp, a communication tower, and a lighthouse and generator set.
Mantanani Island, which has various attractions, is in the state of Sabah. The increase in tourists visiting Sabah was at 13.5% in 6 years [27]. The tourists were both foreign and local. Foreign tourists were mainly from China, Brunei, Korea, Chinese Taipei, the United Kingdom, and Ireland. The statistics and projections of foreign and local tourists can be viewed in Table 1. The search results found that one of the attractive factors is that 88.7% of these foreign tourists came to visit for its ecotourism such as forests, beaches, and oceans, including the islands [28].
On Mantanani Island, one study has identified six main aspects of local people’s attractions that can become tourist attractions: cuisine, handicrafts and carpentry, traditional games, life skills, dance and music, and celebrations and festivals [27]. These attractions can be the island’s unique factor that cannot be found elsewhere. The attraction in terms of marine life can be shown based on studies of green turtles and sea cucumbers [29,30,31]. The geological uniqueness of this island has also attracted researchers on morphological changes [32] and the relation between coastal changes and the monsoon [33] beach morphology changes during the northeast and southwest monsoons at the Mantanani Besar Island, Sabah.
The status of the electricity supply on this island is limited. Merely a total of 157 houses have electricity supply facilities from two sets of generators supplied by Sabah Electricity Sendirian Berhad, a local electricity supplier. Each generator set has a capacity of 92 kVA. Figure 3 shows the generator set provided by the local electricity supplier. Electricity is only supplied from 18:00 to 06:00. Resorts around the island have own their generator sets with capacities between 50 and 200 kVA [28]. To diversify and increase their income, some locals have started homestay businesses. These business are seen to have good potential based on the very encouraging response.
A report showed a high increase in tourists of 13.5% per annum, and the projection for 2025 was about 6.5 million [27,28]. Homestay customers also increased, as some of them stay in homestays owned by the locals.
The record of homestay visitors could not be determined accurately due to the absence of a visitor record system. Due to certain constraints, the energy supplier could only provide a 12-h electricity supply. This study proposes that if these residents were provided with a 24-h electricity supply, various beneficial activities would improve their lives and the economy. Understanding the situation has prompted the study of the solar energy potential on the island and marks the beginning of the implementation of solar energy in the future.
The use of solar energy in Malaysia is still at a low level, although this energy source is stable at high concentrations [34]. High solar energy prices contribute to this situation compared to other sources, such as diesel. The price of solar energy is high because Malaysia has a high cost of living and low oil prices compared to all its neighboring countries, except Brunei. This disadvantage has led the consumer to prefer oil based fuel over solar [35]. However, the situation changed after the Malaysian government implemented policy and incentives toward using green energy, such as the feed-in-tariff [36] and Net Energy Metering Schemes [37]. Solar energy is gaining more attention as solar energy prices become more competitive and driven by oil price volatility. Some reports show that there is an increase in the value of solar power generation. Yet, solar power generated is small compared to the total mix of power generation [38,39].
Moreover, most of the solar power in the data is contributed by solar farms or on-grid solar generation. Therefore, the authors see this situation as a research gap to study the potential use of solar energy on the island. This potential is designed and will be described in Section 2. Not many studies have focused on the study of the feasibility of off-grid solar energy on the island. A study concluded that the islands in Sabah, including Mantanani Island, have good potential for solar energy, but they must be hybridized with other energy sources [40]. This study was conducted using Homer software. A study by Lau et al. evaluates several factors such as diesel price and interest rate [35]. The research was conducted to identify the element that economically allows diesel generators to be replaced with a solar system. For diesel prices of USD 0.61/L and an interest rate of 0–3%, the optimal approach is a combination of PV and diesel. However, if diesel price increases (USD 1.22/L or more), the implementation of PV systems is more dominant. Ashourian et al. reported a feasibility study on using the solar system for an island in Malaysia with two different load conditions from tourists and locals [41]. They proved a 200-kW solar system and 40 kW wind energy could accommodate both rated loads. However, this result is more economical if the diesel price reaches MYR 2.10/L and above.

2. Methodology

The scenario of limited electricity supply on the island has become an obstacle to various activities that can help improve the economy and the living standards of the local community. In line with the problem statement and motivation of the study, the objective of this study was to evaluate the solar energy resources on the island. In addition, this study will determine the basic electrical load for a house and create a technoeconomic analysis simulation for a local homestay enterprise. A summary of the methodology of this study is shown in Figure 4.
All information on solar energy resources was obtained from Solargis, the same source used by Doorga et al. [10] in their study for validation. Solargis calculates solar resource characteristics using data from geostationary satellites and a meteorological model. It is done by considering the factor of penetration of solar radiation into the atmosphere to the ground surface.
The study found that PV solar panels would produce optimal output when the surface is perpendicular to the sun’s rays and at optimal temperature [34,42,43,44]. Understanding the annual sun path and azimuth is essential to determine whether the solar system to be built requires a tracking mechanism. In addition, the need for this mechanism will involve costs that will affect the cost of future analysis.
Next, the information would be processed and translated into normal distribution values of solar radiation for each hour, day, and year. The results of this analysis will help with the process of sizing the PV solar system. The information that would be observed includes the highest radiation intensity, the difference in radiation distribution per month, the amount of annual solar energy, and the time of the annual peak hour.
Electrical loads were determined by simulating the use of essential electrical appliances. The lives of the residents of this island do not depend on the electricity supply. However, with the availability of electricity, their lives will get better.
Questionnaires were distributed among the residents to identify the essential electrical appliances they needed and the timing of their use. A total of 100 questionnaires were distributed and answered with the help of researchers. The primary purpose of this questionnaire is to identify the estimated household energy load. This load is used to determine the daily load profile, daily load value (kWh/day), and peak load (kW). The questions are shown in Table 2, and the target respondents are as follows:
  • Age: 18 years old and below (20%), 18–30 years old (40%), 30 years old and above (40%);
  • Gender: male (50%), female (50%);
  • Mandatory for all homestay operators.
The energy load calculation for each electrical appliance and the total energy load per day were respectively determined using Equation (1). Then, the pattern and total daily electrical load required could be estimated.
Total load = ∑L = L1 + L2 + L3 + … + Ln
= P1t1 + P2t2 + P3t3 + … + Pntn
= I1V1t1 + I2V2t2 + I3V3t3 + … + InVntn
where
  • L = load of electrical appliance, Wh
  • n = number of electrical appliances
  • P = power of the electrical appliance, W
  • t = usage period, h
  • I = current of electrical appliance, A
  • V = voltage of electrical appliance, V
Energy balance was described based on the source of solar energy, PV output from the solar system, and electrical load. The solar energy source or annual direct average irradiation DNI value was 1.48 MWh/m2. The annual DNI value was calculated as a result of adding up the monthly DNI obtained from Solargis. The annual output of the PV system was 3.21 MWh, from a 2.2 kWp solar system with an average efficiency of 15.1%. The monthly efficiency ηmonth and annual efficiency ηannual were estimated using Equation (2) and Equation (3), respectively.
ηmonth = (Qmonth/DNImonth.Apv) × 100
where
  • Qmonth = monthly energy output, Wh
  • DNImonth = monthly normal irradiance, W/m2
  • Apv = PV panel area, m2
ηannual = [∑ (Qmonth/DNImonth.Apv)/12] × 100
where
  • ηn month = monthly PV efficiency, %
The Apv value was fixed at 14.58 m2. Electrical load indicates the energy required based on the power rate and period of electricity consumption of each electrical item per day. This determination is a continuation of Equation (1). The monthly load was estimated using Equation (4), while the annual load was used in the energy balance analysis.
Lmonth = L × D = (I1V1t1 + I2V2t2 + I3V3t3 + … + InVntn) × D
where
  • L = daily load, Wh
  • D = days of a month
PV output was assessed monthly, with minimum and maximum values of 238.0 kWh and 317.6 kWh, respectively. The annual output was 3.21 MWh, which was matched with the annual consumption. The estimated annual load value was 2.72 MWh. The match between PV energy supplied and the energy consumption is essential to ensure adequate energy supply throughout the year. This match is determined by the value of the percentage of energy use calculated using Equation (5).
Energy use = (consumption/PV energy supply) × 100
Energy balance analysis can be conceptually referred to in Figure 5 and described in detail in Section 3.
The technoeconomic analysis in this study calculated the effect of the solar system usage on the homestay enterprises of the residents of Mantanani Island. First, the enterprises’ revenue or return on investment (ROI) of the homestay was determined based on the solar system operating cost, the homestay operating cost, and the annual income. Annual income was determined by the annual number of visitors, the overnight rental rate, and the number of days of stay. Finally, the annual ROI was calculated using Equation (6).
Return on investment ROI = T.R.D − (COpv + COhs)
where
  • T = annual number of visitors
  • R = overnight rental rate
  • D = number of days of stay
  • COpv = solar system operating cost per year
  • COhs = homestay operating cost per year
Then, the payback period (PP) was evaluated based on the cost of capital and annual income, as in Equation (7). The value of PP was expected to be in a range because the cost of solar system is different and are described in the Section 3.
Payback period PP = CC/[T.R.D − (COpv + COhs)]
where
  • CC = capital cost.

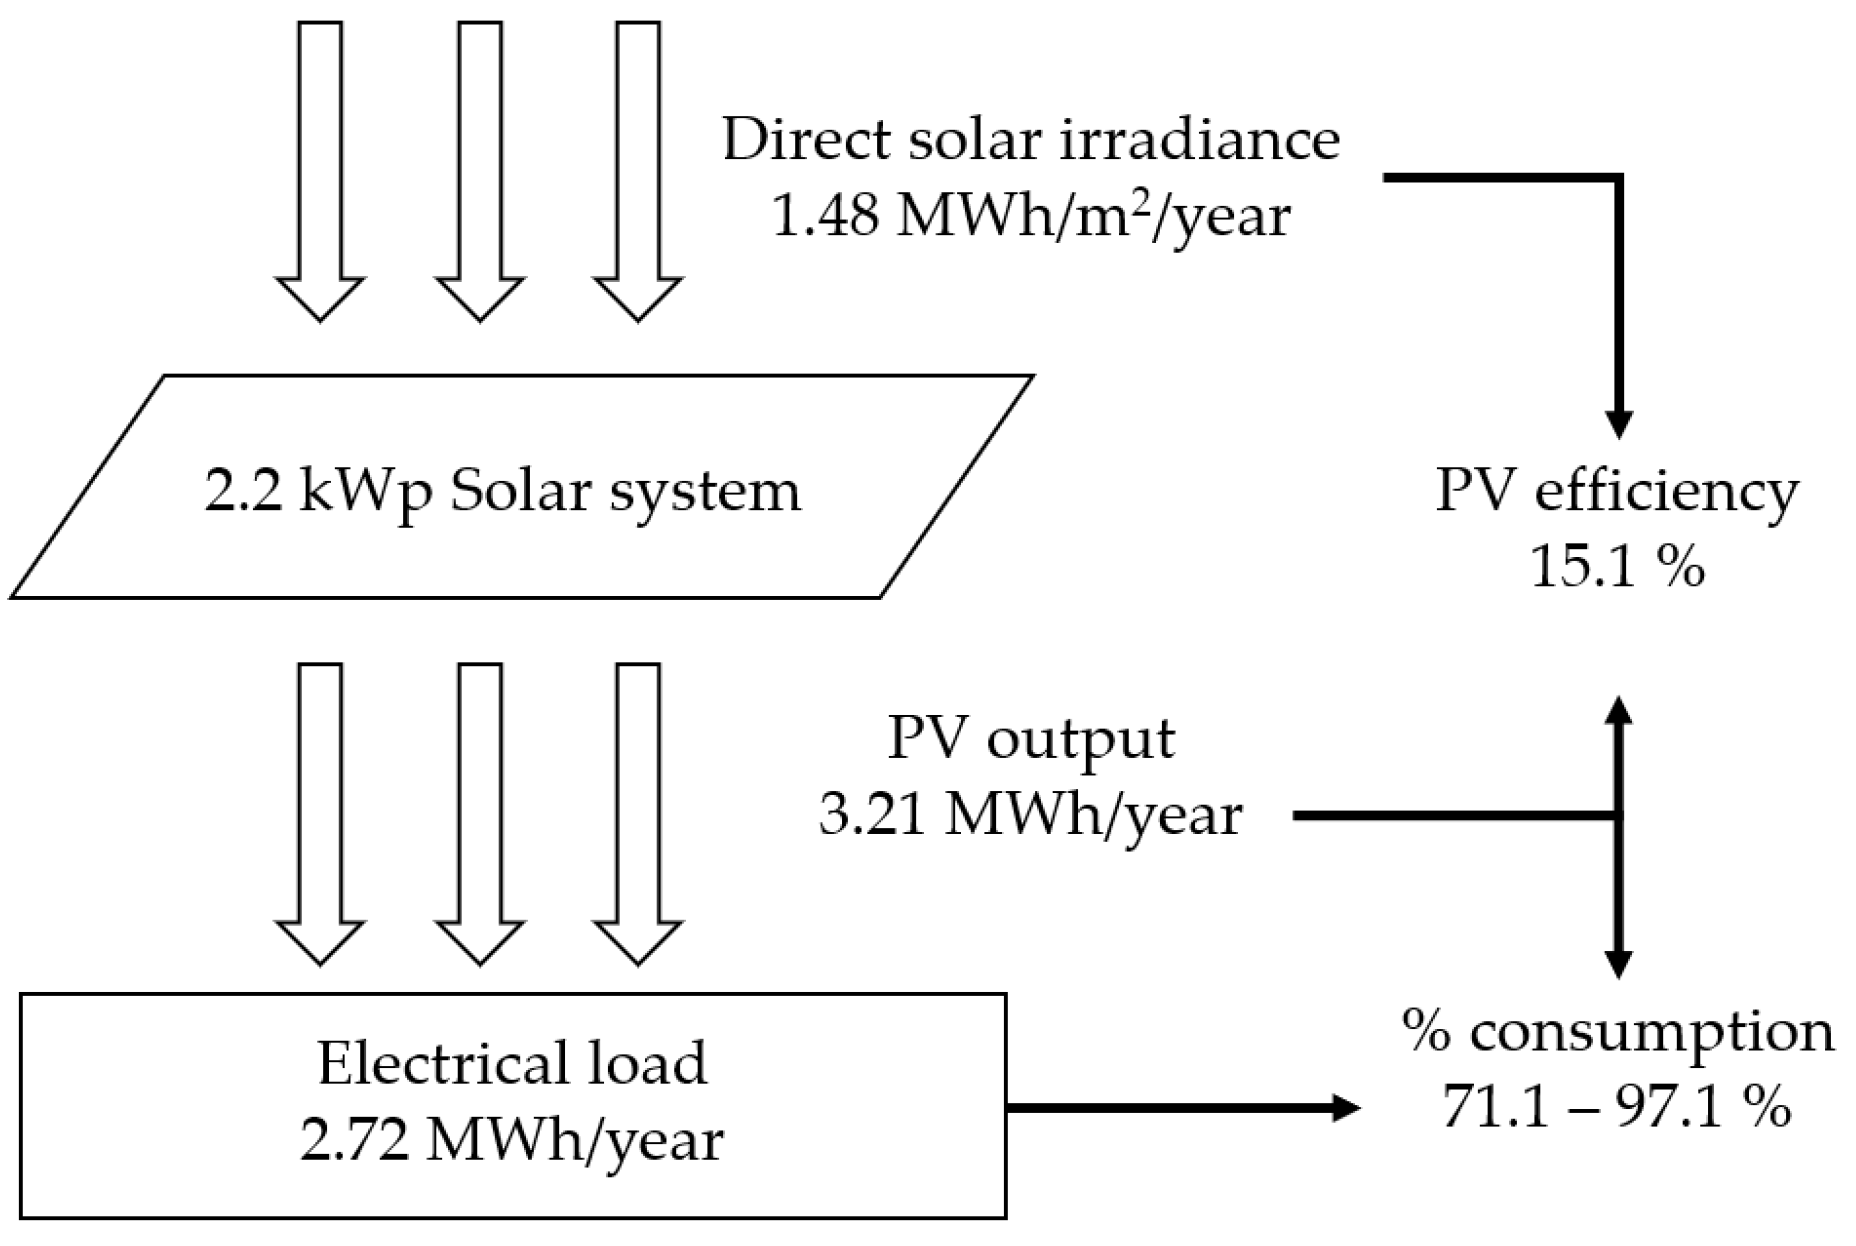
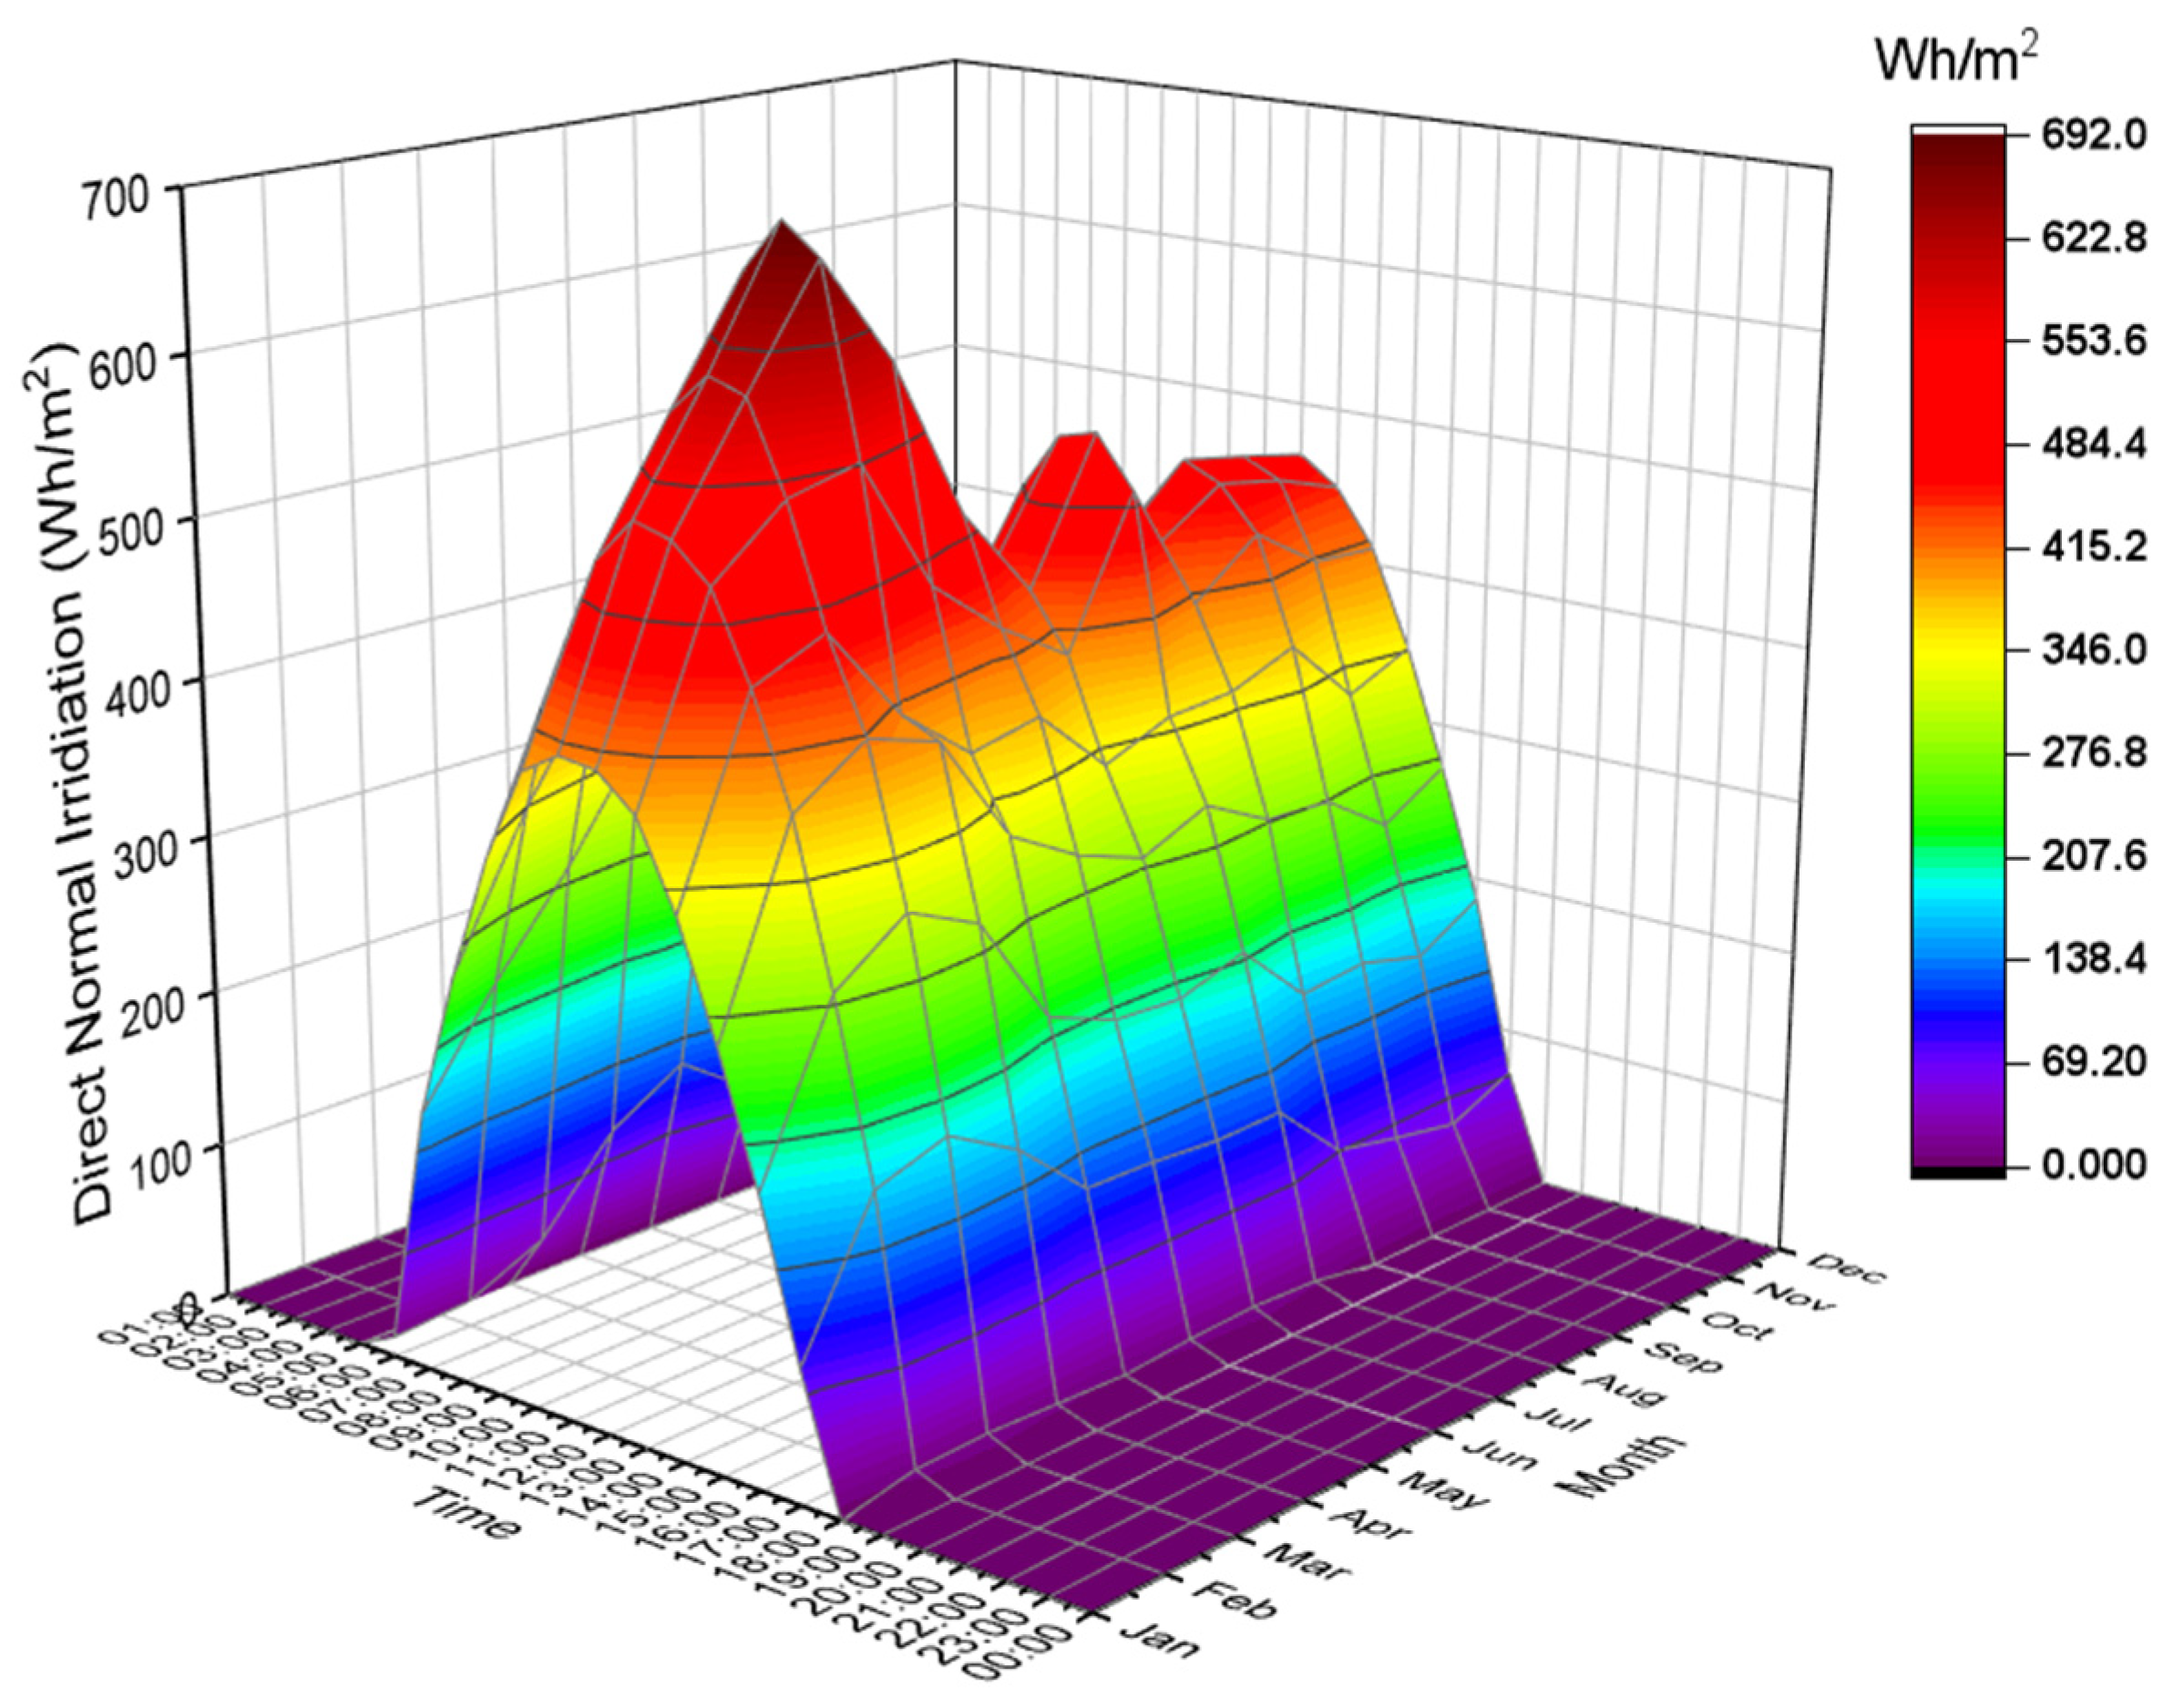
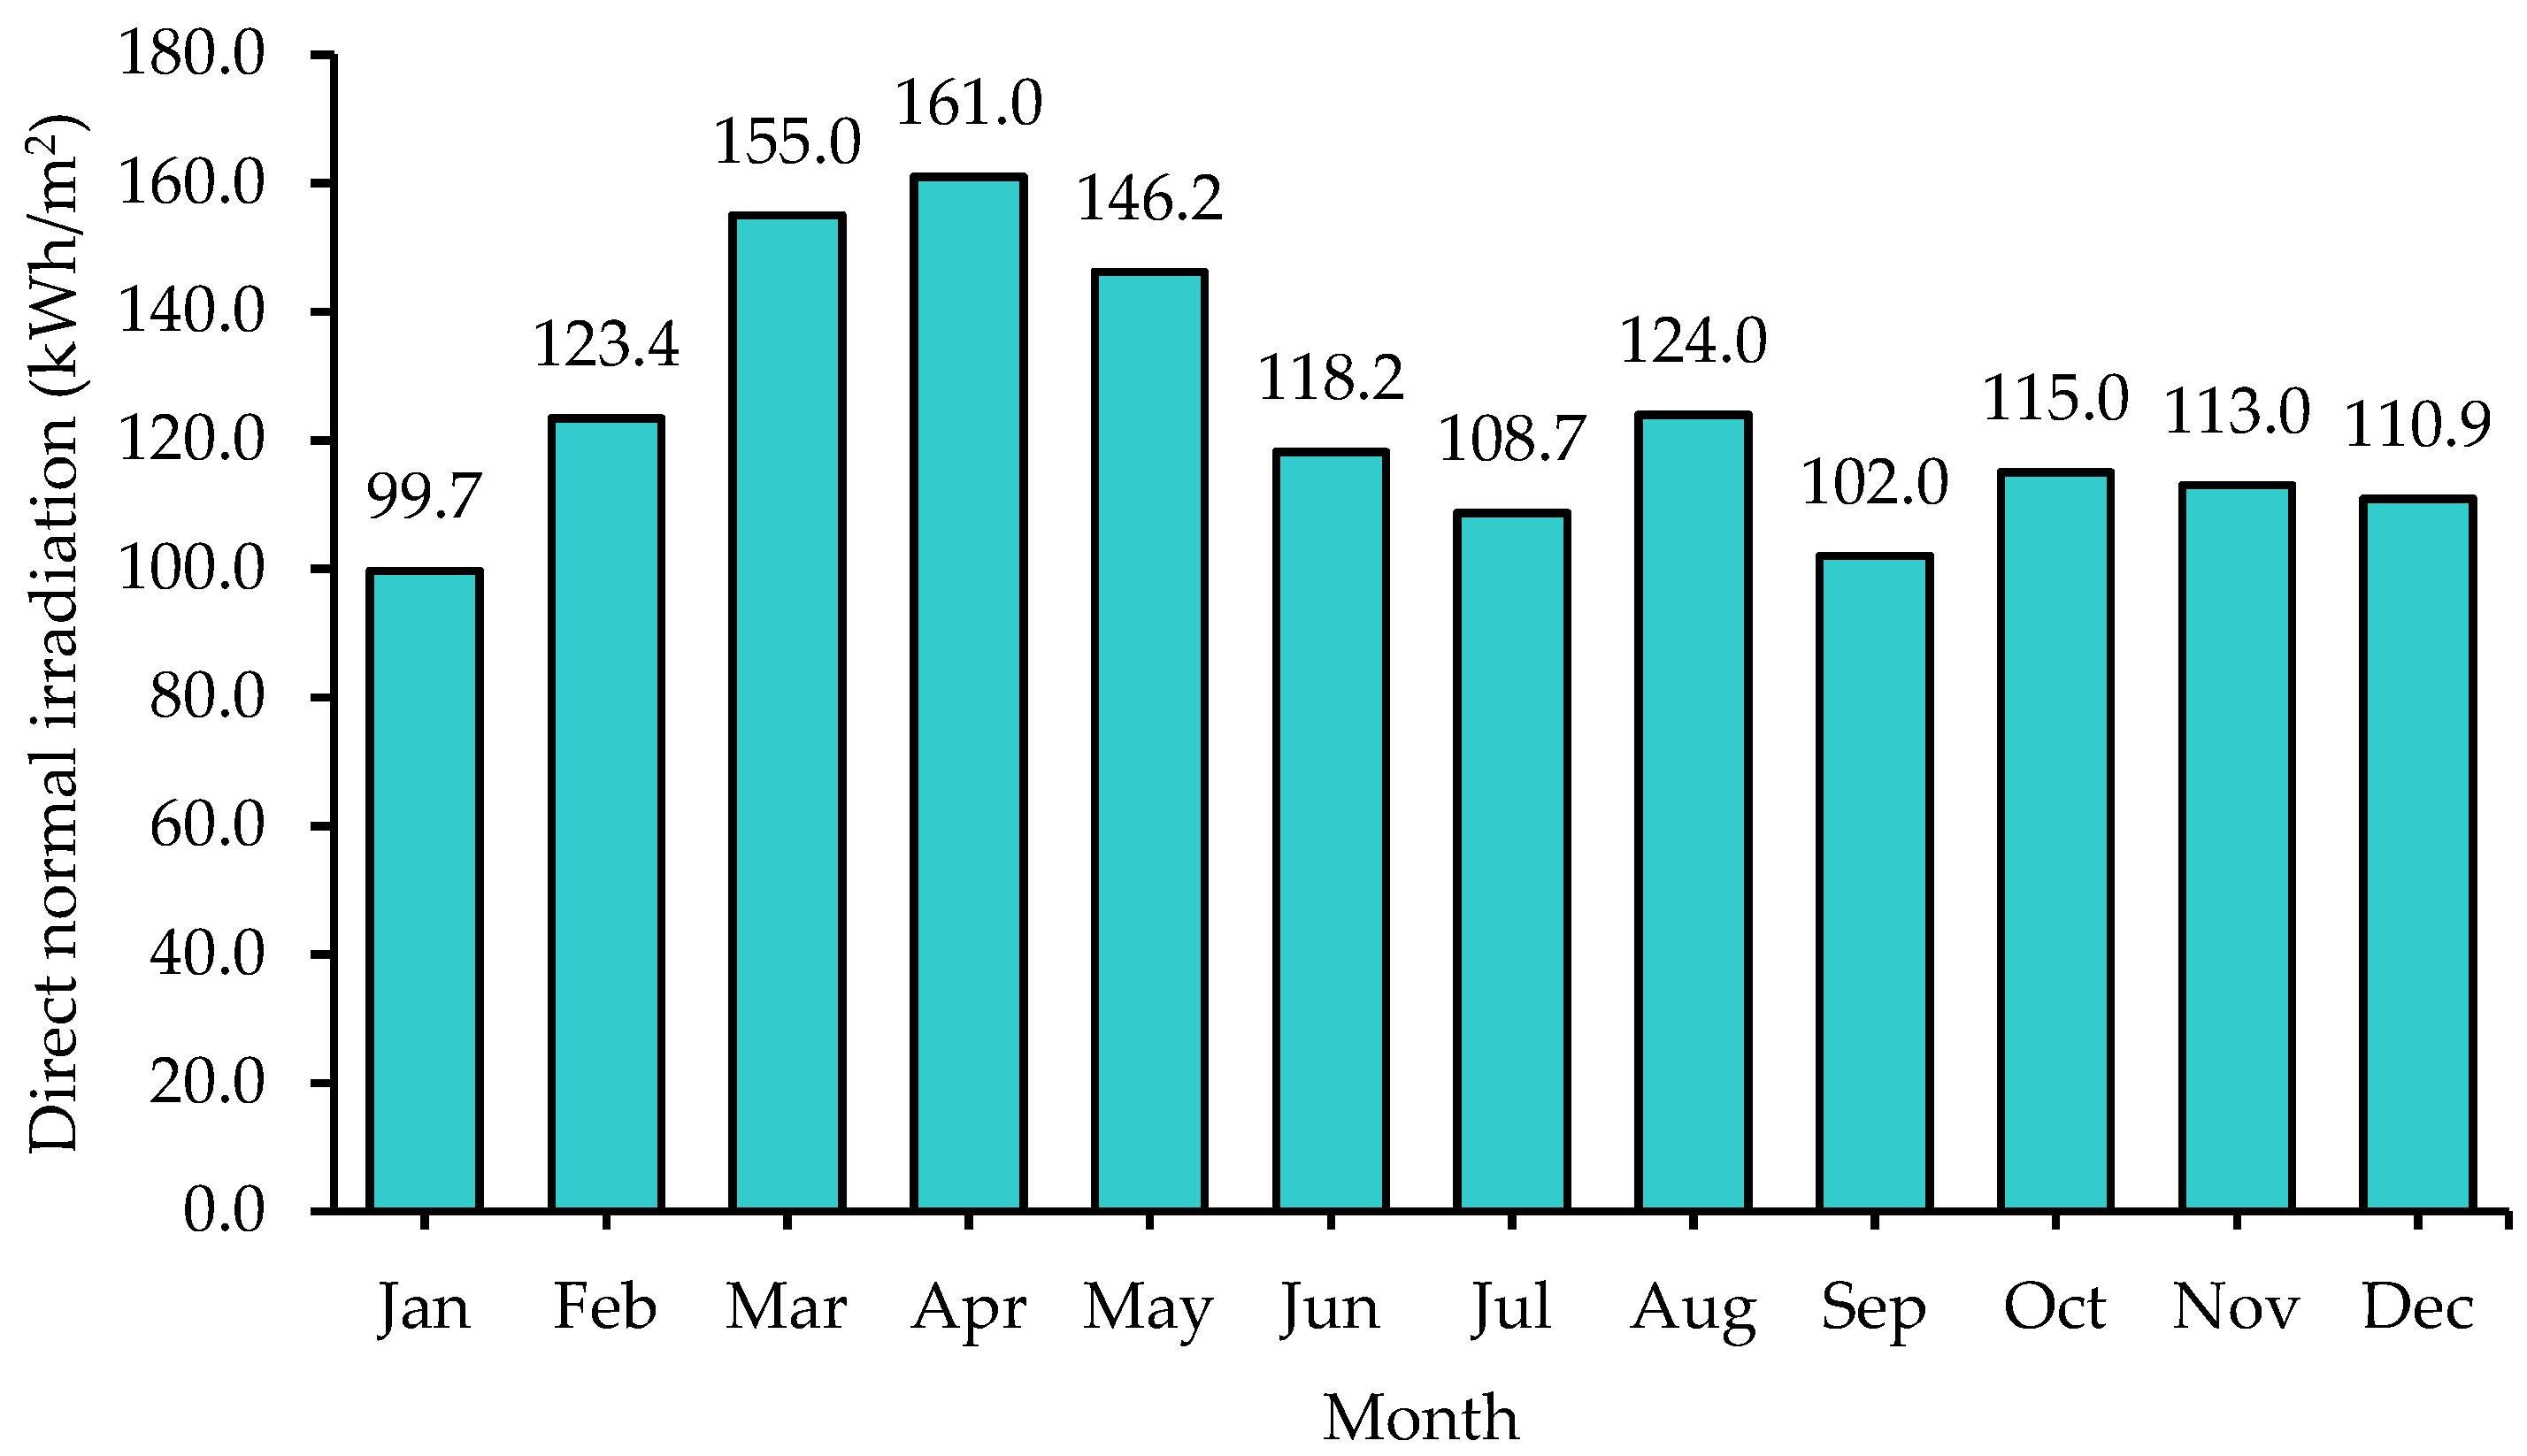
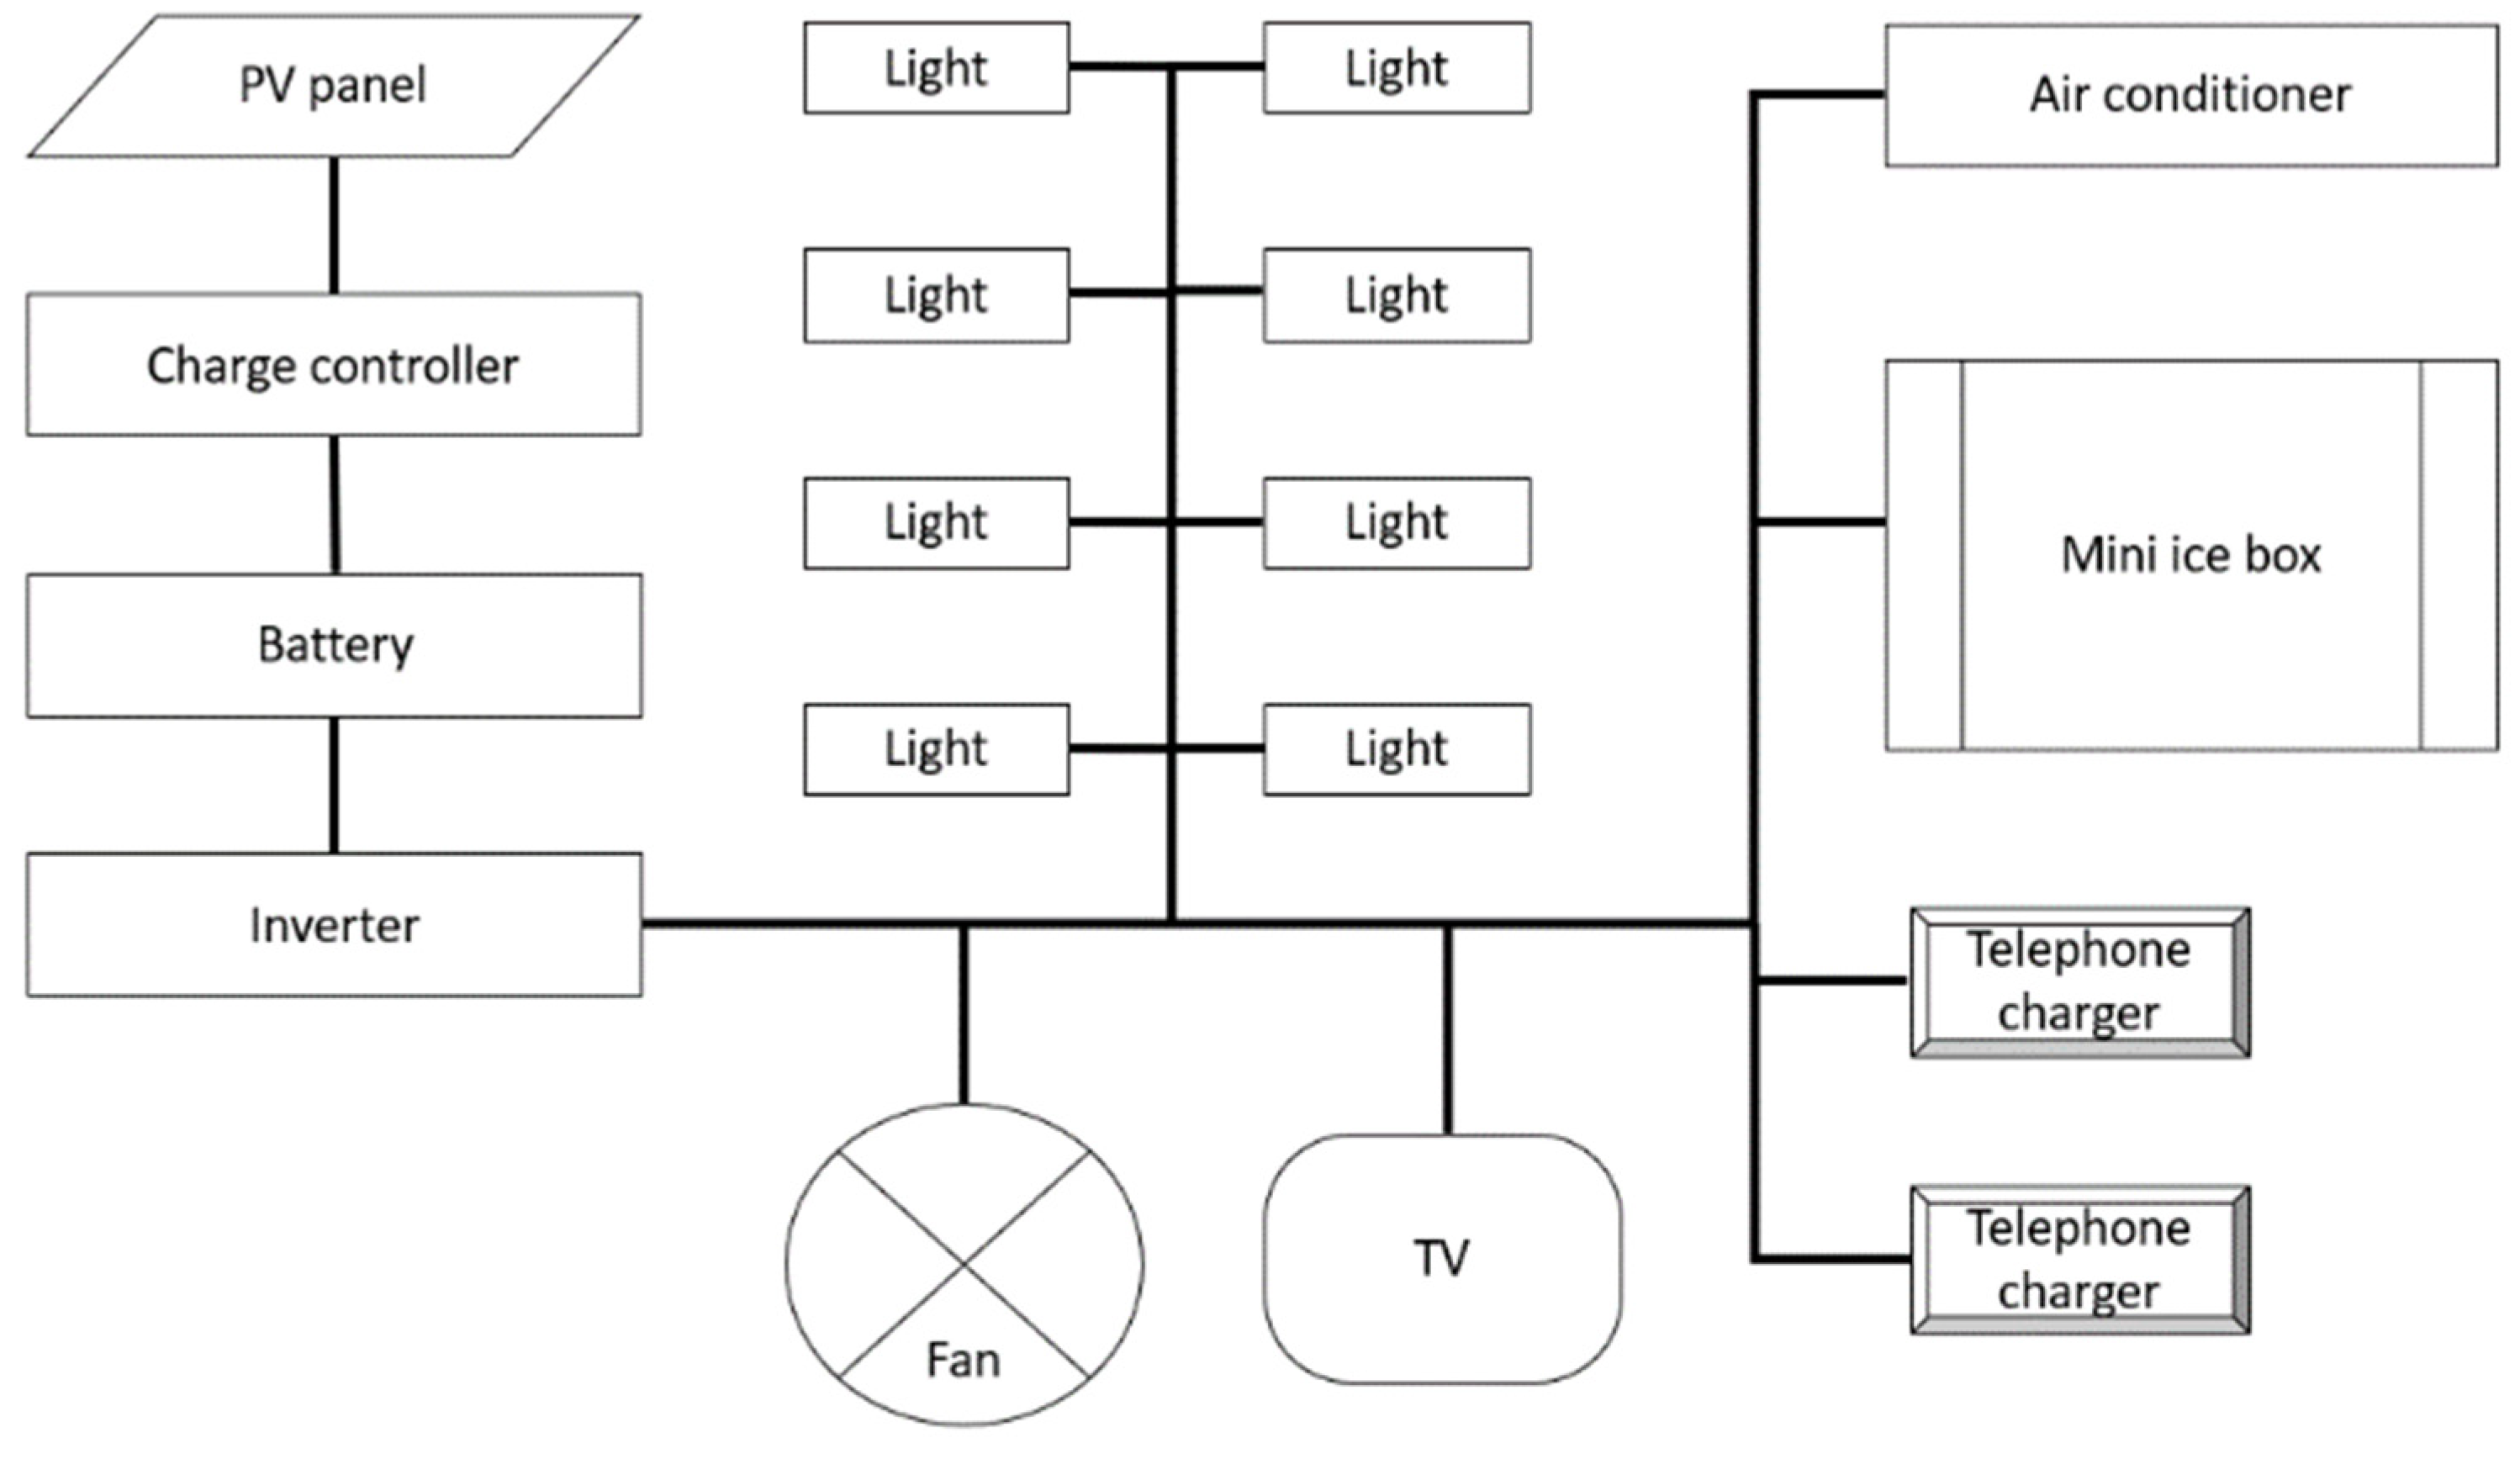
3. Results and Discussion

Figure 6 shows the average direct value of monthly irradiation for each hour. In general, the shape of the graph for each month is the same, where the reading starts at around 06:00, then rises until it reaches a high value at around 12:00, then decreases and ends around 18:00. The highest and the lowest month graphs were recorded in April and January, respectively. Based on Figure 6, which is the contour diagram of the average value of direct normal irradiation for each hour interval, the highest peak reading observed in April at the 11:00–12:00 interval is 691 Wh/m2. The lowest peak reading is in January at the 11:00–12:00 interval is 408 Wh/m2. In addition, the sunset is relatively late in February to August and is at the 06:00–19:00 interval, compared to September to January, where the sun sets at the 05:00–18:00 interval.
The monthly irradiation values can be observed in Figure 7. The months of April and January recorded maximum and minimum readings, respectively. The maximum, minimum, and average values are 161.0 Wh/m2, 99.7 Wh/m2 and 123.1 Wh/m2, respectively, with a value range of 61.3 Wh/m2.
The amount of solar energy or direct average irradiation was 1477 kWh/m2/year, and the peak sun hour value (PSH) was estimated to be 4.05 PSH. A total of 1447 kWh of energy can be obtained from every square meter in a year. The PSH value shows 4.05 h of solar radiation intensity at 1000 W/m2. These values are essential to be used as a reference if a solar system, whether PV, thermal, or PVT, is to be developed in this area.
Based on the questionnaire findings, all respondents think that electricity supply is essential in daily life and indicates a high level of awareness among the islanders. In addition, they also know and have enjoyed an electricity supply. As much as 95% of respondents think that an electricity supply is mandatory, while 5% think the opposite. We found that all respondents in this minority group were among the elderly. They have lived without electricity for a long time before and feel that it is not mandatory. Seventy-eight percent of respondents think that the electricity supply should be upgraded to 24 h instead of 12 h. They argue that if there is a 24-hour electricity supply, many activities can be done. Prolonged periods of electricity supply are required for fans, televisions, and refrigerators. Twelve percent of respondents say electricity supply is enough for 12 h now and does not need to be supplied for 24 h. Financial factors are the main factors explaining why this group thinks so. They are worried that they will not be able to pay for electricity if it is supplied continuously, and that its consumption will also increase. Another 10% of respondents could not give a solid answer and did not care whether the supply was 12 h or 24 h. All respondents did not know if it was solar energy. The population has not had exposure to solar energy all this time. All respondents did not care that solar energy was supplied as long as it could be used, just like a conventional power supply. The homestay operators think that their homestay business will prosper if the electricity supply is provided 24 h to provide comfort to their customers. Questions 12–14 are information query questions translated in Table 3.
The residents of this island have been living without electricity for a long time. Even with the limited energy supply from local suppliers through generators, residents can continue their lives without electricity. Therefore, the electrical load calculation in this study was only based on essential electrical appliances and a minimal usage period. This electrical appliance selection will focus on lighting, ventilation, fresh food storage, and communication. After conducting a brief questionnaire on the island, the list of electrical appliances, estimated appliance power, and usage period is shown in Table 3.
This PV system for supplying electricity to loads consists of PV panels, a charge controller, battery, inverter, and load. Solar radiation that falls on the surface of the PV panel is converted into electrical energy. This energy is then used to charge the battery, which serves as an energy storage medium. The charge controller controls the charge and discharge process and protects the system from any damage. Among the errors or accidents that can occur and cause damage are polarity errors, short circuits, overcharge, and over-discharge. The inverter converts DC from the battery to AC to be used by electrical appliances. This standalone system is shown in Figure 8.
A simulation of each electrical appliance usage was conducted based on the daily activities of the residents. Minimum power consumption was 100 W from 23:00 to 10:00. During this period, the residents were sleeping and working in the morning. The men would be going to sea to fish, the mothers would be doing housework, and the children would be going to school. This minimal energy consumption was contributed by a mini-fridge that operates 24 h. The consumption increased slightly during the period 11:00 to 18:00 and was contributed by the use of fans. The surroundings of the house would be hot and require fan ventilation. Often the fisherman would return home at this time. Consumption continued to increase after 18:00 and reached a maximum load consumption of 372 W from 19:00 to 22:00. Almost all electrical appliances were turned on, including lights, air conditioners, TVs, and telephone chargers. The values of electrical load according to time can be observed graphically in Figure 9. Based on the estimates from this simulation, the maximum, minimum, and total daily electrical load values are 100 W, 372 W, and 7.454 kWh/d, respectively.
Energy balance analysis shows that PV efficiency ranges between 13.2 and 17.2% and PV energy consumption between 72.1 and 97.1%. The average efficiency of the PV system is 15.1%. This average value is acceptable because it aligns with values from other studies [45,46,47,48,49]. The percentage of energy consumption shows a reading that fluctuates each month. Because the size of the PV system and the electrical load are constant, the change in the percentage value of energy consumption is due to the monthly solar energy intensity. Figure 10 shows the PV efficiency and PV energy consumption (in %) throughout the year.
Based on Figure 10, the most critical month is in January. Almost all the energy supplied is consumed at 97.1%. Figure 11 shows the PV energy supply and energy consumption. The PV output is the total value of energy produced by the PV system each month, and PV energy consumption is the total monthly load.
March had the highest PV energy output and surplus energy levels, with 317.5 kWh and 86.5 kWh, respectively, and high PV output contributes to this surplus. The balance between energy production and consumption is acceptable. The design and size of the solar system should be optimal and should not have too much excess energy that can lead to oversizing. However, at the same time, energy consumption should not exceed the limit of energy production, resulting in energy shortage. Figure 11 proves that the PV system in this study can supply continuous energy throughout the year optimally.
Pricing for each parameter involved in the calculation of annual ROI and PP is essential. This analysis is based on the lowest income, the number of visitors, and the minimum frequency for a year. A study on the island found that a homestay had at least one room to accommodate two visitors. The rental rate is MYR 80 per person for one night. The operating costs of the PV system, homestay operations, and the PV system capital costs are shown in Table 4, and the PV system cost breakdown is shown in Table 5.
The PV system corresponds to the rated load estimate of the 2.2-kW system size. Yet the findings showed that installation costs vary depending on the component quality, profit-taking by the contractor, lack of price uniformity by authorities, high transportation costs, and limited expertise of installers. Therefore, this study set the installation cost or capital in the sensitivity range, that is, every MYR 10,000 starting from MYR 10,000 up to MYR 50,000. Operating costs, including maintenance, were estimated at MYR 100 per month because the PV system was straightforward and required minimal maintenance. Based on Equation (6), the calculated ROI is MYR 3600 per year. Next, the PP was calculated in the form of capital cost range sensitivity. The lowest and highest cost of capital values were in the range of MYR 10,000 and MYR 50,000, and the PP values were 2.78 and 13.89 years, respectively. These values can be observed in the form of a graph shown in Figure 12. Each interception with an ROI line determines the PP period of each capital cost that has been set.
These results show that if the homestay owners on that island can reduce their capital costs to as low as MYR 10,000, they will profit after 2.78 years. This period will increase in proportion to the increase in capital cost.
Another scenario was analyzed by considering the increase in rates and the number of rental days. The cost of PV system installation is based on Table 4, with the minimum and maximum values of MYR 37,036 and 56,036, respectively. The increase of homestay revenue is 2% annually. This value is based on reports which stated a 13.5% increase in tourists in 6 years, and 88.7% of these tourists would choose islands as their tourist destination [27,28]. Estimates of profit and ROI can be seen in Figure 13.
Both lines represent the installation cost of the solar system at the minimum and maximum values. While the gradients of the two lines are the same, they represent annual gains. Figure 13 shows the PP for minimum and maximum installation costs are 10.1 and 15.2 years, respectively.
The PP for a solar system is important, which shows how quickly the overall cash flow becomes positive. Many studies give different PP depending on several factors. The value of PP is fast if the value is 0–2 years as per the studies by Hage et al. (0.125 years) [50]; Fudholi et al. (1 year) [51]; Singh et al. (1.5 years) [52]; Hage et al. (1.5 years) [50]; Elkhadraoui et al. (1.6 years) [53]; and Dhanushkodi et al. (1.99 years) [54]. Medium PP values were 2–5 years, as studied by Fudholi et al. (2.32 years) [55]; Hamid et al. (3.7 years) [2,3]; and Hamdani et al. (2.6 years) [56]. For PP, over 5 years can be considered as long, such as in a study by Singh et al. (5.42 years) [57]. Observations show that the variation value of PP is due to the profit value of service or product produced and numbers of annual operations. Operating costs do not significantly impact PP, but the study gives the minimum and maximum PP values of 10.1 and 15.2 years, respectively. These PP values are categorized as long as they are over 5 years. Homestay rental rates are small compared to the overall cost of the solar system. The PP value for this system can be shortened in several ways, such as by increasing the rental rate per night and the number of rental days. The value of PP can also be shortened if the homestay business owner can reduce the overall cost of the solar system.

4. Conclusions

This study reported the status of solar energy resources in Mantanani Island and identified the basic electricity load and the technoeconomic analysis of local homestay enterprises. The island’s location close to the earth’s equator gives an advantage specifically in terms of sun path and azimuth. Based on the calculations, the annual solar energy and PSH values were 1477 kWh/m2/year and 4.05 PSH, respectively. The electrical loads were given priority for minimal electrical appliance necessities such as lighting, ventilation, fresh food storage, and telecommunications. The total daily load was found to be 7.454 kWh/d. The technoeconomic analysis was performed based on the minimum income for each sensitivity range determined. This range was based on the cost of capital ranging from MYR 10,000 to 50,000. The results showed that the payback period was directly proportional to the cost of capital. For projection, the profits will be achieved after 2.78 years. However, the period may be longer if the capital is higher.
In line with the Malaysian Government policy as detailed in the Green Technology Master Plan Malaysia 2017–2030, renewable energies are critical areas that the government needs to address. It is projected that by 2030, Malaysia will achieve 30% power provided from renewable energy sources. Hence, the proposed method in this paper will be able to facilitate the government’s future direction. The contribution of this study has provided a clear picture of the potential use of solar energy in the tropical islands of Malaysia. This potential is refined through solar energy source information, questionnaires, and technoeconomic analysis. The effect of this study proves the need for solar energy and the impact on new economic activities that are gaining popularity, namely homestay businesses. In addition, this report has also given an overview of the incurred cost and the cash flow of the homestay business if the proposed solar system is to be installed. This trend is shown in the results of the discussion of the technoeconomic analysis.

Author Contributions

Conceptualization, A.S.A.H. and A.I.; methodology, A.S.A.H.; software, M.Z.H.M., A.B.A.R. and Z.J.; validation, A.S.A.H. and A.I.; formal analysis, A.S.A.H.; investigation, A.S.A.H.; resources, M.Z.H.M., A.B.A.R. and Z.J.; data curation, M.Z.H.M., A.B.A.R. and Z.J.; writing—original draft preparation, A.S.A.H.; writing—review and editing, M.Z.H.M., A.B.A.R. and Z.J.; visualization, M.Z.H.M., A.B.A.R. and Z.J.; supervision, A.I.; project administration, A.S.A.H.; funding acquisition, A.S.A.H. and Z.J. All authors have read and agreed to the published version of the manuscript.

Funding

This research was funded by Universiti Malaysia Sabah (UMS) and Universiti Kebangsaan Malaysia (UKM), research grant Program Translational MRUN Rakan-RU-2019-001/4, and The APC was funded by Universiti Malaysia Sabah (UMS).

Institutional Review Board Statement

Not applicable.

Informed Consent Statement

Not applicable.

Data Availability Statement

Not applicable.

Acknowledgments

The authors would like to thank the Faculty of Science and Natural Resources, UMS and Solar Energy Research Institute, UKM for the lab facilities.

Conflicts of Interest

The authors declare no conflict of interest.

References

  1. Ibrahim, A.; Othman, M.Y.; Ruslan, M.H.; Mat, S.; Sopian, K. Recent advances in flat plate photovoltaic/thermal (PV/T) solar collectors. Renew. Sustain. Energy Rev. 2010, 15, 352–365. [Google Scholar] [CrossRef]
  2. Hamid, A.S.A.; Ibrahim, A.; Mat, S.; Sopian, K. Experimental evaluation on large scale solar dryer for drying natural fiber in Malaysia. Int. J. Renew. Energy Res. 2019, 9, 598–604. [Google Scholar]
  3. Hamid, A.S.A.; Ibrahim, A.; Assadeg, J.; Ahmad, E.Z.; Sopian, K. Techno-economic Analysis of a Hybrid Solar Dryer with a Vacuum Tube Collector for Hibiscus Cannabinus L Fiber. Int. J. Renew. Energy Res. 2020, 10, 1609–1613. [Google Scholar]
  4. Evangelisti, L.; Vollaro, R.D.L.; Asdrubali, F. Latest advances on solar thermal collectors: A comprehensive review. Renew. Sustain. Energy Rev. 2019, 114, 109318. [Google Scholar] [CrossRef]
  5. Fudholi, A.; Sopian, K.; Yazdi, M.H.; Ruslan, M.H.; Ibrahim, A.; Kazem, H.A. Performance analysis of photovoltaic thermal (PVT) water collectors. Energy Convers. Manag. 2013, 78, 641–651. [Google Scholar] [CrossRef]
  6. Lee, S.K.; Dayou, J.; Ag, A.S.; Saleh, E.; Ismail, B. A theoretical investigation on the potential application of ocean salinity and temperature energy conversion (OSTEC). Int. J. Renew. Energy Res. 2012, 2, 326–331. [Google Scholar] [CrossRef]
  7. Aguiar, L.M.; Polo, J.; Vindel, J.; Oliver, A. Analysis of satellite derived solar irradiance in islands with site adaptation techniques for improving the uncertainty. Renew. Energy 2018, 135, 98–107. [Google Scholar] [CrossRef]
  8. Borge-Diez, D.; García-Moya, F.J.; Cabrera-Santana, P.; Rosales-Asensio, E. Feasibility analysis of wind and solar powered desalination plants: An application to islands. Sci. Total Environ. 2020, 764, 142878. [Google Scholar] [CrossRef]
  9. Canales, F.A.; Jurasz, J.K.; Guezgouz, M.; Beluco, A. Cost-reliability analysis of hybrid pumped-battery storage for solar and wind energy integration in an island community. Sustain. Energy Technol. Assess. 2021, 44, 101062. [Google Scholar] [CrossRef]
  10. Doorga, J.R.S.; Rughooputh, S.D.; Boojhawon, R. High resolution spatio-temporal modelling of solar photovoltaic potential for tropical islands: Case of Mauritius. Energy 2018, 169, 972–987. [Google Scholar] [CrossRef]
  11. Lee Chew, G. Foreign Direct Investment Pollution, and Econimic Growth: Evidence in Malaysia. Appl. Econ. 2009, 41, 1709–1716. [Google Scholar]
  12. United Nations Conference on Trade and Development. Investment, Trade and International Policy Arrangements; World Investment Report 1996. Foreign Trade Rev. 1996, 31, 85–109. [Google Scholar] [CrossRef]
  13. Ang, J. Determinants of foreign direct investment in Malaysia. J. Policy Model. 2008, 30, 185–189. [Google Scholar] [CrossRef]
  14. Ahmad, N.A.; Ismail, N.W.; Nordin, N. The Impact of Infrastructure on Foreign Direct Investment in Malaysia. Int. J. Manag. Excel. 2015, 5, 584–590. [Google Scholar] [CrossRef] [Green Version]
  15. Boamah, K.B.; Du, J.; Xu, L.; Mensah, C.N.; Khan, M.A.S.; Allotey, D.K. A study on the responsiveness of the environment to international trade, energy consumption, and economic growth. The case of Ghana. Energy Sci. Eng. 2020, 8, 1729–1745. [Google Scholar] [CrossRef]
  16. Arminen, H.; Menegaki, A.N. Corruption, climate and the energy-environment-growth nexus. Energy Econ. 2019, 80, 621–634. [Google Scholar] [CrossRef]
  17. Creţan, R.; O’Brien, T. Corruption and conflagration: (in)justice and protest in Bucharest after the Colectiv fire. Urban Geogr. 2019, 41, 368–388. [Google Scholar] [CrossRef]
  18. Rîșteiu, N.T.; Creţan, R.; O’Brien, T. Contesting post-communist economic development: Gold extraction, local community, and rural decline in Romania. Eurasian Geogr. Econ. 2021, 1–23. [Google Scholar] [CrossRef]
  19. Crețan, R.; Guran-Nica, L.; Platon, D.; Turnock, D. Foreign Direct Investment and Social Risk in Romania: Progress in Less-Favoured Areas 1. In Foreign Direct Investment and Regional Development in East Central Europe and the Former Soviet Union; Routledge: Oxfordshire, UK, 2017; pp. 305–348. [Google Scholar]
  20. Geall, S.; Shen, W. Gongbuzeren Solar energy for poverty alleviation in China: State ambitions, bureaucratic interests, and local realities. Energy Res. Soc. Sci. 2018, 41, 238–248. [Google Scholar] [CrossRef]
  21. Cabrera, P.; Carta, J.A.; Lund, H.; Thellufsen, J.Z. Large-scale optimal integration of wind and solar photovoltaic power in water-energy systems on islands. Energy Convers. Manag. 2021, 235, 113982. [Google Scholar] [CrossRef]
  22. Mialhe, P.; Pohl, B.; Morel, B.; Trentmann, J.; Jumaux, G.; Bonnardot, F.; Bessafi, M.; Chabriat, J.-P. On the determination of coherent solar climates over a tropical island with a complex topography. Sol. Energy 2020, 206, 508–521. [Google Scholar] [CrossRef]
  23. Kumar, P.; Pal, N.; Sharma, H. Performance analysis and evaluation of 10 kWp solar photovoltaic array for remote islands of Andaman and Nicobar. Sustain. Energy Technol. Assess. 2020, 42, 100889. [Google Scholar] [CrossRef]
  24. Saim, A.; Khan, I. Problematizing solar energy in Bangladesh: Benefits, burdens, and electricity access through solar home systems in remote islands. Energy Res. Soc. Sci. 2021, 74, 101969. [Google Scholar] [CrossRef]
  25. Ortega, R.; García, V.; García-García, A.; Rodriguez, J.; Vásquez, V.; Sosa-Savedra, J. Modeling and Application of Controllers for a Photovoltaic Inverter for Operation in a Microgrid. Sustainability 2021, 13, 5115. [Google Scholar] [CrossRef]
  26. Choi, Y.-J.; Oh, B.-C.; Acquah, M.; Kim, D.-M.; Kim, S.-Y. Optimal Operation of a Hybrid Power System as an Island Microgrid in South-Korea. Sustainability 2021, 13, 5022. [Google Scholar] [CrossRef]
  27. Kumalah, M.J.; Saat, G.; Mapjabil, J.; Hussin, R.; Afrizal, T.; Talip, M.A. Local knowledge and its potential as a community-based tourism attraction: The case of the Bajau Ubian Community in Mantanani Island, Sabah. Malays. J. Soc. Space 2015, 11, 112–128. [Google Scholar]
  28. Brunei Darussalam-Indonesia-Malaysia-Philippines East ASEAN Growth Area. Ecotourism Pilot Project; Mantanani Islands Report; Brunei Darussalam-Indonesia-Malaysia-Philippines East ASEAN Growth Area: Sabah, Malaysia, 2017; pp. 1–45. [Google Scholar]
  29. Joseph, J.; Kuen, C.Y.; Palaniappan, P.M.; Chark, L.H. Genetic investigation of green turtles (Chelonia Mydas) harvested from a foraging ground at Mantanani, Sabah, Malaysia. Herpetol. Conserv. Biol. 2014, 9, 516–523. [Google Scholar]
  30. Pilcher, N. Population Structure and Growth of Immature Green Turtles at Mantanani, Sabah, Malaysia. South Am. J. Herpetol. 2010, 44, 168–171. [Google Scholar] [CrossRef]
  31. Woo, S.P.; Yasin, Z.; Ismail, S.H.; Tan, S.H. The distribution and diversity of sea cucumbers in the coral reefs of the South China Sea, Sulu Sea and Sulawesi Sea. Deep. Sea Res. Part II Top. Stud. Oceanogr. 2013, 96, 13–18. [Google Scholar] [CrossRef]
  32. Koiting, R.F.; Saleh, E.; Madin, J.; Aung, T.; Mustajap, F. Morphologies Changes During Pre- and Post-Southwest Season in Mantanani Besar Island, Kota Belud, Sabah. Borneo Sci. 2015, 36, 21–32. [Google Scholar]
  33. Koiting, R.F.; Saleh, E.; Madin, J.; Ismail, N. Bin Beach Morphology Changes during the Northeast and Southwest Monsoons at Mantanani Besar Island, Sabah (Malaysia). J. Trop. Biol. Conserv. 2017, 14, 83–94. [Google Scholar]
  34. Sukarno, K.; Abd Hamid, A.S.; Dayou, J.; Makmud, M.Z.H.; Sarjadi, M.S. Measurement of global solar radiation in Kota Kinabalu Malaysia. ARPN J. Eng. Appl. Sci. 2015, 10, 6467–6471. [Google Scholar]
  35. Lau, K.; Tan, C.; Yatim, A. Photovoltaic systems for Malaysian islands: Effects of interest rates, diesel prices and load sizes. Energy 2015, 83, 204–216. [Google Scholar] [CrossRef]
  36. Wong, S.L.; Ngadi, N.; Abdullah, T.A.T.; Inuwa, I. Recent advances of feed-in tariff in Malaysia. Renew. Sustain. Energy Rev. 2015, 41, 42–52. [Google Scholar] [CrossRef]
  37. Tan, R.H.; Chow, T. A Comparative Study of Feed in Tariff and Net Metering for UCSI University North Wing Campus with 100 kW Solar Photovoltaic System. Energy Procedia 2016, 100, 86–91. [Google Scholar] [CrossRef] [Green Version]
  38. Malaysia Energy Commission National Energy Balance 2016. Energy Comm. 2018, 1–114. Available online: https://meih.st.gov.my/documents/10620/9a9314a1-cf11-4640-a9de-3b31f336a416 (accessed on 20 September 2021).
  39. Abdullah, W.S.W.; Osman, M.; Ab Kadir, M.Z.A.; Verayiah, R. The Potential and Status of Renewable Energy Development in Malaysia. Energies 2019, 12, 2437. [Google Scholar] [CrossRef] [Green Version]
  40. Izadyar, N.; Ong, H.C.; Chong, W.T.; Mojumder, J.C.; Leong, K.Y. Investigation of potential hybrid renewable energy at various rural areas in Malaysia. J. Clean. Prod. 2016, 139, 61–73. [Google Scholar] [CrossRef]
  41. Ashourian, M.; Cherati, S.; Zin, A.M.; Niknam, N.; Mokhtar, A.; Anwari, M. Optimal green energy management for island resorts in Malaysia. Renew. Energy 2013, 51, 36–45. [Google Scholar] [CrossRef]
  42. Sukarno, K.; Hamid, A.S.A.; Jackson, C.H.W.; Pien, C.F.; Dayou, J. Comparison of Power Output Between Fixed and Perpendicular Solar Photovoltaic PV Panel in Tropical Climate Region. Adv. Sci. Lett. 2017, 23, 1259–1263. [Google Scholar] [CrossRef]
  43. Ahmad, E.Z.; Sopian, K.; Jarimi, H.; Fazlizan, A.; Elbreki, A.; Hamid, A.S.A.; Rostami, S.; Ibrahim, A. Recent advances in passive cooling methods for photovoltaic performance enhancement. Int. J. Electr. Comput. Eng. (IJECE) 2021, 11, 146–154. [Google Scholar] [CrossRef]
  44. Hassan, Z.; Suffian Misaran@misran, M.; Siambun, N.J.; Sufiyan, A.; Hamid, A.; Madlan, M.A. Feasibility of using Solar PV Waste Heat to Regenerate Liquid Desiccant in Solar Liquid Desiccant Air Conditioning System. J. Adv. Res. Exp. Fluid Mech. Heat Transf. 2020, 2, 10–16. [Google Scholar]
  45. Jaiganesh, K.; Reddy, K.B.S.; Shobhitha, B.; Goud, B.D. Enhancing the efficiency of rooftop solar photovoltaic panel with simple cleaning mechanism. Mater. Today Proc. 2021. [Google Scholar] [CrossRef]
  46. Yadav, K.; Kumar, A.; Sastry, O.; Wandhare, R. Solar photovoltaics pumps operating head selection for the optimum efficiency. Renew. Energy 2018, 134, 169–177. [Google Scholar] [CrossRef]
  47. Praveen, J.; Vijayaramaraju, V. Materials for Optimizing Efficiencies of Solar Photovoltaic Panels. Mater. Today Proc. 2017, 4, 5233–5238. [Google Scholar] [CrossRef]
  48. Ngoc, T.N.; Phung, Q.N.; Tung, L.N.; Sanseverino, E.R.; Romano, P.; Viola, F. Increasing efficiency of photovoltaic systems under non-homogeneous solar irradiation using improved Dynamic Programming methods. Sol. Energy 2017, 150, 325–334. [Google Scholar] [CrossRef]
  49. Sohani, A.; Sayyaadi, H. Providing an accurate method for obtaining the efficiency of a photovoltaic solar module. Renew. Energy 2020, 156, 395–406. [Google Scholar] [CrossRef]
  50. El Hage, H.; Herez, A.; Ramadan, M.; Bazzi, H.; Khaled, M. An investigation on solar drying: A review with economic and environmental assessment. Energy 2018, 157, 815–829. [Google Scholar] [CrossRef]
  51. Fudholi, A.; Sopian, K.; Gabbasa, M.; Bakhtyar, B.; Yahya, M.; Ruslan, M.H.; Mat, S. Techno-economic of solar drying systems with water based solar collectors in Malaysia: A review. Renew. Sustain. Energy Rev. 2015, 51, 809–820. [Google Scholar] [CrossRef]
  52. Chauhan, P.S.; Kumar, A.; Nuntadusit, C.; Mishra, S.S. Drying Kinetics, Quality Assessment, and Economic Analysis of Bitter Gourd Flakes Drying Inside Forced Convection Greenhouse Dryer. J. Sol. Energy Eng. 2018, 140, 051001. [Google Scholar] [CrossRef]
  53. Elkhadraoui, A.; Kooli, S.; Hamdi, I.; Farhat, A. Experimental investigation and economic evaluation of a new mixed-mode solar greenhouse dryer for drying of red pepper and grape. Renew. Energy 2015, 77, 1–8. [Google Scholar] [CrossRef]
  54. Dhanushkodi, S.; Wilson, V.H.; Sudhakar, K. Life Cycle Cost of Solar Biomass Hybrid Dryer Systems for Cashew Drying of Nuts in India. Environ. Clim. Technol. 2015, 15, 22–33. [Google Scholar] [CrossRef] [Green Version]
  55. Fudholi, A.; Othman, M.Y.; Ruslan, M.H.; Yahya, M.; Zaharim, A.; Sopian, K. Techno-economic analysis of solar drying system for seaweed in Malaysia. Recent Res. Energy Environ. Landsc. Archit. 2011, 15, 89–95. [Google Scholar]
  56. Hamdani; Rizal, T.A.; Muhammad, Z. Fabrication and testing of hybrid solar-biomass dryer for drying fish. Case Stud. Therm. Eng. 2018, 12, 489–496. [Google Scholar] [CrossRef]
  57. Singh, M.; Sethi, V. On the design, modelling and analysis of multi-shelf inclined solar cooker-cum-dryer. Sol. Energy 2018, 162, 620–636. [Google Scholar] [CrossRef]
Figure 1. PV solar system studied by Kumar [23].
Sustainability 13 12432 g001
Figure 2. Position and cluster of Mantanani islands.
Sustainability 13 12432 g002
Figure 3. A generator set supplies Mantanani Island’s electricity.
Sustainability 13 12432 g003
Figure 4. Summary of the methodology.
Sustainability 13 12432 g004
Figure 5. Energy balance of a 2.2 kWp solar system.
Sustainability 13 12432 g005
Figure 6. Average annual direct normal irradiation for each hour.
Sustainability 13 12432 g006
Figure 7. Monthly direct average irradiation.
Sustainability 13 12432 g007
Figure 8. Schematic drawing of the PV system in this study.
Sustainability 13 12432 g008
Figure 9. Mantanani Island’s residents’ basic electrical load according to time.
Sustainability 13 12432 g009
Figure 10. Monthly PV efficiency and PV energy consumption efficiency.
Sustainability 13 12432 g010
Figure 11. Energy balance of 2.2 kWp PV system.
Sustainability 13 12432 g011
Figure 12. The value of the payback period is based on different costs of capital.
Sustainability 13 12432 g012
Figure 13. The value of the payback period is based on different costs of capital (10.1 and 15.2 years, respectively).
Sustainability 13 12432 g013
Table 1. Expected tourist arrivals to Sabah [28].
Year20092010201520202025
International562,144795,9531,011,2731,290,6691,647,257
Domestic1,683,9241,708,7162,180,8032,783,3183,552,298
Total2,246,0682,504,6693,192,0764,073,9875,199,555
High growth
International562,114795,9531,213,8781,645,4602,134,859
Domestic1,583,9241,708,7162,622,9733,441,2994,394,619
Total2,246,0682,504,6693,836,8515,086,7596,529,478
Table 2. Example of the questionnaire and the question categories.
No.QuestionQuestion Category
1NameSelf-information
2Date of birthSelf-information
3AgeSelf-information
4SexSelf-information
5Marriage statusSelf-information
6Is electricity supply important in your daily life?Opinion
7In your opinion, is electricity supply mandatory?Opinion
8Do you agree that electricity supply should be provided 24 h a day instead of only 12 h a day?Opinion
9Do you know what solar energy is?Knowledge
10Do you mind using energy supply from solar energy?Opinion
11If you are a homestay operator, will a 24 h electricity supply improve your business?Opinion
12What are your daily activities that require electricity supply?Information
13When were the electrical appliances mentioned in question no. 10 was used?Information
14With our help, state the energy consumption of the electrical appliance in question 10.information
Table 3. List of appliances, power rating, and usage period.
No.AppliancePowerHourUnitWatt-Hour
1Lights8 W6 h8384 Wh
2Fan75 W8 h1600 Wh
3TV100 W3 h1300 Wh
4Air conditioner746 W5 h13730 Wh
5Mini ice box100 W24 h12400 Wh
6Telephone charger4 W5 h240 Wh
Total7454 Wh/d
Table 4. Costs assessed in the technoeconomic analysis of the PV system on the study island.
No.CostValue in Malaysian Ringgit (MYR)
1Capital10,000–50,000
2PV system operation1200
3Homestay operation2880
Table 5. PV system cost breakdown.
No.ComponentsUnitValue in Malaysian Ringgit (MYR)
1PV panel: 100 Wp monocrystalline 22.53 Voc, 5.70 Isc.2211,980
2Charge controller: SIGMA 2.0 MPPT controller 60 A, 150 VDC25760
3Battery bank: Trojan Deep Cycle 27 AGM Battery 100 Ah, 12 V76076
4Inverter: HUAWEI solar inverter 5 KW single phase SUN2000-5KTL-L114220
5Wiring-3000
6Labor-1000–5000
7Transportation-5000–20,000
Total 37,036–56,036
Publisher’s Note: MDPI stays neutral with regard to jurisdictional claims in published maps and institutional affiliations.

