1. Introduction
The global transportation sector is responsible for high levels of greenhouse gas emissions, criteria pollutant emissions, and petroleum consumption. Governments and researchers around the world are adopting various strategies to combat these emissions and petroleum use [
1,
2,
3,
4,
5,
6,
7]. In the private sector, technology advances—such as vehicle automation—are reframing the way in which humans use, own, and interact with vehicles. Once seen in scientific fiction stories, autonomous vehicles (AVs) have gained considerable public attention, with most major automakers and some technology firms investing in research and development activities. AVs are those in which at least some vehicle control function (e.g., steering, acceleration, braking) occurs without direct human input. AVs are rated on a scale of 0 to 5, from no to full automation [
8].
Past research suggests the environmental promise of AVs rests in their ability to alter driving behavior and travel patterns. For example, Wadud et al. [
9] and Brown et al. [
10] discuss how AVs could reduce fuel consumption of the transportation sector through smoother driving, efficient routing, smaller and more efficient engines, higher occupancy rates, less hunting for parking, vehicle sizing optimization, and vehicle platooning. The authors also discuss how AVs could detrimentally impact fuel consumption through greater total distance travel and faster speeds of travel.
One aspect of AVs currently overlooked in the literature is the impact of in-vehicle design on a vehicle’s fuel consumption. Early demonstrations by Uber, Waymo, General Motors, and others suggest that reaching high levels of autonomy requires a multitude of sensors, communication equipment, and on-board processing computers. The added mass and auxiliary load of the electronic equipment, as well as the lowered aerodynamic efficiency from protruding equipment, could increase total fuel consumption per distance traveled. Additionally, these design changes have cascading effects on other vehicle components and vehicle performance, such as the required power output of the motor and size of the fuel tank or battery. Although there are understanding and relevant reports of potential environment and energy impacts due to AVs’ components, to the best of our knowledge, there are limited studies that have systematically quantified those impacts.
This paper tackles the question: how will autonomy-related features impact a vehicle’s fuel consumption? This question has implications for environmental modelers in how they estimate society-wide impacts of AVs. Most environmental studies of AVs assume no change in the performance of vehicles with and without autonomy-related features. Additionally, the research question has regulatory implications for fuel economy testing. Most fuel economy testing around the globe does not directly capture the aerodynamic impacts of protruding sensors or the impact of add-on electronic equipment. For example, the United States Environmental Protection Agency (EPA) provides CO
2 credit (“off-cycle credits”) for technologies that lower emissions beyond the standard emissions test. However, there is no penalty in place for technologies that raise emissions. Mersky and Samaras [
11] have noted that current fuel economy test cycles are ill-suited for AVs (although those authors were considering the driving behavior impacts). In this paper, we assess fuel consumption impacts of autonomy-related features under a variety of autonomy scenarios through powertrain simulations. Specifically, we utilize a powertrain simulation model, FASTSim, which is a well-validated model with high precision in vehicle energy consumption estimation. The results can serve as a first-hand information to estimate bounds and identify important factors for fuel use of autonomy features on passenger cars. The simulation plus scenario analysis framework can also be used to tackle future studies related to the environmental and energy impacts of vehicles.
The paper begins with an overview of how AVs could impact vehicle mass, auxiliary load, and aerodynamic efficiency. The following section describes our methodology and the FASTSim model. The results section summarizes our findings, and the final section concludes. Results from the modeling suggest that the fuel consumption impacts of vehicle automation can be quite large in high levels of automation, due to the combination of added mass, auxiliary load, and aerodynamic drag.
2. Autonomy-Related Components
A vehicle’s powertrain normally must overcome four forces during motion: rolling resistance, aerodynamic drag, road grade, and rotational inertial force (Brooker et al., 2015). Each of the forces is well defined according to corresponding vehicle driving load equations. In addition to motive power, a vehicle must power auxiliary equipment, such as heating and cooling, lights, and sensors, expressed as . Adding to the equations above gives the total power needed to maintain vehicle motion (). The power needed to overcome these four forces is the multiplication of the velocity multiplied by the force. Note that powertrain losses are not considered here.
Comparing with human-driven vehicles, AVs have additional equipment in order to implement automation-related technologies. This paper examines the impact of AVs’ additional equipment on four of the variables in vehicle load equations, namely, vehicle mass (
), drag coefficient (
), frontal area (
), and auxiliary power (
). Each of the four is discussed in more detail below. Note that vehicle automation may also impact the speed (
) of the vehicle through changes in driving behavior. Additionally, AVs will likely impact the acceleration (
) of the vehicles through smoothing behavior. Both impacts are beyond the scope of this paper and are discussed in other papers [
11,
12].
2.1. Vehicle Mass
The suite of sensors, communication equipment, and computers onboard AVs add to a vehicle’s mass, thereby increasing rolling resistance and inertial force. Early prototypes of autonomous vehicles employ some or all of the following electronic equipment: LiDAR (for light detection and ranging), radar (for radio detection and ranging), ultrasonic sensors, GPS, antennae, interactive displays for drivers, and processing units for inputting data and making vehicle control decisions. Other equipment and components could potentially be removed from AVs—such as the steering wheel, rearview mirrors, and spare tire—thereby lowering the vehicle’s mass. In addition, changes in vehicle mass, if significant, will also influence the driving and operating performance of vehicles, such as slower acceleration time or shorter driving range due to heavier vehicle mass. Therefore, in order to avoid any sacrifice in vehicle performance due to automation, vehicle engine, or motor power, battery size needs to be adjusted to maintain performance.
2.2. Drag Coefficient (C)
The drag coefficient of a vehicle is a measure of the impact of air flow conditions, vehicle shape, and vehicle inclination on aerodynamic drag. A higher coefficient results in a higher power requirement to overcome aerodynamic drag. For example, Chen and Meier [
13] estimated that roof racks are responsible for 0.8 percent of US vehicle fuel consumption. The average drag coefficient of vehicles has decreased from between 0.7 and 0.9 in the early 1900s to between 0.2 and 0.4 in most modern passenger cars [
14]. As shown in
Figure 1, firms that are trying to reach high levels of vehicle automation use a number of protruding sensors and rooftop housing. This suggests that the drag coefficient will increase, as it would with a roof rack, taxi sign, or other vehicle add-ons.
On the other hand, if the side rearview mirrors are removed from AVs, the drag coefficient will decrease. Hucho [
14] reported that rearview mirrors have a 2 to 7 percent impact on the total drag of the vehicles.
Chowdhury et al. [
15] use a wind tunnel to estimate the change in the drag coefficient from adding equipment on the roof of a General Motors Holden VT Commodore. They examine the following add-ons: taxi signs, advertisement signs, roof racks, roof racks with a ladder, and a barrel (rooftop carrier). Compared to the same vehicle without add-ons, the drag coefficients increase by between 5.1 percent for a taxi sign to 24 percent for a roof rack with ladder (
Table 1). The size and shape of these vehicle add-ons are given in Chowdhury et al. [
15].
2.3. Frontal Area
Frontal area is the total cross-sectional area facing the direction of motion. As with the drag coefficient, most early versions of AVs increase the frontal area because of protruding sensors and communication equipment (
Figure 1). Chowdhurry et al.’s [
15] analysis suggests that vehicle add-ons result in a greater percentage change in drag coefficient rather than frontal area (
Table 1).
2.4. Auxiliary Load
Auxiliary loads on motor vehicles have been increasing for several years as greater numbers of electronics have been added to vehicles [
16]. Most conventional auxiliary loads operate on an as-needed basis. Kavalchuk et al. [
17] built a powertrain simulation model based on a 2013 Kia Optima sedan and used the following inputs for auxiliary loads: heating system (3000 W), air conditioning (2500 W), headlamps (60 W per light), motor for moving seats (300 W), cigarette light (100 W), and CPU for passive safety systems (100 W). Other research assumes a total auxiliary load of 2000 W [
18] under normal steady state operations.
Egede [
19] discusses how auxiliary loads are typically under-reported in fuel economy testing because most auxiliaries can be turned off in the test cycles. It was suggested that the energy needed for heating and cooling can contribute as much as 50 percent of energy consumption in battery electric vehicles (BEVs) [
19]. In the four vehicle models in their study, Carlson et al. [
20] estimated that auxiliary loads account for between 7.5 percent to 18.1 percent of fuel consumption on average across three petroleum and one compressed natural gas passenger vehicles.
Unlike conventional auxiliary loads, autonomy-related loads—i.e., sensors, communication equipment, and computers onboard—run continuously. The 360-degree LiDAR system used on several early level 4 or 5 AV models (the Velodyne 64 E) consumes on average 48 W of continuous power as it scans the environment near the vehicle [
21]. Other LiDAR systems, such as the Neptec’s Opal ECR, consume 105 W of continuous power [
21].
To note for this study, an advantage of BEVs compared to internal combustion engine vehicles (ICEVs) is that onboard electrical equipment can be powered directly from the vehicle’s battery, with minimal losses. On the other hand, ICEVs require an alternator to convert engine power to 12 Volt DC power. Past studies assumed that alternator efficiencies range from 50 to 60 percent [
16].
Table 2 provides examples of common components used in early models of AVs shown in
Figure 1. Note that this is not an exhaustive list of a complete functioning AV system. The purpose of
Table 2 is to give a sense of the power, mass, and dimensions of current AV equipment. These data were collected from product specifications from equipment manufacturers.
3. Methodology
Two candidate methods can be used to estimate the change in fuel consumption from vehicle autonomy. The first method uses observational data to establish a statistical relationship between energy consumption and vehicle attributes. This method is particularly suited to studies that explore technological progress trends of vehicle attributes over time [
2,
22]. However, there are very limited observational data for on-road autonomous vehicles in real-world contexts. A second method is engineering-based powertrain simulation. A powertrain simulation tool mimics the complex relationship between engine control technology, auxiliary power, vehicle performance, and other attributes and allows the user to reconfigure those vehicle design as desired. Several publicly available tools exist, such as Autonomie, CMEM, and ADOPT, and various studies have used these models. An engineering-based approach is well suited for the purpose of this paper since direct observational data on autonomous technologies are limited or proprietary.
For this study, we adopt Future Automotive Systems Technology Simulator (FASTSim), developed by United States National Renewable Energy Laboratory [
23]. FASTSim enables rapid and accurate comparison of the design and performance of multiple light-duty vehicle powertrains [
23]. FASTSim takes inputs of vehicle attributes and produces results including vehicle fuel efficiency, time to accelerate (MPH), range, and battery life (among other outputs). Specifically, for conventional internal combustion engine vehicles, the key inputs captured in FASTSim model are parameters of vehicle (drag coefficient, frontal area, gilder mass, wheel base), fuel converter (e.g., specific power, power efficiency curve), wheel (e.g., rolling resistance), and others (e.g., alternator efficiency, auxiliary loads, transmission efficiency). The FASTSim model calculates power needed at the wheel based on the four forces related to rolling resistance, aerodynamic drag, road grade, and rotational inertial at every second of different driving cycles. This step needs driving cycle data (e.g., speed, acceleration, road grade), as well as vehicle attributes (e.g., rolling resistance, drag coefficient). Once power demand at the wheel is obtained, the model back calculates fuel required at the engine using parameters that determine energy flow between components, such as transmission efficiency and power efficiency curve.
The FASTSim model has been carefully calibrated with real-world measurements in terms of parameters and model outputs on energy consumption rates [
23,
24]. There are studies that utilize FASTSim model to analyze fuel consumption of vehicles under real-world driving conditions [
25,
26,
27].
To construct vehicles with an AV design, we began by preloading three representative vehicles into FASTSim: 2017 Nissan Leaf, 2017 Chevrolet Bolt, and 2017 Toyota Corolla. FASTSim default input values are based on vehicle specifications information provided by automakers. Next, vehicle attributes were varied, including vehicle mass, frontal area, drag coefficient, and auxiliary power as prescribed at the bottom of
Table 3. Assumptions regarding the equipment used in the L2 and L5 vehicles are given in
Table 3. Particularly, we try to set the assumptions to be close to equipment likely to be used in L2 and L5 vehicles in the future using information from
Table 2. It is important to note that we are not claiming the information in
Table 3 is complete. However, this is the information, to the best of our knowledge, found in literature. Given that the focus of this paper is the framework of utilizing simulation tools to conduct scenario analysis to quantify environment and energy impacts of AVs, we view
Table 3 as an initial assessment of attributes to be evaluated and it can be one of the future research directions to provide more realistic attributes of AVs, particularly level 5 AVs. We developed one pessimistic and one optimistic scenario for the L5 technologies based on low and high values of each attributes from literature so that our energy estimations can provide bounds rather than a point estimate.
The changes in vehicle parameters will result in changes in vehicle driving and energy consumption performance. We loaded all the changes in vehicle parameters as defined in
Table 3 and directly report changes in driving and energy consumption performance metrics. After all adjustments to the model inputs, FASTSim estimated the necessary fuel consumption for the modeled vehicle and we obtained a new energy consumption rate (kWh per 100 miles/162 km or gallons per 100 miles/162 km). The energy consumption is compared with that of a level 0 base vehicle (no AV components).
The powertrain simulation is conducted on both Environmental Protection Agency certified city (Urban Dynamometer Driving Schedule, UDDS) and highway (Highway Fuel Economy Driving Schedule, HWFET) driving cycles. The city energy consumption value is weighted by 55 percent and highway value by 45 percent to calculate combined fuel consumption rate for comparison in this study. This is consistent with EPA’s certified fuel economy calculation process. In a sensitivity analysis below, the urban and highway drive cycles are reported separately to understand the relative attractiveness of using AVs in a city setting versus a highway corridor.
4. Results
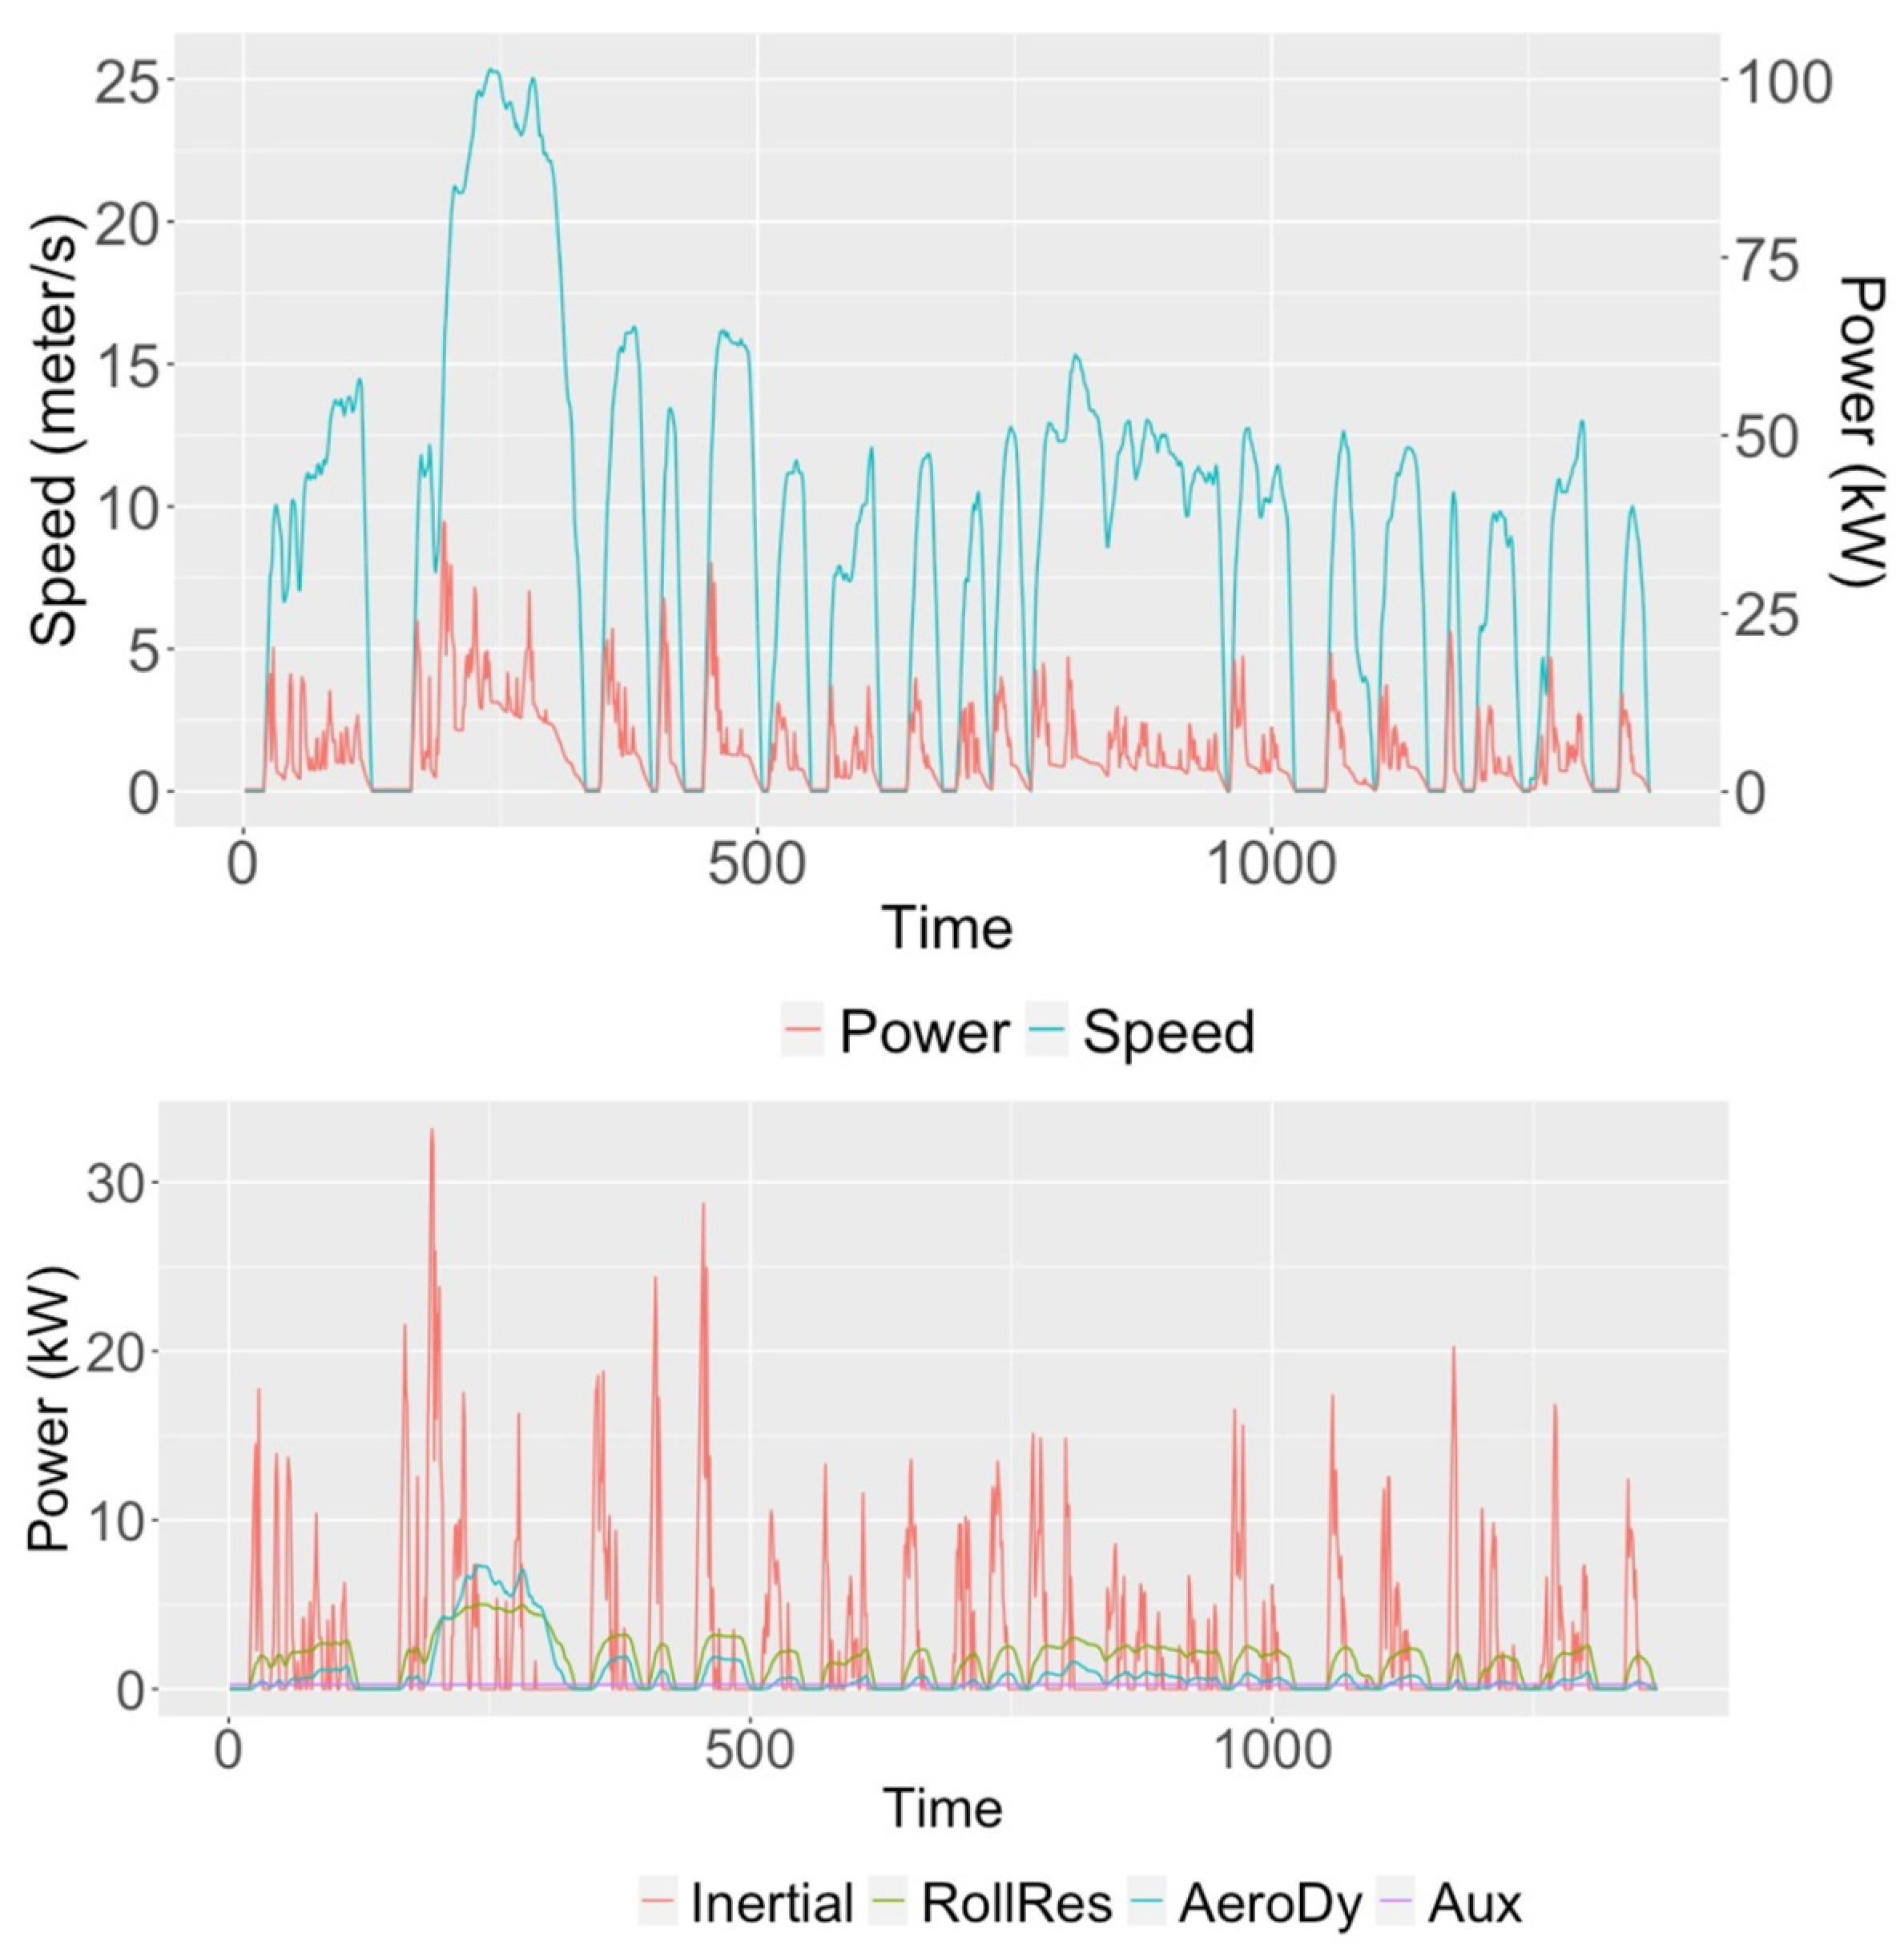
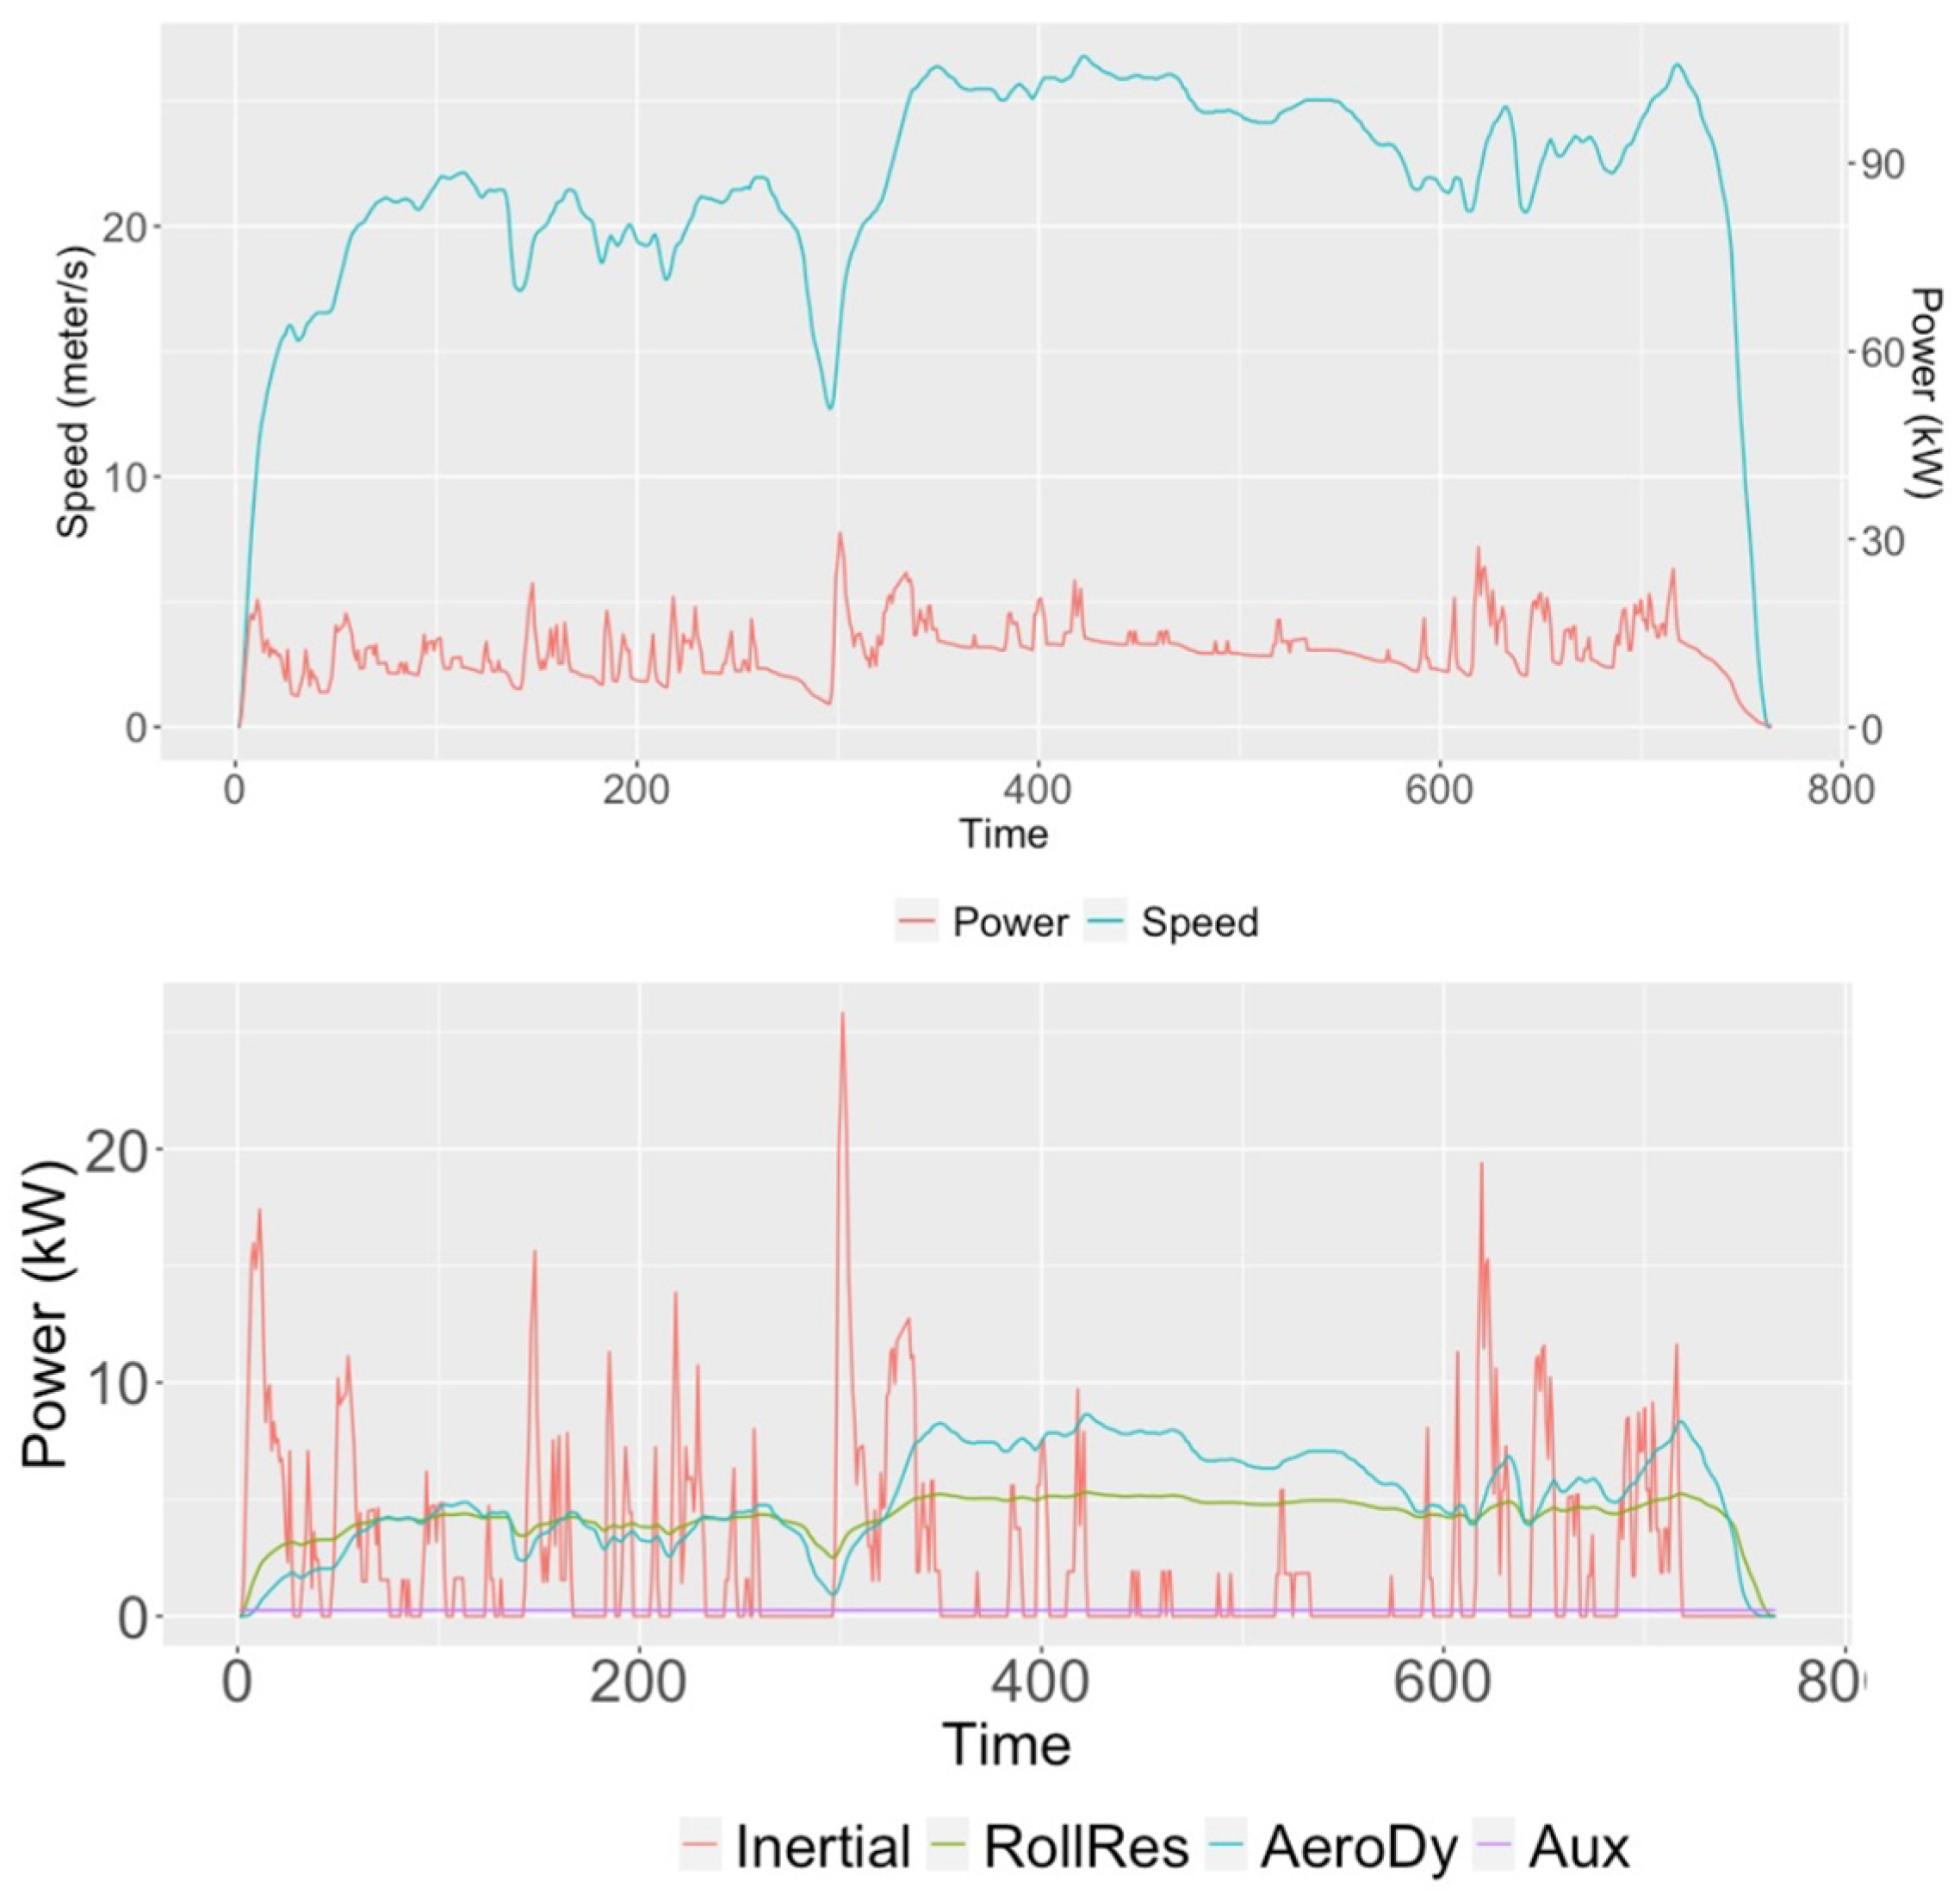
Figure 2 and
Figure 3 present profiles of urban and highway driving cycles, instantaneous power demand, and its breakdown for the Toyota Corolla. It shows that instantaneous power demand positively relates with vehicle instantaneous speed. For power breakdown, the vehicle inertial power accounts for the largest portion most of the time for urban driving. For highway driving, inertial power is still a major power demand source, but the rolling resistance and aerodynamic power demand sources are the major sources when vehicles are cruising at high speeds.
Table 4 gives the vehicle parameters and 0 to 100 kph acceleration time and energy economy in unit of liter per 100 km for three vehicles at three scenarios after loading all assumptions as shown in
Table 3. The energy economy and acceleration performance of L2 vehicles are almost identical to L0 vehicles, which is expected because of very limited changes in parameters with L2 technologies. The L5 optimistic scenarios lead to about 4–8% reductions in energy economy compared with those of L0, with higher reductions achieved in electric vehicles. The L5 pessimistic scenarios lead to 10–15% increase in energy economy.
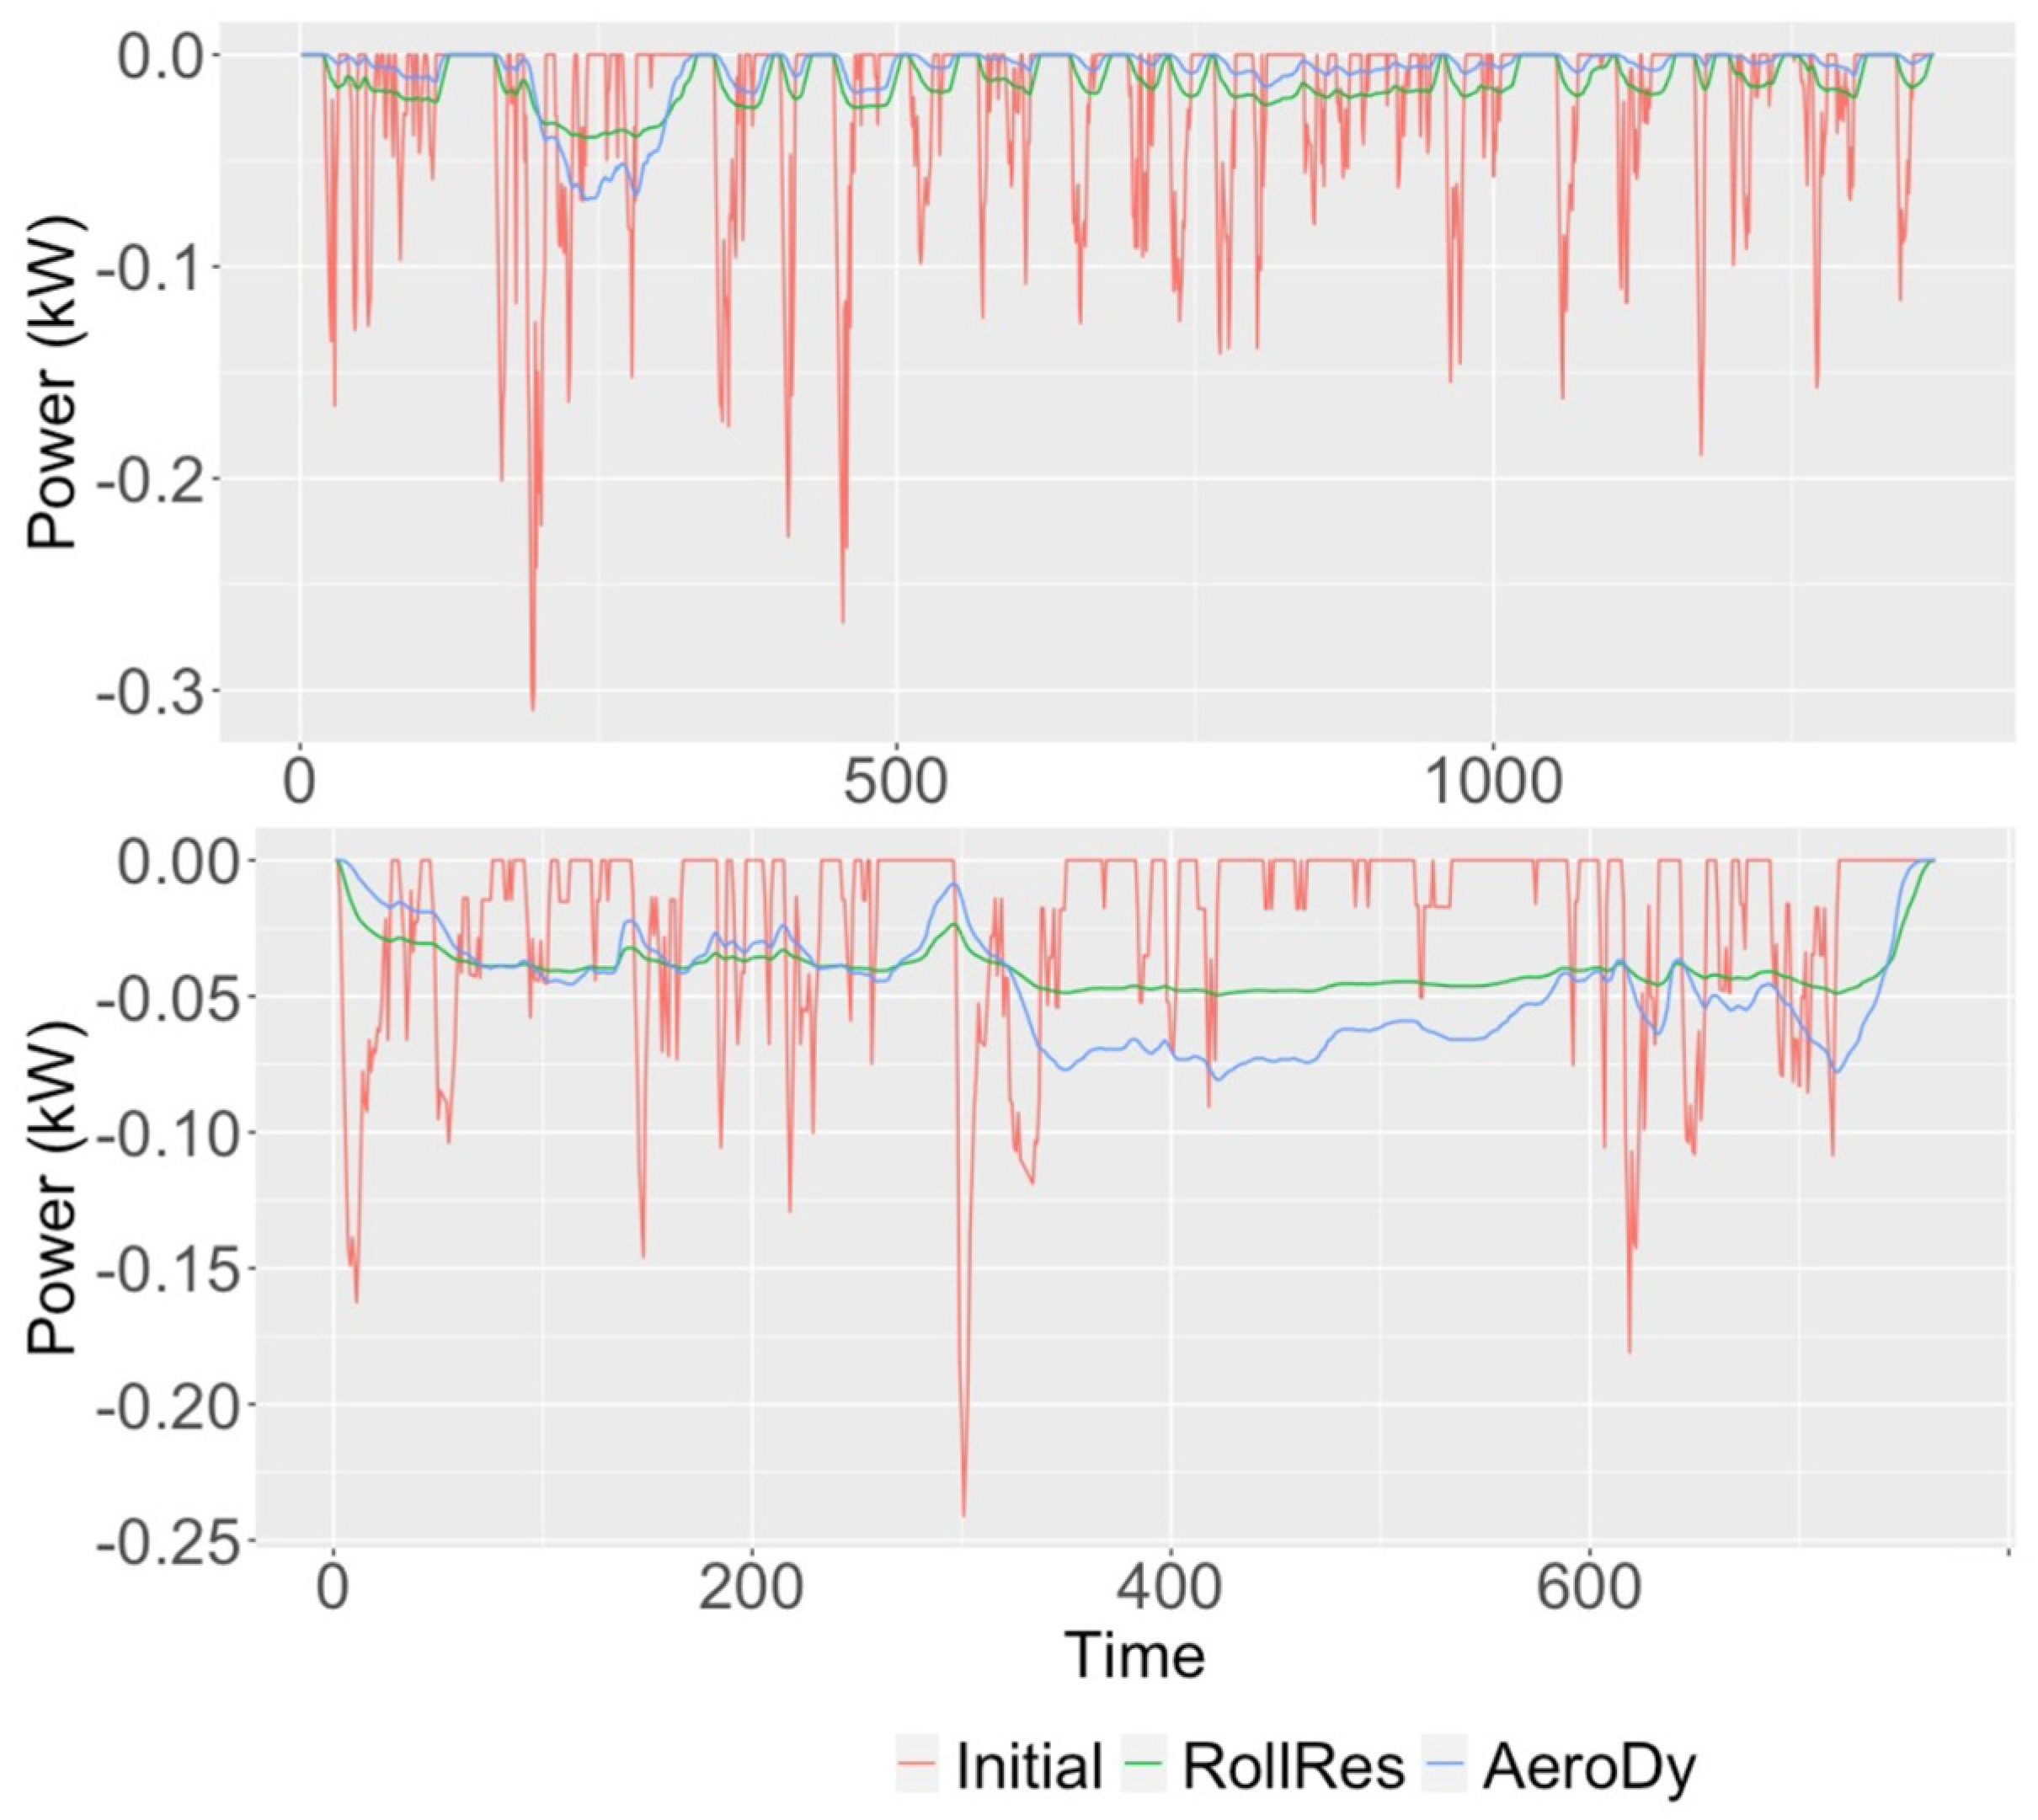
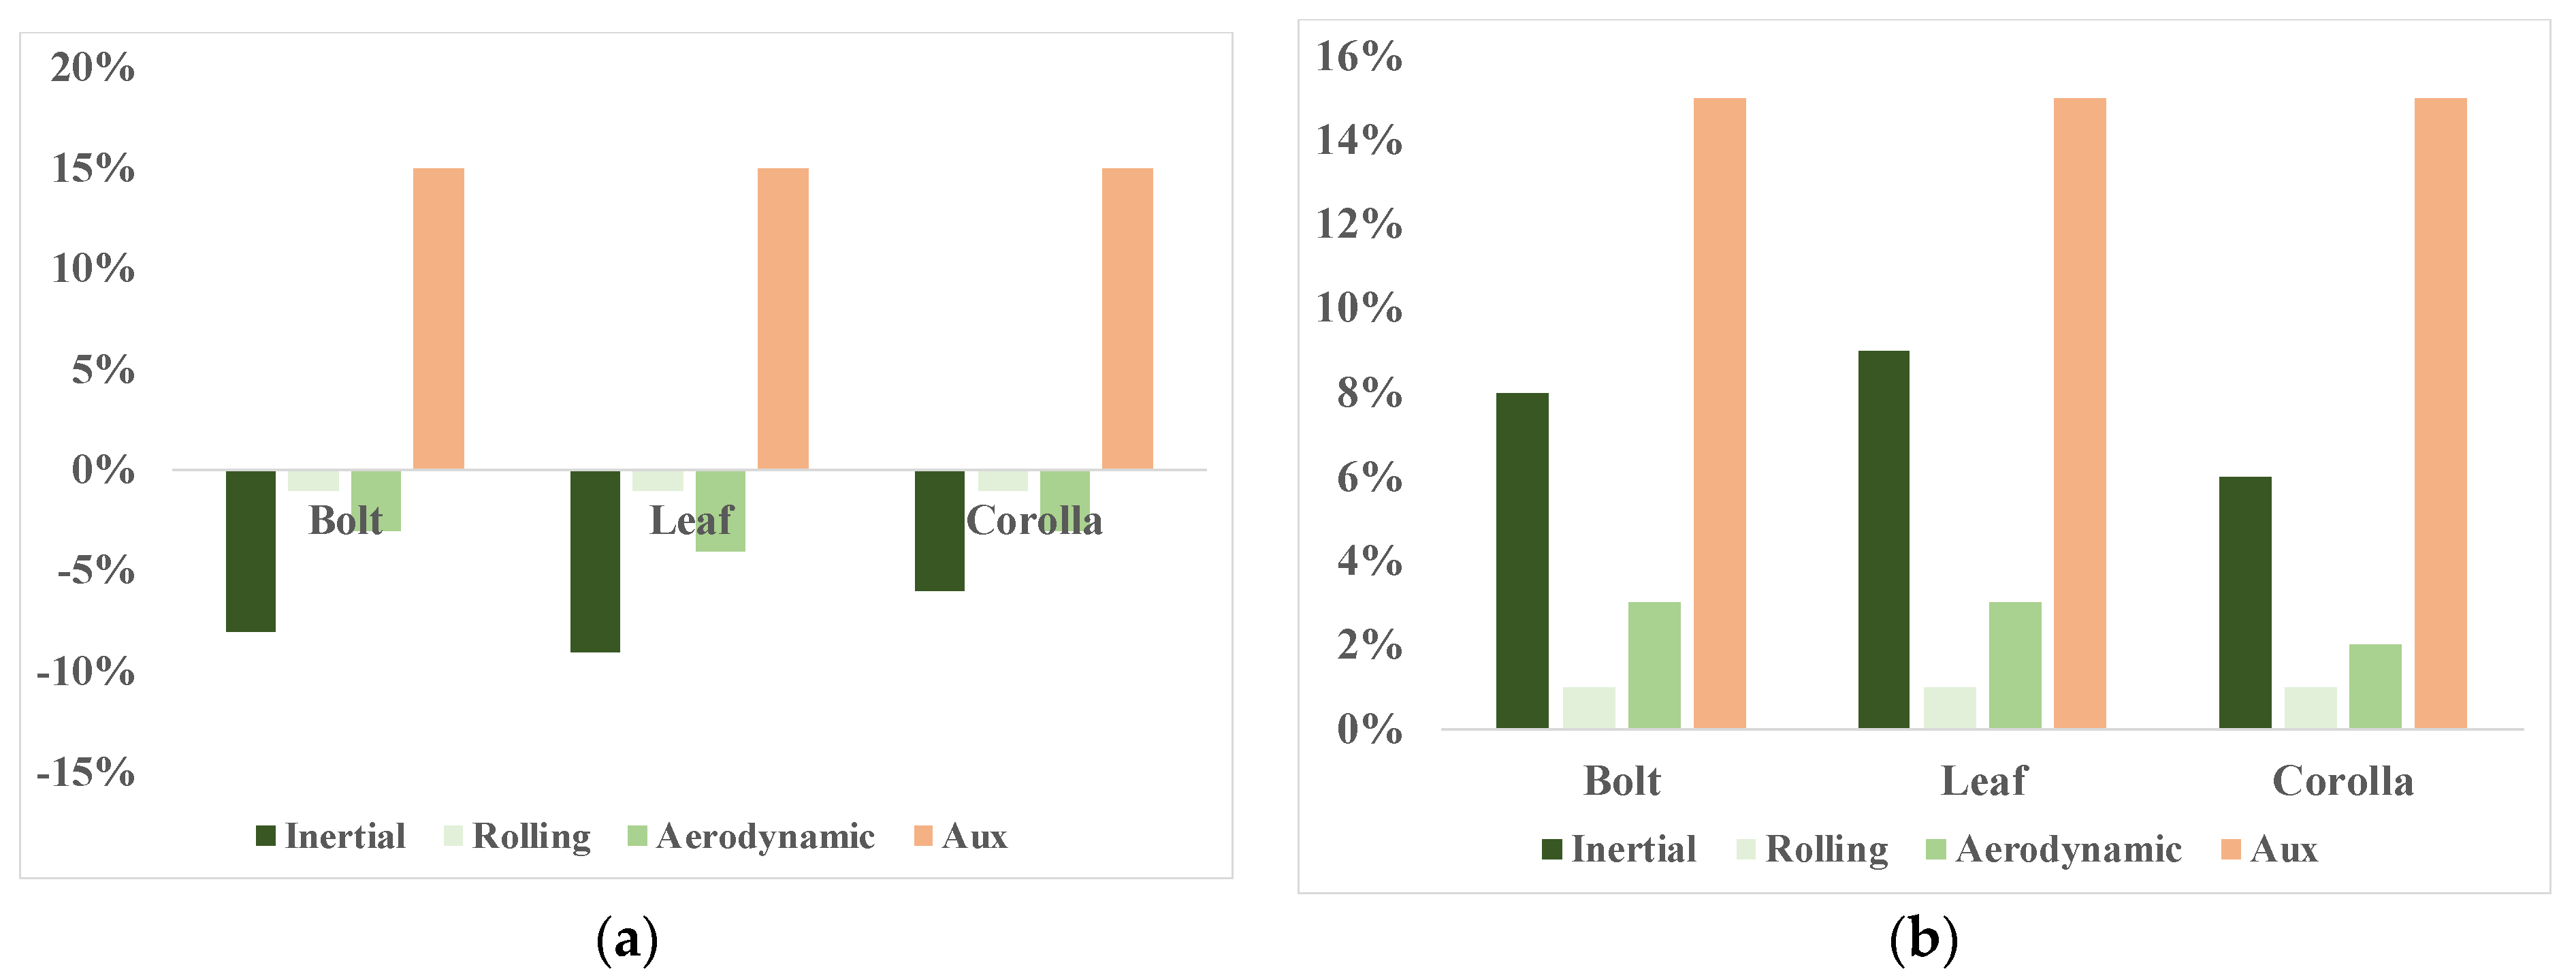
Figure 4 presents the changes in power by sources for urban and highway driving of a Toyota Corolla passenger car for a L5 optimistic scenario. We omit presenting auxiliary power because it is just a constant value to primarily power the on-board computing system. The results show that rather than auxiliary power, the changes in other power sources are negative, i.e., reduction in energy consumption. This is promising to see energy savings even with the additional equipment loaded for the implementation of L5 technologies.
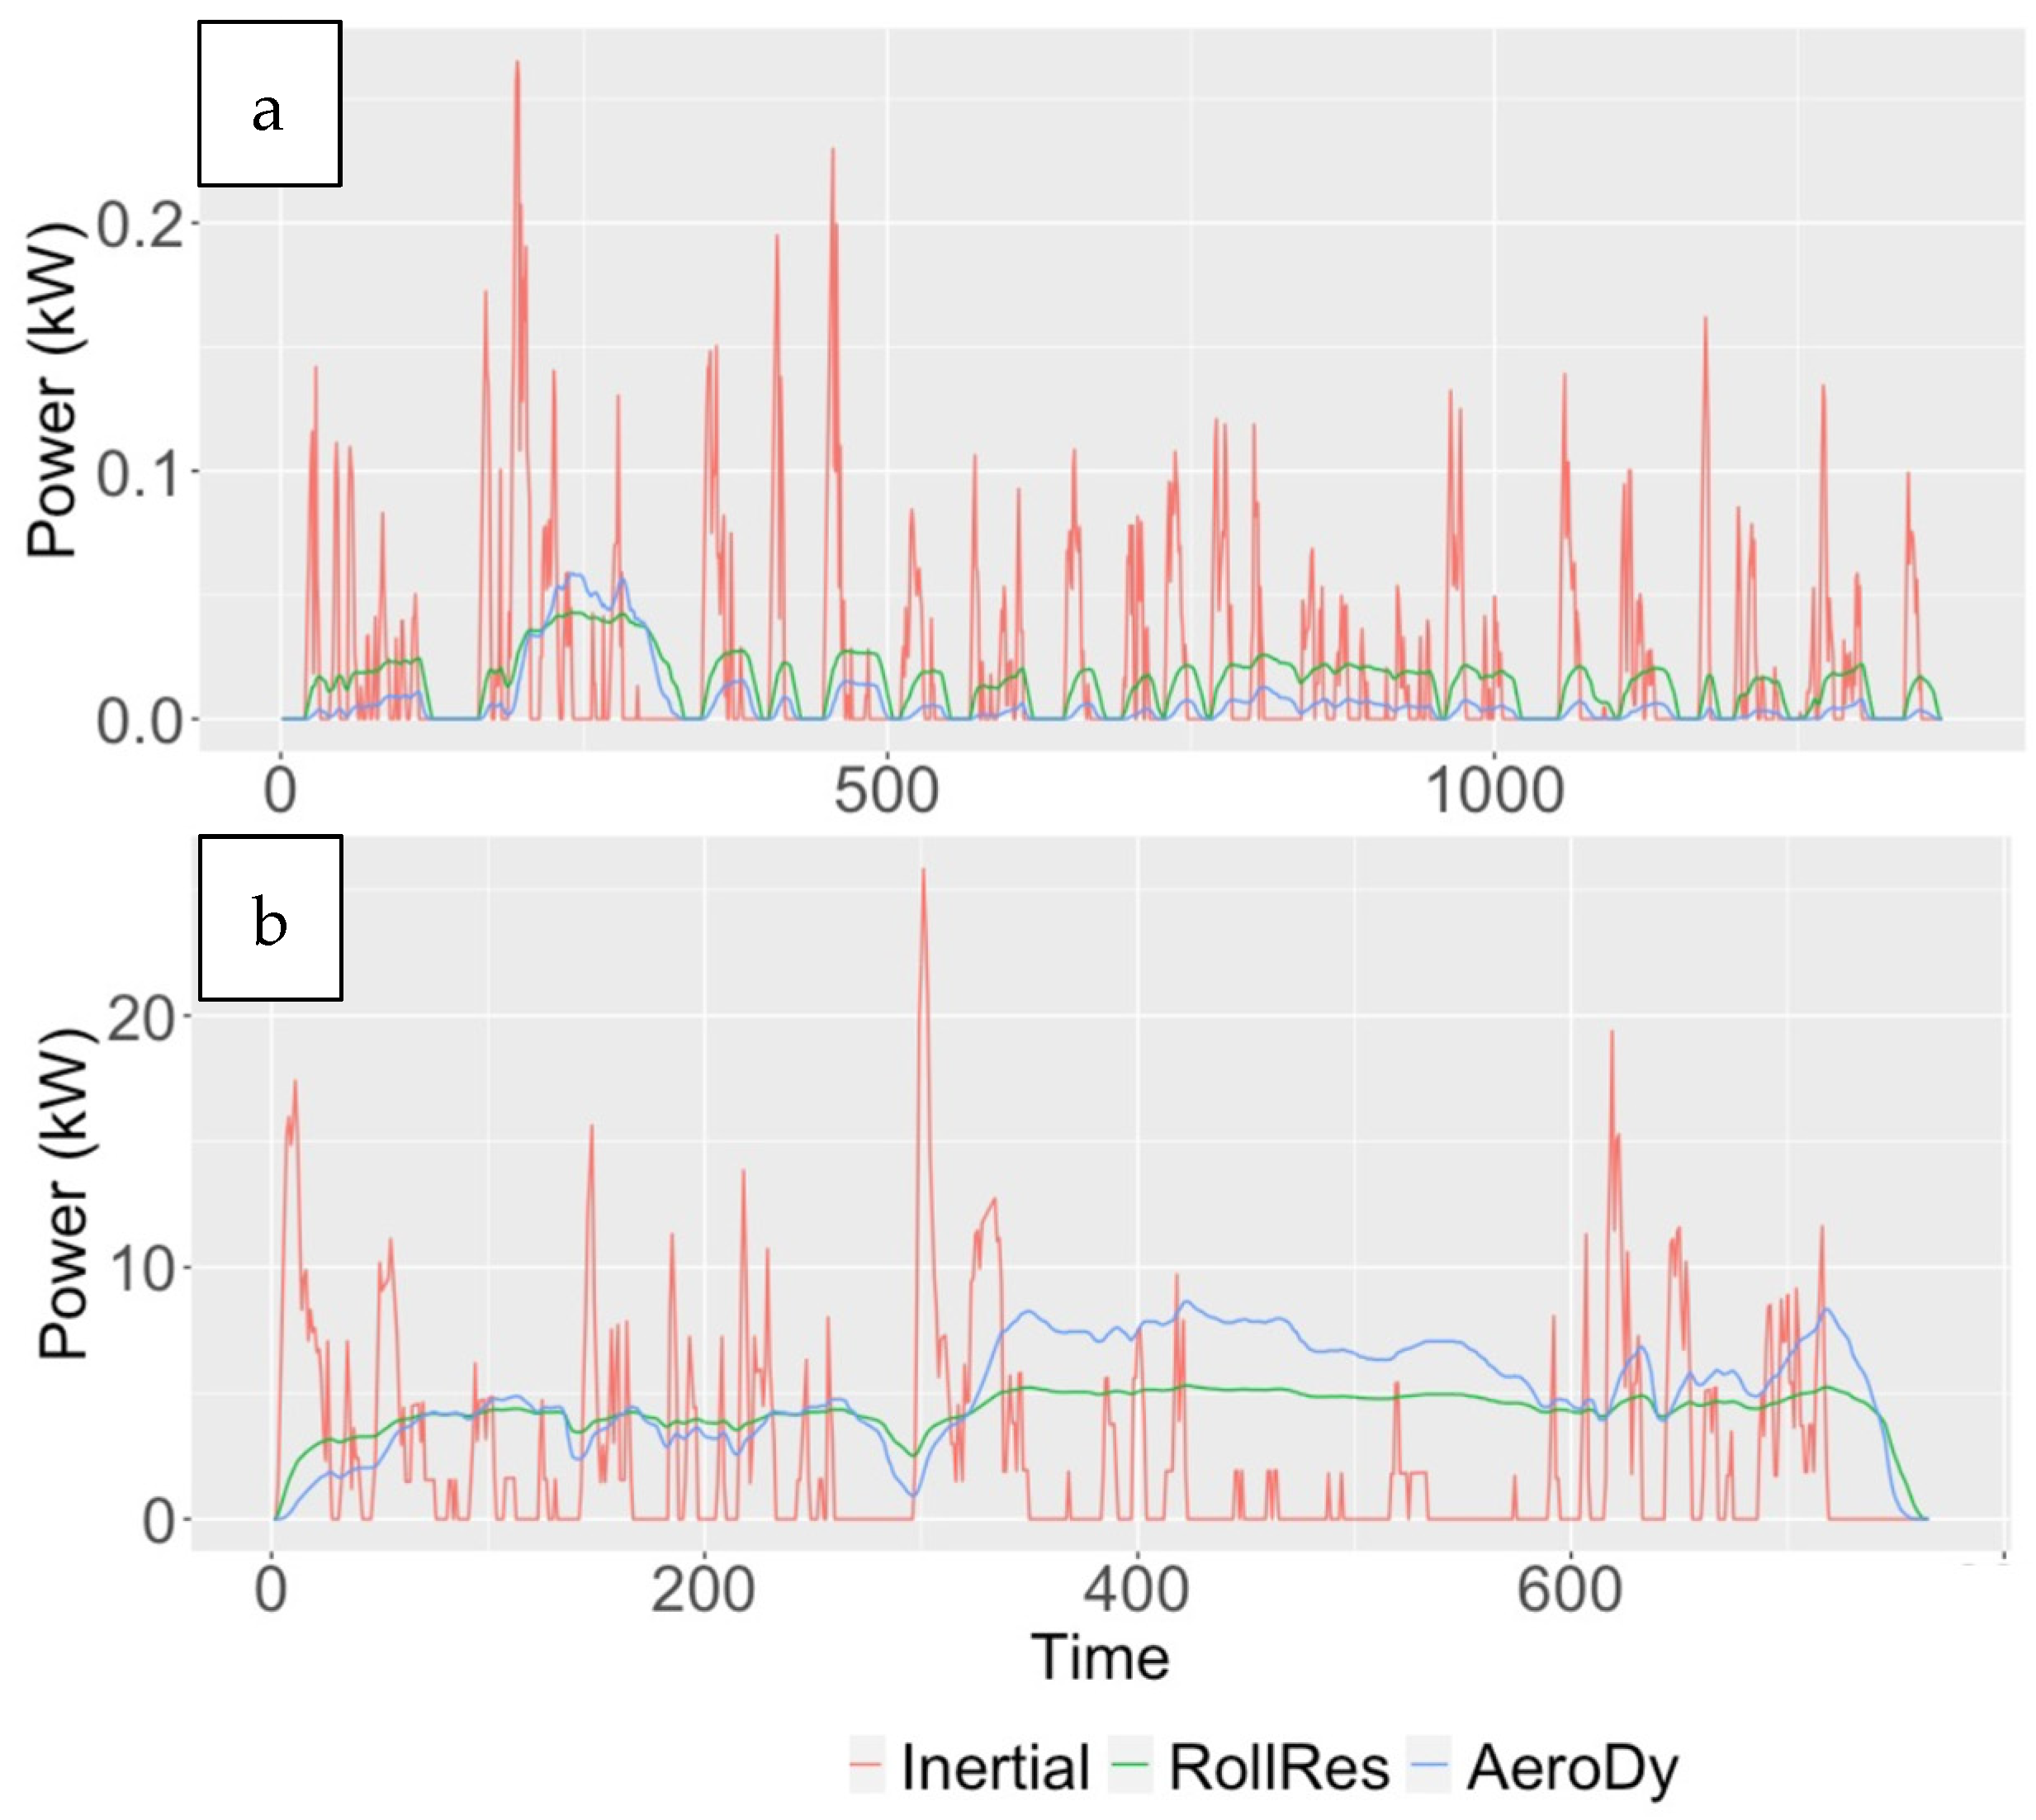
Figure 5 presents the changes in power by sources for urban and highway driving of Toyota Corolla passenger car for a L5 pessimistic scenario. The L5 pessimistic scenario assumes vehicle specification changes that tend to adversely affect energy consumption, thus, all changes in power demand are positive, i.e., increasing energy consumption. However, it is observed that although auxiliary power is not a major component in power demand, the added auxiliary power accounts for a large portion of the changes in power for both optimistic and pessimistic scenarios.
Figure 6 shows the change in energy consumption per distance traveled for the representative vehicles relative to the original fuel consumption ratings (i.e., L0). A conversion factor for BEVs of 33.7 kWh per gallon of gasoline (8.91 kWh per liter) was used [
29]. We omit presenting L2 technology results given that there were very limited changes in energy consumption. We assumed 55% urban driving and 45% highway driving in calculating the energy impacts.
The findings suggest that achieving a high level of autonomy has a substantial impact on energy consumption due to additional auxiliary and inertial power demand. The inertial power leads to higher energy increase in electric vehicles in the pessimistic scenario. We also looked at the energy impacts for urban and highway separately. The findings suggest that the detrimental impacts of vehicle automation on energy consumption are vehicle weight on urban driving and aerodynamic on highway driving. Vehicle load equations provide insights into the differential impacts between city and highway drive cycles. For acceleration event, the powertrain must overcome inertial force, . Since the number of acceleration events is much higher in a city drive cycle, changes in vehicle mass play a major role in this drive cycle. On the other hand, the powertrain must also overcome aerodynamic drag, which is higher in a highway drive cycle.
5. Conclusions
This paper demonstrates that in-vehicle design changes related to vehicle autonomy can have noticeable impacts on a vehicle’s fuel economy through primarily changes in vehicle mass, drag coefficient, and auxiliary power, and to a lesser extent frontal area. The analysis was conducted using a simulation plus scenario evaluation framework, which can be used to tackle future studies related to environmental and energy impacts of vehicles.
The results suggest that the impact on energy economy can be reduction in energy consumption in an optimistic L5 technology scenario and increase in energy in a pessimistic L5 technology scenario. For example, in three representative level 5 pessimistic autonomous vehicles that use the same suite of autonomy-related equipment, these impacts can be 10–15 percent increase in energy use per distance traveled and 4–8 percent reduction in energy consumption per distance in optimistic L5 scenario. Although not examined in this paper, emissions from these vehicles would be expected to change by commensurate levels relative to the non-autonomous version of the vehicle.
There are several reasons to view these results with caution. The foremost one is the lack of measurement data in the analysis. Instead, we employed a powertrain model, FASTSim, that is well-calibrated with real-world measurements, to simulate possible energy impacts with various vehicle automation scenarios. Various studies have employed FASTSim and verified its validity against real-world measurements [
24,
25,
26,
27]. The well-calibrated simulation can provide the assessment in a prompt manner, whereas real-world measurements will be costly and time-consuming for all the scenarios we explored in the simulations. However, future research with more real-world measurement data will certainly be an important supplement to this study.
Secondly, the authors used their own discretion in identifying “reasonable” input parameters to represent AV design. These parameters were based on first-hand accounts of early AVs but may not fully reflect the choices of vehicle engineers. To date, AV developers seem to have taken an “all-of-the-above” strategy when choosing which sensors and communication equipment to place on their vehicle, which is consistent with our list of equipment for the level 5 vehicle. As suppliers optimize these vehicle add-ons, the detrimental impact of autonomy-related equipment on fuel consumption will likely decrease.
Thirdly, although not done in this paper, a lifecycle assessment of autonomous vehicle equipment would also include energy impacts from supporting equipment along the roadways and at the central data centers. This equipment includes roadside communication equipment, roadside sensors, and centrally housed servers. Shehabi et al. [
30] estimate that data centers in the United States consumed 1.8 percent of the electricity in 2014. Other direct energy impacts from AV-related equipment include the manufacturing and disposal of the in-vehicle, roadside, or data center equipment. Each of these impacts would increase the overall impact of AVs.
Lastly, other authors have speculated that vehicle automation could impact vehicle mass through a number of other avenues not quantified in this paper. For example, AVs may not require the same levels of performance as non-autonomous vehicles because of their ability to smooth the acceleration and deceleration profile. This may mean smaller engines can be used in AVs, thereby reducing vehicle mass [
9]. Self-driving AVs will also remove the mass of a driver and possibly the driver’s seat, which will lower total vehicle mass. On the other hand, AV design may include additional human comfort features such as onboard computers, televisions, or even food-related equipment, which would increase vehicle mass.
As with past studies on the environmental impacts of AVs, this paper finds that certain impacts could be quite large but real-world impacts are unknown at this point. As greater data on AV add-ons become publicly available and as AV developers converge on likely mass-market designs, analysts will have a better sense of the true impacts of AV design.

