1. Introduction
In the 21st century, many of the activities carried out by society have undergone a transformation, mainly due to the continuous change to which they are subjected. Proof of this are the demands that are being generated in the educational and professional world as a result of the increased importance of soft skills or transversal competencies [
1]. Different studies have concluded that it is not only necessary to promote the development of technical skills but also of soft skills, since these skills condition professional success and, therefore, are increasingly in demand in new jobs [
2,
3]. In the last 20 years, the requirement to take into account both technical competencies (hard skills) and transversal competencies (soft skills) within the higher education stage is essential to train specialists not only in a specific professional field but also in the development of skills applicable to any profession [
4].
According to studies carried out by McKinsey Global Institute (2018), a growing demand for so-called social and emotional skills (soft skills), specifically intrapersonal and interpersonal skills that serve as the basis for implementing technical competencies in the work context, is expected by the year 2030 [
5]. Some studies indicate that graduates believe that they are being adequately prepared to perform a job, but the reality is that they do not possess the key skills that are in demand for the performance of a job. Therefore, it is necessary to look for efficient ways to promote real and appropriate employability [
6].
Until the end of the 20th century, researchers in the field of psychology and education believed that intellectual competencies were a crucial determinant of educational and occupational achievement [
7]. However, in the current century, soft skills, such as motivation, teamwork, work ethic, planning, effective communication, and cultural awareness, are beginning to be considered to play an equally or more important role in school and work success [
8,
9]. Currently, there is a greater awareness of the role of education in the promotion of soft skills and, therefore, new didactic methodologies for their instruction and new methods and instruments for their evaluation are being developed. An example of such methodologies, which improved both the practices in soft skills instruction and the conditions of employees, is the job development model that offers training in technical skills and in specific skills needed for each type of employment, to facilitate candidates’ access to and progress in the labor market [
10].
Soft skills are interpersonal attributes and personal qualities [
11], which are linked to personality characteristics that include abilities such as flexibility, leadership, communication, professional ethics, and leadership, among others [
12]. These skills are developed and are transferable from one discipline to another and from one profession to another. On the other hand, previous studies [
8] have shown that early school development of cognitive capacity, general personality, and soft skills have an impact on future employment outcomes, health, and social relationships. Today, soft skills are increasingly valued by employers as essential skills for success in professional activities. Employers perceive that recent university graduates do not possess some of the skills required for success in the professional world [
9] and appreciate that university graduates do not have the level required to perform the tasks in demand on the job [
13]. On the other hand, there is great dissatisfaction among university graduates regarding the results of their training, this being the most important basis for establishing a link between the educational and business worlds [
4].
At present, although soft skills are highly valued by employers [
14], much work remains to be done to provide adequate training for university graduates. This training must become one of the most important teaching objectives and, to this end, it is necessary to work to build a consistent dialogue between the educational and business worlds [
4]. Both contexts must move in the same direction and design teaching and learning programs based on the development of both hard skills and soft skills. The latter can be of two types [
3]: (i) those related to personality traits such as leadership, communication skills, teamwork, change management, creativity, and stress management, and (ii) those related to intellectual aspects such as critical thinking, cognitive flexibility, and analytical reasoning. It is key to integrate hard skills and soft skills in the curricular plans within Higher Education institutions to prepare students according to current professional demands [
15]. However, according to studies [
16], it is urgent to teach soft skills in university centers as, although there are experiences that show that it is possible to work on soft skills in university teaching staff [
17], the literature on the subject is not abundant, which is symptomatic of the fact that these experiences are still scarce.
University teachers must be competent and develop various soft skills necessary to face the great changes that have occurred in today’s society [
18]. The teachers best valued by their students are those who show passion for teaching [
19], have initiative, and are effective in the pedagogical-didactic development of their classes [
20]. On the other hand, they must be able to be flexible and adapt to the circumstances, diversify the didactic content, and incorporate a diversity of didactic methodologies [
21]. Likewise, teachers should be creative, innovative, and more involved in their classes and with their students [
22]. It has been proven that teachers should have emotional stability and self-confidence [
23]. Likewise, students state that their learning is more successful when their teachers plan the didactic process in advance and create a facilitating and safe environment [
24]. Among the soft skills, the ability to stimulate critical thinking, creativity, and leadership are also highly valued [
25] and, among others, are the ability to foster collaborative teamwork, the ability to promote good interactions and intercommunication with their students, and among them. However, it has been found that teachers have an average level of sociability and empathy with their students [
26]. Therefore, teachers feel a great need for training in the soft skills that are fundamental for developing their work in the classroom [
27].
For the analysis of the level of development of soft skills in university teachers, it is crucial to study their self-concept in this regard. However, studies that specifically address the issue are not frequent and, in any case, they tend to focus on the relationship between soft skills and digital teaching competencies. Nevertheless, the soft skills self-concept of university teachers located in countries with a low level of digital development and the impact of the country’s development index on teachers’ soft skills has been analyzed in previous studies [
28]. Similarly, some studies identify some sociological or academic aspects that influence certain soft skills linked to digital competence in university teachers (specifically, the area of knowledge [
29] and age [
30]).
Therefore, the relevance that soft skills have acquired in recent years at both the educational and professional levels has become evident, as well as the relevance that they will have in the post-COVID-19 future. If in the future educational model it will be necessary to design training programs that promote both hard skills and soft skills, university teachers must have an optimal level of soft skills so that their students, through appropriate methodologies and technologies, can acquire them. Given this context, the objective of this paper is to analyze the degree of acquisition of this type of competency in American university teachers. To achieve this objective, a questionnaire on the self-concept of soft skills has been developed. This questionnaire is based on the soft skills included in the Bochum Inventory of Personality and Competences (BIP) [
31].
2. Materials and Methods
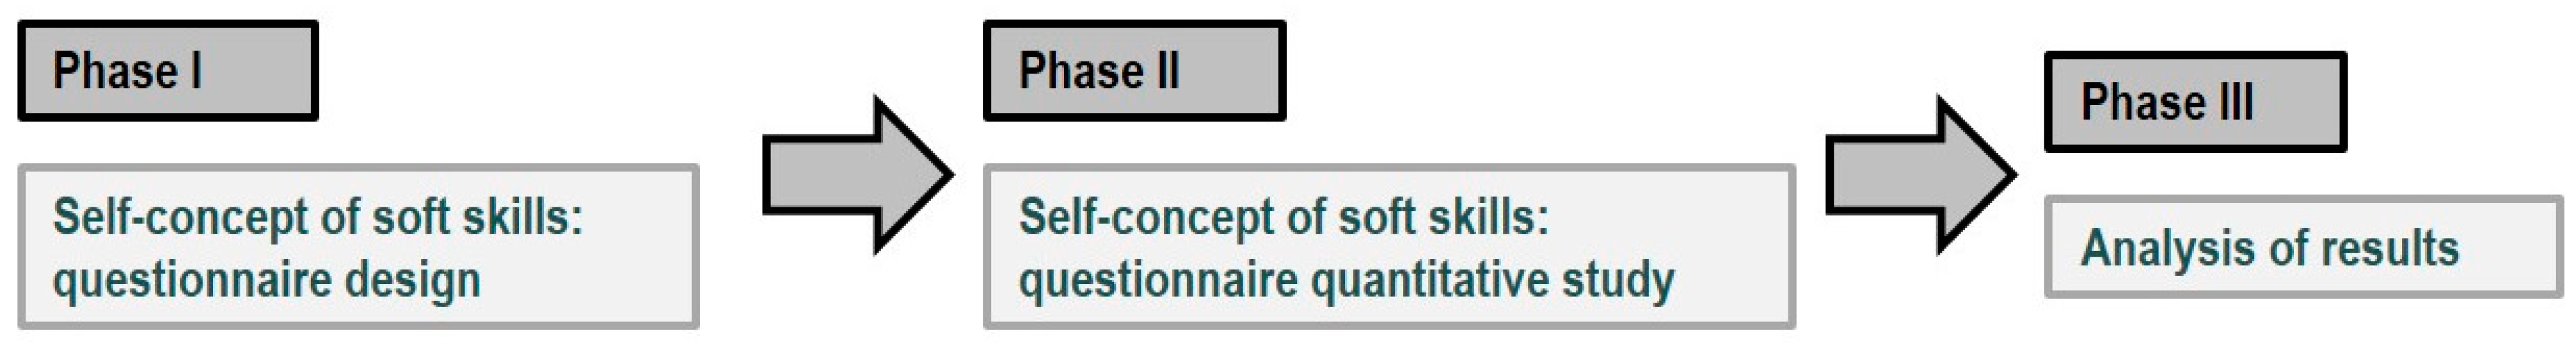
Explanatory research has been developed to analyze the degree of acquisition of soft skills in American university teachers. This research is based on a methodological process structured in several stages (
Figure 1): Phase I: self-concept of soft skills questionnaire design; Phase II: self-concept of Soft Skills quantitative study; and Phase III: analysis of results obtained.
2.1. Self-Concept of Soft Skills: Questionnaire Design
In the present study, the Bochum Inventory of Personality and Competencies (BIP) has been used as the base source for the design of the instrument to measure soft skills. It consists of 210 items [
31], in which the level of motivation, social competencies, aspects of the psychological constitution, and task-oriented behaviors are evaluated. It includes an image distortion scale to test the validity of the results obtained. Among the scales assessed are the following:
Work motivation: Results orientation, change initiative, and leadership.
Work Behavior: Conscientiousness, Flexibility, and Action Orientation.
Social skills: Social intelligence, Sociability, Teamwork, and Influence.
Psychic structure: Emotional stability, Work-ability, Self-confidence.
Additional competences: Sense of control, competitiveness, mobility, leisure orientation, image distortion.
2.1.1. Work Motivation
It has been verified that motivation is a cognitive capacity that enhances communicative skills and influences students’ behavior and learning by promoting interest in their academic performance. This favors an increase in the effort capacity of students, and hence, it is an effective means to achieve learning objectives, in addition to boosting communicative ability [
32]. In relation to work motivation, there are studies [
33] that prove the existence of a significant relationship between professional competence, achievement motivation, and work performance of primary school teachers. On the other hand, the professional attitude among students of pedagogical careers is strongly conditioned by their choice of career, their vocation, and their communication skills and professional motivation [
34]. In addition, professional value is closely related to external positive motivation, related to values such as professional growth and status in the profession, and internal motivation, linked to initiative, self-confidence, interest in life in general, and freedom of career choice [
35]. Rutten and Badiali [
36] indicated that it is important to pay more attention to the initial motivations that move students to choose university careers that lead to them becoming teachers.
2.1.2. Work Behavior
Regarding the scale of work behavior, workers who are emotionally well, establish good interpersonal and communication relationships with their colleagues, improve their productivity and ensure their permanence within the company [
37]. However, it has been perceived that younger graduates have a lower degree of belonging and stability within a company. On the other hand, work proactivity has traditionally been an attitude that leads to greater commitment, performance, and satisfaction [
38]. Despite this, it should be noted that proactive behaviors can generate both positive (self-determination and self-efficacy, elicitation to learning, reflective capacity, etc.) and negative outcomes (burnout, stress, and discomfort [
18,
39]). In addition, some personal approaches such as autonomy (self-reliance) and interdependence favor work engagement and positive proactive behavior [
40].
There is evidence that teacher flexibility can positively influence promoting learning skills in students [
32]. In addition, teachers who are more flexible with their work and can adapt to unexpected and changing situations usually expect more positive performances from their students, including those who have some learning difficulty or disability, as they can adapt to different learning styles [
41]. Moreover, those teachers who are confident in their self-efficacy produce better results in the development of their students’ learning skills and their teaching quality than teachers with a low level of self-confidence. [
42]. Likewise, teachers who take responsibility for carrying out quality teaching and use effective and efficient teaching methodologies tend to expect and obtain good academic results from their students, in addition to favoring their own teaching ability [
23].
2.1.3. Social Skills
In relation to social skills, Hagmann and Almekinders [
43] showed that incorporating in the classroom activities based on social skills, coaching and mentoring, and implementing personal and group development techniques and resources can help improve students’ employability. On the other hand, doing internships in real projects and practical programs enhances students’ capacity for teamwork, collaboration, and cooperation with the group, respect for others, tolerance, self-confidence, resilience, patience, responsibility, and critical and creative thinking [
27]. Other authors show the benefits originated by instructors who foster in their groups of students skills such as identifying their difficulties in terms of task performance, seeking group strategies to find solutions to problems, applying team dynamics, stimulating motivation, critical thinking, and communication among its members [
44,
45]. Ultimately, the intention is to help students become mature professionals through their university experience so that they can meet the demands of potential employers and thus achieve a satisfying personal and work career [
46].
It seems that, according to previous studies [
47], teamwork, in general, is more efficient than individual work, since collaborative teamwork favors the flexibility capacity of its members [
48]. This way, robotics facilitates the acquisition of soft skills and can stimulate the ability to work collaboratively, develop communication, mediation, negotiation, and problem-solving skills [
32].
2.1.4. Psychic Structure
In relation to emotional stability, work capacity, and self-confidence, some studies [
49] suggest that emotional intelligence can be learned and has a satisfactory influence on personal self-esteem, student morale, and the development of skills necessary for professional performance. In fact, in previous studies carried out in the virtual or face-to-face classroom [
50], students acquired the necessary basic competencies, such as hard skills and soft skills (work capacity, self-knowledge, self-confidence, among others) to address the lack of essential skills that are being requested by hiring managers and companies in a generalized way [
51,
52,
53].
2.1.5. Additional Competences
As for the sense of control, this competence is closely related to self-control, defined as the ability to modulate and control one’s actions. It is determined by self-confidence [
54]. As for competitiveness, it can be defined as the eagerness and effort to learn, progress, and improve [
55] in all facets of life, both personal and professional. In a globalized and connected world, mobility has been highlighted as one of the most important soft skills. The ability to function in international environments, live new experiences, and face new challenges in unfamiliar places is undoubtedly essential today. In terms of leisure orientation, this competence is defined as the attitude of an individual or group towards leisure [
56]. It should be taken into account that nowadays leisure has become one of the essential activities in society. Finally, image distortion indicates the self-image of a person, as well as the predisposition of this person to give a favorable or unfavorable image of himself/herself [
57].
2.2. Participants
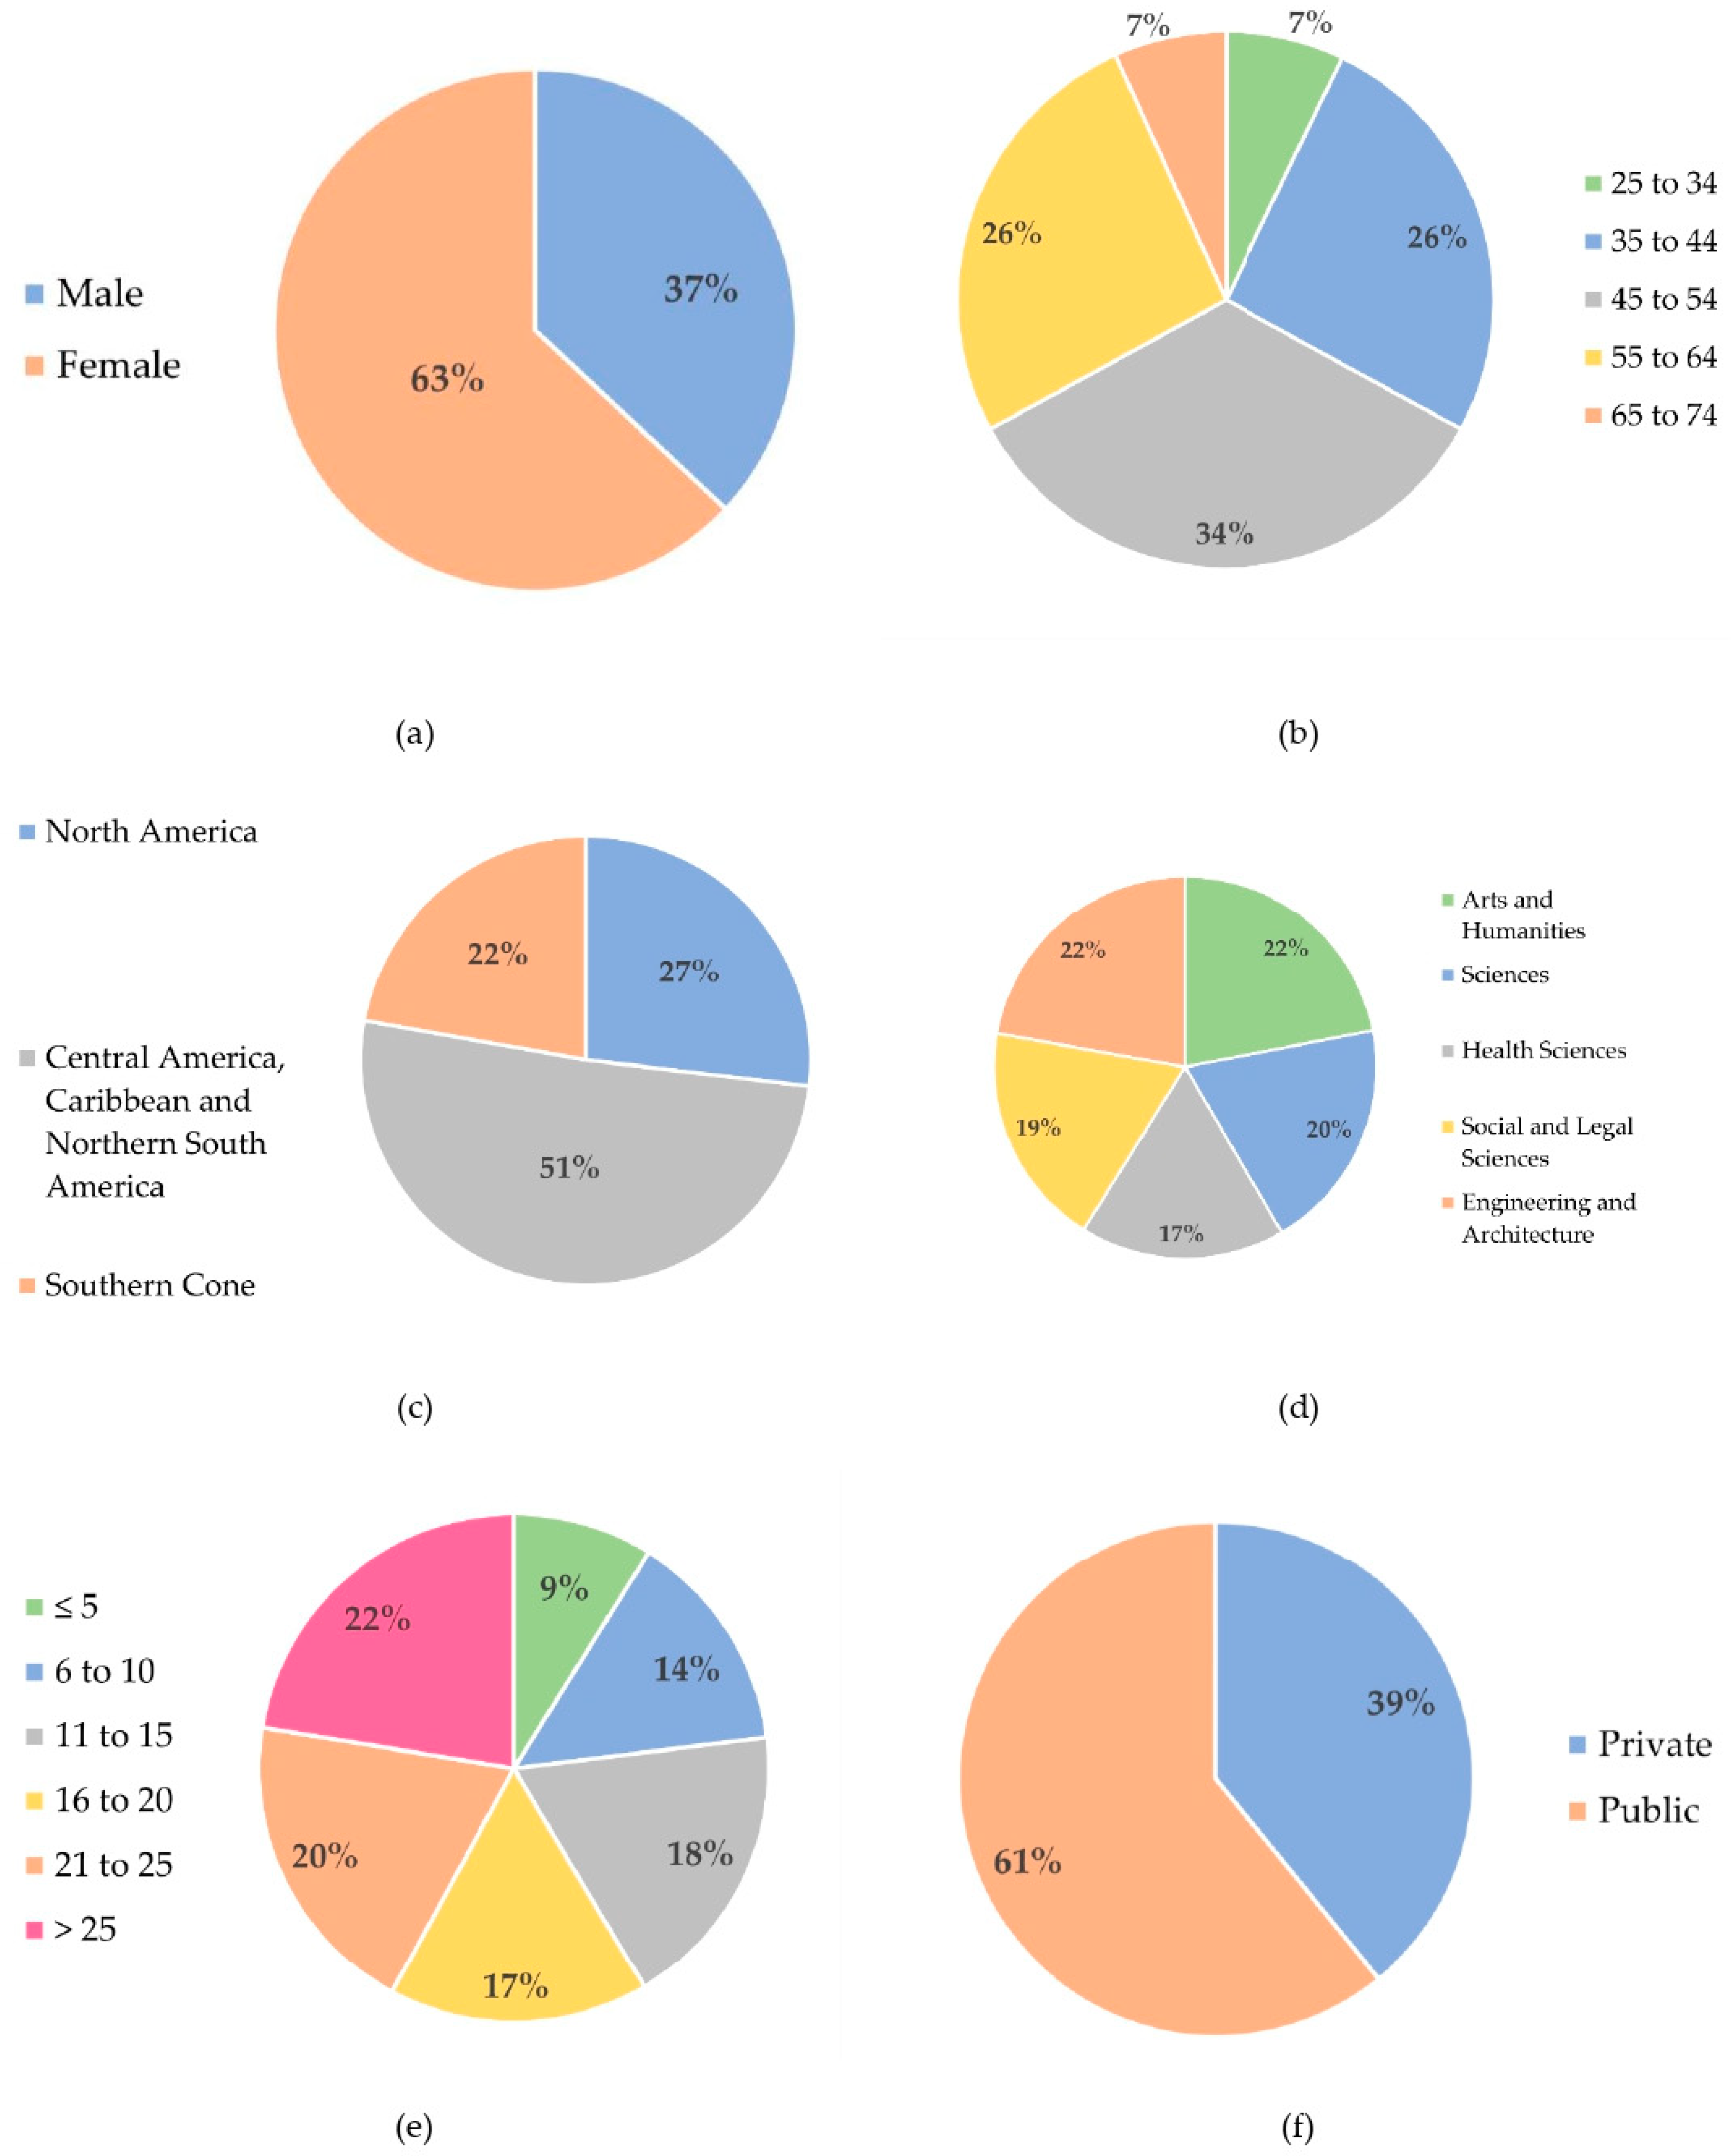
Participants were selected by non-probability convenience sampling. This process has resulted in a sample of 473 participants, who are teachers from all areas of knowledge who carry out their teaching and research activity in universities throughout the American continent. The ages of the participants range, non-homogeneously, from 25 to 74 years old, and their university teaching experience is very varied (between those with less than 5 years and those with more than 25 years of experience), although the distribution is not homogeneous among the different ranges of experience either. The teachers surveyed work in both public and private universities. The participants answered the questionnaire voluntarily and anonymously.
2.3. Variables, Objectives, and Hypothesis
This study considers six independent variables that affect the sample and whose influence on the answers is to be analyzed. Three of these variables are sociological (gender, age-range, and the geographical area where each participant carries out their teaching activity) and the other three concern academic aspects of the participants’ teaching activity (respondents’ area of knowledge, range of years of university teaching experience and the nature, public or private, of the university institution where each participant teaches). Details of the independent variables are given in
Table 1.
The general research objective is to analyze participants’ self-concept of their soft skills. Specifically, this study aims to achieve the following specific objectives: (i) to analyze the mean values of the participants on their soft skills and the dispersion of their answers for each of the skills (ii) to identify possible gaps in the mean values on soft skills when the sample is differentiated by gender, age range, geographical area, teaching experience, area of knowledge and university tenure; (iii) to analyze possible differences in the dispersions of the results when the sample is differentiated by each of the above variables. Therefore, the hypothesis to be verified is that the aforementioned independent variables significantly influence the self-concept of American university teachers about their soft skills.
2.4. Instrument
The instrument used for the study is a self-created questionnaire with 18 questions or items, all of them Likert-type, with values between 1 and 5. The questionnaire was passed out voluntarily among the population of university teachers. Through their responses, participants rated their self-concept regarding 18 soft skills, with 1 being the least positive and 5 the most positive. The survey items are distributed in five subscales, corresponding to five families of skills: (i) work motivation, (ii) work behavior, (iii) social skills, (iv) psychic structure, and (v) additional competences. For the sake of both clarity and simplicity, these subscales will be called in this paper as follow: A, B, C, D, and E, respectively.
The specific items of each subscale are specified in
Table 2. Hereafter, the different skills will be referred to by the identifying code shown in
Table 2 to the left of each one. The reliability of the instrument is tested using Cronbach’s alpha parameter, which has been computed for each subscale and yields the values indicated in
Table 2. All Cronbach’s alpha parameters are greater than 0.70, which shows that all subscales are internally consistent and, consequently, the instrument is reliable [
58]. In addition, the content validity of the instrument has been established through the correlations between the scales and of the scales with respect to the overall questionnaire.
Table 3 shows the Pearson correlations, which prove significantly high correlations between the different scales and the overall questionnaire. Consequently, all the relationships between the scales can be assumed to be moderate. All correlations are statistically significant.
2.5. Procedure
To achieve the objectives described above, a quantitative study was carried out based on the analysis of the data obtained from the questionnaire that was designed. This study has a descriptive component (the purpose of which is to interpret the descriptive statistics obtained) and an inferential component, which seeks to verify the hypothesis based on appropriate tests of comparison of means and standard deviations.
After passing the questionnaire to the participants and verifying the instrument, an overall descriptive analysis and descriptive analyses based on the means and standard deviations of each of the items when the sample is differentiated by each independent variable were carried out on the data obtained. After verifying by using the Lilliefors test that the data cannot be assumed to be normally distributed, it was decided to apply non-parametric tests (Mann–Whitney or Kruskal–Wallis, depending on whether the independent variable is dichotomous or polytomous, and thus on whether the sample is split, when differentiating by that variable, into two or more than two subsets, respectively) to verify whether there are significant gaps between the means of the answers to each of the items between the populations generated when the sample is differentiated by each variable. A similar analysis was also carried out to analyze differences between standard deviations using Levene’s test. All these tests were applied with a significance level of 0.05 and the computations were performed with the statistical software R-Commander.
3. Results
3.1. Sociodemographic Variables
Figure 2 shows the distributions of the sample elements when differentiated by each of the independent variables considered. None of the sample distributions differing by the variables considered is a homogeneous distribution, as indicated by the
p-values of the corresponding goodness-of-fit tests to a homogeneous distribution, which are less than the 0.05 significance level. There is a higher proportion of females than males. In terms of age ranges, the middle age brackets (35 to 64 years old) predominate, with the extreme age brackets being in the minority, but roughly equal in proportion to each other. In terms of geographical location, approximately half of the respondents work in Central American, Caribbean, or Northern South American countries. The other half of the participants are more or less evenly distributed between North America and the Southern Cone, with a slight superiority in proportion to the North American area.
As for the academic variables, the distribution by areas of knowledge is somewhat more homogeneous, although there is a relative majority in the areas of Social and Legal Sciences, Arts and Humanities and Engineering. With regard to years of teaching experience, the majority of respondents had more than 25 years or between 21 and 25 years of experience, to the detriment of those with less than or equal to 5 years, which is the minority group. Finally, the proportion of participants from private universities is lower than that from public universities (the first being about two-thirds of the second).
3.2. Global Results of the Questionnaire
Table 4 shows the overall means and standard deviations for the scale items and the measures themselves, differentiating the sample by gender. It can be seen that the mean levels reported by the participants are higher than 4 for all items. This means that the levels of soft skills reported by the participants are, on average, very positive. Two additional competences (leisure orientation and image distortion), whose mean values are between 3 and 4, are exceptions to this observation. It is precisely these two skills that show the greatest standard deviation, which means that, in addition to the fact that the participants’ opinion of them is the least positive of all, these are the skills whose self-concepts are most weakly formed within the surveyed population. Within the first four subscales, the one with the highest deviations is work motivation. Hence, it can be concluded that, in general, the self-concept of work motivation is more weakly formed than the other self-concepts, at least from a descriptive point of view. Otherwise, the skills with the highest mean value are the skills of conscientiousness and work ability. For these skills, the deviations are also the lowest in the entire questionnaire. It can be concluded, therefore, that the respondents have a very positive and quite clear self-concept of their skills in this respect. Moreover, it is interesting to note that the deviation, globally taken, of the competences referred to as work motivation is greater than the rest of the deviations. This fact indicates that work motivation is precisely the subscale about which the participants have their self-concept more weakly formed, in general, because the results are more heterogeneous.
3.3. Results Differentiating the Sample by Gender
The analysis carried out in this section is based on the data presented in
Table 4, where the means and standard deviations of the scale items are shown, differentiating the participants by gender. It can be observed in the data of
Table 4 that the mean values are very similar for males and females for all subscales. In the items corresponding to the work behavior subscale, females show slightly higher mean values than males, while males show higher mean values for all additional competences. In the work motivation subscale, males have higher mean values, except the item initiative for change, where females have a higher mean value.
As for the social skills subscale, males show slightly higher social intelligence and influence skills, on average, than females, while females outperform them in sociability. Likewise, in terms of psychological structure, females report greater emotional stability and work ability, and males report greater self-confidence. The widest differences between mean levels are found in leadership skills (in favor of males) and flexibility (in favor of females), as well as in the additional competences of leisure orientation and image distortion, with males showing higher mean levels in both. With regard to the standard deviations, it can be stated that the highest levels correspond, in both genders, to the additional competences, particularly with regard to leisure orientation and image distortion. This means that it is these two skills that give rise to the most polarized responses, both among males and females. As for the other skills, the differences between males and females are very small, swinging towards one gender or the other depending on the skill. In this respect, the most notable differences are found in the skills of self-confidence (psychic structure) and sense of control (additional competences). For both, the standard deviations between males and females differ by one-tenth. Females show a higher polarization of responses for the self-confidence skill and males for the feeling of control skill.
To assess the degree of significance of the differences in the mean values of the different items between males and females,
Table 5 shows the Mann–Whitney test statistics for the comparison of means. Most of the
p-values of the Mann–Whitney tests are greater than 0.05. The only
p-values that are below the significance level are for leadership skills (A3), flexibility (B5), and the additional competencies of sense of control (E14), leisure orientation (E17), and image distortion (E18). Consequently, we can assume that there is no significant gender gap between the mean levels for the first four subscales, with the exception of the two skills mentioned above (two of the two with the highest differences between the mean values), and there are significant differences in three of the five additional competencies. In particular, males show significantly higher leadership than females and females show higher flexibility than males. In addition, males show significantly higher skills of sense of control (E14), leisure orientation (E17), and image distortion (E18) than females. However, for the rest of the skills no significant differences can be assumed, which leads to the conclusion that, in general, there is no or only a weak gender gap.
As for Levene’s tests, the statistics in
Table 5 show that we can assume homoscedasticity for all skills except work ability (D12), self-confidence (D13), and sense of control (E14), which present a Levene
p-value less than 0.05. Consequently, it can be assumed that females report having a significantly better-defined self-concept of their work ability and sense of control skills than males, while males have a significantly better-defined self-concept of their self-confidence.
3.4. Results Differentiating the Sample by Age Range
The mean data and standard deviations of the answers to the different items, differentiated by the age range of the participants, are shown in
Table 6. Regarding the mean levels, it is worth noting that all the items show means above 4 in all age ranges, except for the skills of leisure orientation (E17) and image distortion (E18), whose means are between 3 and 4 in all age ranges (except for the last skill in the over-65 age range, which gives a mean of 2.97) and the skills of influence (C10) and competitiveness (E15) for the over-65 age range, whose means fall below 4. Comparing the different age ranges, the most notable observation is that the mean levels are, for all skills, lower in the higher age range, with only two exceptions: the skills of self-confidence (D13) and leisure orientation (E17), where the means are lower among younger participants than among older ones. It follows from this observation that older participants’ self-concept of their own skills is less positive than that of the other participants.
Standard deviations are higher in the older age range for all items. Therefore, although the self-concept of the older participants is, on average, more negative than that of the other age groups, there is greater dispersion in their assessments in this respect and, therefore, greater heterogeneity in their answers than the rest of the respondents.
Table 7 shows the Kruskal–Wallis and Levene’s test statistics with four degrees of freedom for the survey results when differentiated by age range. The Kruskal–Wallis
p-values are greater than the significance level for all skills studied, except for the social skill of teamwork (C9) and work ability (D12). Consequently, it can be assumed that, in general, there is no significant gap by age ranges of the mean levels of the participants’ conception of their own skills. There is, however, a significant difference in means for the two skills mentioned: teamwork (C9) and work ability (D12). With respect to both, it can be concluded that older participants report significantly lower levels than the rest of the age groups.
Finally, it can be assumed that the answers of participants over 65 years of age are significantly more dispersed than the rest of the participants for all subscales, except for work motivation (A), as the p-values of the corresponding Levene tests are less than 0.05. It can be assumed, therefore, that participants in this age range have a weaker self-concept of their own skills in work behavior (B), social skills (C), psychic structure (D), and additional competences €. Exceptions to this conclusion are the skills of working ability (D12) and teamwork (C9).
3.5. Results Differentiating the Sample by Geographical Area
Table 8 shows the means and standard deviations for each of the items in the questionnaire, differentiating the sample according to the geographical area to which the participants belong. It can be seen that the mean values in North America and Central America, the Caribbean, and Northern South America are above 4 for all items, except for one of the items in the additional competences subscale (leisure orientation, E17). It is precisely this skill that shows the greatest dispersion of results in both areas because it is the one with the highest standard deviation. On the other hand, in the Southern Cone, the mean values also exceed the value of 4 except in the items of the additional competences subscale (E) and the influence ability (C10) of the social skills subscale. It is important to note that the mean values for all items are lower in the Southern Cone than in the other geographical areas under study. The mean values in North America and Central America are more homogeneous, with only slight differences in the deviations in favor of one area or the other depending on the skill considered. Consequently, the data suggest that participants’ perceptions of their own skills are good or very good, to a lesser extent in the Southern Cone, and so the answers are generally more dispersed.
In addition, it is worth noting that North America is the geographical area with the lowest deviations in all skills, except in work ability (D12), where the deviation is the same as in the Southern Cone, and in leisure orientation (E17), where the deviation is seven hundredths higher than in the Southern Cone. This suggests that the answers in North America are more homogeneous than in the rest of the geographical areas in these skills.
Table 9 shows that all Kruskal–Wallis
p-values of the additional competences subscale (E) and all but one of the psychic structure (D) and social skills subscales (C) are less than the 0.05 significance level. This means that for the three mentioned subscales there are significant differences between the mean values of the questionnaire. Taking into account the means indicated in
Table 8, it can be concluded that participants from the Southern Cone show significantly lower mean levels than participants from the other geographical areas in additional competences (E), in skills linked to psychic structure (C), except for work ability (D12), and in social skills (C), except for teamwork (C9).
Levene’s test statistics, shown in
Table 9, confirm that it is possible to assume that participants from North America give, in general, significantly more homogeneous answers than those from the rest of the areas in the skills of conscientiousness (B4) and image distortion (E18). Indeed, the Levene’s
p-values for these items are less than 0.05, so that the differences between the standard deviations are significant. Consequently, the concepts are more strongly formed in this area as far as the above skills are concerned. The leisure orientation skill (E17) also shows significant differences in its deviations. In this case, it is the participants from the Southern Cone who show a greater homogeneity in their answers and, consequently, a significantly better-formed concept of their own leisure orientation (E17).
3.6. Results Differentiating the Sample by Area of Knowledge
The mean values and standard deviations of the answers to the questionnaire, differentiating participants by areas of knowledge, are shown in
Table 10. From these data, it can be deduced that all items show averages above 4 in all areas of knowledge, except for the additional competences leisure orientation (E17) and image distortion (E18), whose average is lower, also in all areas. Comparing the mean values of the different areas, it is clear that, in general, the humanistic-social field (Arts and Humanities and Social and Legal Sciences) show higher mean values than the scientific-technical field (Engineering and Architecture, Science and Health Sciences). The area of Social Sciences and Law, in turn, provides slightly higher means than the area of Arts and Humanities in all items, except for the social intelligence skill (C7). Within the scientific-technical areas, it is the field of Engineering which, in almost all skills, reports higher means, followed by the area of Sciences, except for the skills of sociability (C8) and influence (C10), self-confidence (D13), and the aforementioned additional competences of leisure orientation (E17) and image distortion (E18) and, finally, Health Sciences, except for the skills of action orientation (B6), influence (C10) and workability (D12).
With regard to the deviations, it is interesting to note that the answers of the participants from the Health Sciences area show the greatest dispersion in most of the items, only exceeded by the Engineering and Architecture area in the additional competences of leisure orientation (E17) and sense of control (E14) and, by a very narrow margin, in the skills of results orientation (A1) and social intelligence (C7).
Table 11 shows the statistics of the Kruskal–Wallis test for comparison of means and the Levene test for comparison of variances, both with four degrees of freedom, to check whether the differences observed in this respect are statistically significant. As for the mean values, the Kruskal–Wallis
p-values show that we can assume significant differences by area of knowledge in the work behavior subscale (B), in the two social skills social intelligence (C7) and sociability (C8), in the change initiative skill (A2) and leisure orientation (E17). Consequently, it cannot be assumed that there is a significant gap by area of knowledge, except for the work behavior subscale (B) and, specifically, for the other skills just mentioned. As for the working behavior subscale (B),
Table 10 shows that the area of Social Sciences has slightly higher means than the area of Arts and Humanities and that these areas, in turn, have higher means than the areas of scientific-technical fields. Within the scientific-technical fields, the highest mean values for work behavior (B) are found in Engineering, followed by Science and Health Sciences, except in action orientation (B6), where Health Sciences outperforms Science. The described gap can be assumed to be significant so that it can be concluded that participants from humanistic-social areas show a higher average level of work behavior (B) than participants from scientific-technical areas.
As for the social skills of social intelligence (C7) and sociability (C8), the gap by areas of knowledge between the humanistic-social field and the scientific-technical field is also confirmed for these skills, in the sense that the participants whose area of knowledge is in the first field show significantly higher average levels than the participants from the second field in these skills. In addition, it can be confirmed that, within the scientific-technical field, the area of Health Sciences is the one that shows significantly lower average levels in the aforementioned social skills. Similar conclusions can be drawn with respect to the skills of initiative for change (A2) and leisure orientation (E17).
With regard to the deviations, it can be deduced from the
p-values of Levene’s test indicated in
Table 11 that it cannot be assumed that there are significant differences by areas of knowledge, except for some specific skills. Specifically, these are conscientiousness (B4; in this skill it can be assumed that there is a significant gap between the humanistic-social and scientific-technical fields, with less dispersion for the former), work ability (D12; with analogous conclusions), and the additional skills of sense of control, mobility and image distortion (E14, E16, and E18; in these skills, there is, in general, a greater dispersion of answers in the humanistic-social areas than in the scientific-technical areas).
3.7. Results Differentiating the Sample by Years of Teaching Experience
The mean data and standard deviations when participants are differentiated by ranges of years of teaching experience in university education are shown in
Table 12. It is observed that the lowest mean values are reached for the additional competences of leisure orientation (E17) and image distortion (E18), irrespective of the participants’ years of teaching experience. In addition, the most remarkable observation regarding mean values is that participants with fewer years of teaching experience show lower mean levels than the rest in the subscales of work motivation (A), work behavior (B), and additional competences (E). The standard deviations are also higher for the first two subscales among those with less than five years of teaching experience.
Table 13 shows the Kruskal–Wallis and Levene’s test statistics, with five degrees of freedom, for the comparison of means and variances, respectively, when the sample is differentiated by years of teaching experience. The Kruskal–Wallis test statistics do not identify a significant gap between the mean levels of the skills studied when differentiated by the length of teaching experience. A significant gap is only detected in the skills of sociability (C8) and leisure orientation (E17). In both cases, participants with less teaching experience have significantly lower mean levels. It can be assumed, therefore, that respondents with less teaching experience show lower sociability and leisure orientation skills (C8 and E17).
As far as standard deviations are concerned, Levene’s test also does not identify significant differences between the participants when differentiating by years of teaching experience for most of the skills, as can be seen in
Table 13. With regard to the skill of conscientiousness (B4), the data in
Table 12 shows a significantly higher dispersion among participants with less than 5 years of teaching experience, so it is this sector of the sample that has the least developed concept of this skill. With regard to work ability (D12), the greatest dispersion is found among those between 16 and 20 and between 21 and 25 years of teaching experience, who therefore have the greatest difficulty in defining the concept. With regard to the additional skills, the lowest dispersion in the sense of control (E14) is found among participants with less teaching experience, and the highest dispersion corresponds to the population with between 16 and 20 years of teaching experience. In the mobility skill (E16), it is the participants with between 16 and 20 years of experience who show the least dispersion, and those with between 6 and 10 years of experience the most. Finally, regarding image distortion (E18), the population with the least teaching experience is the one with the best-formed concept, because it is the one with the lowest dispersion. The highest dispersion corresponds to the participants with between 6 and 10 years of teaching experience.
For the sake of clarity, the proportion of participants in each age range who are in each of the teaching experience intervals considered is shown in
Table 14. There are notable proportions of participants of very different age ranges in all the ranges of teaching experience. Furthermore, the Pearson’s chi-square test statistics with 20 degrees of freedom (Chi-square = 280.63;
p-value = 2.2 × 10
−16) confirm that the two variables considered (age and teaching experience) turn out to be independent for the population studied.
3.8. Results Differentiating the Sample by the Nature of the University
The mean values and standard deviations of the data differentiated by the tenure of the university are shown in
Table 15. It can be seen that the mean values of the answers of the participants from private universities are higher than those from public universities in all skills of the subscales of work motivation (A), work behavior (B), social skills (C), and psychic structure (D), as well as in the additional competences of sense of control (E14) and, to a lesser extent, mobility (E16). The skills where the difference is widest are social intelligence (C7) and work ability (D12), with 15 hundredths of a point difference, and leadership, with 17 hundredths of a point difference.
With regard to the deviations, it can be seen that there is greater homogeneity of answers among participants from private universities for all the items in the first four subscales as the deviations are smaller. The greatest differences, in this sense, correspond to the skills of conscientiousness (B4), flexibility (B5), and work ability (D12).
To assess the significance of the differences,
Table 16 shows the Mann–Whitney test statistics for comparison of means and Levene’s test for comparison of variances, both with one degree of freedom.
The p-values of the Mann–Whitney test do not allow us to assume that there is a gap, in general, by the character of the university for the mean levels of the skills. There are only three skills where such a gap can be assumed: leadership (A3), social intelligence (C7), and work ability (D12). In these skills, the mean levels are significantly higher in private universities, and it is precisely in these three skills that the differences between the mean values are the widest between the two types of universities.
From the Levene test statistics, it is possible to assume homoscedasticity for all items, with only two exceptions: conscientiousness (B4) and work ability (D12). For both skills, the deviation is lower in private universities, so participants from private universities have a more solidly formed self-concept than those from public universities with respect to the skills of conscientiousness (B4) and work ability (D12). It is worth noting that these are two of the three skills where the differences between the deviations are highest.
4. Discussion
From the results obtained, it can be deduced that the general objective (to analyze the participants’ self-concept of their soft skills) and the specific objectives have been achieved. Indeed, a descriptive analysis of the statistics of the overall data from the questionnaire has been carried out and nonparametric tests have been applied to verify whether or not there are gaps in the mean values and standard deviations when differentiated by each of the independent variables considered.
Also, the hypothesis has been partially verified. Indeed, it has been shown that the different independent variables considered are influential in the teachers’ evaluations of their soft skills, although to different extents depending on the variable considered. The gender variable influences the mean levels of the work behavior and additional competencies scales in favor of females, with the latter having more solidly defined self-concepts in some specific items. By age, older participants have significantly lower levels in some social skills and specific work abilities, but this is the least influential variable. Teaching experience does not generate notable gaps either; it only does so in the sociability and leisure orientation competencies, to the detriment of the less experienced. In the scales of psychic structure, social skills, and additional competencies, teachers from the Southern Cone present significantly lower mean levels, with North Americans being more confident in their answers. As for the area of knowledge, the humanistic-social fields show significantly higher mean levels in work behavior than the scientific-technical fields, with a more solid concept in some of their items. Finally, the ownership of the university has a weak influence on the self-concepts on soft skills: it is only determinant in leadership, social intelligence, and work ability, in favor of private universities, which, in addition, provide more homogeneous knowledge in conscientiousness and work ability.
The results obtained are broadly consistent with those of [
28], a study in which the target population consisted of university teachers from countries with low levels of digital development. Therefore, it can be concluded that the level of development of the country is not a determining factor of the self-concepts about soft skills among university teachers, probably because they are part of the social sectors with the highest level of development in their respective geographic areas.
Analyzing the overall results, it can be seen that, in general, the participants express high or very high levels of soft skills. This contrasts with some studies in which employers express deficient opinions about the competencies of university graduates [
4,
9,
13]. In this sense, there seems to be a gap between the conception that teachers have of themselves and the actual effective level or their ability to transmit these competencies didactically. All this suggests, in line with other studies such as [
15,
16], the need to rethink teaching methodologies in higher education to facilitate the transmission of transversal competencies, such as soft skills. In this sense, the observation is consistent with those of [
59], which suggests the need for a methodological shift in higher education classes towards embedded models, whose classes have fewer students and whose teaching action is more focused on the development of transversal competencies, although the study refers to a different geographical area (Malaysia). It would also be interesting to explore the possibility of designing specific training plans for university teachers on soft skills training, transferring to the American continent the experiences developed in Indonesia with good results with respect to trainee teachers [
17].
As for the gaps identified, the literature speaks abundantly of gender gaps, both in the self-concept of different social and professional sectors about their soft skills and in the way some essential and strategic sectors are structured, such as big data [
60], team sports [
61] or different sectors of the economy [
62], which strongly incorporate soft skills. Usually, these studies defend the existence of difficulties for the development of soft skills in females or inferiority in their self-assessment. This study shows that, contrary to what happens in those sectors, in university education, there are gender differences that favor females. This fact shows that the university teaching staff sector does not preserve the paradigms of male superiority that may persist in other areas. This being so, the gaps identified in the present study may be due to realistic expressions of authentic differences between the soft skills most frequently developed and worked by males and females.
Age, teaching experience, and geographic location are not variables that are frequently addressed in the literature to study the self-concept of university teachers regarding their soft skills. In this sense, it can be said that the present study is novel with respect to the previous literature. Numerous studies address the levels of soft skills among university students or young university graduates [
63]. In this population, age seems to work against soft skills. These results are only partially confirmed when transferred to the present study, because, although age decreases the perception of social skills, the less experienced teachers report a lack of some soft skills such as sociability or leisure orientation. Regarding the geographical area, the results reveal the need to increase training actions on soft skills in the Southern Cone, although there are publications that note a certain concern in this regard [
64]. It is probably also necessary to rethink the curricula, as concluded in [
50], which compares the self-concept that students have about their soft skills, differentiating between Finnish and Italian students.
Regarding the area of knowledge, soft skills are usually studied as being linked to digital competencies. In this sense, some studies place technical education teachers as more gifted than the rest in soft skills, due to greater technological knowledge and greater practice with digital materials [
29]. However, studies that focus on analyzing self-concepts about soft skills tend to show a better assessment of teachers of humanistic-social areas [
28]. This paper corroborates the conclusions of the latter study. Probably, the reason lies in the greater knowledge of technical teachers about technology, which makes them have a more realistic perspective of certain limitations in their soft skills.
University tenure has also been shown to be a differentiating factor in soft skills self-concepts. It has been shown that teachers from private universities make a more positive assessment in certain aspects. This fact contradicts some studies carried out among students from public and private universities [
30,
65]. It seems, therefore, that there is a notable difference in perception between the soft skills that students express and those that teachers value in themselves. This suggests the existence of a problem of transmission of this type of skills, especially in private universities, which should be remedied with specific teacher training programs in this regard.
5. Conclusions
To design higher education training programs that promote the acquisition of soft skills, university teachers must have an optimal level of these skills. The results obtained in this research show how the American university teachers from different regions: (i) North America; (ii) Central America, and (iii) Southern Cone have globally considered a high self-concept about their degree of development of soft skills, especially in North America. However, a significant gap has emerged between males and females in soft skills such as leadership, sense of control, orientation, and image distortion, where females express a significantly higher self-concept. In contrast, males express a higher self-concept in terms of flexibility.
Age has also been shown to be an influential variable as university teachers in the 45–54 age group show a self-concept below the average. In terms of teaching experience, teachers with less experience show a below-average self-concept in terms of soft skills development. Similarly, South American participants show a clearly lower self-assessment than North American teachers. This statement shows the gap existing in both regions of the American continent and the need to strengthen the acquisition of soft skills in university teachers in the South. Finally, with respect to the area of knowledge, the results obtained reflect how the American university teachers whose area of knowledge is linked to the Humanities and Social Sciences obtain better results in self-assessment. These results may be due to the greater previous knowledge that these teachers have about soft skills, as well as their greater development in competencies related to self-knowledge.
In view of these results, it is possible to affirm that, even with certain areas for improvement, the American university teachers are globally prepared to face a post-COVID-19 mixed university educational model that promotes both hard skills and soft skills in an equitable way.
This study has some limitations. In particular, the analysis focuses separately on certain sociodemographic and academic variables that may affect the self-concept of soft skills. In the future, it would be interesting to be able to cross these variables to discover the degree of influence they have on each other. In addition, it would be useful to explore in greater depth the causes of some of the gaps found (for example, by geographic area) or the fact that gender differences are diluted in the population studied with respect to soft skills.


