Article

The Role of Perceived Quality on High-Speed Railway Tourists’ Behavioral Intention: An Application of the Extended Theory of Planned Behavior

1
College of Tourism, Huaqiao University, Quanzhou 362021, China
2
School of Hospitality, Food & Tourism Management, University of Guelph, Guelph, ON N1G 2W1, Canada
3
Department of Tourism Management, Shanxi University, Taiyuan 030006, China
*
Author to whom correspondence should be addressed.
Sustainability 2021, 13(22), 12386; https://doi.org/10.3390/su132212386
Submission received: 7 October 2021 / Revised: 28 October 2021 / Accepted: 5 November 2021 / Published: 10 November 2021

Abstract

:
Since the COVID-19 pandemic, airlines worldwide have enforced strict travel restrictions, driving passengers to seek alternative transportations such as High-Speed Railway (HSR). Nevertheless, the current understanding of HSR travelers’ behavior is scarce. Moreover, despite the extensive application of the Theory of Planned Behavior (TPB) to explain and predict patrons and tourists’ behavior in the tourism and hospitality context, little research has employed this theory to examine HSR travelers’ processes in making travelling decisions. This study developed a research model by integrating perceived quality into the TPB and examined the relation between HSR passengers’ service quality and intention to travel in the future and the mediating effect of TPB attributes. It is found that perceived train service quality and perceived travel quality have a significant influence on the TPB attributes, which further influence HSR travelers’ travel intention. This study contributes practical implications to destinations and the travel industry that they might attract visitors by marketing the corresponding HSR train service quality and travel experience quality. This also provides recovery guidelines for the transportation and travel industry after the COVID-19 pandemic.

1. Introduction

The introduction of High-Speed Railways (HSR) during the second-half of the twentieth century was one of the most significant technological revolutions in transportation. Japan introduced HSR first in 1964, followed by Italy, France, Spain, the UK, South Korea, Taiwan, Turkey, and China. Since their introduction, much attention has been paid to HSR as an alternative mode of transport to promote tourism for the following reasons: reduced traffic congestion; improved air quality; travel time and cost savings; increased connectivity within regions; and improved accessibility to smaller cities [1]. As a latecomer, China began to operate HSR in 2008. With the government’s substantial financial investment and policy support, China’s HSR network reached a total length of 29,000 km and connected 30 of 33 provincial-level divisions that covered 90% of the country’s population by the end of 2018; further, the government plans to expand its network to 38,000 km by 2025 [2]. As a result, HSR in China has become the dominant mode of transport for trip distances less than 1000 km [3]. Its network’s rapid expansion has become a critically integral part of tourism growth, destination development, and spatial tourism evolution in China [4,5], and this grid-like transportation network’s development will have a significant effect on travel patterns and new forms of tourism products and services [6,7].
Unlike consumer behavior studies of low-cost airline carriers, consumer behaviors in the HSR context have received less scholarly attention despite its influence on travel patterns [8], economic development, tourist arrivals, and sustainable tourism [9,10,11], spending [7,12,13], and environmental issues [14,15]. As expected, most existing studies have focused heavily on its effects on economic and environmental issues. Cheng and Deng’s study [16] is rare, in that it examined service quality’s effect on satisfaction and satisfaction’s mediating effect between service quality and perceived value in the HSR context. Several researchers have investigated consumer behavior in the context of low-cost airlines by examining the relation between perceived service quality, behavioral intention, and actual behavior, as well as attitude’s mediating effect [17]. Unfortunately, there are few such studies in the HSR context. Therefore, it is timely to explore tourists’ behavior better when they use HSR to travel.
Ajzen and Fishbein’s [18] psycho-social theory, the seminal Theory of Planned Behavior (TPB), is a well-studied and widely applied research model used to explain and predict patrons and tourists’ behavior in the tourism and hospitality context. In the TPB, attitude (ATT) and subjective norm (SN), as well as perceived behavioral control (PBC), can predict behavioral intentions (BI) [19,20]. However, little research has employed this theory to examine HSR travelers’ behavioral intention. Thus, this study integrates service quality into the TPB to explain travelers’ intention to use HSR in future and explore the relation HSR passengers’ service quality and intention to use in future and the mediating effect of TPB attributes—ATT, SN, and PBC.

2. Literature Review

2.1. HSR and Tourism

HSR refers to a fast transport model that typically reaches speeds of 200–250 km/h. With integrated rolling stock and dedicated track, HSR’s speed is significantly higher than traditional trains (generally less than 160 km/h: [21]. HSR’s early history dates back to the “bullet train” (Shinkansen in Japanese), which was able to reach a speed of 210 km/h [21]. However, after the HSR was established first between Tokyo and Osaka, HSR networks began to spread worldwide in countries such as France, Germany, Italy, South Korea, Spain, and China [22,23,24].
Studies in the tourism domain have focused on the HSR’s effects (e.g., accessibility and mobility) on the tourism industry from different perspectives (e.g., [11,23,24,25,26]. HSR’s economic effects have been a significant focus on these studies (e.g., [25,27]). For instance, Gao et al. [25] studied HSR’s influence on tourism growth (e.g., revenue per arrival) from 2004 to 2015. Similarly, Shaw et al. [27] examined the changes in travel time, cost, and distance accessibility during different developmental stages in China. In addition, some studies have investigated the changes in tourists’ behavior patterns (e.g., [24]). For example, Wang et al. [24] examined the characteristics of tourists’ spatial patterns before and after the HSR network’s introduction. Moreover, studies have also investigated HSR services’ influences on travelers (e.g., [21]). In particular, Pagliara et al. [26] examined HSR’s effects on tourists’ choice and found that HSR that connected urban centers with neighboring cities affected Madrid’s choice of tourism purposes. More recently, Albalate et al. [22] studied its effects on local tourism compared to several Spanish cities and found that the effect was weak or restricted to larger cities.
As such, previous studies on HSR in the tourism field have largely considered a transport model that increases destination accessibility and tourist mobility, which further increases tourism economic activity. However, limited studies have examined its direct effects on tourists. Specifically, previous literature has neglected to address why tourists choose HSR when they travel, as well as the underlying factors that influence their decision-making process. Therefore, the current study applied a widely-used framework, the theory of planned behavior (TPB), by inserting critical perceived two aspects in HSR quality, namely, perceived service quality (e.g., convenient, and safe, etc.) and train quality (closer to destination, and spending less time, etc.). Quality dimensions that reflect the context of HSR, and antecedents that reflect the general human influential factors in the TPB, were put together as independent constructs. The behavioral intention was set as a dependent construct. Additionally, some moderating variables (e.g., gender, age, and travel distance) were also examined to present a more insightful understanding of the proposed research model.

2.2. Theory of Planned Behavior

TPB has three predictors: ATT, SN, and PBC. The first predictor of intention is ATT, which refers to how a person evaluates performing a specific behavior favorably [20]. Individuals are likely to have a positive ATT when the outcomes of engaging in a particular behavior are beneficial [20]. SN’s second predictor refers to the perceived social pressure to perform a specific behavior [20]. For example, individuals tend to accept others’ opinions (e.g., friends, family, colleagues, etc.) when they engage in a specific action. The last predictor, PBC, refers to confidence in one’s ability to perform a particular behavior [20]. As such, the TPB framework, and the relations among its constructs, have been tested empirically in many contexts.
The TPB is open to alteration and extension with new constructs by modifying the current causal relations when the new proposed model contributes to a more significant proportion of the total variance in people’s formation of a BI [20]. A number of studies to date have extended the TPB to various contexts, including tourism and hospitality. Some examples include leisure activities [28], destination choice [29,30], festival visits [31], tourism information adoption (e.g., [32]), lodging [33], tourists’ civilized behaviors [34] and environmental behaviors [24,35]. In the context of service, Shaaban and Maherr [36] have applied the TPB to predict the use of public transportation services. Moreover, Vesci and Botti [37] have investigated the role of festival quality (i.e., food/beverage, staff, and information) by extending the TPB. The previous studies have supported that TPB could be utilized with situational constructs as a rigorous and general model. The earlier applications within the service context also implied there is a possibility by inserting service quality-related factors.
While TPB has been examined extensively in tourism and hospitality, few studies have employed it in the context of tourism transportation specifically. Some exceptions include Kaplan et al. [38], who investigated bike-sharing’s use for holiday cycling with the TPB framework. They found that tourists have stronger cycling intentions when they have stronger attitudes and norms toward cycling. Another study Fu and Juan [39] conducted used the TPB framework to investigate public transit use. However, rather than linking tourists’ travel intention with the transportation mode, they focused on the general public’s intention to use public transit.
Given this theoretical background, this study extends the TPB by adding new constructs to validate tourists’ intention to use HSR transportation. In particular, the perception of HSR’s quality (PQ) was added, as this construct plays critical roles in tourists’ decision-making process when they choose HSR as a mode of transportation. This perceived quality includes two components: perceived service quality (e.g., convenience, and safety, etc.) and train quality (closer to destination, and spending less time, etc.), which have been viewed as the significant factors that lead consumers to choose HSR [40]. In addition, PQ has been proven as a critical antecedent to consumers’ perceptions, customer satisfaction, or behavioral intentions.
The proposed model is presented in Figure 1 and is used to examine the relation between HSR’s PQ and HSR tourists’ BI.
Ajzen and Madden [41] developed the TPB from the Theory of Reasoned Action (TRA), and it can be applied to interpret human behavior, which not only individual will determines, but other factors as well. As stated previously, the basic TPB model includes three dimensions: ATT, SN, and PBC. ATT reflects individuals’ positive or negative evaluations of people, things, or behaviors. SN refers to the perception of social pressure, i.e., the total surroundings’ influence on individuals’ decisions. Finally, PBC refers to the perception of the difficulty of performing an act, for example, the conditions required to achieve a certain behavior, such as time, money, and energy.
This theoretical model is used to examine the relation between HSR tourists’ PQ and their BI. Based on TPB, our model examines the effects of ATT, SN, and PBC on BI, and assumes a mutual influence among them. Concerning other study designs, this study introduces the PQ, and believes that it can influence ATT, SN, and PBC, and further influence tourists’ BI.

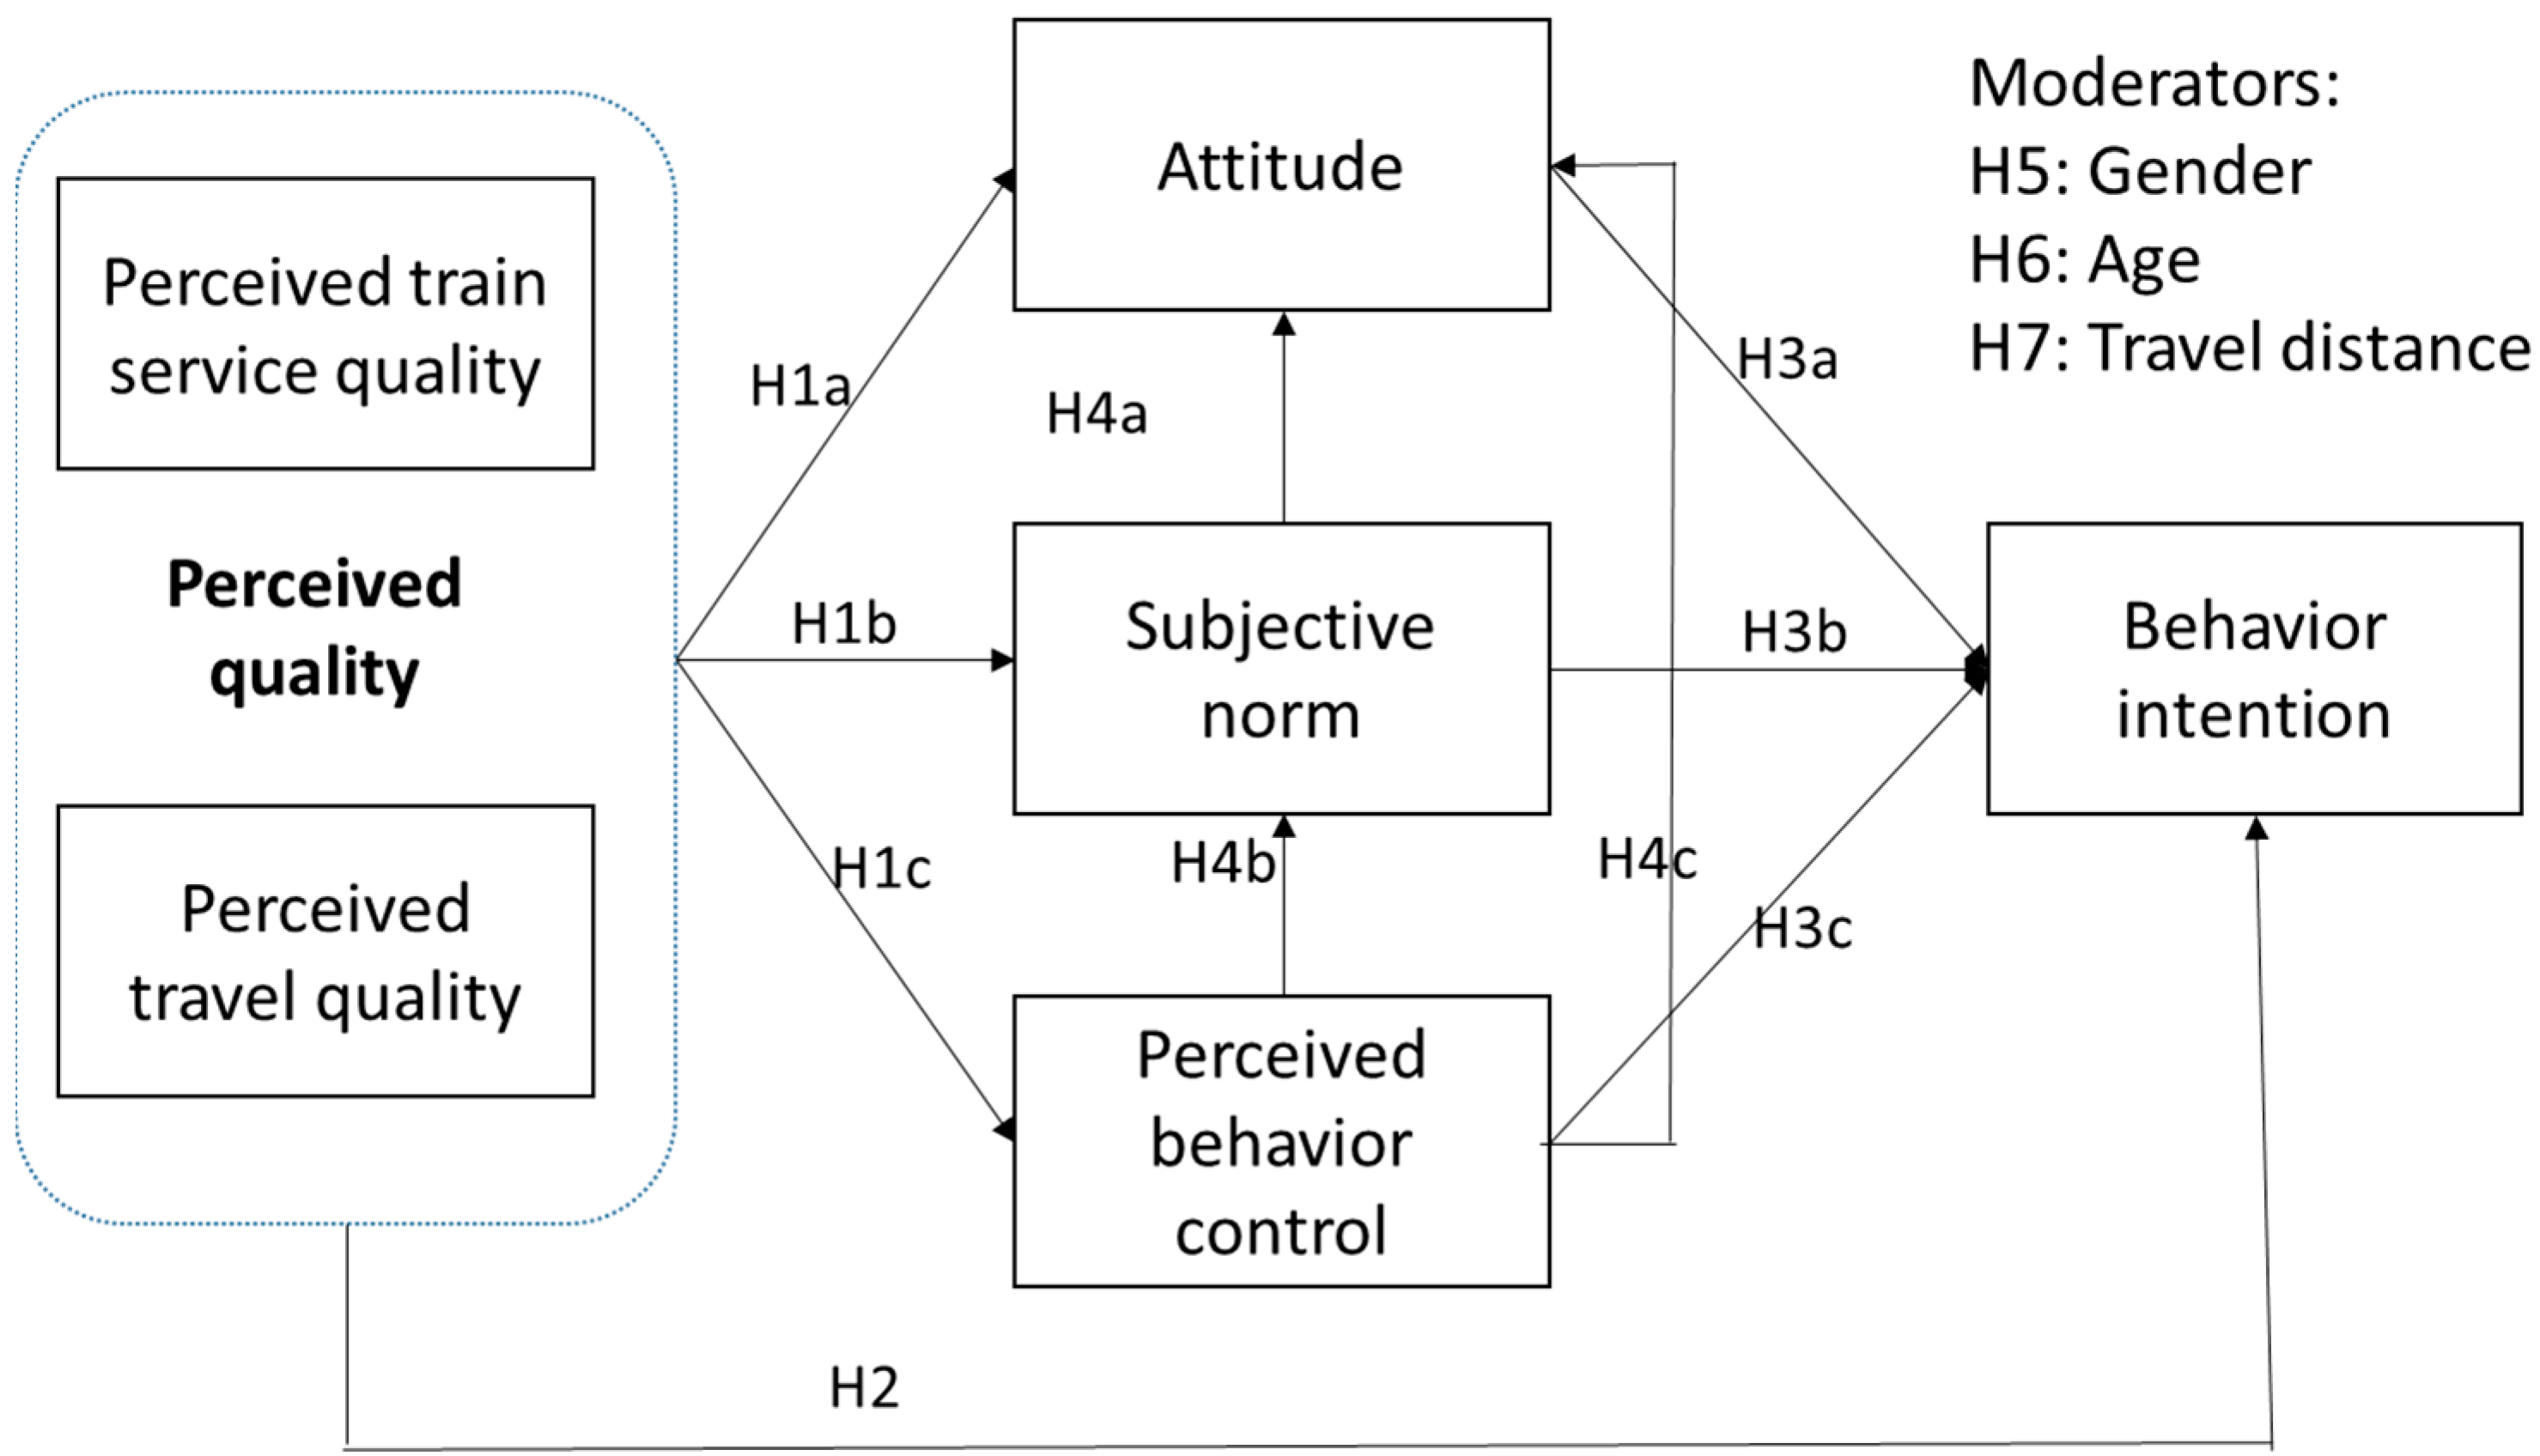
2.3. Perceived Service Quality and the TPB Attributes (ATT, SN, PBC, and BI)

Perceived service quality has been a popular construct in the service literature. It refers to cognitive judgments of the service’s attributes [42,43], and has been proven to be a critical indicator of consumers’ perceptions (e.g., [44]), customer satisfaction e.g., [45], or behavior intentions e.g., [46].
The relations between TPB and service quality are not novel. For instance, Han and Kim [47] revealed that service quality was a significant predictor of ATT and BI in the hospitality sector. This is consistent with the natural logic that when consumers perceive better service quality, their ATT toward this service should be better. Similarly, when consumers perceive that a service is higher quality, their subjective norms are likely to be stronger, as family and friends would be more likely to support them. This applies to their perceived behavioral control as well, as better service quality might encourage consumers’ to use this service. Therefore, it is reasonable to propose that HSR’s perceived quality has a positive influence on ATT, SN, PBC, and BI. Accordingly, this study proposed the following hypotheses:
Hypothesis 1a (H1a).
PQ has a positive effect on ATT.
Hypothesis 1b (H1b).
PQ has a positive effect on SN.
Hypothesis 1c (H1c).
PQ has a positive effect on PBC.
Hypothesis 2 (H2).
PQ has a positive effect on BI.
Previous studies have provided enormous support for the relations among the TPB constructs e.g., [20,38,39]. Specifically, Kaplan et al. [38] employed TPB to investigate bike-sharing services in the service and transportation field. Their results indicated that all TPB constructs were significant predictors of BI. In addition, Fu and Juan [39] also indicated that ATT, SN, and PBC are antecedents of BI in the context of public transit. Accordingly, the following hypotheses among ATT, SN, and PBC in HSR were proposed:
Hypothesis 3a (H3a).
HSR tourists’ ATT has a positive effect on their BI.
Hypothesis 3b (H3b).
HSR tourists’ SN has a positive effect on their BI.
Hypothesis 3c (H3c).
HSR tourists’ PBC has a positive effect on their BI.
Ajzen studied the potential mutual relations among ATT, SN, and PBC. When an individual perceives that familiar references have a particular SN, they may re-evaluate the decision to engage in a certain behavior, such that SN would exert an influence on ATT. In addition, when an individual perceives that the resources (e.g., time, money, etc.) necessary for a certain action are unavailable, they are less likely to be motivated to perform the behavior, and also more likely to be influenced by others in the society. Thus, PBC influences both ATT and SN positively. Previous studies have examined the causal relation between SN and ATT empirically [47,48,49]. In a service context, Ryu and Jang [48] indicated that SN is related to individuals’ ATT toward a behavior, while Han and Kim [47] also verified that SN influences ATT in a hospitality context. Given the evidence, this study proposed the following hypotheses:
Hypothesis 4a (H4a).
HSR tourists’ SN has a positive effect on ATT.
Hypothesis 4b (H4b).
HSR tourists’ PBC has a positive effect on SN.
Hypothesis 4c (H4c).
HSR tourists’ PBC has a positive effect on ATT.

2.4. Moderating Effects: Age, Gender, and Travel Distance

To the best of our knowledge, gender and age are important demographic moderators that previous research has explored. For example, Branscum and Sharma [50] found that gender moderated the relations among TPB constructs in snack food consumption. Similarly, Lien et al. [51] used the TPB model and demonstrated that men and women consume fruits and vegetables differently. In the context of technology adoption, Morris, Venkatesh, and Ackerman’s [52] empirical study revealed that gender moderated the relations among ATT, SN, PBC, and BI significantly. Gender role theory also suggests that males and females develop different skills and ATTs that lead to different behaviors because of the different roles they play within social structures [53]. Thus, the following hypothesis is proposed based on the literature aforementioned:
Hypothesis 5 (H5).
Gender moderates the relationship among TPB constructs (i.e., ATT, SN, PBC, and BI).
Age is also an important social characteristic that influences various aspects of life, such as job promotions [54,55], technology adoption [52], and learning ability [56], among others. McDermottet al.’s [57] meta-analysis also demonstrated that their participants’ age moderated the relations among the TPB constructs. Further, research has shown that as age increases, behaviors that require combined cognitive processing ability decrease. Incorporating this within the HSR context, it may be possible that ATT, SN, and PBC lead to different BI depending upon age. Accordingly, based on the research above, H6 is proposed, in which age is treated as a moderator:
Hypothesis 6 (H6).
Age moderates the relations among TPB constructs (i.e., ATT, SN, PBC, and BI).
Travel distance’s moderating effect is tailored to the HSR context. Previous research has shown that people hesitate to take railway transportation to distant destinations (e.g., [58]). Specifically, Cheng [59] revealed that long-distance travelers are more anxious about taking trains. In the HSR context, it is proposed that ATT, SN, and PBC have stronger influences on longer distance travelers’ BI. Therefore, based on previous studies’ evidence, we proposed:
Hypothesis 7 (H7).
Travel distance moderates the relations among TPB constructs (i.e., ATT, SN, PBC, and BI).

3. Methodology

3.1. Measurement Instrument

To examine HSR tourists’ BI, our questionnaire was designed with three sections. The first section contained eight questions that collected respondents’ basic demographic characteristics, such as gender, age, income, and occupation. The second section included the measurements for the main constructs that were answered on a 5-point Likert scale (1 = Strongly disagree and 5 = Strongly agree). Details of each constructs are available in Table 1. Items for each construct were adopted from previous studies. For example, Parasuraman, Zeithaml, and Berry [44] measured service quality through timing, experiential, spatial, and safety values. Because of their appropriate association with service quality in HSR, 10 items were adopted to measure PTQ and PSQ in the HSR context. With respect to the TPB section, five items from Ragheb and Beard [60] were adopted to measure ATT, as this has been applied in multiple settings to explore consumers’ ATT. Park’s [61] 5 items of SN were adopted in the HSR setting, as its measurement items are consistent with our definition of SN. Items for PBC were adopted from Ajzen [20] and included five items that examined participants’ PBC in using HSR to travel. Lastly, Boulding et al. [44] used 3 items to measure BI, which were adopted in this study based on their successful application in previous research. The last section of the questionnaire consisted of questions that explored the role HSR plays in tourists’ travel decisions. This included the trip’s duration, travel distance, travel time, etc.
An English version of the questionnaire was developed first based on previous studies and then pretested with 20 graduate students in a Chinese university to ensure validity. Some wording and question sequences were amended before the instrument was translated into Chinese with the back-translation method [62,63], which is known to be a translation quality control method that ensures that the translation used is consistent with the original text. Therefore, five additional tourist behavior researchers who were fluent in both languages were invited to review both the English and Chinese versions before the questionnaire’s final distribution.

3.2. Data Collection, Sampling, and Description of the Respondents’ Characteristics

The high-speed train stations in Xiamen, Fuzhou, and Quanzhou in Fujian Province, China were selected through convenience sampling, which was employed to recruit the survey participants. These locations were chosen given the authorized access to these stations. Two hundred fifty passengers were approached as randomly as possible in each station’s waiting area during the two-week survey period in summer 2019. A total of 600 questionnaires were distributed, and 503 completed questionnaires were returned, for a response rate of 83.9%. In addition, 97 respondents who did not complete the survey were excluded from the data analysis.
The majority of the respondents were male (59.2%), and the age group was significantly young, in which 69.4% were under the age of 30, while 16.9% were between 31 and 40, 9.9% were between 41 and 55, and only 2% were older than 55 years. This is reasonable, as younger people may be more willing to try HSR. Most respondents were highly educated, and 76.1% had at least a college/university education. Further, the majority were middle-income earners, worked full- or part-time (71.0%), and had a monthly income between RMB 3001 to 5000 (29.4%). Unsurprisingly, 75.7% lived in a city with an HSR station, while only 5.6% lived in a city with no nearby HSR station.

4. Results

4.1. Factor Analysis

As PQ is a multi-dimensional construct (PSQ and PTQ), an exploratory factor analysis (EFA) was implemented to determine its appropriate dimensions. All 10 items were included in the initial principal component analysis (PCA). The results showed that the two dimensions (PSQ and PTQ) were distinct, with no item cross-loading. One item was removed because of low factor loading (<0.40), and the total variance explained was 55.28%. KOM and Bartlett’s test showed that the measure of sampling adequacy was 0.86 (p < 0.001), indicating that the study sample was acceptable [64]. A K-S test was conducted to examine the distribution’s normality, and the result demonstrated a normal distribution (p = 0.001, n = 503). Table 2 below shows the two dimensions of PQ and their corresponding items. The first dimension is PTQ. Results of the EFA had an eigenvalue of 1.14 that explained 12.67% of the variance in PQ. PSQ was the second dimension with an eigenvalue of 4.13 that explained 45.92% of PQ variance.
Based on the EFA findings, a confirmatory factor analysis (CFA) was conducted to examine the data’s reliability and validity (Table 1). All factor loadings were above the acceptable cut-off value of 0.40 [65]. The Composite Reliability (CR) values ranged from 0.72 to 0.89, and according to Churchill [66] and Hair et al. [65], a CR value of 0.70 or higher demonstrates good reliability.
Discriminant and convergent validity were also tested (Table 2). Two criteria have been used to determine whether constructs demonstrate discriminant validity. Firstly, according to Fornell and Larcker [67], when the square root of the average variance extracted (AVE) from a construct (shown in italics in Table 2) is larger than the correlations shared between the construct and other constructs in the model, then these constructs are discriminable from each other. Secondly, Hair et al. [68] suggested that when both the maximum shared variance (MSV) and average shared squared variance (ASV) are lower than all constructs’ AVE, discriminant validity is established among these constructs. Therefore, based on these two criteria, discriminant validity among the constructs was achieved.
Moreover, based on Hair et al.’s [65] recommendation, when all AVE values are above 0.50, each construct demonstrates convergent validity. As shown in Table 3, all values of AVE were above 0.50 except that for PTQ. Accordingly, there were no concerns about discriminant or convergent validity in this study.
The CFA results showed satisfactory goodness-of-fit indices: χ2 = 738.06 (p < 0.001), df = 305, χ2/df = 2.42 (<3), the goodness of fit index (GFI) = 0.90 (>0.90), the adjusted goodness of fit (AGFI) = 0.88, the normed fit index (NFI) = 0.90, the incremental fit index (IFI) = 0.94 (>0.9), the comparative fit index (CFI) = 0.94 (>0.9), and the root mean square error of approximation (RMSEA) = 0.05 (<0.08).

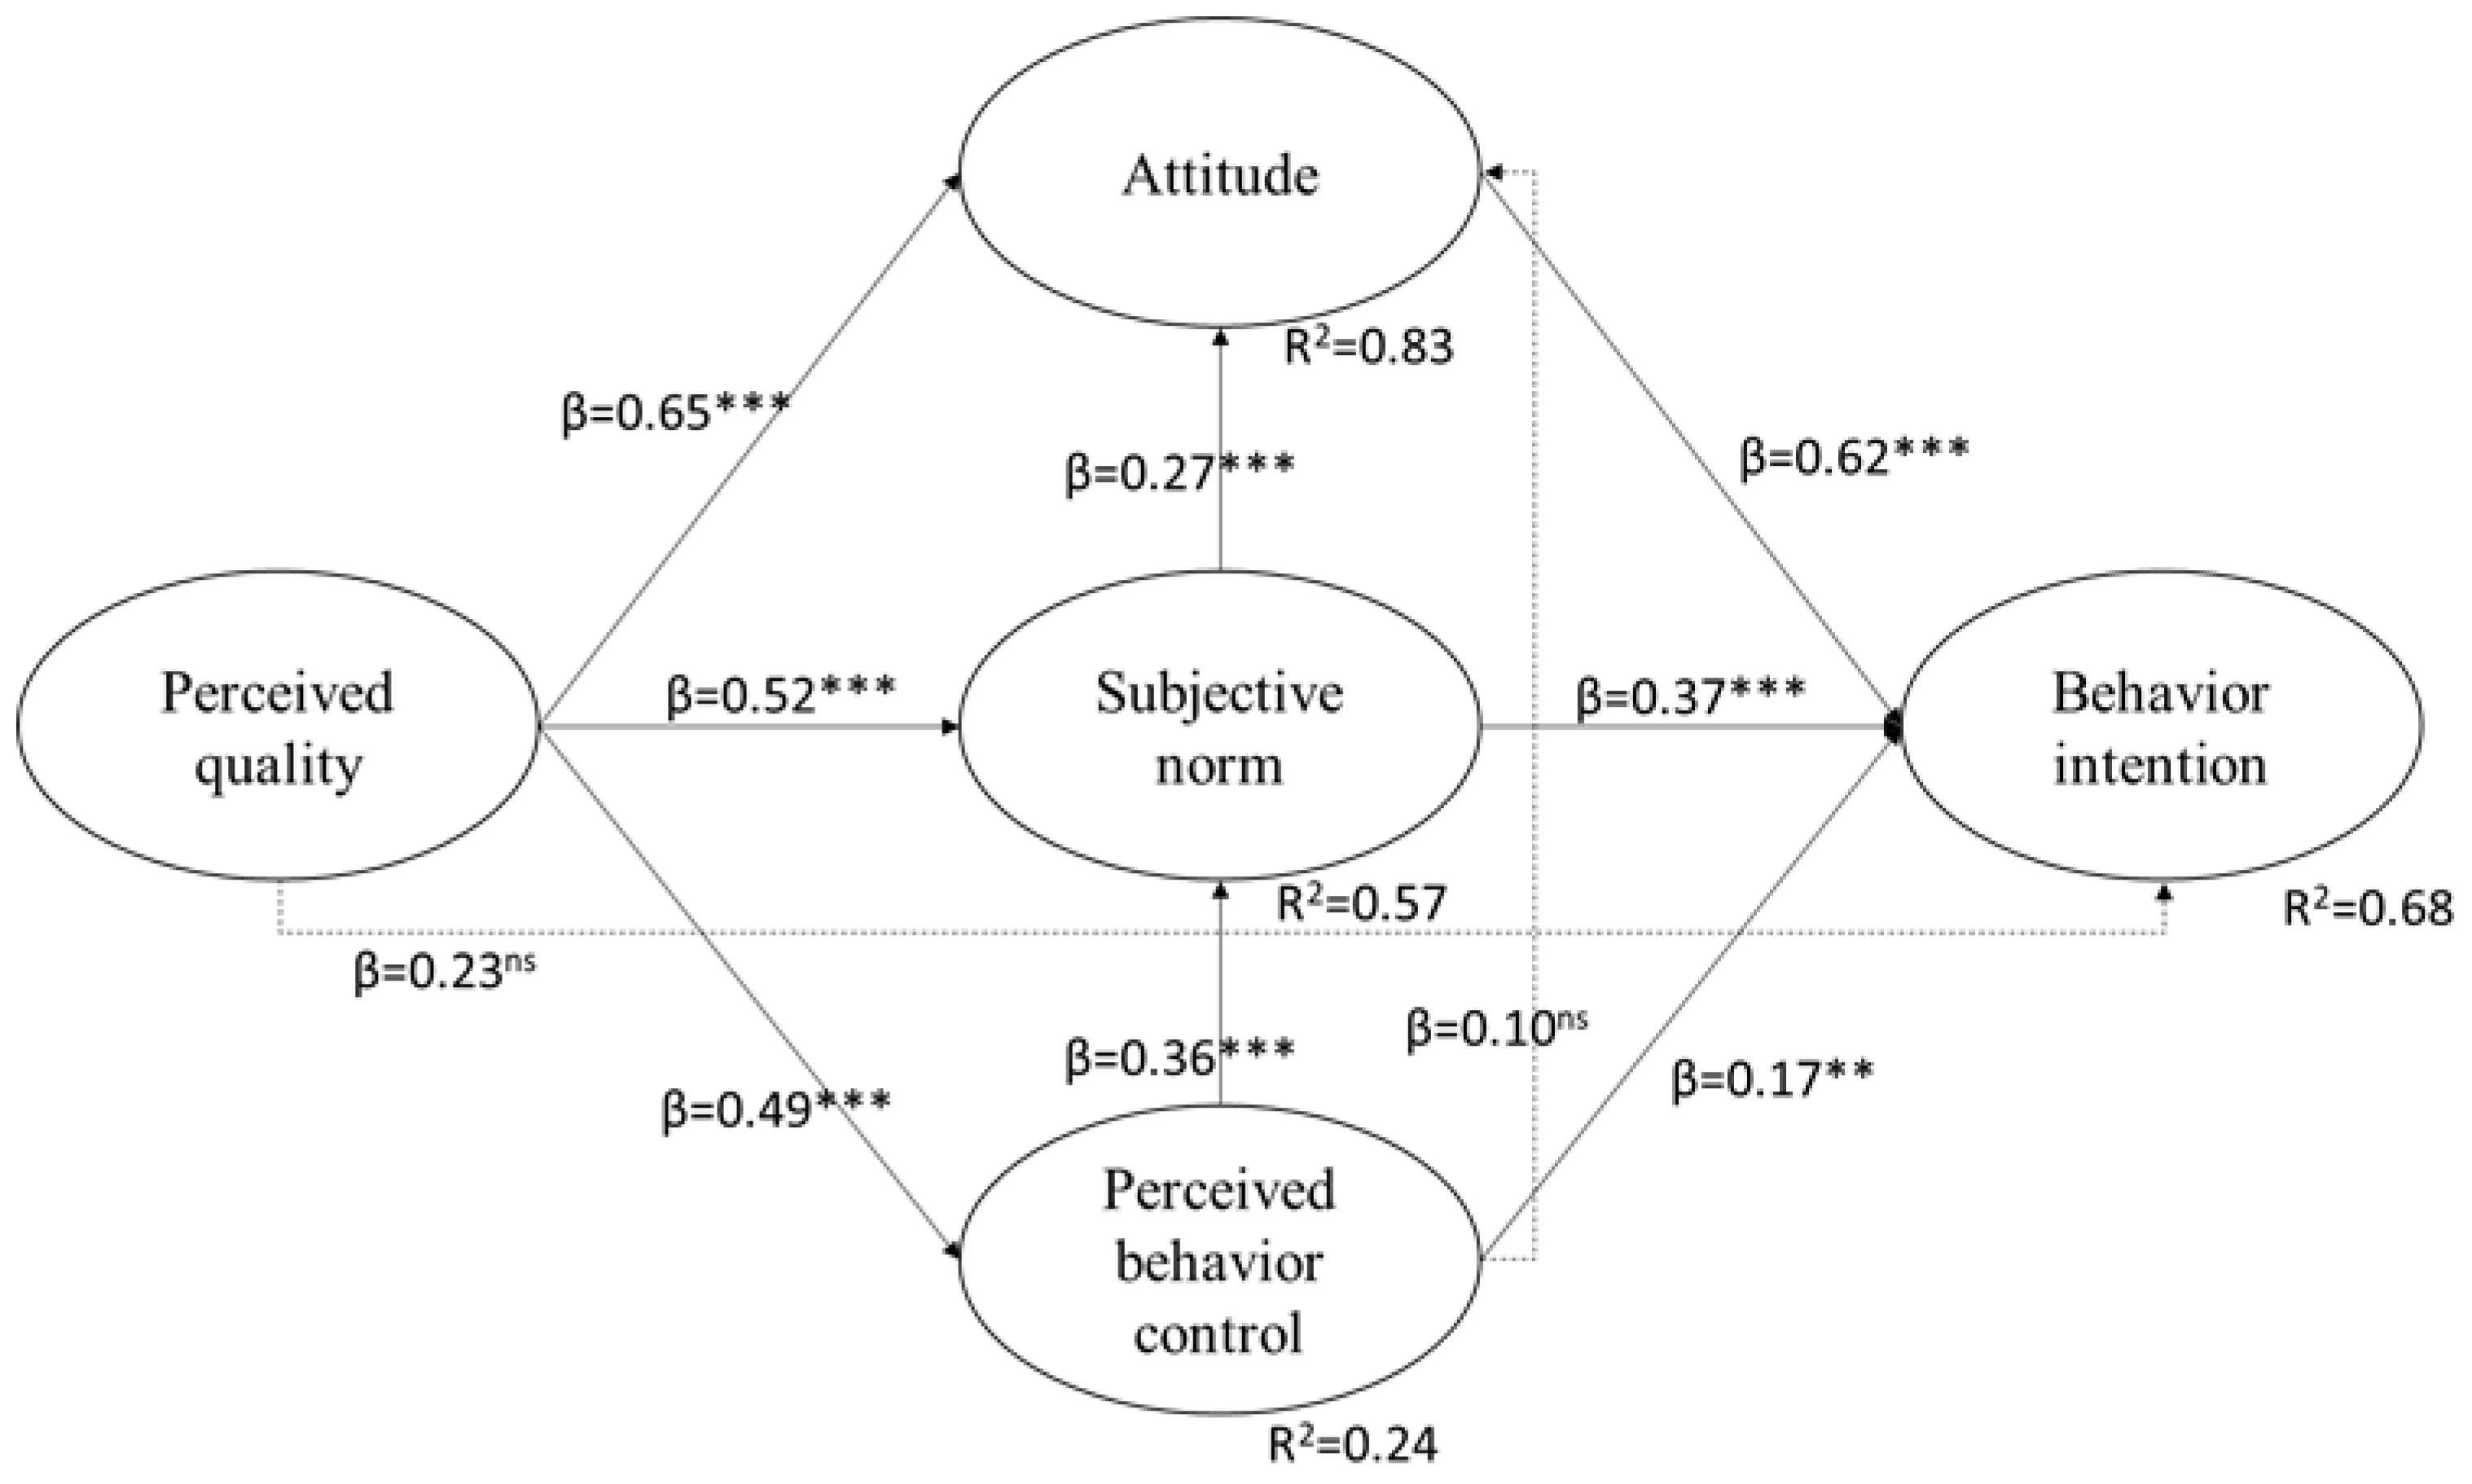
4.2. Structural Equation Modeling Analysis

Following Anderson and Gerbing’s [69] two-step approach, a second-order structural equation modeling (SEM) analysis was conducted after the CFA, which is designed to examine the proposed structural relations among constructs. Figure 2 shows the results of the SEM analysis for the structural model, in which the goodness-of-fit indices demonstrated an excellent model fit: RMSEA = 0.05, below the excellent criteria of 0.06 [65]. The χ2/df ratio = 2.20 (χ2 = 473.42; df = 215), is below 3, which Bentler [70] suggested is an excellent fit. GFI = 0.93, CFI = 0.96, NFI = 0.92, and IFI is 0.96, all of which are above Hu and Bentler’s [71] suggested value of 0.90.
Each proposed relation’s standardized regression coefficients are also shown in Figure 2. All hypothesized relations among the constructs were supported significantly except for PQ→BI (H2) and PBC→ATT (H4c). Specifically, the perception of HSR value had significant influences on ATT (β = 0.65, p < 0.001), PBC (β = 0.49, p < 0.001), and SN (β = 0.52, p < 0.001), but no significant effect on BI (β = 0.23, p = 0.16). As we predicted, PBC affected SN significantly (β = 0.36, p < 0.001) and SN influenced ATT significantly (β = 0.27, p < 0.001). However, PBC did not affect ATT directly (β = 0.10, p = 0.06). This indicated that PBC had only an indirect relation with ATT through SN in the HSR context.
ATT influenced BI (β = 0.62, p < 0.001), SN (β = 0.37, p < 0.001), and perceived behavior (β = 0.17, p < 0.001). At the same time, the squared multiple correlation (R2) for BI was 0.68, indicating that ATT, SN, and PBC explained 68% of the variance in BI. This validated the relations TPB proposes empirically. 83% of the variance in ATT could be attributed to PQ and SN, which indicates that tourists’ perception of HSR’s value and SN determined a large portion of their ATT toward using the HSR. Similarly, tourists’ PQ explained 57% of the variance in SN and their PBC and PQ explained 36% of the variance in PBC.

4.3. Moderation Analysis

There are multiple ways to analyze a moderation effect; for example, the subgroup analysis Sharma, Durand, and Gur-Arie [72] suggested, hierarchical regression analysis, as Dawson [73] recommended, moderated multiple regression (MMR: e.g., [74]), and multi-group moderation analysis, as Little et al. [75] proposed. However, using regression analysis techniques to determine the interaction effects between variables has low power attributable to the lack of control of measurement errors [76]. Therefore, this study used the multi-group moderation analysis method to test the moderating effects with SEM via Amos v.25.0.
The study focused on investigating the moderating effects of gender, age, and travel distance on the relations among BI and its antecedents (i.e., ATT, SN, and PBC). As shown in Table 4, the multi-group moderation analysis demonstrated that gender moderates the relation between ATT and BI (p = 0.04). Specifically, ATT’s effects on BI were significantly stronger for males (β = 0.53) than females (β = 0.48). Nevertheless, gender was found to be a non-significant moderator of the relation between both SN (p = 0.24) and PBC (p = 0.73) in BI.
Following similar procedures, age was found to be a moderator at the model level (p = 0.02). Specifically, ATT’s effect on BI was significantly stronger (p = 0.01) when participants were older (β = 0.72) than younger (β = 0.66). However, when participants were older, SN (β = 0.31) and PBC’s (β = 0.16) influence on BI was significantly less than when participants were younger (βSN = 0.33; βPBC = 0.17).
Lastly, the interaction effects between ATT/SN and travel distance on consumers’ intention to travel via HSR were not significant (p = 0.17 and 0.87), indicating that the relation between ATT/SN and BI did not differ significantly when the travel distance was shorter or longer than 1000 km. However, a significant interaction between PBC and travel distance was found on consumers’ intention to travel via HSR (p < 0.05). This indicates that PBC’s influence on BI is significantly stronger when the travel distance is greater than 1000 km (β = 0.44) compared to when it is less than 1000 km (β = 0.28).

4.4. Hypothesis Validation

Among the 13 hypotheses proposed, 9 were statistically significant. Only H2, H4c, H5, and H7 were not supported. The detailed results are shown in Table 4. They indicate that tourists’ perception of HSR influences their BI indirectly only through their ATT, SN, and PBC. This suggests that HSR tourists’ perception of HSR’s value might not change their BI directly, but only when their ATT, SN, and PBC change. Similarly, HSR tourists’ ATT was not affected directly through their PBC, but could be influenced indirectly by PBC through SN. All other hypotheses were found to be significant, and thus supported the proposed theoretical foundation.

5. Discussion and Implications

Relatively little research has focused on train passengers’ travel intention. This study investigated the subject to provide insight and understanding of train passengers’ intention to visit a destination via HSR by adding an essential quality construct into the TPB model: perceived service and travel quality. This extended TPB model was examined using a two-step SEM approach, and the study found that the model was supported strongly. In particular, the study results showed that the TPB’s three key constructs (ATT, PBC, and SN) played strong partial mediating roles between travel intention and perceived travel and service quality. Nine of the 13 proposed hypotheses in the study model were supported. Age played a strong moderating role between the TPB constructs and travel intention, while gender played a moderating role between ATT and travel intention, and travel distance has a moderating effect between perceived behavioral control and travel intention as well. In short, this study accomplished its objectives.
The study has several theoretical implications. First, to the best of our knowledge, it may be the first to link service aspects of train tourism to the TPB. Although previous studies have already discussed the service aspects, most were based on a general model (e.g., SERVQUAL). In this sense, the study of a specific context, such as HSR, was ignored. As previous studies may not have been sufficient to examine particular contexts, this study clarified the exact dimensions (i.e., perceived train and travel quality) in the HSR context for tourism purposes.
The results indicated that perceived quality has a positive effect on three constructs of TPB, which demonstrates that perceived quality has an indirect influence on the intention to HSR travel. Thus, adding this construct in the study and proposing additional relations beyond the traditional TPB models provided sufficient incentive for the behavioral intention. This extended TPB model with additional interrelated hypotheses improves our understanding of train travelers’ behavioral intention. Second, as hypothesized, SN and PBC had significant influences on ATT. This finding indicated that the three TPB antecedents were interrelated. Scholars have argued that a possible link between these three constructs in the TPB should be considered in different contexts [47,48,49]. Third, this study demonstrated that normative factors (i.e., SN) play a mediating role between attitudinal factors (i.e., ATT) and external constraints (i.e., PBC). To alter individuals’ attitude toward using HSR, strategies could be designed first to enhance their confidence in overcoming external constraints and then followed by strategies to increase SN. Accordingly, the causal relations among the three TPB predictors provided the order of priority in its influential factors and deepened our understanding of the mechanism by which intentions are formed.
The three TPB predictors’ (i.e., ATT, SN and PBC) mediating role between service quality and BI were noteworthy. The association between service quality and intention has been much discussed through the mediating role of satisfaction in the tourism and hospitality context (e.g., [77]). However, the effects of ATT, SN, and PBC have been seldom explored as validated mediators in an HSR context. Thus, our study has provided a relatively new perspective on intention formation in the HSR context.
Finally, critical demographic and geographic variables’ moderating roles were identified in the study. Gender, age, and travel distance were found to be significant moderators in the proposed research model. For many academic researchers, the type of group, and the extent to which they are willing to use HRS to a tourism destination, have always been of interest. Therefore, these variables were instrumental when we attempted to obtain a comprehensive understanding of the intention to use HSR.
This study’s results show that perceived train service and travel quality have positive indirect effects on travel intention via various paths (PQ→PBC→SN→ATT→BI; PQ→SN→ATT→BI; PQ→ATT→BI). From a practical standpoint, the findings indicated that HSR marketers should provide excellent quality train-related services and additional service to passengers regarding their travel destination’s attributes, time of arrival, speed of travel, and relative speed of travel compared to other transportation modes. Further, passengers expect a higher quality of ground and onboard services, including ticketing and its process, customer service in which passengers are greeted warmly, and their inquiries are answered, and a safe and secure environment, both psychologically and physically. Thus, both marketers and managers ensure that their service exceeds passengers’ service expectations and they maintain the service reliability standard. These continuous efforts can help contribute to increased revenue, and new passenger acquisition, as well as the HSR brand’s reputation in China.
Since both travel quality and service quality are critical components of the overall quality of train tourism, practitioners should distinguish the tourists of train tourism and general train customers. For individuals whose purpose is tourism, the benefits of fast speed with HSR should be strengthened. Time-saving, which means more chances for tourism experience and interaction in destinations, should be informed. Spending less time, which means the sound state to participate in tourism activities when they get off the train, should also be perceived by tourists. By creating the perception that HSR a great help and convinces to travel, tourists are more likely to perceive the HSR as a high-quality transportation mode.
The study results indicated that SN has the second most substantial effect on travel intention, and its influence is both direct and indirect (SN→ATT→BI). Given this finding, social support encourages passengers to use a train as a safe mode of travel directly and indirectly via ATT. Further, SN influenced older travelers more strongly. Hence, marketers need to further investigate how social support includes family, friends, and/or the travel agency and promote their essential information about train travel experiences via various channels.
This study contributes to the existing literature by developing and examining a model that explores the relations among perceived quality, ATT, SN, PBC, and BI in the HRS context. While caution was taken in designing and conducting the study, the following limitations were identified. Firstly, because of the stations’ availability, the data were collected in only three high-speed railway stations. This may affect the ability to generalize the data geographically. Future studies could apply this model to another geographic location with different high-speed railway stations to increase generalizability.
Further, because of constraints inaccessibility to the sample, this study used a non-random sampling method. Future research should consider a probability sampling approach. Schreuder, Gregoire, and Weyer [78] indicated that using a probability sampling approach could better represent the targeted population. Another limitation of this study is that it examines only the moderating effects of gender, age, and travel distance. Other potential moderators could be cultural background, which has been explored as a moderator extensively in previous studies (e.g., [79]). Third, this study was a paper-based questionnaire and relied on participants to report their personal judgment. It is possible that some answers the participants provided might not have been recalled correctly. Thus, this study should be replicated in similar settings in various regions in China to allow this study’s results to be generalized, at least in part.
Lastly, this model considered only tourists’ behavioral intention. Future studies could examine other key constructs (e.g., self-concept, co-created value, performance quality vs. service scape). Moreover, research on service quality typically examines dependent variables such as satisfaction (e.g., [80,81]). Most recently, the COVID-19 pandemic has impacted the travel industry significantly, and whether that influences tourists’ perception of HSR’s service quality remains unknown. Therefore, future research might explore this domain and compare the relative variance that different dependent variables explain.

Author Contributions

Conceptualization, Z.H., L.J.L. and H.C.C.; methodology, Z.H.; survey questionnaire and data collection, Z.H.; formal analysis, L.J.L.; writing—original draft preparation, L.J.L., B.M. and H.C.C.; writing—review and editing, L.J.L., B.M. and H.C.C.; funding acquisition, Z.H. and H.C.C. All authors contributed to the article and approved the submitted version. All authors have read and agreed to the published version of the manuscript.

Funding

This research received no external funding.

Institutional Review Board Statement

Huang Jian, Deputy director of Huaqiao university confirm that this study does not require ethics review.

Informed Consent Statement

Not applicable.

Data Availability Statement

The raw data supporting the conclusions of this article will be made available by the authors, without undue reservation, to any qualified researcher.

Conflicts of Interest

The authors declare no conflict of interest.

References

  1. Givoni, M. Development and impact of the modern high-speed train: A review. Transp. Rev. 2006, 26, 593–611. [Google Scholar] [CrossRef]
  2. Barrow, K. Ten Years, 27,000 km: China Celebrates a Decade of High-Speed. Int. Rail J. 2018. Available online: https://www.railjournal.com/passenger/high-speed/ten-years-27000km-china-celebrates-a-decade-of-high-speed/ (accessed on 10 January 2020).
  3. Yang, H.; Dobruszkes, F.; Wang, J.; Dijst, M.; Witte, P. Comparing China’s urban systems in high-speed railway and airline networks. J. Transp. Geogr. 2018, 68, 233–244. [Google Scholar] [CrossRef]
  4. Inskeep, E. Tourism Planning: An Integrated and Sustainable Development Approach; John Wiley & Sons: Hoboken, NJ, USA, 1991. [Google Scholar]
  5. Gunn, C.A. Issues in tourism curricula. J. Travel Res. 1998, 36, 74–77. [Google Scholar] [CrossRef]
  6. Prideaux, B. The role of the transport system in destination development. Tour. Manag. 2000, 21, 53–63. [Google Scholar] [CrossRef]
  7. Masson, S.; Petiot, R. Can the high-speed rail reinforce tourism attractiveness? The case of the high speed rail between Perpignan (France) and Barcelona (Spain). Technovation 2009, 29, 611–617. [Google Scholar] [CrossRef]
  8. Sun, Y.Y.; Lin, P.C. How far will we travel? A global distance pattern of international travel from both demand and supply perspectives. Tour. Econ. 2019, 25, 1200–1223. [Google Scholar] [CrossRef]
  9. Chen, C.L.; Hall, P. The impacts of high-speed trains on British economic geography: A study of the UK’s Intercity 125/225 and its effects. J. Transp. Geogr. 2011, 19, 689–704. [Google Scholar] [CrossRef]
  10. Hall, C.M. Reconsidering the geography of tourism and contemporary mobility. Geogr. Res. 2005, 43, 125–139. [Google Scholar] [CrossRef]
  11. Cascetta, E.; Papola, A.; Pagliara, F.; Marzano, V. Analysis of mobility impacts of the high speed Rome–Naples rail link using within day dynamic mode service choice models. J. Transp. Geogr. 2011, 19, 635–643. [Google Scholar] [CrossRef]
  12. Chen, Z.; Haynes, K.E. Tourism Industry and High-Speed Rail—Is There a Linkage: Evidence from China’s High Speed Rail Development (GMU School of Public Policy Research Paper No. 2012–14); George Mason University: Arlington, VA, USA, 2012. [Google Scholar]
  13. Kurihara, T.; Wu, L. The impact of high speed rail on tourism development: A case study of Japan. Open Transp. J. 2016, 10, 35–44. [Google Scholar] [CrossRef]
  14. Andersson, E.; Lukaszewicz, P. Energy Consumption and Related Air Pollution for Scandinavian Electric Passenger Trains; Royal Institute of Technology: Stockholm, Sweden, 2006. [Google Scholar]
  15. Nocera, S.; Cavallaro, F. Policy effectiveness for containing CO2 Emissions in Transportation. Procedia–Soc. Behav. Sci. 2011, 20, 703–713. [Google Scholar] [CrossRef] [Green Version]
  16. Cheng, Q.; Deng, W. Study of factors impacting on passenger satisfaction with high-speed train based on structural equation modeling. In Proceedings of the 19th COTA International Conference of Transportation Professionals, Nanjing, China, 6–8 July 2019. [Google Scholar] [CrossRef]
  17. Buaphiban, T.; Truong, D. Evaluation of passengers’ buying behaviors toward low cost carriers in Southeast Asia. J. Air Transp. Manag. 2017, 59, 124–133. [Google Scholar] [CrossRef]
  18. Ajzen, I.; Fishbein, M. Understanding Attitudes and Predicting Social Behavior; Prentice-Hall: Englewood Cliffs, NJ, USA, 1980. [Google Scholar]
  19. Ajzen, I. Attitudes, Personality and Behavior; Open University Press: Milton Keynes, UK, 1988. [Google Scholar]
  20. Ajzen, I. The theory of planned behavior. Organ. Behav. Hum. Decis. Process. 1991, 50, 179–211. [Google Scholar] [CrossRef]
  21. Cartenì, A.; Pariota, L.; Henke, I. Hedonic value of high-speed rail services: Quantitative analysis of the students’ domestic tourist attractiveness of the main Italian cities. Transp. Res. Part A Policy Pract. 2017, 100, 348–365. [Google Scholar] [CrossRef]
  22. Albalate, D.; Fageda, X. High speed rail and tourism: Empirical evidence from Spain. Transp. Res. Part A Policy Pract. 2016, 85, 174–185. [Google Scholar] [CrossRef] [Green Version]
  23. Pagliara, F.; Mauriello, F.; Garofalo, A. Exploring the interdependences between High Speed Rail systems and tourism: Some evidence from Italy. Transp. Res. Part A Policy Pract. 2017, 106, 300–308. [Google Scholar] [CrossRef]
  24. Wang, C.; Zhang, J.; Xiao, X.; Sun, F.; Xiao, M.; Shi, Q. Examining the dimensions and mechanisms of tourists’ environmental behavior: A theory of planned behavior approach. J. Clean. Prod. 2020, 273, 123007. [Google Scholar] [CrossRef]
  25. Gao, Y.; Su, W.; Wang, K. Does high-speed rail boost tourism growth? New evidence from China. Tour. Manag. 2019, 72, 220–231. [Google Scholar] [CrossRef]
  26. Pagliara, F.; La Pietra, A.; Gomez, J.; Vassallo, J.M. High speed rail and the tourism market: Evidence from the madrid case study. Transp. Policy 2015, 37, 187–194. [Google Scholar] [CrossRef] [Green Version]
  27. Shaw, S.L.; Fang, Z.; Lu, S.; Tao, R. Impacts of high speed rail on railroad network accessibility in China. J. Transp. Geogr. 2017, 40, 112–122. [Google Scholar] [CrossRef]
  28. Ajzen, I.; Driver, B.L. Prediction of leisure participation from behavioral, normative, and control beliefs: An application of the theory of planned behavior. Leis. Sci. 1991, 13, 185–204. [Google Scholar] [CrossRef]
  29. Pahrudin, P.; Chen, C.-T.; Liu, L.-W. A modified theory of planned behavioral: A case of tourist intention to visit a destination post pandemic COVID-19 in Indonesia. Heliyon 2021, 7, e08230. [Google Scholar] [CrossRef] [PubMed]
  30. Yuzhanin, S.; Fisher, D. The efficacy of the theory of planned behavior for predicting intentions to choose a travel destination: A review. Tour. Rev. 2016, 71, 135–147. [Google Scholar] [CrossRef]
  31. Choo, H.; Ahn, K.; Petrick, J.F. An integrated model of festival revisit intentions: Theory of planned behavior and festival quality/satisfaction. Int. J. Contemp. Hosp. Manag. 2016, 28, 818–838. [Google Scholar] [CrossRef]
  32. Meng, B.; Choi, K. Tourists’ intention to use location-based services (LBS): Converging the theory of planned behavior (TPB) and the elaboration likelihood model (ELM). Int. J. Contemp. Hosp. Manag. 2019, 31, 3097–3115. [Google Scholar] [CrossRef]
  33. Tajeddini, K.; Rasoolimanesch, M.; Gamage, T.C.; Martin, E. Exploring the visitors’ decision-making process for airbnb and hotel accommodations using value-attitude-behavior and theory of planned behavior. Int. J. Hosp. Manag. 2021, 96, 102950. [Google Scholar] [CrossRef]
  34. Liu, J.; An, K.; Jang, S. A model of tourists’ civilized behaviors: Toward sustainable coastal tourism in China. J. Destin. Mark. Manag. 2020, 16, 100437. [Google Scholar] [CrossRef]
  35. Panwanitdumrong, K.; Chen, C.-L. Investigating factors influencing tourists’ environmentally responsible behavior with extended theory of planned behavior for coastal tourism in Thailand. Mar. Pollut. Bull. 2021, 169, 112507. [Google Scholar] [CrossRef] [PubMed]
  36. Shaaban, K.; Maher, A. Using the theory of planned behavior to predict the use of an upcoming public transportation service in Qatar. Case Stud. Transp. Policy 2019, 8, 484–491. [Google Scholar] [CrossRef]
  37. Vesci, M.; Botti, A. Festival quality, theory of planned behavior and revisiting intention: Evidence from local and small Italian culinary festivals. J. Hosp. Tour. Manag. 2018, 38, 5–15. [Google Scholar] [CrossRef]
  38. Kaplan, S.; Manca, F.; Nielsen, T.A.S.; Prato, C.G. Intentions to use bike-sharing for holiday cycling: An applica-tion of the Theory of Planned Behavior. Tour. Manag. 2015, 47, 34–46. [Google Scholar] [CrossRef]
  39. Fu, X.; Juan, Z. Understanding public transit use behavior: Integration of the theory of planned behavior and the customer satisfaction theory. Transportation 2016, 44, 1021–1042. [Google Scholar] [CrossRef]
  40. The World Bank. China’s Experience with High Speed Rail Offers Lessons for Other Countries. Available online: https://www.worldbank.org/en/news/press-release/2019/07/08/chinas-experience-with-high-speed-rail-offers-lessons-for-other-countries (accessed on 12 October 2021).
  41. Ajzen, I.; Madden, T.J. Prediction of goal-directed behavior: Attitudes, intentions, and perceived behavioral control. J. Exp. Soc. Psychol. 1986, 22, 453–474. [Google Scholar] [CrossRef]
  42. Oliver, R.L. Satisfaction: A Behavioral Perspective on the Consumer; Routledge: New York, NY, USA, 2014. [Google Scholar] [CrossRef]
  43. Berry, L.L.; Zeithaml, V.A.; Parasuraman, A. Five imperatives for improving service quality. MIT Sloan Manag. Rev. 1990, 31, 29–38. [Google Scholar]
  44. Parasuraman, A.; Zeithaml, V.A.; Berry, L.L. Servqual: A multiple-item scale for measuring consumer perceptions of service quality. J. Retail. 1988, 64, 12–40. [Google Scholar]
  45. Ravichandran, K.; Mani, B.T.; Kumar, S.A.; Prabhakaran, S. Influence of service quality on customer satisfaction application of servqual model. Int. J. Bus. Manag. 2010, 5, 117–124. [Google Scholar]
  46. Boulding, W.; Kalra, A.; Staelin, R.; Zeithaml, V.A. A dynamic process model of service quality: From expectations to behavioral intentions. J. Mark. Res. 1993, 30, 7–27. [Google Scholar] [CrossRef]
  47. Han, H.; Kim, Y. An investigation of green hotel customers’ decision formation: Developing an extended model of the theory of planned behavior. Int. J. Hosp. Manag. 2010, 29, 659–668. [Google Scholar] [CrossRef]
  48. Ryu, K.; Jang, S. Intention to experience local cuisine in a travel destination: The modified theory of reasoned action. J. Hosp. Tour. Res. 2006, 30, 507–516. [Google Scholar] [CrossRef]
  49. Chang, M.K. Predicting Unethical Behavior: A Comparison of the Theory of Reasoned Action and the Theory of Planned Behavior. J. Bus. Ethic 1998, 17, 1825–1834. [Google Scholar] [CrossRef]
  50. Branscum, P.; Sharma, M. Comparing the utility of the theory of planned behavior between boys and girls for predicting snack food consumption: Implications for practice. Health Promot. Pract. 2014, 15, 134–140. [Google Scholar] [CrossRef] [PubMed]
  51. Lien, N.; Jacobs, D.R.; Klepp, K.I. Exploring predictors of eating behaviour among adolescents by gender and socio-economic status. Public Health Nutr. 2002, 5, 671–681. [Google Scholar] [CrossRef] [PubMed] [Green Version]
  52. Morris, M.G.; Venkatesh, V.; Ackerman, P.L. Gender and age differences in employee decisions about new technology: An extension to the theory of planned behavior. IEEE Trans. Eng. Manag. 2005, 52, 69–84. [Google Scholar] [CrossRef] [Green Version]
  53. Shimanoff, S.B. Gender role theory. Encycl. Commun. Theory 2009, 1, 433–436. [Google Scholar]
  54. Porter, L.W. Job attitudes in management: II. Perceived importance of needs as a function of job level. J. Appl. Psychol. 1963, 47, 141–148. [Google Scholar] [CrossRef]
  55. Hall, D.T.; Mansfield, R. Relationships of age and seniority with career variables of engineers and scientists. J. Appl. Psychol. 1975, 60, 201–210. [Google Scholar] [CrossRef]
  56. Kubeck, J.E.; Delp, N.D.; Haslett, T.K.; McDaniel, M.A. Does job-related training performance decline with age? Psychol. Aging 1996, 11, 92–107. [Google Scholar] [CrossRef]
  57. McDermott, M.; Oliver, M.; Simnadis, T.; Beck, E.; Coltman, T.; Iverson, D.; Caputi, P.; Sharma, R. The theory of planned behaviour and dietary patterns: A systematic review and meta-analysis. Prev. Med. 2015, 81, 150–156. [Google Scholar] [CrossRef] [Green Version]
  58. Limtanakool, N.; Dijst, M.; Schwanen, T. The influence of socioeconomic characteristics, land use and travel time considerations on mode choice for medium-and longer-distance trips. J. Transp. Geogr. 2006, 14, 327–341. [Google Scholar] [CrossRef]
  59. Cheng, Y.-H. Exploring passenger anxiety associated with train travel. Transportation 2010, 37, 875–896. [Google Scholar] [CrossRef]
  60. Ragheb, M.G.; Beard, J.G. Measuring leisure attitude. J. Leis. Res. 1982, 14, 155–167. [Google Scholar] [CrossRef]
  61. Park, H.S. Relationships among attitudes and subjective norms: Testing the theory of reasoned action across cultures. Commun. Stud. 2000, 51, 162–175. [Google Scholar] [CrossRef]
  62. Brislin, R.W. Back-translation for cross-cultural research. J. Cross-Cult. Psychol. 1970, 1, 185–216. [Google Scholar] [CrossRef]
  63. Sperber, A.D. Translation and validation of study instruments for cross-cultural research. Gastroenterology 2004, 126, S124–S128. [Google Scholar] [CrossRef] [PubMed]
  64. Tabachnick, B.G.; Fidel, L.S. Using Multivariate Statistics, 2nd ed.; Harper & Row: New York, NY, USA, 1989. [Google Scholar]
  65. Hair, J.F.; Anderson, R.E.; Tatham, R.L.; Black, W.C. Análisis Multivariante; Prentice Hall: Madrid, Spain, 1999. [Google Scholar]
  66. Churchill, G.A., Jr. A paradigm for developing better measures of marketing constructs. J. Mark. Res. 1979, 16, 64–73. [Google Scholar] [CrossRef]
  67. Fornell, C.; Larcker, D.F. Evaluating structural equation models with unobservable variables and measurement error. J. Mark. Res. 1981, 18, 39–50. [Google Scholar] [CrossRef]
  68. Hair, J.F.; Barry, J.B.; Rolph, E.A.; Ronald, L.T. Multivariate Data Analysis; Prentical-Hall International: Hoboken, NJ, USA, 2006. [Google Scholar]
  69. Anderson, J.C.; Gerbing, D.W. Structural equation modeling in practice: A review and recommended two-step approach. Psychol. Bull. 1988, 103, 411–423. [Google Scholar] [CrossRef]
  70. Bentler, P.M. EQS Structural Equations Program Manual; Multivariate Software: Encino, CA, USA, 1995. [Google Scholar]
  71. Hu, L.T.; Bentler, P.M. Cutoff criteria for fit indexes in covariance structure analysis: Conventional criteria versus new alternatives. Struct. Equ. Model. A Multidiscip. J. 1999, 6, 1–55. [Google Scholar] [CrossRef]
  72. Sharma, S.; Durand, R.M.; Gur-Arie, O. Identification and analysis of moderator variables. J. Mark. Res. 1981, 18, 291–300. [Google Scholar] [CrossRef]
  73. Dawson, J.F. Moderation in management research: What, why, when, and how. J. Bus. Psychol. 2013, 29, 1–19. [Google Scholar] [CrossRef]
  74. Aguinis, H. Regression Analysis for Categorical Moderators; Guilford Press: New York, NY, USA, 2004. [Google Scholar]
  75. Little, T.D.; Card, N.A.; Bovaird, J.A.; Preacher, K.J.; Crandall, C.S. Structural equation modeling of mediation and moderation with contextual factors. Model. Contextual Eff. Longitud. Stud. 2007, 1, 207–230. [Google Scholar]
  76. Steinmetz, H.; Davidov, E.; Schmidt, P. Three approaches to estimate latent interaction effects: Intention and perceived behavioral control in the theory of planned behavior. Methodol. Innov. Online 2011, 6, 95–110. [Google Scholar] [CrossRef] [Green Version]
  77. Wu, H.C.; Li, T. A study of experiential quality, perceived value, heritage image, experiential satisfaction, and behavioral intentions for heritage tourists. J. Hosp. Tour. Res. 2017, 41, 904–944. [Google Scholar] [CrossRef]
  78. Schreuder, H.T.; Gregoire, T.G.; Weyer, J.P. For what applications can probability and non-probability sampling be used? Environ. Monit. Assess. 2001, 66, 281–291. [Google Scholar] [CrossRef] [PubMed]
  79. Pavlou, P.A.; Chai, L. What drives electronic commerce across cultures? Across-cultural empirical investigation of the theory of planned behavior. J. Electron. Commer. Res. 2002, 3, 240–253. [Google Scholar]
  80. González, M.E.A.; Comesaña, L.R.; Brea, J.A.F. Assessing tourist behavioral intentions through perceived service quality and customer satisfaction. J. Bus. Res. 2007, 60, 153–160. [Google Scholar] [CrossRef]
  81. Lee, J.; Graefe, A.R.; Burns, R.C. Service quality, satisfaction, and behavioral intention among forest visitors. J. Travel Tour. Mark. 2004, 17, 73–82. [Google Scholar] [CrossRef]
Figure 1. Behavior Intention Model of HSR tourist based on the Theory of Planned Behavior (TPB).
Sustainability 13 12386 g001
Figure 2. Structural Path Coefficients. *** p < 0.001; ** p < 0.01; * p < 0.05; ns: not significant. Chi-square = 473.419; p-value < 0.001; degree of freedom = 215; Chi-square/degree of freedom = 2.202; GFI = 0.925; AGFI = 0.904; NFI = 0.923; CFI = 0.956; RMSEA = 0.049; HSR = high-speed railway.
Sustainability 13 12386 g002
Table 1. Confirmatory Factor Analysis.
Precipitating FactorItemsFactor LoadingAVEComposite Reliability
Perceived Train Service Quality (PSQ)It is convenient to buy a ticket0.5600.4570.715
It has great customer service0.717
It has great compartments environment0.772
It is safe0.689
It has higher punctuality rate0.681
Perceived Travel Quality (PTQ)It makes me feel closer to the destination0.7360.5330.819
It makes me feel spending less time on transportation0.722
I can travel to further destination0.713
I can stay longer in the destination0.672
Attitude (ATT)I like high-speed trains as a transportation mean0.6750.5200.812
Travelling with high-speed trains is pleasure0.776
Choosing high-speed trains is a wise choice to save time0.639
It’s worth the cost for travelling with high-speed trains0.507
My previous experience of travelling with high-speed trains is good0.528
Subjective norm (SN)My family supports me to travel with high-speed trains0.6610.6090.885
My classmates and friends support me to travel with high-speed trains0.755
Other tourism enthusiasts support me to travel with high-speed trains0.836
The travel agency supports me to travel with high-speed trains0.781
My colleagues support me to travel with high-speed trains0.637
Perceptual behavior control (PBC)I am financially prepared0.6860.5050.801
I have abundant time0.746
I have abundant travelling information sources0.764
I have good physical condition0.702
I desire to travel0.579
Behavioral intention (BI)I am willing to use high-speed railway to travel under the current situation0.8830.6530.849
I would use the high-speed railway to travel again0.896
I will recommend others to use high-speed railway to travel0.845
Table 2. Validity Test.
ConstructAVEMSVASVPBCPSQPTQATTSNBI
PBC0.5050.3750.2700.710
PSQ0.5330.5080.3350.4300.730
PTQ0.4570.4690.2920.2960.6370.676
ATT0.5200.6010.5000.5770.7130.6850.721
SN0.6090.6010.4250.6090.5570.5300.7750.780
BI0.6530.5870.4010.6120.5160.4630.7660.7490.808
Note: PSQ—Perceived train service quality; PTQ—Perceived travel quality; SN—Subjective norm; PBC—Perceived behavior control; BI—Behavior intention; ATT—Attitude.
Table 3. Results for the Moderating Effects for Gender, Age and Travel Distance.
Paths.Moderatorχ2df△χ2/△dfpCoefficientSupport
Unconstrained model for gender814.483430N/AN/A
ATT→BIFemale817.5184313.035 *0.0350.54YES
Male0.68
SN→BIFemale815.8804311.3970.24NO
Male
PBC→BIFemale814.6024310.1190.73NO
Male
Unconstrained model for age760.569430N/AN/A
ATT→BIYoung772.76143112.192 ***0.0090.66YES
Old0.72
SN→BIYoung765.0764314.507 **0.020.33YES
Old0.31
PBC→BIYoung771.72043111.151 **0.010.17YES
Old0.16
Unconstrained model for travel distance733.388430N/AN/A
ATT→BILong735.2694311.8810.17NO
Short
SN→BILong733.4164310.0280.87NO
Short
PBC→BILong737.2134313.825 *0.050.44YES
Short0.28
Note: ATT = Attitude; SN = Subjective norm; PBC = Perceived behavioral control; BI = behavior intention, *** p < 0.001; ** p < 0.05, * p < 0.1.
Table 4. The Hypotheses Test Results.
Study HypothesisStandardized Regression WeightResult
H1a: PQ→ATT0.65 ***Supported
H1b: PQ→SN0.52 ***Supported
H1c: PQ→PBC0.49 ***Supported
H2: PQ→BI0.23 nsNot supported
H3a: ATT→BI0.62 ***Supported
H3b: SN→BI0.37 ***Supported
H3c: PBC→BI0.17 **Supported
H4a: SN→ATT0.27 ***Supported
H4b: PBC→SN0.36 ***Supported
H4c: PBC→ATT0.10 nsNot supported
H5: Gender moderating effectN/ANot supported
H6: Age moderating effectN/ASupported
H7: Travel distance moderating effectN/ANot supported
Note: *** p < 0.001; ** p < 0.01; * p < 0.05; ns: not significant. PQ = Perceived Quality; SN = Subjective norm; PBC = Perceived behavior control; BI = Behavior intention; ATT = Attitude.
Publisher’s Note: MDPI stays neutral with regard to jurisdictional claims in published maps and institutional affiliations.

