1. Introduction
Organizational support indicates the developed perceptions of the employees regarding the extent to which an organization values their contributions and the sum of apprehension exhibited towards their welfare. The founding idea of perceived organizational support (POS) originated from social exchange theory, and developed to clarify the maintenance of interpersonal connection in the perspective of the job environment [
1]. Once the employees can evaluate the organizational support they obtain, they act accordingly with a norm of reciprocity. Therefore, once the employees perceived that the organization is supporting them by recognizing and valuing their contributions and indicating concern for their welfare, they feel obligated to the organization and exhibit higher commitment through increased work efforts [
2].
As per social exchange theory, employees who perceive their job environment and superiors as supportive feel obligated to respond with behaviors that are favorable to the organization [
3]. Since those employees with the favorable perception of positive organizational support have a higher commitment and escalated motivation, they tend to demonstrate superior individual and team performance leading to higher organizational performance. From this perspective, it can generally be expected that POS can directly influence organizational performance since positive feelings about an organization and loyalty can positively impact employees’ approachability for that organization that endeavors to implement and introduce organizational innovation and sustainability [
4]. Antoncic and Hisrich [
5] propose that organizational support characteristics such as managerial support, work discretion, justified rewards, flexible timing, and flexible intra-organizational rules and regulations can be identified as the crucial organizational elements impacting the individual, team, and ultimately organizational performance.
We propose in this context that those motivated employees do not usually leave their respective organizations due to higher commitment through higher POS. Instead, they create a kind of self-belongingness among them and exhibit higher pro-organizational behavior [
6,
7]. Consequently, they try to demonstrate their innovative skills and performance that can lead to sustained organizational performance. Such individual and subsequent organizational performances are ultimately sustainable due to uninterrupted support from the organization and continuous commitment and innovative behavior from the motivated employees.
We also want to investigate the mediating role of increasingly discussed “sustainable organizational reputation (SOR)” on the relationship between POS and “sustainable organizational performance (SOP)”. An organization with a sustainable or long-term reputation can attract talented and creative employees who can contribute to creativity and innovation. Such creativity and innovation, in most cases, can increase financial and brand reputation (for example, through inventing a new product or upgrading an existing product) in the industry, which in turn contribute to SOP of a manufacturing organization. Although being hot and worthy topics to study, it can be evident from the existing literature that those topics are mostly underexplored and there is a lack of pertinent research in academia regarding these three variables [
1].
The manufacturing sector in Bangladesh is the second-largest contributor to the national GDP (gross domestic product) after the service sector. The share of the manufacturing industry was 29.65% of the national GDP in 2019 [
8]. The sector employs about 16 million people in around 20,000 larger, medium and small organizations [
9]. Among the manufacturing organizations, the ready-made garment (RMG) and textile are two major successful manufacturing sub-sectors in Bangladesh, which have the most significant contributions to the national economy and generating employment opportunities for four million people [
10]. As the second-largest contributor to the national economy, we believe that for being strategic and competitive in the industry, it is not enough for the Bangladeshi manufacturing organizations to be reputed and achieve superior performance only, but that reputation and higher performance should be sustainable. This is the major objective of this empirical study.
Considering the research gap and significance for further study on those topics, this empirical study intends to identify the relationship between POS and SOP for Bangladeshi local and multinational manufacturing organizations operating in Bangladesh. Moreover, we incorporated a single mediator SOR to examine the influence on the relationship between POS and SOP. This is deemed to be the first such study ever conducted in Bangladesh where we put forward the following research questions:
RQ1: What is the relationship between POS and SOP at the Bangladeshi manufacturing organizations?
RQ2: Can SOR mediate the relationship between POS and SOP?
This paper has been organized into several parts.
Section 1 covers the study background and points out the research questions.
Section 2 explores the existing literature, develops research hypotheses and theoretical framework.
Section 3 explains the research method, while
Section 4 interprets the results obtained after statistical analyses.
Section 5 discusses the results based on previous findings.
Section 6 provides potential theoretical and practical implications of the study.
Section 7 focuses on the limitations and further scope of the study. Finally,
Section 8 concludes the paper by conferring some recommendations.
2. Literature Review and Theoretical Framework
2.1. Perceived Organization Support (POS)
Organizational support indicates employees’ built-up perceptions regarding the extent to which an organization values the amount of concern and contributions exhibited towards their job-related well-being [
11]. Pre-dominantly, POS indicates any apparent support from the top-level management in encouraging creativity and innovation such as financial, logistic, and moral that is necessary in exhibiting performance. As noted in the previous section, the underpinnings of POS have been derived from social exchange theory developed to clarify interpersonal relationships in the context of the job environment. When the employees perceive that the organization is supportive towards them by valuing their contributions and being concerned about their welfare, they develop a feeling of obligation to be committed towards the organization and transform such commitment through increased job satisfaction and sustainable innovative behavior [
2].
According to social exchange theory, if the employees perceive their job atmosphere as compassionate, they respond with positive behaviors that are beneficial to the organization [
3]. From this standpoint, it can be well expected that POS directly affects corporate entrepreneurship, innovation, and sustainability; since such positive feelings about the organization and its supportive nature can positively impact employees’ receptivity towards the organization’s efforts to introduce and implement corporate innovation. Holt et al. [
4] suggest that compassionate distinctiveness such as managerial support, job discretion, appreciation, and flexible intra-organizational restrictions are crucial organizational fundamentals influencing personal and corporate innovative performance [
1].
POS can directly affect SOP through sustainable innovative behaviors from the employees as a result of increased job satisfaction and work engagement. As an example, Ambrose and Schminke [
12] identified that corporate innovation can influence the association between POS and SOP. Furthermore, POS has also been exhibited to alter the perceived supervisor support–voluntary turnover relationship [
13]. Based on such literature evidence, it appears that POS possesses great prospective to influence organizational innovation and sustainability, leading to SOP.
2.2. Sustainable Organizational Performance (SOP)
Organizational success can be measured through some key performance indicators pulled from an organization’s strategic objectives. In some cases, organizational performance needs to be benchmarked with other identical organizations to identify their competitive position in the industry. Strategic management researchers frequently encounter difficulties obtaining purposive measurement indicators of organizational performance that are valid and reliable [
14]. It is challenging for some organizations to sustain their businesses for a long time due to a lack of visionary outlook, planning issues, lack of competitive employees, or a lack of business intelligence.
On the other hand, sustainability can be defined as “satisfying the present needs without compromising the needs of the future generations.” Recently, numerous organizations have realized that sustainability can strengthen their competitive advantage and innovation in their processes, products and services, markets, and business models. Current research on sustainability is exploring entities through the lens of the triple bottom line (environmental, social, and economic), and much emphasis has been given to manufacturing organizations [
15,
16]. However, comparatively little attention has been issued related to sustainable organizational performance in the context of Asian countries. This paper is an attempt to fill this gap.
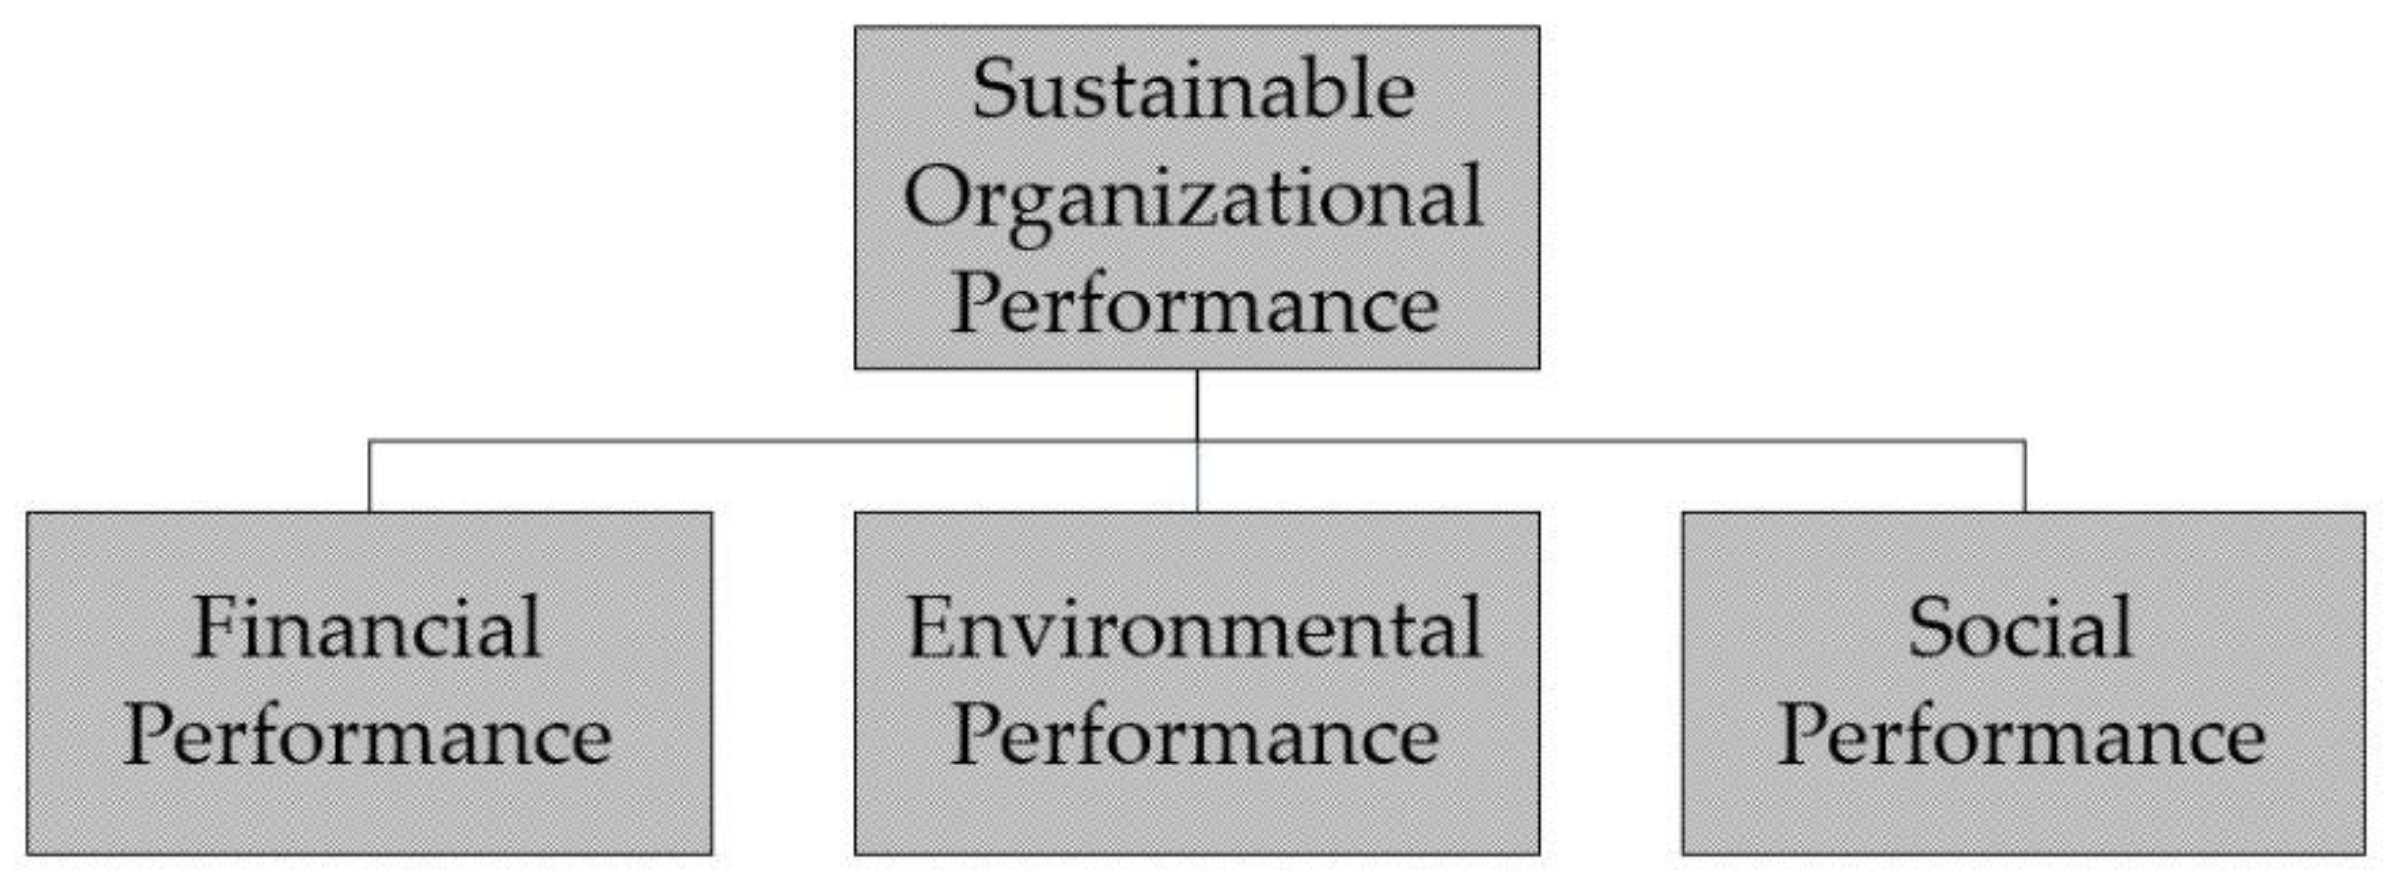
In this paper, as the indicators of SOP, we considered three critical dimensions of measuring sustainable performance: financial, environmental, and social [
17] that have been illustrated through
Figure 1.
Financial Performance (FP): FP can be measured from both operational and financial outcomes. From the operational perspective, FP is connected with the capability of manufacturing firms to decrease costs related to inputs, waste treatment and discharge, energy consumption, and fines/penalties for environmental accidents [
17]. This study measured FP from monetary indicators such as profits, sales growth, return on assets, return on equity, and return on investment. Measuring FP from this standpoint is consistent with the works of a variety of scholars [
18,
19].
Environmental Performance (EP): EP is achieved when manufacturing organizations minimize the use of solid environmental resources such as trees and reduce water waste, reduce carbon emissions, lower the use of contaminated and harmful inputs, reduce the frequency of environmental accidents; and minimize the overall environmental negative impact through the organizational activities [
20,
21].
Social Performance (SP): SP has become relevant in measuring the current supply chain due to organizations’ awareness of corporate social responsibility (CSR). SP ensures that an organization’s social mission is translated into reality. SP is measured by employee safety and health, improvement in the quality of surrounding community lives, vocational training for community members, and training of employees for health and safety issues [
17,
22].
It should be noted that measuring SOP is a complex process since such an attempt involves many factors and considerations. To deal with this level of complexity, we used the recommendations of various experts such as project management specialists, human resource personnel, strategic management experts, environmental specialists, and financial experts while preparing the survey instrument for our study.
2.3. Perceived Organizational Support (POS) and Sustainable Organizational Performance (SOP): The Role of Mid-level Managers
The key sources of innovative ideas in an organization are generally originated and forwarded by the mid-level managers as those managers are attached with the manufacturing process as well as with lower and top-level employees [
23]. Hinz and Ingerfurth [
24] believe that the mid-level managers are the main orchestrators of organizational innovation. They contribute to a greater extent of SOP by turning their innovative ideas in to reality. The decree of the capability-rigidity absurdity is completed by the mid-level managers, who are the baselines of organizational performance integrating the perceptions from those two diverse sources (top-level managers and lower-level employees).
Diverse features of mid-level managers’ contributions towards SOP have been recognized by many researchers [
25,
26]. The contributions of mid-level managers to an organization’s strategy were studied by another research [
27] that is intimately connected to innovation and performance. The significance of intellectual capital supported by the organizations is that they are encouraged to take calculated risks without fear of losing their jobs [
23]. The innovative procedure in a constituted organization as the precious role and essential characters of mid-level managers were recognized the first by Felicio et al. [
26]. The implication of mid-level managers in escalating and supporting innovations has been conversed by researchers from the international business discipline [
24].
Leitao and Franco [
25] recommended that the growing existence in the process of innovation presents a response to the argument that such an action can produce better-quality performance in constituting organizations. The primary factor is attaining competitive benefit, and ultimately superior financial performance is entrepreneurial innovation as proposed [
25]. In the same way, we suggest that undertaking innovative steps duly supported by the organization improves an organization’s financial performance. Such innovation helps in achieving a superior competitive advantage that ultimately leads to organizational performance [
26]. Furthermore, supported innovation may aid in creating a better long-term performance that seems to be comparatively lower in the early years but increases over time [
23,
24].
POS can encourage sustainable organizational behaviors of the employees, particularly mid-level managers, through creativity and innovation [
23,
24]. On the other hand, corporate innovation initiated by managers duly supported by the organization can have a strong and sustainable influence on SOP, since such a performance is generally persistent and has a long-lasting impact on the industry [
23]. In this vein, the mid-level managers strongly contribute to SOP with the help of POS at the manufacturing firms since those managers usually take all the operational decisions and support top-level managers in taking the strategic decisions through supplying pertinent information and technical clues. In fact, mid-level managers who are generally working as the head of particular departments (such as R&D, HR, finance, marketing) act as the bridge between the supervisors and top-level management at the manufacturing firms. Any innovative performance comes through their hands duly supported by the top-level management or the Board of Governors. Therefore, their dedication and capability can influence an organization’s short-term and long-term innovative behaviors, ultimately leading to sustainable performance. Such arguments support the positive association of POS with SOP. Based on the arguments, we propose the following hypothesis to be tested:
Hypothesis 1 (H1). POS has a significant positive relationship with SOP.
2.4. Perceived Organizational Support (POS), Sustainable Organizational Performance (SOP) and Sustainable Organizational Reputation (SOR)
Organizational reputation can result from applying ideas about positively affecting the customers toward the organization and its influence on potential and present employees [
28]. Such reputation can be maintained if the organizational objectives and policies can be aligned with the customers’ preferences, even if they face risks and uncertainty [
29]. The purpose of such reputation management is to collect information and opinions, understand, forecast, and deal with them systematically to manage a solid and sustainable corporate profile.
We can observe increasing importance regarding the external influence of SOR in drawing the attention of existing and potential stakeholders [
30], increasing operational efficiency [
31], and reducing the cost of production [
32]. Studies have confirmed that potential stakeholders perceive an organization’s CSR has an impact on its attractiveness to them [
30]. Organizations have experienced that an effective and robust trademark can develop some definite competitive advantages that ultimately attract potential and retain existing employees with superior competitiveness [
33]. Previous arguments that have been made so far indicate that an organization with a strong, recognized, and sustainable reputation creates the prospect of long-term positive performance [
34].
Although limited in number, a few previous studies indicated the utility of conceptualizing POS as a factor having a direct relationship with corporate reputation and ultimately influence organizational performance. As an example, Ambrose and Schminke [
12] found that a strong and sustainable organizational reputation affects the association between POS and SOP. POS has also been proved to alter the perceived supervisor support–voluntary turnover relationship [
35]. Based on the arguments, we believe that SOR can mediate the relationship between POS and SOP. Thus, we considered SOR as the mediator over the relationship between POS and SOP.
Hypothesis 2 (H2). POS has a significant positive relationship with SOR.
Hypothesis 3 (H3). SOR has a significant positive relationship with SOP.
Hypothesis 4 (H4). SOR can mediate the positive relationship between POS and SOP.
The theoretical framework for this study has been presented through the following diagram (
Figure 2), where POS is the single independent variable, SOP is the single dependent variable, and SOR is the single mediating variable.
3. Research Method
3.1. Sampling Region
The investigation data were collected from the mid-level managers working at 89 different manufacturing organizations located in the Gazipur, Khulna, Narayanganj, and Chittagong districts of Bangladesh. The reason for choosing those four cities was that most of the famous manufacturing organizations are located there.
3.2. Nature of Data Collected and Sampling Technique
We collected primary data as we believe secondary information is not suitable for this empirical investigation. There are several terms involved in this study, such as perceived and sustainable, that only can be presented and measured by the individual perception and beliefs. Therefore, we went to collect primary data from the mid-level managers working at various Bangladeshi manufacturing organizations.
We adopted purposive sampling technique to recruit the respondents since this study had a specific purpose of serving. Such a sampling technique is appropriate when the researchers require to collect precise types of desired information from a particular cluster of people, either since they are the solitary ones who can provide such information or conform to some criteria set by the researchers [
36]. Purposive sampling is appropriate when the researchers use the sample to conform to some specific criteria [
37]. The present study used purposive sampling to collect data purposively from the mid-level managers who could provide us adequate information regarding organizational support from their superiors/organizations, sustainable organizational reputation, and sustainable organizational performance as perceived by them.
As an export-oriented country, there are more or less 20,000 manufacturing organizations in Bangladesh [
9]. However, most of them belong to small and medium-sized enterprises, employing only a handful of people (2–10) on average. Therefore, we made a rough investigation and found that the numbers of larger organizations are around 400 to 500. Since our study had specific purposes to serve, we purposively selected 89 Bangladeshi manufacturing organizations covering three major aspects: POS, SOR and SOP.
3.3. Sample Size Determination
Initially, we distributed 500 survey instruments (structured questionnaires) to the pre-selected respondents who work as mid-level managers at 89 manufacturing organizations (
Table A1) in four districts of Bangladesh. Out of the distributed instruments, we received 402 questionnaires back from those respondents (80.4% response rate). Afterward, 18 of those returned questionnaires were discovered incomplete, biased, and/or abnormally answered; and, therefore, discarded from our consideration. Thus, finally, we considered 384 sample data for our final analysis.
3.4. Measurement Tool
As part of the measurement tool, we used a well-designed survey instrument to accumulate data using a 5-point Likert scale, where 1 indicated as strongly disagree and 5 indicated as strongly agree. The questionnaire items with literature evidence have been presented in
Table A2. After conducting factor analysis, the numbers of items for each variable were determined, as shown in
Table 1.
The respondents were appropriately instructed regarding the questionnaire items before sending the survey instruments to them in order to remove any tentative confusion and mistakes.
3.5. Normality of the Data
We observed a reasonably standard distribution regarding the indicators of the latent factors in terms of skewness. However, mild kurtosis regarding the indicators of the dependent variable (SOP) and mediator (SOR) were observed. These kurtosis values ranged from −0.836 to 1.906. While such results violate the strict rules of normality, it is still within more relaxed rules, as suggested by Sposito et al. [
38], who recommend 3.3 as the upper threshold for normality (
Table 2):
Therefore, the data collected showed a fairly normal distribution that permitted the researchers to continue for conducting further analysis.
3.6. Multivariate Normality
We ran a Cook’s distance analysis (
Figure 3) to determine if any (multivariate) influential outliers existed. Cook’s distance can be utilized in several ways. For example, it can be utilized to designate significant data points that are predominantly momentous inspecting for validity; or to point out areas of the design space where it would be appropriate to be able to obtain additional data points [
39,
40].
In this study, no case was observed regarding a Cook’s distance greater than 1. Most of the cases were far less than 0.12. Such a result indicates that all the items were normally distributed.
3.7. Tests of Reliability and Validity
To examine the reliability of the data, we adopted composite reliability (CR) and the average variance extracted (AVE) from the data that have been presented in
Table 3. Such values indicate that all the data were within the acceptable limits as per Hair et al. [
41]; Fornell and Larcker [
42], and Henseler et al. [
43], who recommended the CR value of 0.70 and AVE value of 0.50 as acceptable. It can be observed that all the corresponding CR and AVE values are well above the recommended cut-off values.
In order to check discriminant validity, we used Fornell and Larcker’s [
42] opinion of comparing each AVE value with corresponding correlation values with other factors. The square root of each AVE value has to be greater than the corresponding correlation values with other factors. The discriminant validity of the factors has been shown in
Table 3.
4. Results and Interpretation
4.1. Demographic Information of the Respondents
Table 4 represents the distribution of sample respondents based on the demographic factors included in the questionnaire, such as age, gender, education, and service length.
Table 4 indicates that the majority of the respondents (84.11%) were aged between the range of 35–44, and almost all of them (90.89%) were male managers. The highest number (80.99%) of the mid-level managers were Master degree holders, and more than half of them (54.43%) had job experience of 11 to 20 years.
4.2. Measurement Model (Exploratory Factor Analysis)
While evaluating the exploratory factor analysis (EFA), we adopted four commonly utilized assumptions: (a) a sampling adequacy (Kaiser–Meyer–Olkin) measure (greater than 0.5); (b) the lowest Eigen value for individual factors; (c) a sample size, with a factor loading of 0.50 for each item is considered as the threshold for keeping the items to assure superior confidence; and (d) Promax rotation, which is a high-quality common approach that simplifies the understanding of factors.
Table 5 shows the EFA results. Hair et al. [
41] and Field [
44] recommended that factor analysis can be conducted if the Bartlett’s test of Sphericity and Kaiser–Meyer–Olkin (KMO) test are considerable. An index of the KMO measurement of sampling adequacy (Overall = 0.859) and Bartlett’s test of sphericity (
p = 0.000) indicate that (
Table 5) the EFA can be considered satisfactory for additional analysis. After investigating the EFA pattern matrix, we found that factor loadings of all the items were higher than 0.60 that is considered satisfactory as per MacCallum et al. [
45] and Kaiser [
46].
Therefore, as per
Table 5, the factor analysis was appropriate. Subsequently, to confirming research constructs, maximum likelihood (ML) and the Promax method (PM) were utilized to take out factors from 13 items. Hair et al. [
47] recommended that items with factor loading ought to have a value higher than 0.50 to be considered decidedly significant. Based on an Eigen value higher than 1, we identified that a three-factor model can explain 60.289% of the total variance of the dataset (
Table 5). As a whole, 13 items were grouped (based on Eigen values) into the three factors (POS, SOR and SOP) by the analysis. The EFA results also showed that 0.621 was the lowest and 0.941 was the highest factor loading of the items. Thus, according to EFA, all factors, as a whole, were acceptable for further analysis (
Table 5).
Table 5 indicated that the first factor (SOR) can explain individually 35.358% of the total variance with 4 items. The second factor (POS) can explain individually 15.55% of the total variance with 5 items. The third factor (SOP) can explain individually 9.381% of the total variance with 4 items.
4.3. Results of Measurement Model (Confirmatory Factor Analysis)
Confirmatory factor analysis (CFA) is a statistical technique used to verify the factor composition of a group of experimental variables that assist the researchers in evaluating to identify the connection between observed variables and their underlying core constructs. The outcomes of CFA have been presented in
Figure 4 and
Table 6. The relative Chi-square for this model was 1.837, smaller than the 5.0 as recommended by Marsh and Hocevar [
48], with additional fit indices indicating a better match for the measurement model. The result also indicated that the goodness of fit index (GFI) of the model was 0.966, higher than the suggested value of 0.90 by Joreskog and Sorbom [
49]. Further, we found that the adjusted goodness of fit index (AGFI) was 0.943, which satisfies the recommended value (>0.85) and hence deemed to be a good fit and acceptable, as supported by Anderson and Gerbig [
50].
Furthermore, the non-incremental fit indices such as the comparative fit index (CFI) was 0.986, exceeding the recommended cut-off level of 0.90 [
51]. The root mean square residual (RMR) value was identified as 0.018, which is lower than 0.08, generally suggested as satisfactory [
52]. The root means square error of approximation (RMSEA) was 0.047, which is also less than 0.08, commonly recommended as acceptable [
53]. Finally, the standardized root mean squared residual (SRMR) was 0.0287, which is less than 0.08 as recommend by Browne and Cudeck [
53]. The summary result of the analysis is presented in
Table 6. The fit indices showed a good model fit to the data.
4.4. Common Method Bias Test
We utilized a common latent factor (CLF) to capture the common variant of all observable variables in the model (
Table 7). We compared the standardized regression weight from this model with the standard regression weight of a model without CLF.
If the difference is less than 0.200, we can assume that there is no common method bias in our analysis [
41]. Therefore, according to the results depicted in
Table 7, it was observed that there was no common method bias in our analysis.
4.5. Collinearity Assessment
In general, variance inflation factors (VIFs) can have a range from 1 to 10. The VIF can explain the percentage of variance inflated for every coefficient. While interpreting the VIFs, usually 1 represents not correlated, 1–5 indicates moderately correlated, and 5–10 shows highly correlated [
41]. In order to assess the impact of multicollinearity among the variables, we calculated the VIFs (
Table 8).
As presented in
Table 8, it can be noticed that the maximum value of VIF was 1.197, which is highly satisfactory as recommended by Hair et al. [
41].
4.6. HTMT Analysis
Another approach to assess the discriminant validity suggested by Henseler et al. [
54] through the multi-trait and multi-method matrix, popularly known as the heterotrait–monotrait ratio (HTMT). In general, two types of HTMT approaches are used to evaluate the discriminant validity. First of all, while using it as a decisive factor, if HTMT value is higher than 0.85, it is considered that problems exist with discriminant validity. Secondly, while using a statistical experiment for HTMT supposition and the confidence interval of HTMT values for the structural paths contains the value of 1 inside the interval range, it represents an absence of discriminant validity. On the contrary, if the value of 1 falls outside the interval’s range, it suggests that the constructs are empirically distinct. HTMT results can be observed from the following table (
Table 9). If the corresponding associated value of one factor with another is less than 0.85, it is generally considered that there is no common method bias between those factors [
54].
Based on the results of
Table 9, all HTMT values are lower than the required threshold value of HTMT 0.85 by Kline [
55] and HTMT of 0.90 by Gold and Malhotra [
56], which proves that discriminate validity was present in this study. Furthermore, the result shows that neither lower nor upper confidence interval (CI) includes a value of 1. In summary, both the convergent and the discriminant validity of the factors were developed. Therefore, from the analysis given below, it is understood that the correlated value of a single factor with another factor was well below 0.85, and we can claim that common method bias was not present in our analysis that can be understood from the correlation metrics.
4.7. Structural Model
We adopted a multivariate analysis technique (covariance-based structural equation modeling) to spot the noteworthy relationships among the three constructs: POS, SOR and SOP. Accordingly, all three hypotheses were found to be highly significant since their corresponding t values were well above 1.96 and the corresponding
p values were well below 0.01. First of all, H1 was supported since the relationship between POS and SOP was found significant (β = 0.25, t value = 4.271,
p < 0.001). H2 was also supported since the relationship between POS and SOR was found significant (β = 0.37, t value = 7.11,
p < 0.001). Finally, the last direct effect, H3, was found valid since the relationship between SOR and SOP was also found significant (β = 0.42, t value = 5.851,
p < 0.001). The regression weight for each relationship has been presented in
Table 10 and
Figure 5 and
Figure 6.
Hair et al. [
47]; Hair et al. [
57]; and Henseler et al. [
54] suggested in their scholarly researches focusing on the marketing issues that R2 values of 0.75, 0.50, or 0.25 for endogenous latent variables can, as a rough rule of thumb, be respectively described as substantial, moderate or weak. On the other hand, Cohen [
58] recommended, as a rule of thumb, R2 values ranging from 0.02 to 0.12 as weak, 0.13 to 0.25 as moderate, and 0.26 or above as the higher effect size. Chin [
59] suggested R2 values for endogenous variables of 0.19 to be weak, 0.26 to be moderate, and 0.33 as considerable. Further, Falk and Miller [
60] suggested that R2 values should be equal to or higher than 0.10 to be considered for the variance explained of a specific endogenous latent construct appropriate. In this respect, the path diagram of this study revealed that the two latent factors, POS and SOR, explained 31.2% variance of SOP (dependent variable) for Bangladeshi manufacturing firms. Such an R2 value is supported by Cohen [
58] and Chin [
59] as moderate to higher effects.
4.8. Mediating Effect
We included one mediator (SOR) in this study to examine whether it has any mediating influence on the direct relationship between POS on SOP and thus developed the hypothesis H4 accordingly.
Table 11 highlights the result of the mediating effect.
Regarding the mediating effect of SOR, we observed that it could partially mediate the relationship between POS and SOP, as all path coefficients were significant at a 1% level. Therefore, hypothesis H4 was also supported.
5. Discussion of Results in Line with Previous Findings
The results from the statistical analysis revealed that POS has a strong positive relationship with SOP supported by the outcomes of numerous previous studies such as Mujtaba and Mubarik [
27]; Felicio et al. [
26]; Leitao and Franco [
25]; Hinz and Ingerfurth [
24]; and Chen and Cangahuala [
23]. Moreover, all those studies were conducted based on manufacturing organizations similar to this one. Thus, the first research question has been answered, and the hypothetical assumption has been duly justified from our analysis.
Regarding the mediating effect of sustainable organizational reputation on the relationship between POS and SOP, we found that SOR can partially mediate the relationship. Such an outcome has been supported by Ambrose and Schminke [
12], Dögl and Holtbrügge [
33], and Aboul-Ela [
34], who argued that sustainable organizational reputation can have a positive impact on the influence of organizational support on sustainable organizational performance.
The study is one of the preliminary investigations on the Bangladeshi manufacturing organizations to identify the role of POS on SOP. Therefore, the results are expected to have a contributive impact on the existing literature enriching academia.
6. Theoretical and Practical Implications
6.1. Theoretical Implications
Despite being two hot topics in academia and among scholars, organizational support and sustainable performance have been comparatively less researched than necessary [
1,
15,
16]. However, it is a well-known fact that the employees of an organization can be motivated and directed towards further productivity and efficiency leading to sustained individual and organizational performance by providing them well-guided organizational support [
1,
2,
13]. Therefore, we believe that more and more theoretical and empirical investigations with guiding and conclusive results and recommendations are quite essential.
However, although such empirical investigations covering those aspects are comparatively available in the Western and some Asian country scenarios [
3,
17], research attempts on these issues based on the South Asian perspective are rare. Moreover, more than half of those research attempts were conducted on service firms, largely ignoring the manufacturing plants [
3]. As the authors, we strongly hope that the outcomes and recommendations made in this paper will act as the guidelines for Bangladeshi as well as other scholars around the globe to carry out further attempts to reveal the inherent relationships among organizational support, sustainable corporate reputation, and sustainable organizational performance.
6.2. Practical Implications
This paper mainly emphasized on the mid-level managers since they act as a bridge between the policymakers (top-level management), the supervisors, and general employees/workers. We believe that the recommendations made in the last section will be the founding guidelines on how to support the employees, inspiring creativity and innovation, and motivating and retaining talented employees at the organizations. Such activities will create a long-term impression of the management on the ordinary employees and engage them in further innovation leading to ultimate performance.
We are confident that the Bangladeshi manufacturing organizations will be benefitted from the empirical results of this investigation in retaining the talented, innovative, and supportive employees, particularly the mid-level managers, as they are the torchbearers for organizational reputation and performance. Moreover, such reputation and performance will be sustainably longer as those satisfied managers will not think of leaving their organizations. Therefore, based on the empirical results, we can claim that there is a strong positive link between POS and SOP and such a link can be further strengthened by SOR. The results clearly indicate that organizations should support their employees for better innovation leading to ultimate organizational performance that will be sustainable.
7. Limitations and Further Scope
Alike other studies, this stream of study has several limitations that need to be pointed out. First of all, it was conducted in a particular culture. A cross-cultural (comparative) investigation might have provided different and more representative results. Secondly, the ideas and practices of sustainable reputation and sustainable performance are comparatively new in Bangladesh. As a result, organizations, particularly the local manufacturing ones, are not mature enough to efficiently understand and carry out such practices, which might have influenced this study.
Therefore, we suggest that further investigations should be sponsored and financially supported by organizations and research institutions. Moreover, those additional investigations should consider such practical limitations and lessen the theoretical and practical gaps. Further, we particularly recommend empirical studies to initiate employing unique variables and techniques not used before.
8. Conclusions and Recommendations
We collected primary data through a well-structured questionnaire (placed in
Table A2) from mid-level managers of the top-performing listed Bangladeshi manufacturing organizations. In terms of POS and SOP, hypothesis (H1) has been supported. Therefore, the policymakers need to understand that employees having a proactive personality with perceived managerial and organizational support can be more initiative for successful SOP.
On the contrary, organizations that fail to support employees’ well-being, recognize employees’ contributions, value employees’ additional sincere efforts, notice astonishing employee performance, provide general satisfaction tools, concern about employees, and take pride in employees’ accomplishments can lead to their dissatisfaction and lose them as they intend to leave by searching for better workplaces. As the social exchange theory explains, employees who recognize their organization as supportive and encouraging feel obliged and make every effort to benefit the organization in return from their sense of gratefulness. Under such a positive atmosphere that involves managerial support and job discretion, employees become more proactive, enthusiastic, and innovative. Such employees contribute to creative thoughts making scope for competitive advantage, ultimately leading to corporate reputation and sustainable performance.
Management support has a positive and significant relationship with organizational performance. The last hypothesis (H4) was valid from the analysis and indicated that SOR can partially mediate the influence of POS on SOP. Thus, the reputed organizations in the industry positively impact the employees where they expect more organizational support (partial autonomy, work recognition, and financial well-being) from the superiors and company policies to be innovative and creative, which in turn bring SOP.
Therefore, the results can clearly validate all the hypotheses and answer the research questions based on Bangladeshi manufacturing industry context. Such outcomes can enrich the academia and fill the gaps in policymaking levels particularly in a developing country perspective. In general, the mid-level managers, as the key players, have more enthusiasm and time for innovation. Therefore, they should be given the authority to motivate and support among all the employees of an organization. Therefore, the organizations may allocate more resources and time to their talented employees, particularly mid-level managers, to retain them. At the same time, the employees should be continuously motivated to innovate products and ideas that can contribute to achieving sustainable performance and make the organization a reputed one in terms of financial return and a reputable, trustworthy, and ethical player in the industry.
Author Contributions
In this study, M.A.H. and M.S.H. are responsible for conceptualization, data curation, data analysis, methodology, and manuscript preparation. M.A.H. is responsible for the literature review, funding acquisition, manuscript formatting, resources, investigation, visualization, and writing—review and editing. M.F.F. and S.S.A.-Y. is responsible for visualization, validation, writing—review and editing. M.A.A.M. is responsible for data collection, data curation, and validation. All authors have read and duly agreed to the published version of the manuscript.
Institutional Review Board Statement
Not applicable.
Informed Consent Statement
Not applicable.
Data Availability Statement
Data are available on request from the corresponding author.
Conflicts of Interest
The authors declare no conflict of interest.
Appendix A
Table A1.
Industry-wise sample distribution.
Table A1.
Industry-wise sample distribution.
| List of Industrial Sector | Number of Manufacturing Organizations | Number of Respondents |
|---|
| Garments | 12 | 66 |
| Textile | 9 | 38 |
| Iron and steel | 7 | 29 |
| Shipbuilding | 6 | 25 |
| Soap and toiletries | 9 | 25 |
| Heavy machinery | 6 | 32 |
| Wooden furniture | 5 | 27 |
| Pharmaceuticals | 10 | 39 |
| Leather products | 9 | 35 |
| Food and beverage | 8 | 35 |
| Plastic materials | 8 | 33 |
| Total | 89 | 384 |
Table A2.
Survey items with literature support.
Table A2.
Survey items with literature support.
| Sustainable Organizational Reputation (SOR) |
|---|
| SOR4: Sustainable organizational reputation is the basis of sustainable organizational performance. | Ambrose and Schminke [12]; Hosain et al. [29]; and Dögl and Holtbrügge [33] |
| SOR3: An organization with a sustainable reputation can gain the trust of internal and external stakeholders. |
| SOR2: Employees want to stay with an organization having a sustainable reputation. |
| SOR1: Sustainable organizational reputation creates a favorable image in the industry. |
| Perceived Organizational Support (POS) |
| POS2: Perceived organizational support motivates and retains talented employees. | Ring [2]; Shanock and Eisenberger [3]; and Ambrose and Schminke [12] |
| POS5: A proper culture of organizational support maintains equality and diversity in organizations. |
| POS3: Proper organizational support inspires creativity and innovation. |
| POS4: Proper organizational support helps employees to take calculated risks that can be beneficial for the organizations in the mid and long term. |
| POS1: Adequate organizational support is necessary for employees. |
| Sustainable Organizational Performance (SOP) |
| SOP1: Sustainable organizational performance is the combination of long-term financial and non-financial positive outcomes. | Al-Hammadi and Hussain [14]; Abdul-Rashid et al. [17]; Çankaya and Sezen [21]; and Mujtaba and Mubarik [27] |
| SOP2: Sustainable organizational performance can be basically measured by lower employee turnover, higher corporate and environmental performance, lower customer complaints, and above-average growth for a longer period (usually 5 years). |
| SOP3: Sustainable organizational performance is the result of positive organizational support, positive employee performance, and a positive image of the organization. |
| SOP4: As an employee, I would continue my job with a sustainably reputed organization even if the benefits are lower. |
References
- Mohammadi, M.A.D.; Khan, M.N.A.A.; Karami, M.; Sadatifar, S.R. Perceived organizational performance mediated by corporate entrepreneurship. Sains. Humm. 2016, 8, 1–11. [Google Scholar]
- Ring, J.R. The effect of perceived organizational support and safety climate on voluntary turnover in the transportation industry. Int. J. Bus. Res. Manag. 2011, 1, 156–168. [Google Scholar]
- Shanock, L.R.; Eisenberger, R. When supervisors feel supported: Relationships with subordinates’ perceived supervisor support, perceived organizational support, and performance. J. Appl. Psychol. 2006, 91, 68–79. [Google Scholar] [CrossRef] [PubMed] [Green Version]
- Holt, D.T.; Rutherford, M.W.; Kuratko, D.F. Advancing the field of family business research: Further testing the measurement properties of the F-PEC. Fam. Bus. Rev. 2010, 23, 76–88. [Google Scholar] [CrossRef]
- Antoncic, B.; Hisrich, R.D. Corporate entrepreneurship contingencies and organizational wealth creation. J. Manag. Dev. 2004, 23, 518–550. [Google Scholar] [CrossRef]
- Hosain, M.S. Unethical pro-organizational behavior: Concepts, motives and unintended consequences. Asia Pac. J. Manag. Res. Inn. 2019, 15, 133–137. [Google Scholar]
- Hosain, M.S. Unethical pro-organizational behavior: A review of existing literature. Organ. Psychol. Rev. 2020, 11, 152–161. [Google Scholar]
- statista.com. Share of Economic Sectors in the GDP of Bangladesh in 2019. Available online: https://www.statista.com/statistics/438359/share-of-economic-sectors-in-the-gdp-in-bangladesh/ (accessed on 1 July 2021).
- Bangladesh Bureau of Statistics (BBS). Manufacturing Sector in Bangladesh to Generate Employment. Available online: https://bbs.bg.org/manufacturing-sector-and-emplyment-generation-2019 (accessed on 1 July 2021).
- Ahamed, F. Job dissatisfaction in the Bangladesh ready-made garment sector-To what extend HR/IR practices can grow exhilaration of RMG workers? Int. J. Bus. Manag. Rev. 2014, 2, 1–12. [Google Scholar]
- Rich, B.L.; Lepine, J.A.; Crawford, E.R. Job engagement: Antecedents and effects on job performance. Acad. Manag. J. 2010, 53, 617–635. [Google Scholar] [CrossRef]
- Ambrose, M.L.; Schminke, M. Organization structure as a moderator of the relationship between procedural justice, interactional justice, perceived organizational support, and supervisory trust. J. Appl. Psychol. 2003, 88, 82–95. [Google Scholar] [CrossRef] [PubMed]
- O’Connor, M.-F.; Wellisch, D.K.; Stanton, A.L.; Eisenberger, N.I.; Irwin, M.R.; Lieberman, M.D. Craving love? Enduring grief activates brain’s reward center. Neuroimage. 2008, 42, 969–972. [Google Scholar] [CrossRef] [PubMed] [Green Version]
- Al Hammadi, F.; Hussain, M. Sustainable organizational performance: A study of health-Care organizations in the United Arab Emirates. Int. J. Org. Anal. 2019, 27, 169–186. [Google Scholar] [CrossRef]
- Hussain, M.; Khan, M.; Al-Amor, R. A framework for supply chain sustainability in service industry with confirmatory factor analysis. Renew. Sustain. Energy Rev. 2016, 55, 1301–1312. [Google Scholar] [CrossRef]
- Al-Amor, R.; Hussain, M. An assessment of green practices in a hotel supply chain: A study of UAE hotels. J. Hosp. Tour. Manag. 2017, 32, 71–81. [Google Scholar] [CrossRef]
- Abdul-Rashid, S.H.; Sakundarini, N.; Ghazilla, R.A.R.; Thurasamy, R. The impact of sustainable manufacturing practices on sustainability performance. Int. J. Oper. Prod. Manag. 2017, 37, 182–204. [Google Scholar] [CrossRef]
- Rao, P.; Holt, D. Do green supply chains lead to competitiveness and economic performance? Int. J. Oper. Prod. Manag. 2005, 25, 898–916. [Google Scholar] [CrossRef]
- Yang, F.; Yang, M.; Xue, B.; Luo, Q. The effects of China’s western development strategy implementation on local ecological economic performance. J. Clean. Prod. 2018, 202, 925–933. [Google Scholar] [CrossRef]
- Centobelli, P.; Cerchione, R.; Singh, R. The impact of leanness and innovativeness on environmental and financial performance: Insights from Indian SMEs. Int. J. Prod. Econ. 2019, 212, 111–124. [Google Scholar]
- Çankaya, S.Y.; Sezen, B. Effects of green supply chain management practices on sustainability performance. J. Manuf. Technol. Manag. 2019, 30, 98–121. [Google Scholar] [CrossRef]
- Wang, J.; Dai, J. Sustainable supply chain management practices and performance. Ind. Manag. Data Syst. 2018, 118, 2–20. [Google Scholar] [CrossRef]
- Chen, M.H.; Cangahuala, G. Corporate Entrepreneurship Environment and Organizational Performance in Technology Manufacturing Sector. In Proceedings of the Picmet 2010: Technology Management for Global Economic Growth, Phuket, Thailand, 18–22 July 2010. [Google Scholar]
- Hinz, V.; Ingerfurth, S. Does ownership matter under challenging conditions? On the relationship between organizational entrepreneurship and performance in the healthcare sector. Pub. Manag. Rev. 2013, 15, 969–991. [Google Scholar] [CrossRef]
- Leitao, J.; Franco, M. Individual entrepreneurship capacity and small and medium enterprises (SME) performance: A human and organizational capital approach. Afr. J. Bus. Manag. 2011, 5, 6350–6365. [Google Scholar]
- Felicio, J.A.; Goncalves, H.M.; Goncalves, V.D. Social value and organizational performance in non-profit social organizations: Social entrepreneurship, leadership, and socioeconomic Context effects. J. Bus. Res. 2013, 66, 2139–2146. [Google Scholar] [CrossRef]
- Mujtaba, M.; Mubarik, M.S. Talent management and organizational sustainability: Role of sustainable behavior. Int. J. Org. Anal. 2021. Ahead of publication. [Google Scholar] [CrossRef]
- Cable, D.; Turban, D. Establishing the dimensions, sources and value of jobseekers knowledge during recruitment. Res. Pers. Hum. Resour. Manag. 2001, 20, 115–163. [Google Scholar]
- Hosain, M.S.; Hossin, M.A.; Xiaohua, Y.; Aktaruzzaman, M.; Mustafi, M.A.A. Social networking information and pre-employment background checks: The mediating role of sustainable organizational reputation. Sustainability. 2020, 12, 3090. [Google Scholar] [CrossRef] [Green Version]
- Backhaus, K.; Tikoo, S. Conceptualizing and researching employer branding. Career Dev. Int. 2004, 9, 501–517. [Google Scholar] [CrossRef]
- Barrow, S.; Mosley, R. The Employer Brand®: Bringing the Best of Brand Management to People at Work; John Wiley & Sons Ltd.: Chichester, UK, 2005. [Google Scholar]
- Gultekin, E. What’s the Value of Your Employment Brand? LinkedIn Talent. 2011. Available online: https://business.linkedin.com/talent-solutions/blog/2011/12/whats-thevalue-of-your-employment-brand (accessed on 24 June 2021).
- Dögl, C.; Holtbrügge, D. Corporate environmental responsibility, employer reputation and Employee commitment: An empirical study in developed and emerging economies. Int. J. Hum. Resour. Manag. 2014, 25, 1739–1762. [Google Scholar] [CrossRef]
- Aboul-Ela, G.M.B.E. Employer branding: What constitutes “An Employer of choice?”. J. Bus. Retail Manag. Res. 2016, 11, 154–166. [Google Scholar]
- Kalidass, A.; Bahron, A. The relationship between perceived supervisor support, perceived organizational support, organizational commitment and employee turnover intention. Int. J. Bus. Adm. 2015, 6, 82–95. [Google Scholar] [CrossRef] [Green Version]
- Sekaran, U.; Bougie, R. Research Methods for Business: A Skill Building Approach; John Wiley & Sons Ltd.: London, UK, 2010. [Google Scholar]
- Blumberg, B.; Cooper, D.R.; Schindler, P.S. Business Research Methods, 11th ed.; McGraw Hill: New York, NY, USA, 2011. [Google Scholar]
- Sposito, V.A.; Hand, M.L.; Skarpness, B. On the efficiency of using the sample kurtosis in selecting optimal lp estimators. Commun. Stat. Simul. Comput. 1983, 12, 265–272. [Google Scholar] [CrossRef]
- Cook, R.D. Detection of influential observations in linear regression. Technometrics 1977, 19, 15–18. [Google Scholar] [CrossRef]
- Cook, R.D. Detection of influential observations in linear regression. J. Am. Stat. Assoc. 1979, 74, 169–174. [Google Scholar] [CrossRef]
- Hair, J.F.; Anderson, R.E.; Tatham, R.L.; Black, W.C. Multivariate Data Analysis; McGraw Hill: Upper Saddle River, NJ, USA, 1998. [Google Scholar]
- Fornell, C.; Larcker, D.F. Structural equation models with unobservable variables and measurement error: Algebra and statistics. J. Mark. Res. 1981, 33, 382–388. [Google Scholar] [CrossRef]
- Henseler, J.; Ringle, C.M.; Sinkovics, R.R. The use of partial least squares path modeling in international marketing. Adv. Int. Mark. 2009, 20, 277–319. [Google Scholar]
- Field, A. Discovering Statistics Using SPSS for Windows: Advanced Techniques for Beginners; Thousand Oaks: London UK; Sage Publications: New Delhi, India, 2000. [Google Scholar]
- MacCallum, R.C.; Widaman, K.F.; Zhang, S.; Hong, S. Sample size in factor analysis. Psychol. Methods 1999, 4, 84–99. [Google Scholar] [CrossRef]
- Kaiser, H.F. An index of factorial simplicity. Psychometrika. 1974, 39, 31–36. [Google Scholar] [CrossRef]
- Hair, J.F., Jr.; Black, W.C.; Babin, B.J.; Anderson, R.E. Multivariate Data Analysis: A Global Perspective, 7th ed.; Pearson Prentice Hall: Hoboken, NJ, USA, 2010. [Google Scholar]
- Marsh, H.W.; Hocevar, D. Application of confirmatory factor analysis to the study of self-concept: First-and higher order factor models and their invariance across groups. Psychol. Bull. 1985, 97, 562–582. [Google Scholar] [CrossRef]
- Jöreskog, K.G.; Sörbom, D. LISREL 8: Structural Equation Modeling with the SIMPLIS Command Language; Scientific Software International: London, UK, 1993. [Google Scholar]
- Anderson, J.C.; Gerbing, D.W. The effect of sampling error on convergence, improper solutions and goodness-of-fit indices for maximum likelihood confirmatory factor analysis. Psychometrika 1984, 49, 155–173. [Google Scholar] [CrossRef]
- Bentler, P.M. Comparative fit indexes in structural models. Psychol. Bull. 1990, 107, 238–246. [Google Scholar] [CrossRef]
- Hu, L.; Bentler, P. Cutoff criteria for fit indices in covariance structure analysis: Conventional criteria versus new alternatives. Struct. Equ. Modeling Multidiscip. J. 1999, 6, 1–55. [Google Scholar] [CrossRef]
- Browne, M.W.; Cudeck, R. Alternative ways of assessing model fit. Soc. Methods Res. 1993, 21, 230–258. [Google Scholar] [CrossRef]
- Henseler, J.; Ringle, C.M.; Sarstedt, M. A new criterion for assessing discriminant validity in variance-based structural equation modeling. J. Acad. Mark. Sci. 2015, 43, 115–123. [Google Scholar] [CrossRef] [Green Version]
- Kline, R. Principles and Practice of Structural Equation Modeling, 3rd ed.; Guilford Press: New York, NY, USA, 2011. [Google Scholar]
- Gold, A.H.; Malhotra, A.H.S. Knowledge management: An organizational capabilities perspective. J. Manag. Inf. Syst. 2001, 18, 185–214. [Google Scholar] [CrossRef]
- Hair, J.F.; Black, W.C.; Babin, B.J.; Anderson, R.E. Multivariate Data Analysis; Pearson Education Limited: San Francisco, CA, USA, 2014. [Google Scholar]
- Cohen, J. Statistical Power Analysis for the Behavioral Sciences; Erlbaum: Hillsdale, MI, USA, 1998. [Google Scholar]
- Chin, W.W. The Partial Least Square Approach to Structural Equation Modeling. In Modern Methods for Business Research; Laurence Erlbaum Associates: Mahwah, NJ, USA, 1988; Chapter 10. [Google Scholar]
- Falk, R.F.; Miller, N.B. A Primer for Soft Modeling; The University of Akron Press: Akron, OH, USA, 1992. [Google Scholar]
| Publisher’s Note: MDPI stays neutral with regard to jurisdictional claims in published maps and institutional affiliations. |
© 2021 by the authors. Licensee MDPI, Basel, Switzerland. This article is an open access article distributed under the terms and conditions of the Creative Commons Attribution (CC BY) license (https://creativecommons.org/licenses/by/4.0/).


 ,
, 
