
Electricity Markets Instability: Causes of Price Dispersion

 , ,
, ,  , , and
Abstract
:1. Introduction
2. Literature Review
3. Materials and Methods
- Commercially integrated markets, i.e., those between which there are commercial flows of electricity;
- Highly integrated markets, i.e., commercially integrated bidding zones the correlation between which is equal to or greater than 0.9;
- Moderately integrated markets, i.e., commercially integrated bidding zones the correlation between which is within the range from 0.8 to 0.9;
- Poorly integrated markets, i.e., commercially integrated bidding zones the correlation between which is within the range from 0.7 to 0.8;
- Non-integrated markets, i.e., commercially integrated bidding zones the correlation between which is less than 0.7.
4. Results
4.1. Price Dispersion Results
4.2. Price Dispersion within the Geographical Boundaries of Electricity Markets
4.3. Interrelation of Physical Orientation of Electricity Markets and Price Dispersion
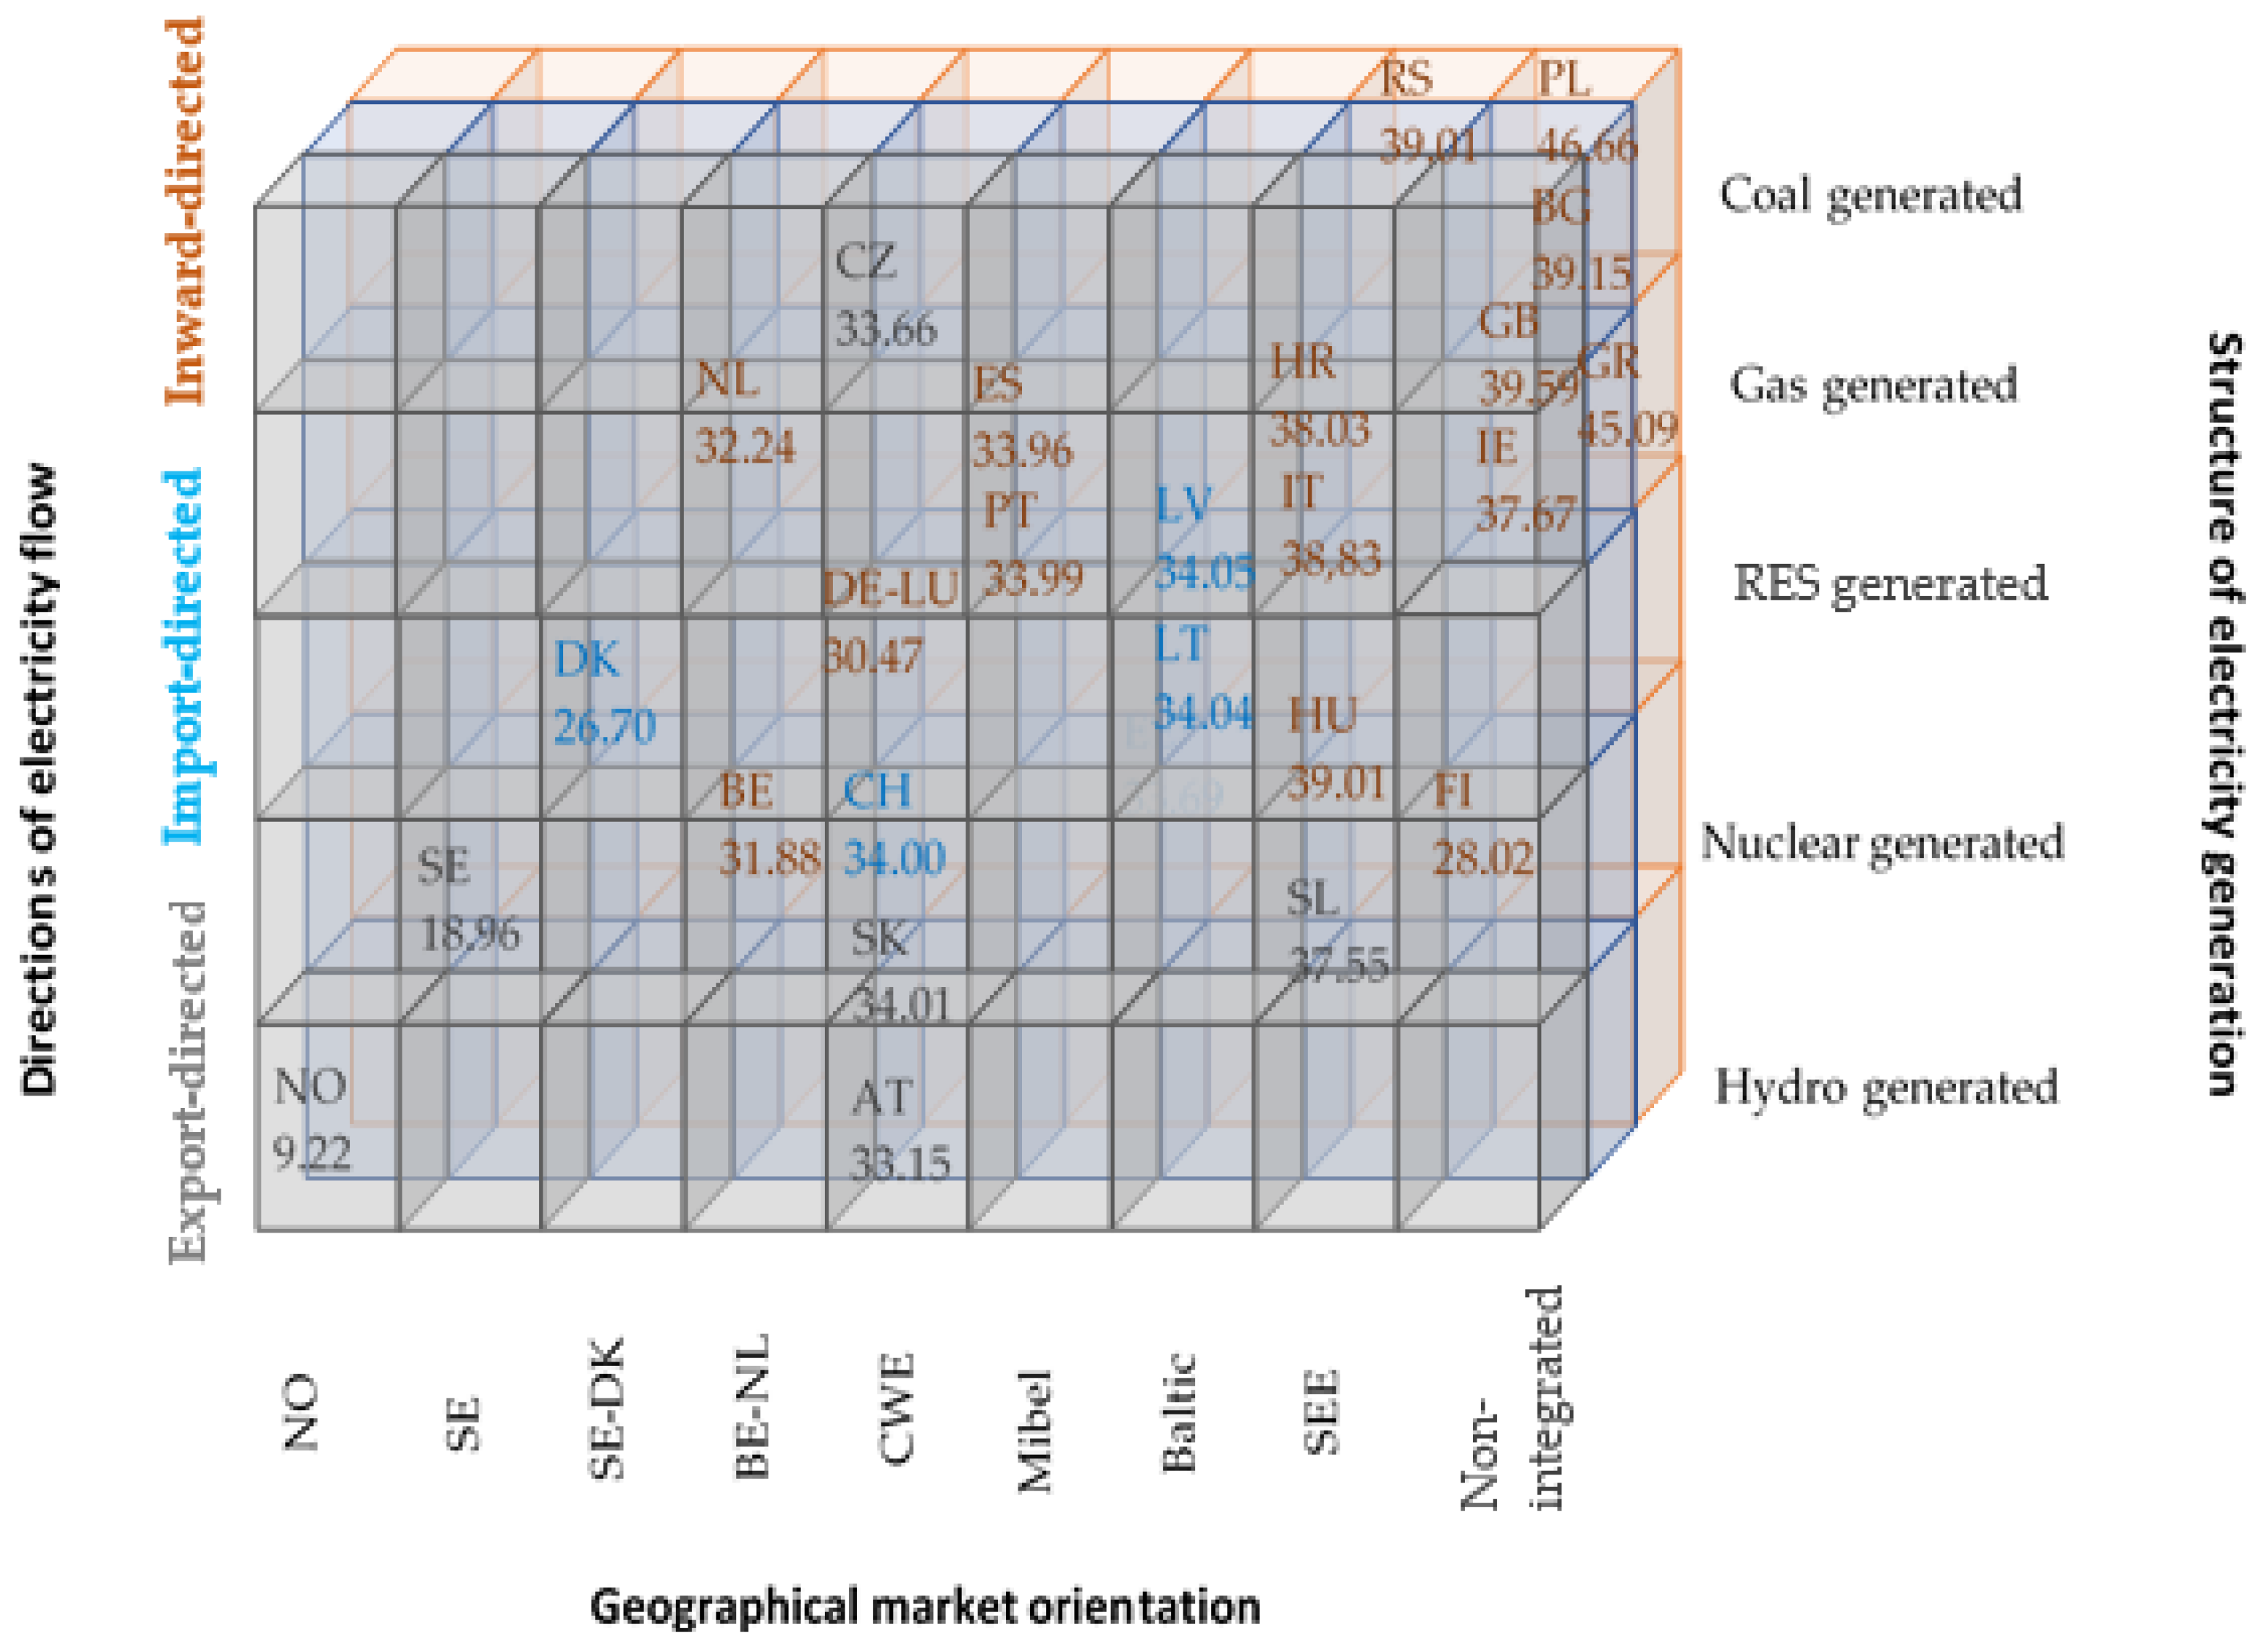
4.4. Constructing Positioning Matrix of Electricity Markets by Causes of Price Dispersion
5. Discussion and Conclusions
Supplementary Materials
Author Contributions
Funding
Data Availability Statement
Conflicts of Interest
Appendix A

| Bidding Zone | Mean, EUR/MWh | Min, EUR/MWh | Q1, EUR/MWh | Q2 (Median), EUR/MWh | Q3, EUR/MWh | Max (Q4), EUR/MWh | Variation, % | Coefficient of Kurtosis | Coefficient of Skewness |
|---|---|---|---|---|---|---|---|---|---|
| AT | 33.15 | −77.7 | 24.08 | 33.07 | 42.18 | 200.0 | 47.8 | 6.20 | 0.28 |
| BE | 31.88 | −115.3 | 21.6875 | 31.5 | 41.2 | 200.0 | 51.9 | 7.72 | 0.14 |
| BG | 39.15 | 0.0 | 27.83771 | 38.33 | 50.63146 | 130.0 | 45.2 | 2.20 | 0.67 |
| CH | 34.00 | −59.6 | 24.78 | 34.59 | 42.6025 | 126.7 | 43.4 | 3.30 | 0.27 |
| CZ | 33.56 | −65.0 | 23.7175 | 32.84 | 42.7 | 125.1 | 47.8 | 2.70 | 0.44 |
| DE-LU | 30.47 | −83.9 | 21.75 | 30.99 | 40.25 | 200.0 | 57.4 | 6.55 | -0.28 |
| DK1 | 24.99 | −58.8 | 12.295 | 23.86 | 35.8525 | 200.0 | 69.8 | 3.60 | 0.79 |
| DK2 | 28.41 | −42.7 | 15.08 | 25.48 | 38.82 | 254.4 | 69.4 | 10.52 | 1.86 |
| EE | 33.69 | −1.7 | 18.9675 | 32.07 | 45.64 | 255.0 | 63.6 | 13.06 | 2.04 |
| ES | 33.96 | 1.0 | 26.45 | 34.62 | 42 | 68.9 | 33.6 | -0.28 | -0.24 |
| FI | 28.02 | −1.7 | 12.7375 | 24.11 | 40.005 | 254.4 | 75.4 | 10.34 | 2.02 |
| GB | 39.59 | −43.3 | 29.89244 | 38.01 | 47.44736 | 387.7 | 46.7 | 35.11 | 2.86 |
| GR | 45.09 | 0.0 | 34.21 | 42.58 | 53 | 150.1 | 37.8 | 2.78 | 1.09 |
| HR | 38.03 | −23.5 | 27.5075 | 36.97 | 46.3275 | 172.1 | 44.1 | 6.01 | 1.26 |
| HU | 39.01 | −8.1 | 27.8375 | 37.205 | 47.465 | 150.0 | 45.1 | 4.23 | 1.29 |
| IT Center-North | 38.71 | 0.0 | 28.5275 | 38.205 | 46.8525 | 163.1 | 38.2 | 2.03 | 0.71 |
| IT Center-South | 39.67 | 0.0 | 29.39 | 39.685 | 48.17 | 163.1 | 38.0 | 1.58 | 0.55 |
| IT North | 37.79 | 0.0 | 27.81 | 37.3 | 45.84 | 163.1 | 38.2 | 2.25 | 0.74 |
| IT Sardinia | 38.97 | 0.0 | 28.5675 | 39.27 | 48.1325 | 449.0 | 42.2 | 44.62 | 1.97 |
| IT Sicily | 46.21 | 0.0 | 29.0975 | 41.39 | 61.685 | 155.0 | 50.7 | 0.25 | 0.75 |
| IT South | 39.00 | 0.0 | 28.8775 | 39.12 | 47.8125 | 163.1 | 38.1 | 1.12 | 0.38 |
| LT | 34.04 | −1.7 | 19.7425 | 33.035 | 45.7425 | 255.0 | 61.4 | 12.49 | 1.91 |
| LV | 34.05 | −1.7 | 19.7775 | 33.04 | 45.71 | 255.0 | 61.3 | 12.55 | 1.91 |
| NL | 32.24 | −79.2 | 22.9 | 31.67 | 40.19 | 200.0 | 47.5 | 7.06 | 0.92 |
| NO1 | 9.29 | −1.7 | 1.99 | 6.96 | 13.5525 | 99.9 | 89.1 | 10.02 | 1.87 |
| NO2 | 9.29 | −1.7 | 2.13 | 6.95 | 13.5525 | 99.9 | 88.9 | 10.10 | 1.88 |
| NO3 | 9.46 | 0.0 | 3.79 | 7.5 | 13.9325 | 57.0 | 73.1 | 0.96 | 1.03 |
| NO4 | 8.88 | 0.0 | 3.6975 | 7.42 | 12.63 | 57.0 | 73.0 | 1.93 | 1.24 |
| NO5 | 9.17 | −0.1 | 1.92 | 6.855 | 13.5425 | 99.9 | 86.2 | 4.13 | 1.27 |
| PL | 46.66 | 11.4 | 38.65 | 45.64 | 53.83 | 147.9 | 26.5 | 1.02 | 0.32 |
| PT | 33.99 | 1.0 | 26.51 | 34.64 | 41.94 | 68.9 | 33.1 | -0.27 | -0.26 |
| RO | 39.49 | 0.0 | 28.01342 | 37.8672 | 48.16876 | 150.0 | 44.8 | 3.88 | 1.23 |
| RS | 39.01 | 0.9 | 28.1575 | 37.56 | 47.14 | 165.6 | 42.4 | 5.06 | 1.28 |
| SE1 | 14.39 | −1.7 | 5.93 | 12.145 | 19.9025 | 189.3 | 80.0 | 21.17 | 2.87 |
| SE2 | 14.39 | −1.7 | 5.93 | 12.145 | 19.9025 | 189.3 | 80.0 | 21.16 | 2.87 |
| SE3 | 21.19 | −1.7 | 7.59 | 16.745 | 27.865 | 254.4 | 91.0 | 14.20 | 2.64 |
| SE4 | 25.86 | −2.0 | 10.07 | 22.3 | 37.24 | 254.4 | 78.1 | 9.67 | 1.92 |
| SEM | 37.67 | −41.1 | 27 | 35.64 | 45.925 | 378.1 | 61.1 | 18.08 | 2.23 |
| SK | 34.01 | −65.0 | 23.885 | 33.055 | 43.1 | 125.1 | 48.3 | 2.46 | 0.48 |
| SL | 37.55 | −23.5 | 27.09 | 36.6 | 45.8625 | 172.1 | 43.3 | 5.73 | 1.15 |
| pan-European | 31.10 | −115.3 | 17 | 30.49 | 43 | 449.0 | 62.8 | 5.95 | 1.01 |
Appendix B
| Bidding Zone | The Probability of Falling into Quartile | Belonging to Quartile | |||
|---|---|---|---|---|---|
| Q1 | Q2 | Q3 | Q4 | ||
| AT | 8% | 59% | 32% | 1% | 2 |
| BE | 14% | 61% | 19% | 5% | 2 |
| BG | 7% | 22% | 23% | 48% | 4 |
| CH | 7% | 38% | 39% | 16% | 3 |
| CZ | 8% | 45% | 33% | 13% | 2 |
| DE-LU | 16% | 62% | 20% | 2% | 2 |
| DK1 | 50% | 39% | 10% | 1% | 1 |
| DK2 | 39% | 40% | 13% | 7% | 2 |
| EE | 32% | 27% | 14% | 27% | 1 |
| ES | 17% | 35% | 26% | 22% | 2 |
| FI | 51% | 22% | 10% | 16% | 1 |
| GB | 5% | 20% | 27% | 48% | 4 |
| GR | 4% | 12% | 17% | 67% | 4 |
| HR | 3% | 33% | 51% | 13% | 3 |
| HU | 2% | 19% | 38% | 41% | 4 |
| IT Center-North | 3% | 24% | 51% | 22% | 3 |
| IT Center-South | 4% | 22% | 44% | 30% | 3 |
| IT North | 4% | 28% | 53% | 15% | 3 |
| IT Sardinia | 6% | 22% | 42% | 29% | 3 |
| IT Sicily | 6% | 17% | 28% | 49% | 4 |
| IT South | 7% | 23% | 41% | 29% | 3 |
| LT | 29% | 29% | 14% | 28% | 1 |
| LV | 29% | 29% | 14% | 28% | 1 |
| NL | 14% | 62% | 19% | 5% | 2 |
| NO1 | 94% | 5% | 0% | 0% | 1 |
| NO2 | 94% | 5% | 0% | 0% | 1 |
| NO3 | 96% | 4% | 0% | 0% | 1 |
| NO4 | 96% | 4% | 0% | 0% | 1 |
| NO5 | 94% | 5% | 0% | 0% | 1 |
| PL | 0% | 7% | 16% | 76% | 4 |
| PT | 17% | 35% | 26% | 22% | 2 |
| RO | 2% | 18% | 35% | 44% | 4 |
| RS | 2% | 17% | 37% | 45% | 4 |
| SE1 | 95% | 3% | 1% | 0% | 1 |
| SE2 | 95% | 3% | 1% | 0% | 1 |
| SE3 | 80% | 12% | 4% | 4% | 1 |
| SE4 | 59% | 27% | 7% | 6% | 1 |
| SEM | 17% | 21% | 19% | 43% | 4 |
| SK | 7% | 44% | 34% | 15% | 2 |
| SL | 3% | 34% | 53% | 11% | 3 |
Appendix C
| Bidding Zone | Commercially Integrated Bidding Zones | Highly Integrated Bidding Zones | Moderately Integrated Bidding Zones | Poorly Integrated Bidding Zones | Non-Integrated Bidding Zones | |||||
|---|---|---|---|---|---|---|---|---|---|---|
| AT | 6 | CH, CZ, DE_LU, HU, IT N, SL | 3 | CH, CZ, DE_LU | 3 | HU, IT N, SL | 0 | ‒ | 0 | ‒ |
| BE | 4 | DE_LU, GB, NL | 1 | NL | 1 | DE-LU | 1 | GB | 0 | |
| BG | 3 | GR, RO, RS | 0 | ‒ | 2 | RO, RS | 0 | ‒ | 1 | GR |
| CH | 3 | AT, DE_LU, IT N | 2 | AT, IT N | 1 | DE_LU | 0 | ‒ | 0 | ‒ |
| CZ | 4 | AT, DE_LU, PL, SK | 2 | AT, SK | 1 | DE_LU | 1 | PL | 0 | ‒ |
| DE-LU | 10 | AT, BE, CH, CZ, DK1, DK2, NL, NO2, PL, SE4 | 1 | AT | 5 | BE, CH, CZ, DK1, NL | 1 | DK2 | 3 | NO2, PL, SE4 |
| DK1 | 5 | DE_LU, DK2, NL, NO2, SE3 | 0 | ‒ | 2 | DE_LU, DK2 | 1 | NL | 2 | NO2, SE3 |
| DK2 | 3 | DE_LU, DK1, SE4 | 1 | SE4 | 1 | DK1 | 1 | DE-LU | 0 | ‒ |
| EE | 2 | FI, LV | 1 | LV | 1 | FI | 0 | ‒ | 0 | ‒ |
| ES | 2 | PT | 1 | PT | 0 | ‒ | 0 | ‒ | 0 | ‒ |
| FI | 3 | EE, SE1, SE3 | 0 | ‒ | 2 | EE, SE3 | 0 | ‒ | 1 | SE1 |
| GB | 3 | BE, NL, SEM | 0 | ‒ | 1 | SEM | 2 | BE, NL | 0 | ‒ |
| GR | 2 | BG, IT S | 0 | ‒ | 0 | ‒ | 0 | ‒ | 2 | BG, IT S |
| HR | 3 | HU, RS, SL | 3 | HU, RS, SL | 0 | ‒ | 0 | ‒ | 0 | ‒ |
| HU | 5 | AT, HR, RO, RS, SK | 3 | HR, RO, RS | 2 | AT, SK | 0 | ‒ | 0 | ‒ |
| IT C.-N. | 1 | IT N | 1 | IT N | 0 | ‒ | 0 | ‒ | 0 | ‒ |
| IT C.-S. | 3 | IT C_N, IT Sar, IT S | 3 | IT C_N, IT Sar, IT S | 0 | ‒ | 0 | ‒ | 0 | ‒ |
| IT N | 2 | IT C_N, SL | 2 | IT C_N, SL | 0 | ‒ | 0 | ‒ | 0 | ‒ |
| IT Sar. | 1 | IT C_S | 1 | IT C_S | 0 | ‒ | 0 | ‒ | 0 | ‒ |
| IT Sic. | 1 | IT S | 0 | ‒ | 1 | IT S | 0 | ‒ | 0 | ‒ |
| IT South | 1 | IT C_S, IT Sic | 1 | IT C_S | 1 | IT Sic | 0 | ‒ | 0 | ‒ |
| LT | 3 | LV, PL, SE4 | 1 | LV | 0 | ‒ | 2 | PL, SE4 | 0 | ‒ |
| LV | 2 | EE, LT | 2 | EE, LT | 0 | ‒ | 0 | ‒ | 0 | ‒ |
| NL | 5 | BE, DE_LU, DK1, GB, NO2 | 1 | BE | 2 | DE_LU | 2 | DK1, GB | 0 | ‒ |
| NO1 | 4 | NO2, NO3, NO5, SE3 | 2 | NO2, NO5 | 1 | NO3 | 0 | ‒ | 1 | SE3 |
| NO2 | 5 | DE_LU, DK1, NL, NO1, NO5 | 2 | NO1, NO5 | 0 | ‒ | 0 | ‒ | 3 | DE_LU, DK1, NL |
| NO3 | 4 | NO1, NO4, NO5, SE2 | 2 | NO4, NO5 | 1 | NO1 | 0 | ‒ | 1 | SE2 |
| NO4 | 3 | NO3, SE1, SE2 | 1 | NO3 | 0 | ‒ | 0 | ‒ | 2 | SE1, SE2 |
| NO5 | 3 | NO1, NO2, NO3 | 3 | NO1, NO2, NO3 | 0 | ‒ | 0 | ‒ | 0 | ‒ |
| PL | 5 | CZ, DE_LU, LT, SE4, SK | 0 | ‒ | 0 | ‒ | 3 | CZ, LT, SK | 2 | DE_LU, SE4 |
| PT | 1 | ES | 1 | ES | 0 | ‒ | 0 | ‒ | 0 | ‒ |
| RO | 3 | BG, HU, RS | 2 | HU, RS | 1 | BG | 0 | ‒ | 0 | ‒ |
| RS | 4 | BG, HR, HU, RO | 3 | HR, HU, RO | 1 | BG | 0 | ‒ | 0 | ‒ |
| SE1 | 3 | FI, NO4, SE2 | 1 | SE2 | 0 | ‒ | 0 | ‒ | 2 | FI, NO4 |
| SE2 | 4 | NO3, NO4, SE1, SE3 | 1 | SE1 | 0 | ‒ | 0 | ‒ | 3 | NO3, NO4, SE3 |
| SE3 | 5 | DK1, FI, NO1, SE2, SE4 | 0 | ‒ | 2 | FI, SE4 | 1 | DK1 | 2 | NO1, SE2 |
| SE4 | 5 | DE_LU, DK2, LT, PL, SE3 | 1 | DK2 | 1 | SE3 | 1 | LT | 3 | DE_LU, LT, PL |
| SEM | 1 | GB | 0 | ‒ | 1 | GB | 0 | ‒ | 0 | ‒ |
| SK | 3 | CZ, HU, PL | 1 | CZ | 1 | HU | 1 | PL | 0 | ‒ |
| SL | 3 | AT, HR, IT N | 2 | HR, IT N | 1 | AT | 0 | ‒ | 0 | ‒ |
Appendix D

References
- Hoang, L.N. Regulation of Electricity Markets. Available online: https://www.science4all.org/article/electricity-markets/ (accessed on 1 June 2021).
- Erdmann, G. Economics of electricity. In Proceedings of the EPJ Web of Conferences, Berlin, Germany, 27 August 2015; p. 06001. [Google Scholar]
- Cramton, P. Electricity market design. Oxf. Rev. Econ. Policy 2017, 33, 589–612. [Google Scholar] [CrossRef] [Green Version]
- Chindarkar, N.; Thampapillai, D.J. Rethinking Teaching of Basic Principles of Economics from a Sustainability Perspective. Sustainability 2018, 10, 1486. [Google Scholar] [CrossRef] [Green Version]
- Bichpuriya, Y.K.; Soman, S.A. Electric Power Exchanges: A Review. In Proceedings of the 16th National Power Systems Conference, University College of Engineering Osmania University, Mumbai, India, 15–17 December 2010; pp. 115–120. [Google Scholar]
- Shah, D.; Chatterjee, S. A comprehensive review on day-ahead electricity market and important features of world’s major electric power exchanges. Electr. Energy Syst. 2020, 30, e12360. [Google Scholar] [CrossRef]
- Yang, Y.; Bao, M.; Ding, Y.; Song, Y.; Lin, Z.; Shao, C. Review of Information Disclosure in Different Electricity Markets. Energies 2018, 11, 3424. [Google Scholar] [CrossRef] [Green Version]
- Moiseeva, E.; Hesamzadeh, M.R.; Bunn, D.W.; Biggar, D.R. The Strategic Effects of Lack of Transparency in Forward Contracting by Generators with Market Power, Working Paper #106; Program on Energy and Sustainable Development, Stanford University: Stanford, CA, USA, 2018; Available online: https://pesd.fsi.stanford.edu/publication/strategic-effects-lack-transparency-and-forward-contracting-generators-market-power (accessed on 1 June 2021).
- Moret, F.; Pinson, P.; Papakonstantinou, A. Heterogeneous risk preferences in community-based electricity markets. Eur. J. Oper. Res. 2020, 287, 36–48. [Google Scholar] [CrossRef]
- Hughes, J.E.; Lange, I. Who (Else) Benefits from Electricity Deregulation? Coal Prices, Natural Gas, and Price Discrimination. Econ. Inq. 2020, 58, 1053–1075. [Google Scholar] [CrossRef]
- Ohlhausen, M.K.; Bushnell, J.; Wolak, F. Case Studies: Electricity (Panel Transcript). In Competition as Public Policy; Fusilier, H.L., Ed.; American Bar Association; ABA Publishing: Chicago, IL, USA, 1971; pp. 209–240. [Google Scholar]
- Cicchetti, C.J.; Gillen, W.J.; Smolensky, P. The Marginal Costs and Pricing of Electricity: An Applied Approach; Ballinger Publishing Company: Sacramento, CA, USA, 1977. [Google Scholar]
- Dutton, J. EU Energy Policy and the Third Package, EPG Working Paper; UK Energy Research Centre, 2015. Available online: http://www.ukerc.ac.uk/publications/eu-energy-policy-and-the-third-package-working-paper.html (accessed on 18 April 2021).
- Nouicer, A. The EU Clean Energy Package; Technical Report; Florence School of Regulation: Florence, Italy, 2018. [Google Scholar]
- Kyzym, M.O.; Salashenko, T.I. Competitive Electricity Markets: Theoretical Approaches and Formation Models. Probl. Econ. 2020, 2, 130–143. [Google Scholar] [CrossRef]
- Regulation (EU) 2015/1222 of 24 July 2015 Establishing a Guideline on Capacity Allocation and Congestion Management. EUR-LEX. Available online: https://eur-lex.europa.eu/legal-content/EN/TXT/?uri=CELEX%3A32015R1222 (accessed on 20 April 2021).
- Overview of European Electricity Markets, METIS Technical Note T4; European Commission, 2016. Available online: https://ec.europa.eu/energy/sites/ener/files/documents/metis_technical_note_t4_-_overview_of_european_electricity_market.pdf (accessed on 25 April 2021).
- ENTSO-E Transparency Platform. Available online: https://transparency.entsoe.eu/ (accessed on 1 June 2021).
- Gas and Electricity Market Reports. European Commission. Available online: https://ec.europa.eu/energy/data-analysis/market-analysis_en/ (accessed on 1 June 2021).
- Stigler, G.J. The Economics of Information. J. Political Econ. 1961, 69, 213–225. [Google Scholar] [CrossRef]
- Lippman, S.S.; McCall, J.J. Information, Economics of. In International Encyclopedia of the Social & Behavioral Sciences; Elsevier: Amsterdam, The Netherland, 2001; pp. 7480–7486. [Google Scholar]
- Reinganum, J.F. A Simple Model of Equilibrium Price Dispersion. J. Political Econ. 1979, 87, 851–858. [Google Scholar] [CrossRef] [Green Version]
- Jost, B.W. Price Dispersion, Search Costs and Spatial Competition: Evidence from the Austrian Retail Gasoline Market. NEURUS Netw. Eur. US Reg. Urban Stud. 2012, 166, 1–42. [Google Scholar]
- Frank, A.W. Market Design and Price Behavior in Restructured Electricity Markets an International Comparison. In Deregulation and Interdependence in the Asia-Pacific Region; Ito, T., Krueger, A.O., Eds.; University of Chicago Press: Chicago, IL, USA, 2007; pp. 79–138. [Google Scholar]
- Tangeras, T.P.; Wolak, F.A. The Competitive Effects of Linking Electricity Markets Across Space. IFN Working Paper. No. 1184; Research Institute of Industrial Economics: Stockholm, Sweden, 2017; p. 43. [Google Scholar]
- Benini, M.; Marracci, M.; Pelacchi, P.; Venturini, A. Day-ahead market price volatility analysis in deregulated electricity markets. In Proceedings of the IEEE Power Engineering Society Summer Meeting, Chicago, IL, USA, 21–25 July 2002; Volume 3, pp. 1354–1359. [Google Scholar]
- Hirth, L. What caused the drop in European electricity prices? A factor decomposition analysis. Energy J. 2018, 1, 143–157. [Google Scholar] [CrossRef] [Green Version]
- Mosquera-López, S.; Nursimulu, A. Drivers of electricity price dynamics: Comparative analysis of spot and futures markets. Energy Policy 2019, 126, 76–87. [Google Scholar] [CrossRef]
- Li, Y.; Flynn, P. Deregulated power prices: Comparison of volatility. Energy Policy 2004, 32, 1591–1601. [Google Scholar] [CrossRef]
- Huisman, R.; Huurman, C.; Mahieu, R.J. Hourly Electricity Prices in Day-Ahead Markets. Energy Econ. 2007, 29, 240–248. [Google Scholar]
- Božić, Z.; Dobromirov, D.; Arsić, J.; Radišić, M.; Ślusarczyk, B. Power Exchange Prices: Comparison of Volatility in European Markets. Energies 2020, 13, 5620. [Google Scholar] [CrossRef]
- Bosco, B.; Parisio, L.; Pelagatti, M.; Baldi, F. Long-run relations in European electricity prices. J. Appl. Econ. 2010, 25, 805–832. [Google Scholar] [CrossRef]
- Gugler, K.; Haxhimusa, A.; Liebensteiner, M. Integration of European Electricity Markets: Evidence from Spot Prices. Energy J. 2018, 39, 97–116. [Google Scholar] [CrossRef]
- Apergis, N.; Baruník, J.; Lau, M.C.K. Good volatility, bad volatility: What drives the asymmetric connectedness of Australian electricity markets? Energy Econ. 2017, 66, 108–115. [Google Scholar] [CrossRef]
- Mayer, K.; Trück, S. Electricity markets around the world. J. Commod. Mark. 2018, 9, 77–100. [Google Scholar] [CrossRef]
- Li, K.; Cursio, J.D.; Jiang, M.; Liang, X. The significance of calendar effects in the electricity market. Appl. Energy 2019, 235, 487–494. [Google Scholar] [CrossRef] [Green Version]
- Dong, S.; Li, H.; Wallin, F.; Avelin, A.; Zhang, Q.; Yu, Z. Volatility of electricity price in Denmark and Sweden. Energy Procedia 2019, 158, 4331–4337. [Google Scholar] [CrossRef]
- Makalska, T.; Varfolomejeva, R.; Oleksijs, R. The Impact of Wind Generation on the Spot Market Electricity Pricing. In Proceedings of the 2018 IEEE International Conference on Environment and Electrical Engineering and 2018 IEEE Industrial and Commercial Power Systems Europe, Palermo, Italy, 12–15 June 2018; pp. 1–6. [Google Scholar]
- Shinde, P.; Amelin, M.A. Literature Review of Intraday Electricity Markets and Prices. In Proceedings of the 2019 IEEE Milan PowerTech, Milano, Italy, 23–27 June 2019; pp. 1–6. [Google Scholar]
- Zielke, M.; Brooks, A.; Nemet, G. The Impacts of Electric Vehicle Growth on Wholesale Electricity Prices in Wisconsin. World Electr. Veh. J. 2020, 11, 32. [Google Scholar] [CrossRef] [Green Version]
- Kumar, R. Stock Markets, Derivatives Markets, and Foreign Exchange Markets. In Strategies of Banks and Other Financial Institutions: Theories and Cases; Academic Press: Cambridge, MA, USA, 2014; pp. 125–164. [Google Scholar]
- Zachmann, G. Convergence of Electricity Wholesale Prices in Europe? A Kalman Filter Approach. DIW Discuss. Pap. 2005, 512, 27. [Google Scholar]
- Robinson, T. The convergence of electricity prices in Europe. Appl. Econ. Lett. 2007, 14, 473–476. [Google Scholar] [CrossRef]
- Silva, P.P.; Soares, I. EU spot prices and industry structure: Assessing electricity market integration. Int. J. Energy Sect. Manag. 2008, 2, 340–350. [Google Scholar] [CrossRef]
- Zachmann, G. Electricity wholesale market prices in Europe: Convergence? Energy Econ. 2008, 30, 1659–1671. [Google Scholar] [CrossRef]
- Hieberding, J.F. The Role of Price Tests in Market Definition. HMG Review Project—Comment, Project No. P092900. 2009. Available online: https://northcoasteconomics.com/wp-content/uploads/2021/04/The-Role-of-Price-Tests-in-Market-Definition-James-F-Nieberding.pdf (accessed on 1 June 2021).
- Shore, J.C. Market formation as transitive closure: The evolving pattern of trade in music. Netw. Sci. 2016, 4, 164–187. [Google Scholar] [CrossRef] [Green Version]
- Vogel, J. Spatial Price Discrimination with Heterogeneous Firms. J. Ind. Econ. 2011. 59, 661–676.
- Hobbs, B.F. Mill Pricing Versus Spatial Price Discrimination under Bertrand and Cournot Spatial Competition. J. Ind. Econ. 1986, 35, 173–191. [Google Scholar] [CrossRef]
- Hunold, M.; Muthers, J. Spatial competition and price discrimination with capacity constraints. Int. J. Ind. Organ. 2019, 67, 102524. [Google Scholar] [CrossRef] [Green Version]
- Bonett, D.G. Confidence interval for a coefficient of quartile variation. Comput. Stat. Data Anal. 2006, 50, 2953–2957. [Google Scholar] [CrossRef]
- Bastianin, A. Robust Measures of Skewness and Kurtosis for Macroeconomic and Financial Time Series; University of Milano-Bicocca, Department of Economics: Milan, Italy, 2019. [Google Scholar] [CrossRef] [Green Version]
- Bobinaitė, V.; Juozapavičienė, A.; Snieška, V. Correlation of Electricity Prices in European Wholesale Power Markets. Eng. Econ. 2006, 4, 7–14. [Google Scholar]
- Tashpulatov, S.N. Modeling and Estimating Volatility of Day-Ahead Electricity Prices. Mathematics 2021, 9, 750. [Google Scholar] [CrossRef]
- Purdom, P. A transitive closure algorithm. BIT Numer. Math. 1970, 10, 76–94. [Google Scholar] [CrossRef] [Green Version]
- Janssens, W.; Pelsmacker, P.; Wijnen, K.; Kenhove, P. Marketing Research with SPSS; Pearson Education: London, UK, 2008; p. 441. [Google Scholar]
- Saueressig, G.G.; Paris, A.; Bauer, J.M.; Luchese, J.; Sellitto, M.A.; Antunes, J.A.V. Strategic Materials Positioning Matrix: An Application in the Automotive Industry in Southern Brazil. Int. J. Ind. Eng. Manag. 2017, 8, 77–89. [Google Scholar]
- Malega, P.; Rudy, V.; Kovac, J.; Kovac, J. The Competitive Market Map as the Basis for an Evaluation of the Competitiveness of the Slovak Republic on an International Scale. J. Compet. 2019, 11, 103–119. [Google Scholar] [CrossRef]
| Hypothesis | Tasks | Theoretical Background | Method | Database 1 |
|---|---|---|---|---|
| Electricity prices are dispersed in the European space | Assessing quartiles of price electricity dispersion by bidding zones in the European space | Price dispersion | Statistical analysis | Day-ahead prices |
| Market integration reduces price dispersion | Determining geographical boundaries of the electricity markets | Price convergence | Correlation analysis Transitive closure | Day-ahead prices, scheduled commercial exchanges |
| Price dispersion on electricity markets is caused by their market conditions | Clustering bidding zones with similar parameters of physical flows of electricity | Spatial price discrimination | Cluster analysis | Cross-border physical flow Actual generation per production type |
| Price dispersion across electricity markets is a consequence of a simultaneous action of several causes | Constructing a positioning matrix of electricity markets by causes of price dispersion | ‒ | Positioning matrix | Results of the previous research |
| Quartile | Bidding Zones | Average Annual Electricity Price by Quartile, EUR/MWh | Price Range within Quartile, % | Coefficient of Variation | |
|---|---|---|---|---|---|
| Max | Min | ||||
| Q1 | DK1, EE, FI, LT, LV, NO1, NO2, NO3, NO4, NO5, SE1, SE2, SE3, SE4 | 19.76 | 283 | 0.61 | 0.91 |
| Q2 | AT, BE, CZ, DE-LU, DK2, ES, NL, PT, SK | 32.41 | 20 | 0.33 | 0.69 |
| Q3 | CH, HR, IT C.-N., IT C.-S., IT N., IT Sar., IT South, SL | 37.97 | 17 | 0.38 | 0.44 |
| Q4 | BG, GB, GR, HU, IT Sic., PL, RO, RS, SEM | 41.32 | 24 | 0.26 | 0.61 |
| Bidding Zones | Average Annual Electricity Price, EUR/MWh | Price Range, % | Coefficient of Variation | Market Quartile Range | |
|---|---|---|---|---|---|
| Max | Min | ||||
| Highly integrated markets | |||||
| AT, CH, CZ, DE-LU, SK | 33.04 | 12 | 0.43 | 0.57 | 2−3 |
| BE, NL | 32.06 | 1 | 0.48 | 0.52 | 2 |
| DK2, SE3, SE4 | 25.15 | 34 | 0.69 | 0.91 | 1−2 |
| EE, LT, LV | 33.93 | 1 | 0.61 | 0.64 | 1 |
| ES, PT | 33.97 | 0 | 0.33 | 0.34 | 2 |
| HR, HU, RS, SL, RO, IT N, IT C-N, IT C-S, IT S, IT Sar | 38.72 | 10 | 0.38 | 0.45 | 3−4 |
| NO1, NO2, NO3, NO4, NO5 | 9.22 | 7 | 0.73 | 0.89 | 1 |
| SE1, SE2 | 14.39 | 0 | 0.80 | 0.80 | 1 |
| Moderately integrated markets | |||||
| AT, HU, SL, SK | 35.93 | 18 | 0.43 | 0.48 | 2−4 |
| BE, DE-LU, CH, CZ, DK1, DK2, NL | 30.73 | 36 | 0.43 | 0.70 | 1−3 |
| BG, RO, RS | 39.21 | 1 | 0.42 | 0.45 | 4 |
| EE, FI, SE3 | 27.63 | 59 | 0.64 | 0.91 | 1 |
| GB, SEM | 38.53 | 5 | 0.47 | 0.61 | 4 |
| IT S, IT Sicily | 42.61 | 18 | 0.38 | 0.51 | 3−4 |
| Poorly integrated markets | |||||
| BE, GB, NL, DK1, SE3 | 29.98 | 87 | 0.21 | 0.4 | 1−4 |
| DE-LU, DK2 | 29.44 | 7 | 0.28 | 0.30 | 2 |
| LT, PL, SE4, SK | 35.14 | 80 | 0.26 | 0.47 | 1−4 |
| Non-integrated markets | |||||
| GR | 45.09 | ‒ | 0.38 | 4 | |
| Cluster Name | Export-Directed | Import-Directed | Inward-Directed | |
|---|---|---|---|---|
| Countries | AT, CZ, NO, SE, SK, SL | CH, DK, EE, HR, LT, LV | BE, BG, DE with LU, ES, FI, GB, GR, HU, IE, IT, NL, PL, PT, RO, RS | |
| Mean values inside the cluster, % | Import | 40 | 68 | 10 |
| Export | 46 | 45 | 13 | |
| Net generation | 119 | 67 | 93 | |
| Average annual electricity price, EUR/MWh | 20.01 | 32.46 | 37.88 | |
| Price range, % | 323 | 52 | 67 | |
| Coefficient of variation | min | 0.43 | 0.43 | 0.26 |
| max | 0.90 | 0.70 | 0.75 | |
| Distribution by quartiles, % | Q1 | 33 | 57 | 7 |
| Q2 | 50 | 14 | 33 | |
| Q3 | 17 | 29 | 7 | |
| Q4 | 0 | 0 | 53 | |
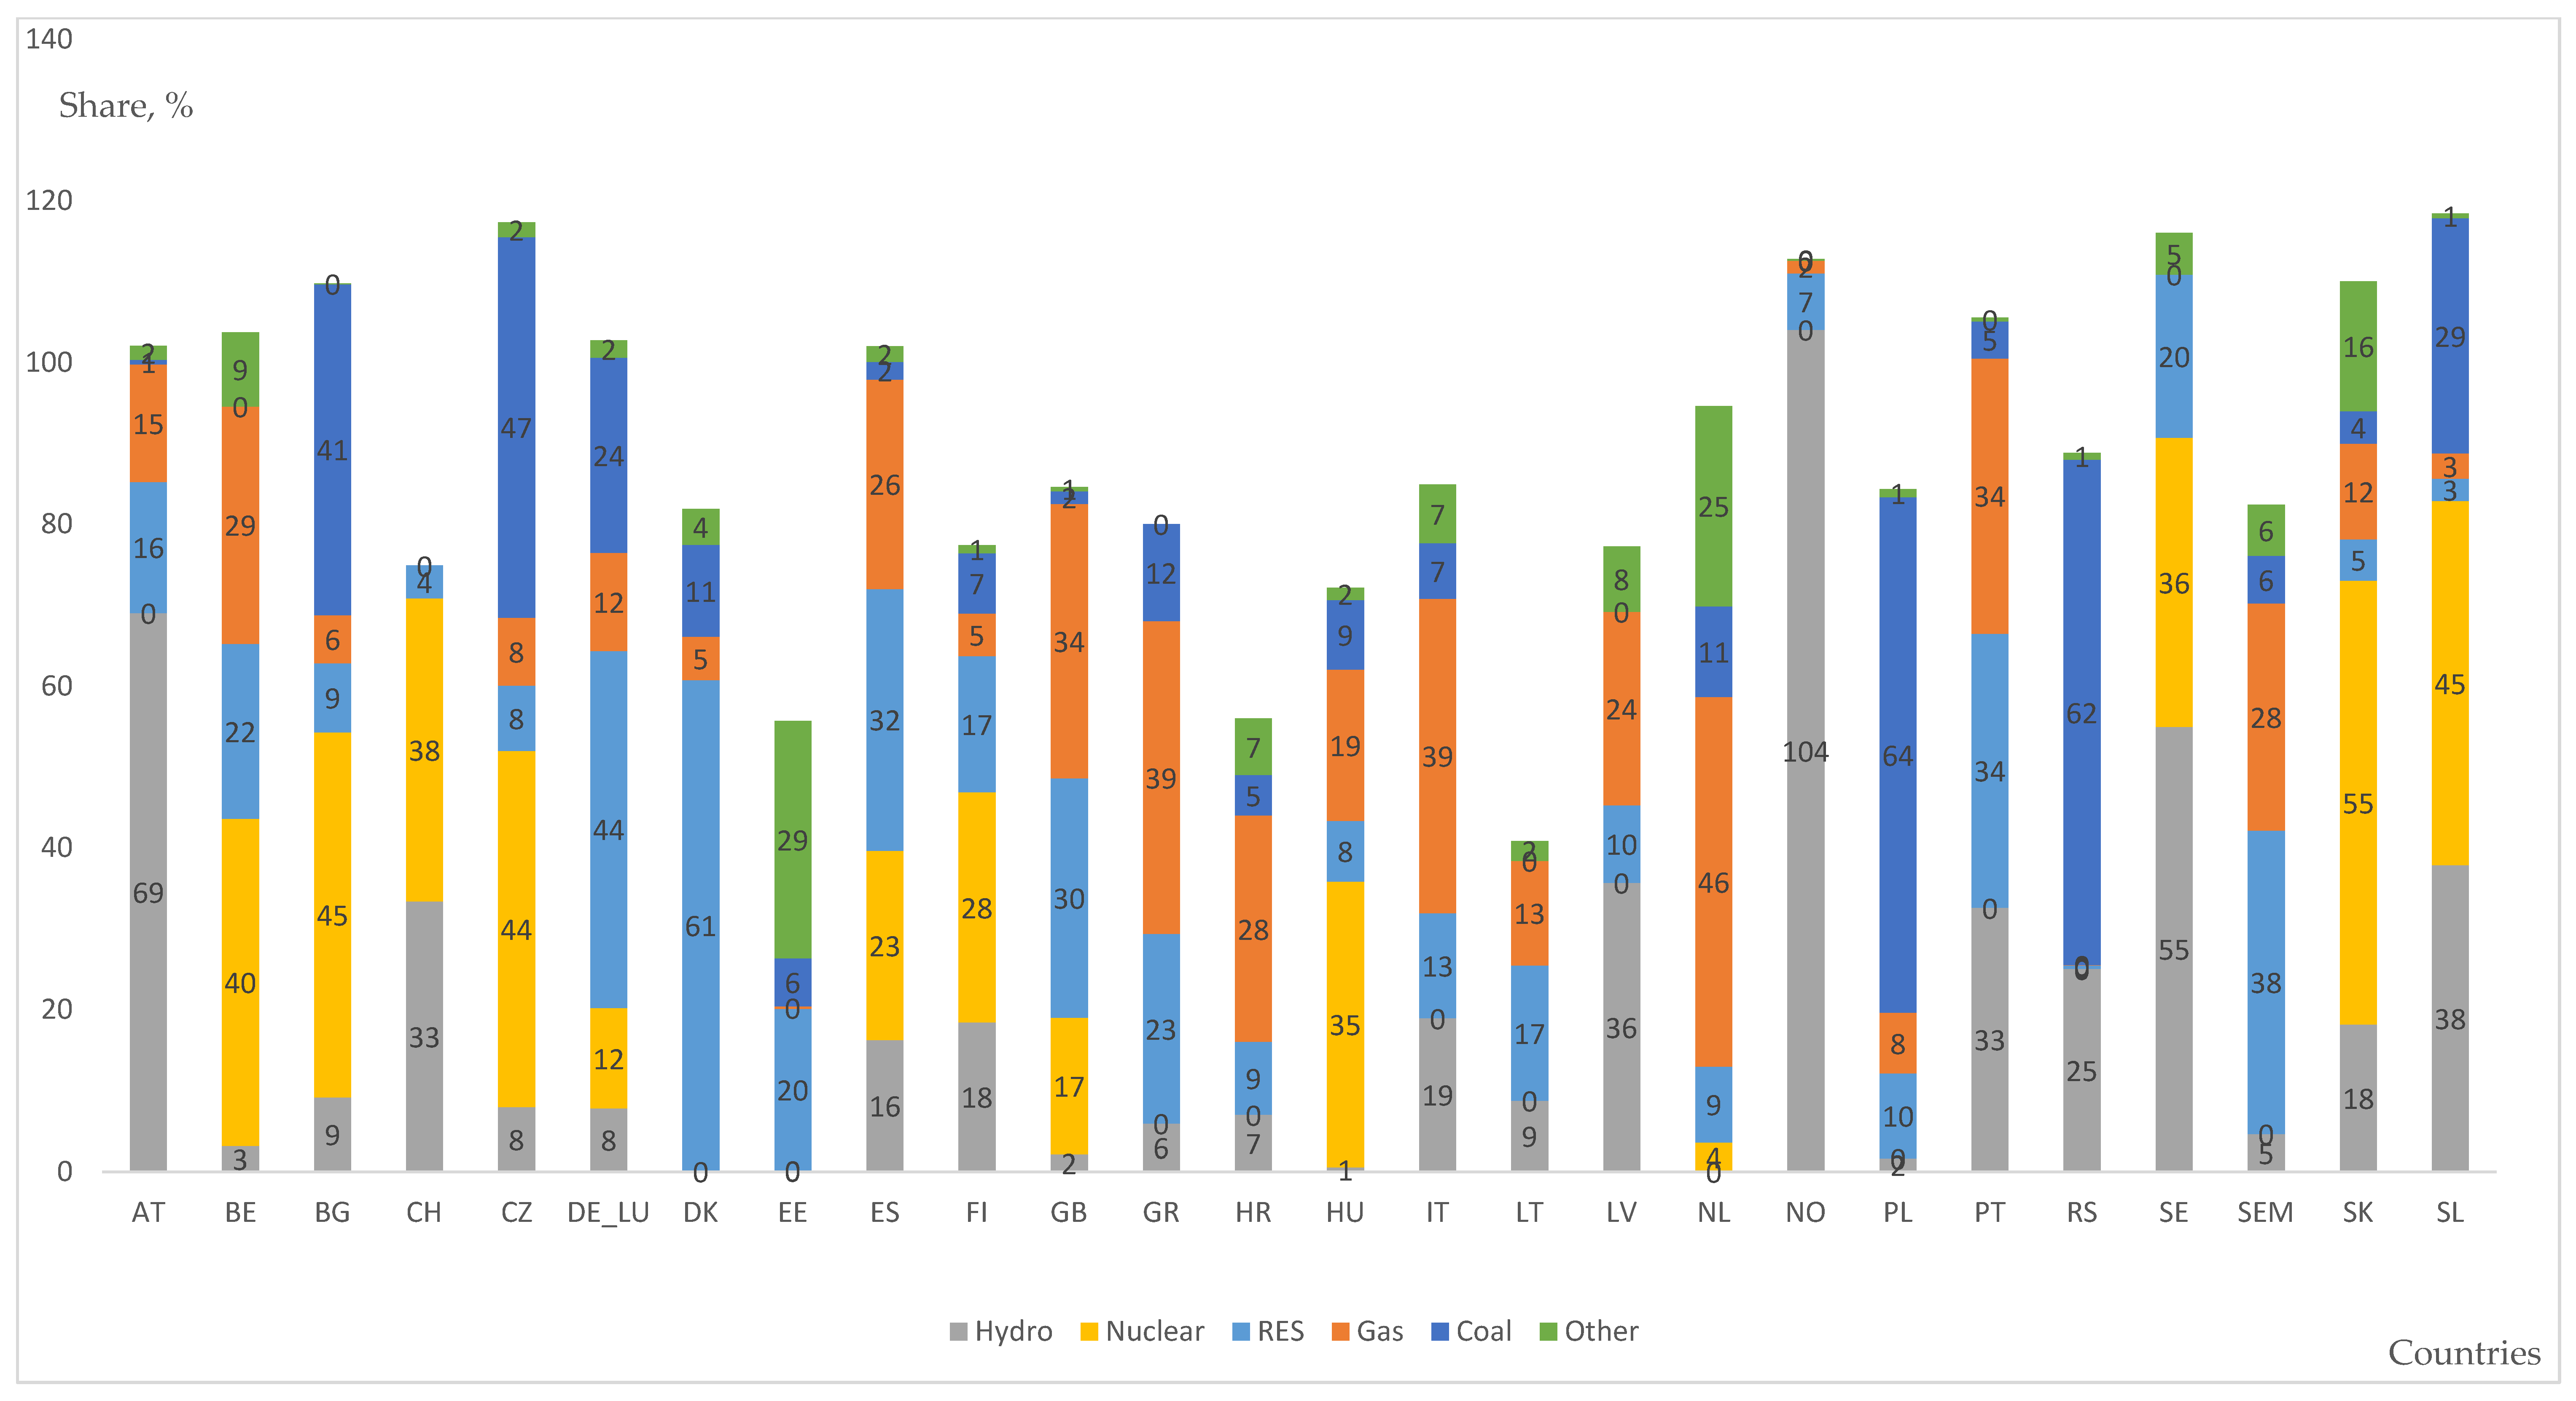
| Cluster Name | Hydro Generated | Nuclear Generated | RES Generated | Gas Generated | Coal Generated | |
|---|---|---|---|---|---|---|
| Countries | AT, NO | BE, CH, FI, HU, SE, SK, SL | DE with LU, DK, EE, LT | ES, GB, GR, HR, IE, IT, LV, NL, PT | BG, CZ, RS, PL | |
| Mean values inside the cluster, % | Hydro | 87 | 24 | 4 | 14 | 11 |
| Nuclear | 0 | 40 | 2 | 5 | 22 | |
| RES | 12 | 11 | 28 | 24 | 7 | |
| Gas | 8 | 10 | 6 | 34 | 6 | |
| Coal | 0 | 7 | 8 | 6 | 54 | |
| Average price of electricity, EUR/MWh | 21.18 | 28.03 | 30.32 | 38.23 | 39.60 | |
| Price range, % | 259 | 171 | 36 | 43 | 39 | |
| Coefficient of variation | min | 0.48 | 0.43 | 0.58 | 0.33 | 0.27 |
| max | 0.82 | 0.91 | 0.70 | 0.61 | 0.48 | |
| Distribution by quartiles, % | Q1 | 50 | 29 | 70 | 13 | 0 |
| Q2 | 50 | 29 | 30 | 37 | 25 | |
| Q3 | 0 | 29 | 0 | 13 | 0 | |
| Q4 | 0 | 14 | 0 | 37 | 75 | |
Publisher’s Note: MDPI stays neutral with regard to jurisdictional claims in published maps and institutional affiliations. |
© 2021 by the authors. Licensee MDPI, Basel, Switzerland. This article is an open access article distributed under the terms and conditions of the Creative Commons Attribution (CC BY) license (https://creativecommons.org/licenses/by/4.0/).
Share and Cite
Chen, Q.; Balian, A.; Kyzym, M.; Salashenko, T.; Gryshova, I.; Khaustova, V. Electricity Markets Instability: Causes of Price Dispersion. Sustainability 2021, 13, 12343. https://doi.org/10.3390/su132212343
Chen Q, Balian A, Kyzym M, Salashenko T, Gryshova I, Khaustova V. Electricity Markets Instability: Causes of Price Dispersion. Sustainability. 2021; 13(22):12343. https://doi.org/10.3390/su132212343
Chicago/Turabian StyleChen, Qiang, Anush Balian, Mykola Kyzym, Tetiana Salashenko, Inna Gryshova, and Viktoriia Khaustova. 2021. "Electricity Markets Instability: Causes of Price Dispersion" Sustainability 13, no. 22: 12343. https://doi.org/10.3390/su132212343
APA StyleChen, Q., Balian, A., Kyzym, M., Salashenko, T., Gryshova, I., & Khaustova, V. (2021). Electricity Markets Instability: Causes of Price Dispersion. Sustainability, 13(22), 12343. https://doi.org/10.3390/su132212343