Article

Weeding Frequency Effects on Growth and Yield of Dry Bean Intercropped with Sweet Sorghum and Cowpea under a Dryland Area

by
Conrad Baker
1,*,
Albert Thembinkosi Modi
1 and
Adornis D. Nciizah
2
1
Crop Science, School of Agricultural, Earth and Environmental Science, University of KwaZulu-Natal, Pietermaritzburg 3209, South Africa
2
Agricultural Research Council―Soil, Climate and Water, Pretoria 0083, South Africa
*
Author to whom correspondence should be addressed.
Sustainability 2021, 13(21), 12328; https://doi.org/10.3390/su132112328
Submission received: 20 September 2021 / Revised: 20 October 2021 / Accepted: 27 October 2021 / Published: 8 November 2021
(This article belongs to the Special Issue Sustainable Weed Control in the Agroecosystems)

Abstract

:
A better understanding of the dry bean (Phaseolus vulgaris L.) growth and yield response to weed competition under the intercropping system is critical for improving sustainable weed management strategies. A two-year trial was conducted with three types of crop arrangement (sole cropping, inter-row, and intra-row intercropping) combined with weeding frequency (no weeding, weeding over the first 50 days of crop growth, and weed-free). Effects of the treatments were tested on dry bean agronomic indicators in terms of the following: 100-grain weight, dry biomass, grain yield, grains per pod, pods per plant, plant height, number of leaves per plant, and chlorophyll content. The intercropping pattern significantly affected dry bean pods per plant, height, and chlorophyll content, while weeding frequency significantly affected all measured agronomic indicators for dry bean, except for chlorophyll content, during the 2017/18 growing season. The results showed that the significant measured agronomic indicators were the lowest under no weed control; however, they increased as weeding frequency increased. The 2018/19 growing season followed a similar trend; however, the interaction effect significantly affected dry bean 100-grain weight, dry biomass, and number of leaves per plant at 40 days after emergence. The dry bean/sweet sorghum or cowpea intra-row intercropping and intermediate weeding frequency displayed optimum productivity.

1. Introduction

Dry bean (Phaseolus vulgaris L.) is a vital grain pulse and one of the most important sources of plant protein in South Africa, yet there is an approximately 49% dry bean production deficit annually [1]. However, like any other crop, dry beans are sensitive to weed competition, especially at the early growth stage. Therefore, a dry bean production shortfall in South Africa could be exacerbated by weed interference. It is essential to develop sustainable weed control strategies for sustainable crop production, through which weeds can be controlled effectively [2] to curb environmental degradation. Herbicides and tillage are tools primarily used to control weeds, and the ramifications brought by these tools are leading to severe environmental concerns and increasing herbicide resistance [3]. In response to the echoing calls for intensifying sustainable agriculture, intercropping has been advocated as a sustainable cropping system to reduce the negative impact of conventional agriculture on the environment [4]; thus, sustainable weed control strategies are critical.
There are several challenges associated with weeds in agricultural fields, in addition to reduced crop yield and quality [5,6]. The growth and yield of dry beans are in most cases severely reduced by weed competition for growth factors, leading to significant yield losses [7]. However, integrating cultural weed control methods such as a spatial arrangement or using new intercropping strategies is essential in order to achieve a sustainable agricultural ecosystem [8]. Narrow rows in intercropping systems are linked to greater uniformity in leaf and root distribution in the crop, allowing the crop to intercept more radiation and efficiently utilize the soil resources, thus impeding weed establishment and growth [2,9].
Controlling intra-row weeds mainly through manual weeding can be laborious in slow-growing row crops such as dry beans with less competitive traits against weeds [10]. Van Der Weide et al. [10] also stated that intra-row weeding is expensive, time-consuming, and challenging to organize. In this view, a critical period for weed control (CPWC) was developed and defined as the period in the crop’s growth cycle during which weed control is imperative to shun unacceptable yield losses [11]. Early weed control is imperative to achieve optimum crop yield, as prolonged weed interference affects crop yield, reduces crop quality, and increases production costs [12]. The mechanism behind the impact of weed interference during CPWC on crop growth, development, and yield is still partially unknown [13].
The magnitude of weed-related dry bean yield loss due to weed interference can be variable in different growing areas, mainly attributable to the presence of weed species, weed density, and environmental conditions [14,15]. Understanding agronomic technologies that are profitable and practical to adopt is another challenging research area, as semi-arid and marginal lands require judicious use of inputs and zonal management to optimize nutrients’ restoration [16].
Intercropping is defined as growing more than one crop species simultaneously in the same area [17] and not necessarily sown or harvested simultaneously [4]. The potential benefits of intercropping are increasing crop yield and quality via efficient use of land, sunlight, soil nutrients, and moisture [18], thus improving resilience to current and future climate change, pests, disease, and weed damage [19]. The addition of legumes into intercropping systems is supported globally to improve soil fertility, protein-rich plant products, and livestock fodder [20]. Dry beans are frequently used as intercrops, thus ensuring sustainable cropping systems by intensifying production and soil fertility enhancement through their ability to fix atmospheric nitrogen biologically [21]—this enhances phosphorous biological turnover; thus, they could become the cornerstone of sustainable agriculture [20] as far as soil fertility is concerned.
However, information about the potential and feasibility of dry bean performance with sweet sorghum (Sorghum bicolor L.) or cowpea (Vigna unguiculata L. Walp) intercropping is scarce. Moreover, the use of sweet sorghum or cowpea as a companion for dry bean in intercropping under weed interference has been poorly reported. There is a need for sustainable weed control strategies for poor rural farmers to increase the adoption of grain legumes, such as agronomic practices to reduce weed pressure, particularly spatial arrangement and critical periods for weed control in different grain legume species. Therefore, this study was established to evaluate dry bean performance and determine the optimum spatial arrangement in dry bean/sweet sorghum or cowpea intercropping systems compared with sole cropping under different weed management levels.

2. Materials and Methods

2.1. Description of the Experimental Site

A two-season trial was conducted at Ukulinga Research and Training farm of the University of KwaZulu-Natal in Pietermaritzburg, South Africa (29°39’56.6′′ S 30°24′26.2′′ E), altitude 791 m amsl, during the 2017/18 and 2018/19 growing seasons. Three types of crop arrangement (sole cropping, inter-row, and intra-row intercropping) were combined with three types of weeding frequency (no weed control (NWC), 50 days weeding after crop emergence (50 DWACE), and weed-free (WF). The dry bean (Phaseolus vulgaris L.) cultivar Ukulinga was intercropped with sweet sorghum (Sorghum bicolor L.) variety Supasweet II and cowpea (Vigna unguiculata L. Walp) variety Agrinawa. A split-plot design in a randomized complete block design (RCBD) was used, comprising twenty-seven treatments replicated three times, totalling 81 plots. The effects of the treatments were tested on various dry bean agronomic indicators: 100-grain weight, dry biomass, grain yield, grains per pod, pods per plant, plant height, number of leaves per plant, and chlorophyll content. For complete details on treatments, plot layout, soil analysis, and climatic conditions, one can consult the work of [22].

2.2. Data and Yield Collection

To determine dry bean biomass production, whole plants were harvested from 1.44 m2, and then sun-dried for dry biomass weight. Plant height was based on the average height of four plants per plot. Eight plants were sampled per plot on sole cropping on the dry bean, amounting to an area of 1.44 m2 on sole and intercropping systems. Grain yield was determined by removing the dry pods from the plant and air-drying them. The grains were removed from the dry pods at 12% moisture content determined using a moisture meter, and their mass was recorded to obtain grain yield. A handheld soil plant analysis development (SPAD) chlorophyll meter was used to measure chlorophyll content. During the 2017/18 growing season, five hand hoe weeding frequencies were executed at 50 days of weed control after crop emergence (50 DWACE), and eight hand hoe-weeding frequencies were applied at weed-free. On the other hand, three hand hoe-weeding frequencies were performed at 50 DWACE and five hand hoe-weeding frequencies were performed at weed-free during the 2018/19 growing seasons. In general, weeding frequency applications declined from one season to another.
Land equivalent ratio (LER) was determined using the equation below.
LER = ID/SD + IS/SS
Above-ground dry biomass was used to determine LER for dry bean and sweet sorghum intercropping, where ID denotes intercropping dry bean, SD denotes sole dry bean cropping, IS denotes intercropping sweet sorghum, and SS denotes sole sweet sorghum cropping.
LER = ID/SD + IC/SC
Grain yield was used to determine LER dry bean and cowpea intercropping, where ID denotes intercropping dry bean, SD denotes sole dry bean cropping, IC denotes intercropping cowpea, and SC denotes sole cowpea cropping.

2.3. Statistical Analysis

Analysis of variance (ANOVA) was used to compare the effects of intercropping pattern and weed frequency on dry bean 100-grain weight, dry biomass, grain yield, grains per pod, pods per plant, plant height, number of leaves per plant, and chlorophyll content using GEN STAT statistical software version 18. The standard error of the difference (S.E.D) was used for mean separation when treatments were significantly different (p < 0.05). Principal component analysis (PCA) associated dry bean traits with intercropping patterns and weeding frequency. A stronger correlation of dry bean dry biomass, grain yield, height, pods per plant, grains per pods, number of leaves per plant, plant height, and intercropping pattern with weeding frequency could be observed through the arrows; the further an arrow from the centre of the PCA diagram, the more robust the correlation.

3. Results

The analysis of variance (ANOVA) results are shown in Table 1 and Table 2 for the 2017/18 and 2018/19 growing seasons, respectively. The intercropping pattern had a significant (p < 0.01) effect on the number of dry bean pods per plant, 60 days after emergence (DAE) plant height, and chlorophyll content at 80 DAE; on the other hand, the results showed that weeding frequency had a significant (p < 0.01) effect on dry bean 100-grain weight, dry biomass, grain yield, grains per pod, pods per plant, and plant height at 60 and 80 DAE (Table 1). Moreover, the interaction between intercropping pattern × weed frequency had significant (p < 0.05) effects on 80 DAE plant height; however, other treatments remained insignificant (Table 1).
During the second growing season, the intercropping pattern had a significant (p < 0.01) effect on dry biomass, pods per plant, and plant height at 40 and 80 DAE (Table 2). The weeding frequency had a significant (p < 0.01) effect on dry bean 100-grain weight, dry biomass, grain yield, grains per pod, pods per plant, plant height, number of leaves per plant, and chlorophyll content (Table 2). The intercropping pattern × weeding frequency interaction had a significant (p < 0.05) effect on dry bean 100-grain weight, dry biomass, and 40 DAE number of leaves per plant (Table 2).

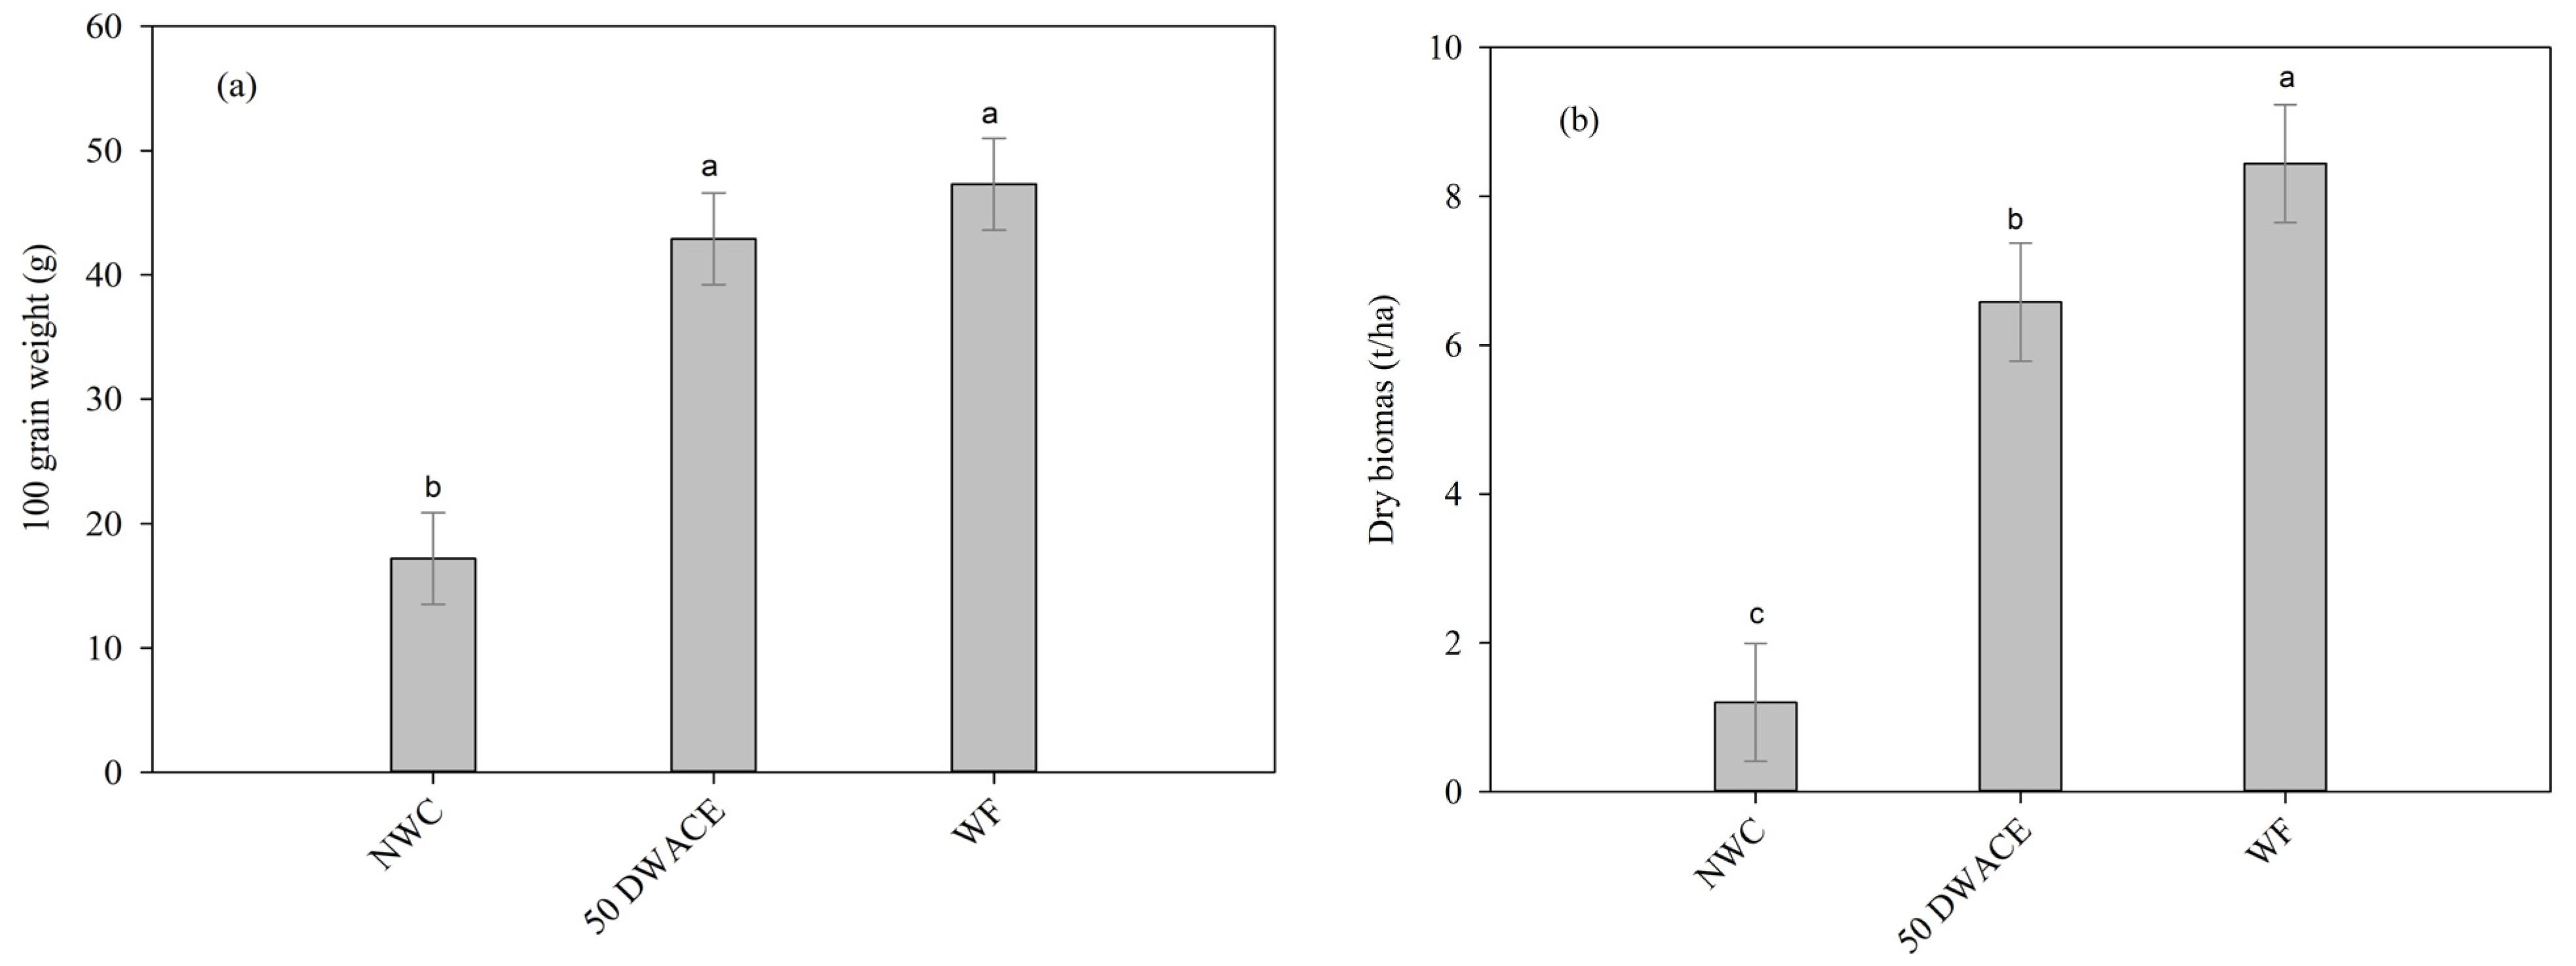
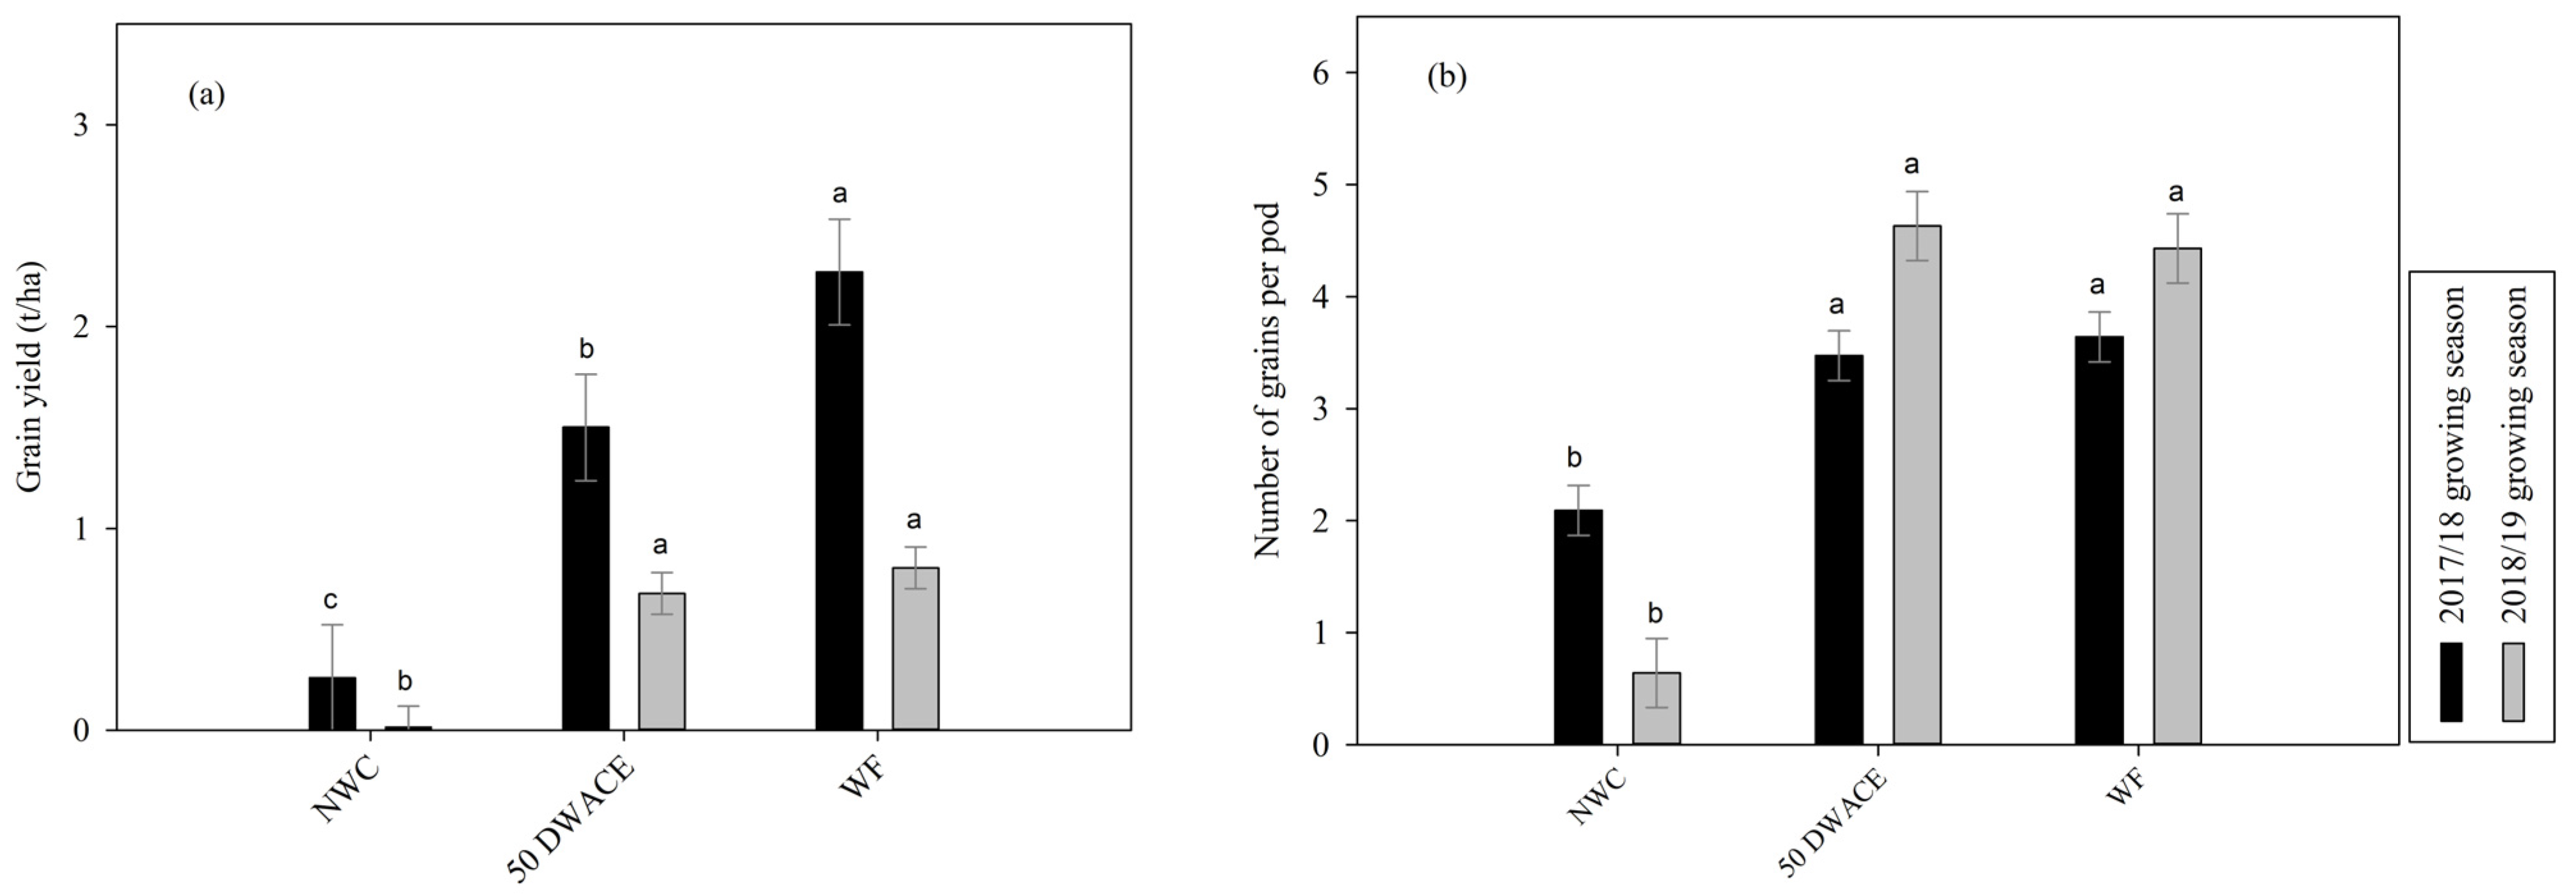
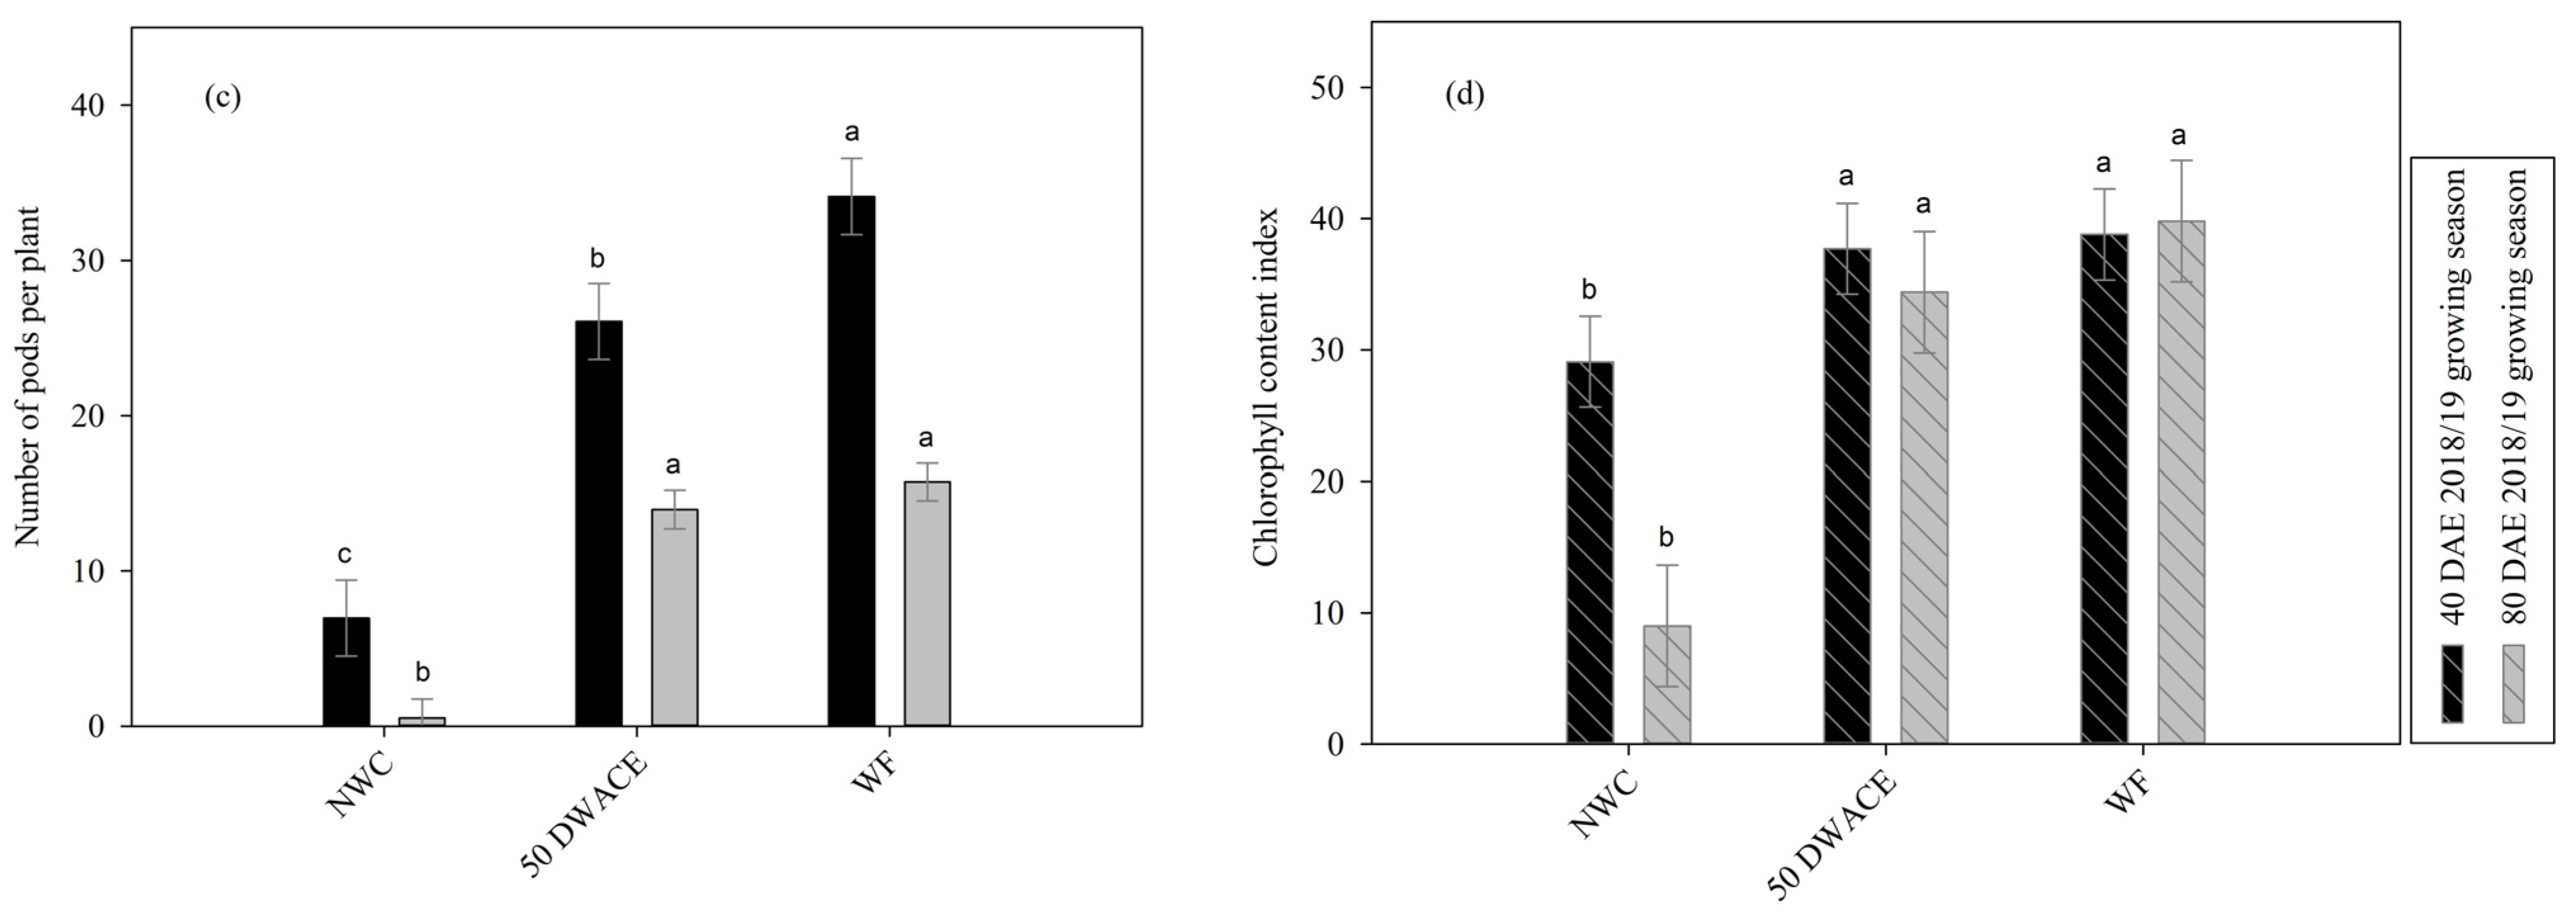
3.1. Effects of Weeding Frequency on Dry Bean Traits

The weeding frequency significantly affected 100-grain weight; no weed control led to a significantly lower 100-grain weight; however, the 100-grain weight did not significantly increase as weeding frequency increased from 50 DWACE to weed-free in the 2017/18 growing season (Figure 1a). Inversely, for dry biomass, between 50 DWACE and weed-free, based on Figure 1b, differences were observed in grain yield (Figure 2a), number of grains per pod (Figure 2b), number of pods per plant (Figure 2c), and chlorophyll content index (Figure 2d).
In the 2018/19 growing season, dry bean grain yield was significantly lower at no weed control and increased as weeding frequency increased; however, it showed no significant effect between 50 DWACE and weed-free compared with the 2017/18 growing season (Figure 2a).
The number of grains per pod was significantly influenced by weeding frequency; the grains per pod increased as weeding frequency increased; however, it remained insignificant between intermediate weeding frequency and weed-free over the growing seasons (Figure 2b).
The lowest number of pods per plant was observed at no weed control, which increased as the weeding frequency increased (Figure 2c). During the 2017/18 growing season, there were significant differences in the number of pods per plant between the 50 DWACE and the weed-free treatment; however, during the 2018/19 growing season, there were no significant effects between the 50 DWACE and the weed-free treatment (Figure 2c). As a result of increased weeding frequency, the high number of dry bean pods per plant differed between the growing seasons.
The weeding frequency significantly influenced dry bean leaf chlorophyll content at 40 DAE and 80 DAE in the 2018/19 growing season (Figure 2d). The no weed control had a significantly lower dry bean leaf chlorophyll content, which significantly increased as the weeding frequency increased at 40 DAE and 80 DAE, but remained not significant at intermediate weeding frequency in the 2018/19 growing season (Figure 2d).

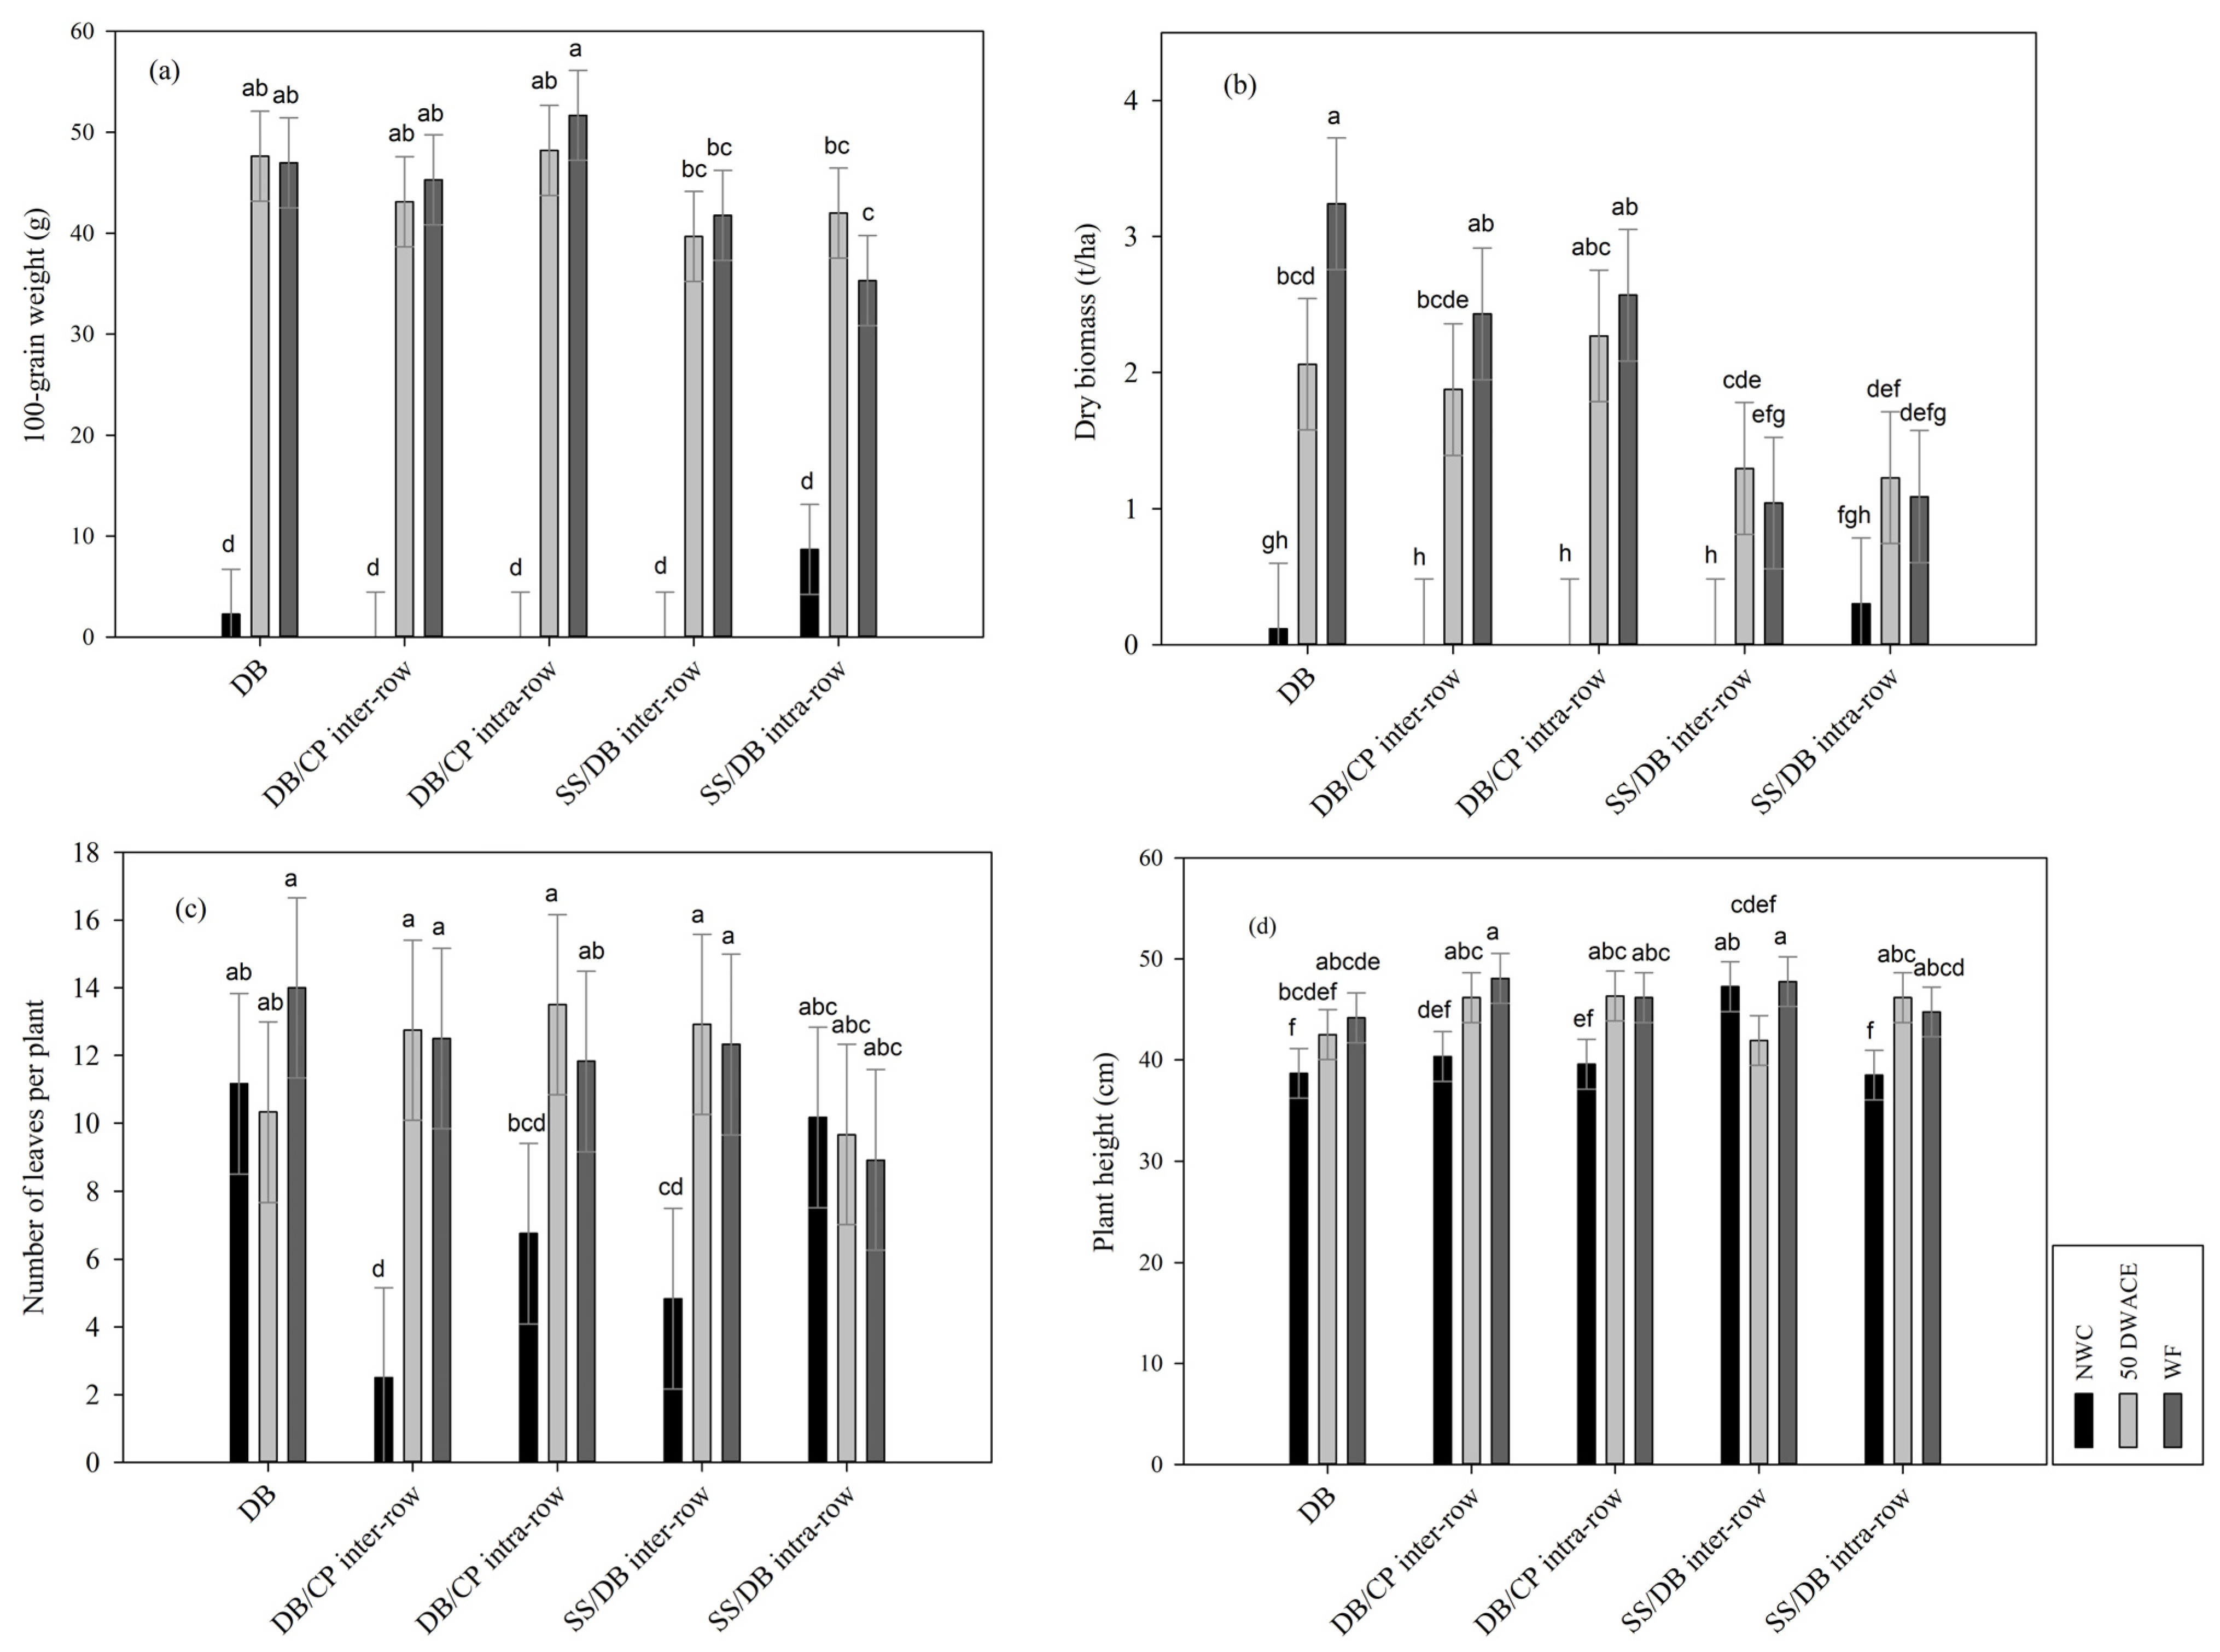
3.2. Intercropping Pattern × Weeding Frequency Interaction Effects on Significant Measure Dry Bean Traits

During the second growing season, the interaction between intercropping pattern × weeding frequency had significant effects on dry bean 100-grain weight (Figure 3a). The DB/CP intra-row × weed-free had the highest 100-grain weight compared with other treatments; however, the 100-grain weight remained significantly lower at no weed control throughout the intercropping patterns (Figure 3a).
The two-way interaction significantly affected dry bean biomass; sole DB × weed-free had significantly higher dry biomass; however, no weed control had the lowest dry biomass across all the intercropping patterns (Figure 3b). The SS/DB inter-row and intra-row intercropping had the least dry bean dry biomass across all weeding frequencies compared with sole DB, DB/CP intra-row, and inter-row intercropping.
During the 2018/19 growing season, there was a significant interaction effect on the dry bean number of leaves per plant at 40 DAE (Figure 3c). The sole DB × weed-free interaction had the highest dry bean number of leaves per plant, while DB/CP inter-row had the lowest dry bean number of leaves per plant (Figure 3c). There was no significant interaction effect on dry bean number of leaves per plant between DB/CP inter-row, DB/CP intra-row, and SS/DB inter-row intercropping × no weed control interaction; however, the number of leaves per plant significantly increased as weeding frequency increased (Figure 3c).
During the 2017/18 growing season, the intercropping pattern × weeding frequency had a significant interaction effect at 80 DAE, DB/CP inter-row and SS/DB inter-row intercropping × weed-free had the highest plant height, while SS/DB inter-row and sole DB × no weed control and 50 DWACE had the lowest plant height (Figure 3d). There were no differences among other treatments (Figure 3d).

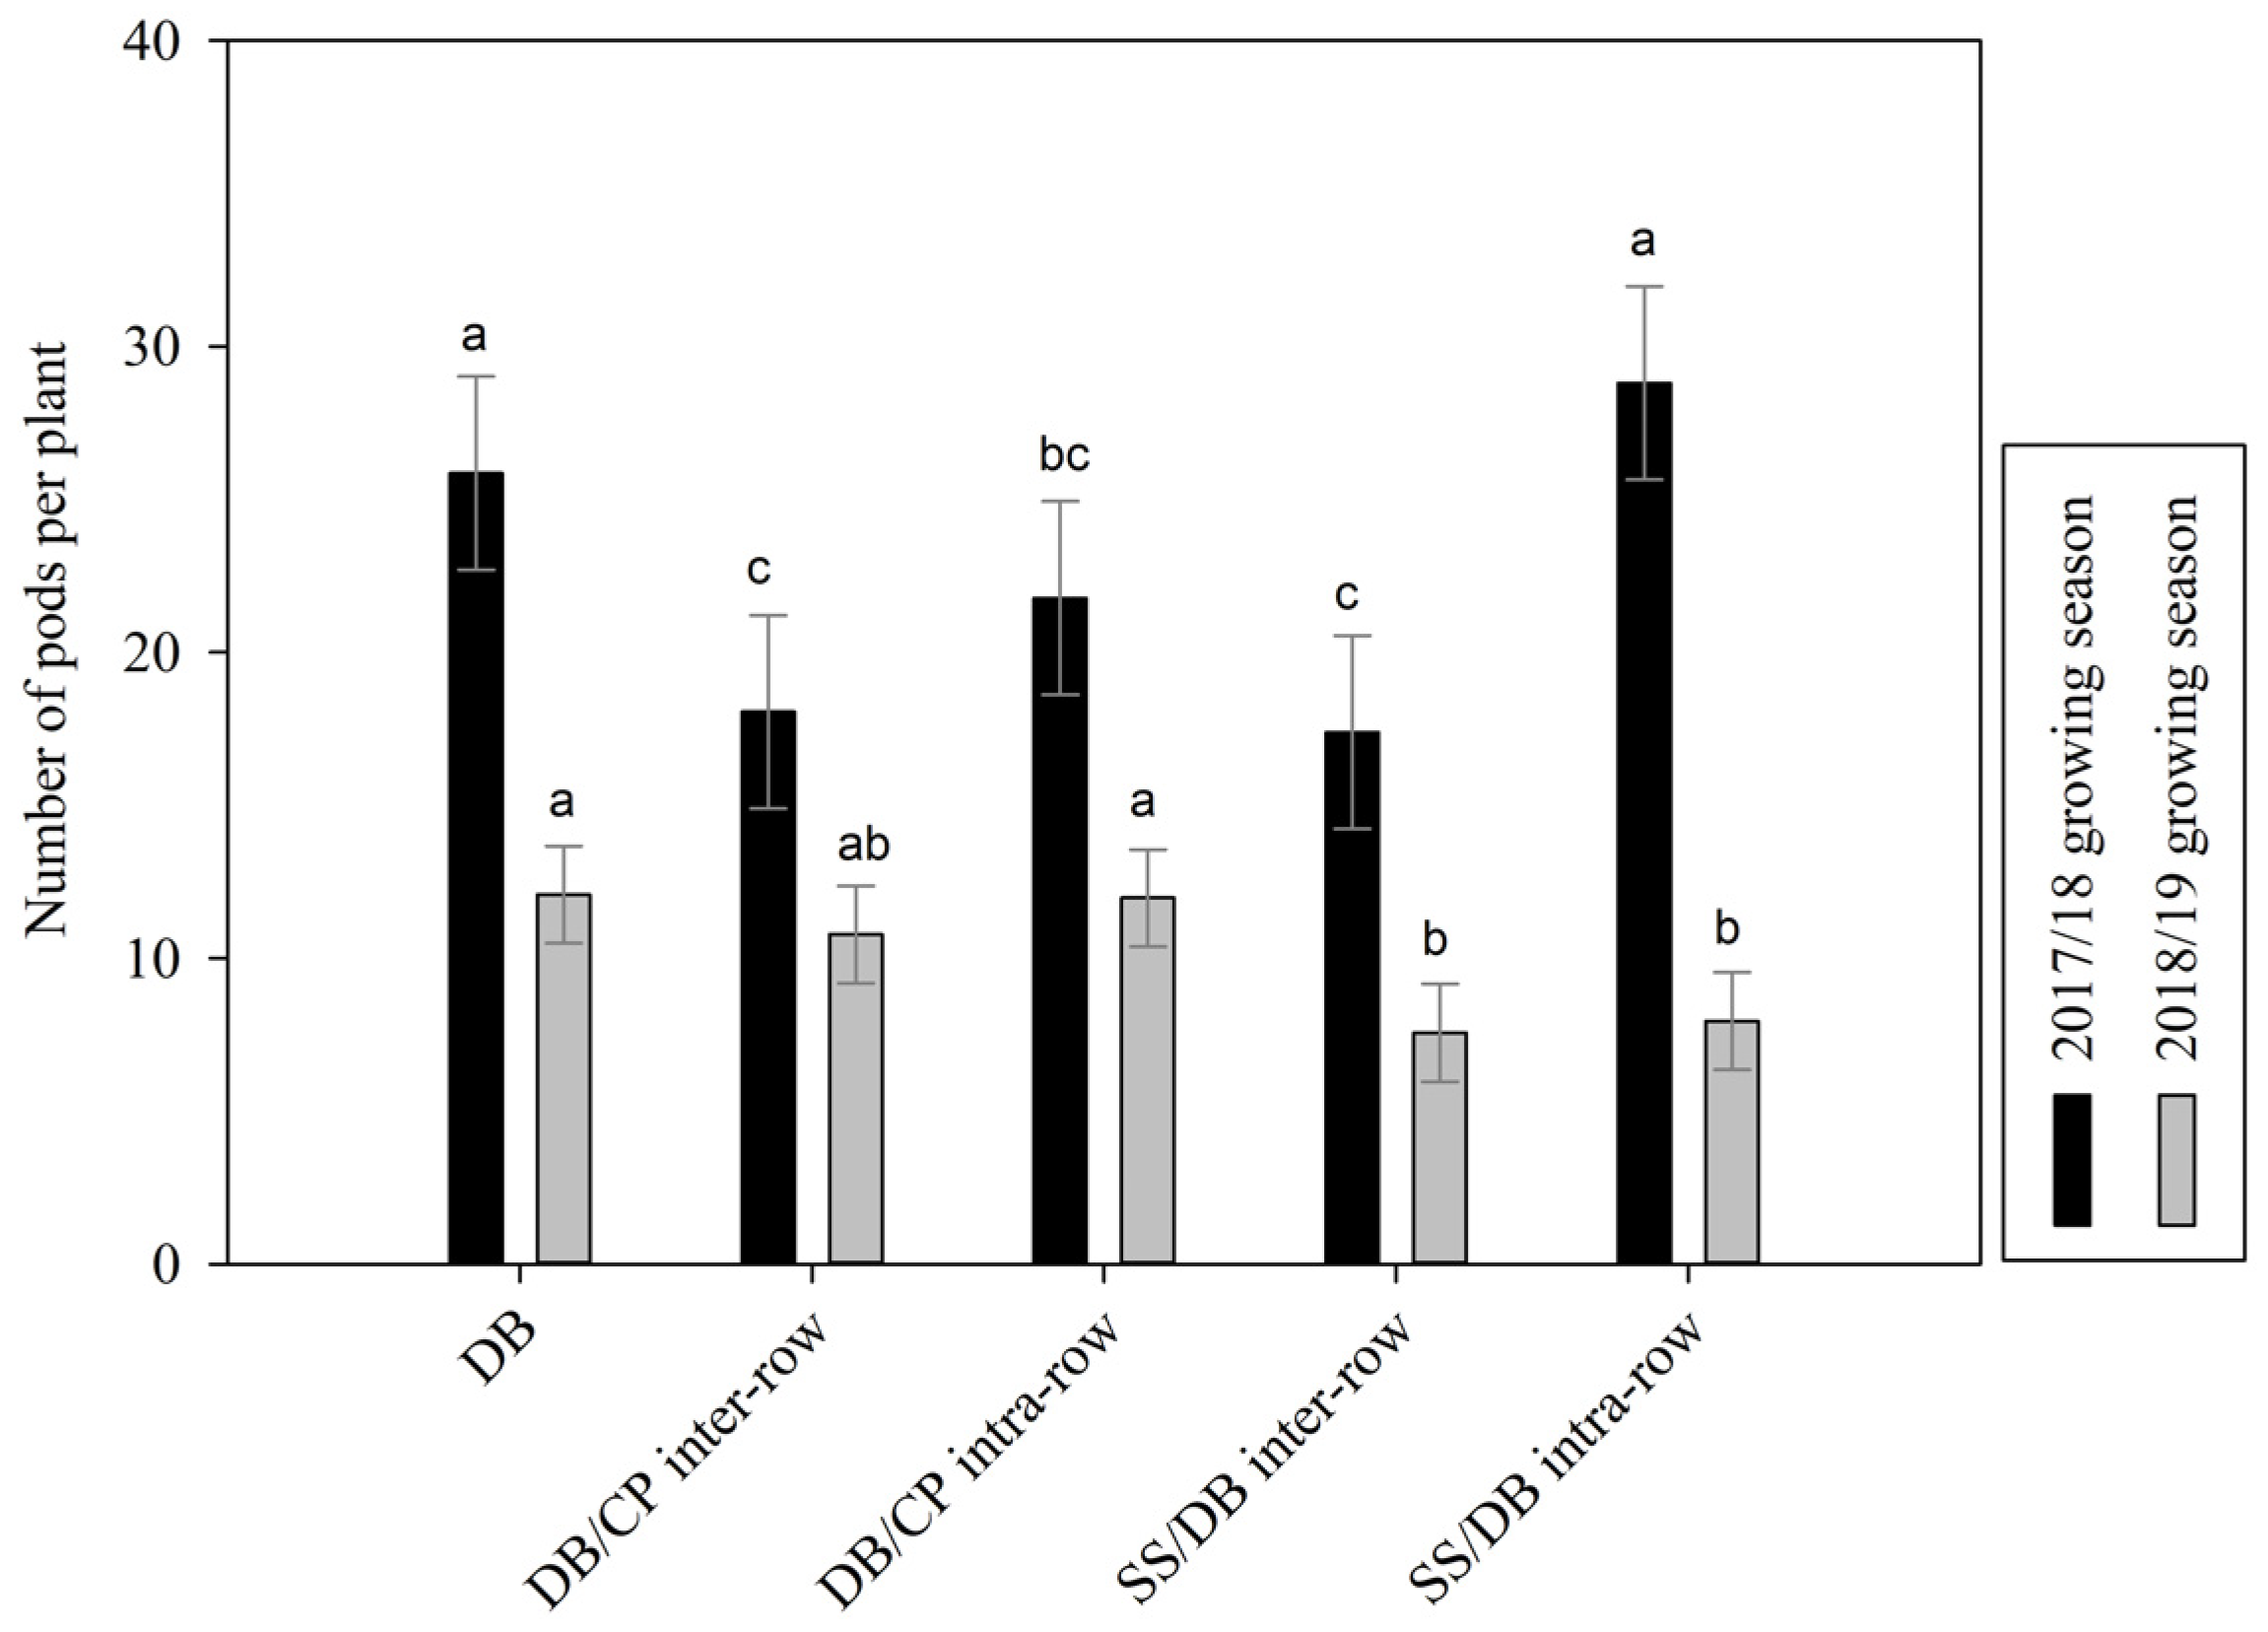
3.3. Intercropping Pattern Effect on Dry Bean Pods per Plant

The intercropping pattern effect on the number of dry bean pods per plant was highest on SS/DB intra-row intercropping, whereas SS/DB inter-row and DB/CP had the lowest number of pods per plant during the 2017/18 growing season (Figure 4). There was no significant impact between DB/CP intra-row, DB/CP inter-row, and SS/DB inter-row intercropping during the 2017/18 growing season (Figure 4).

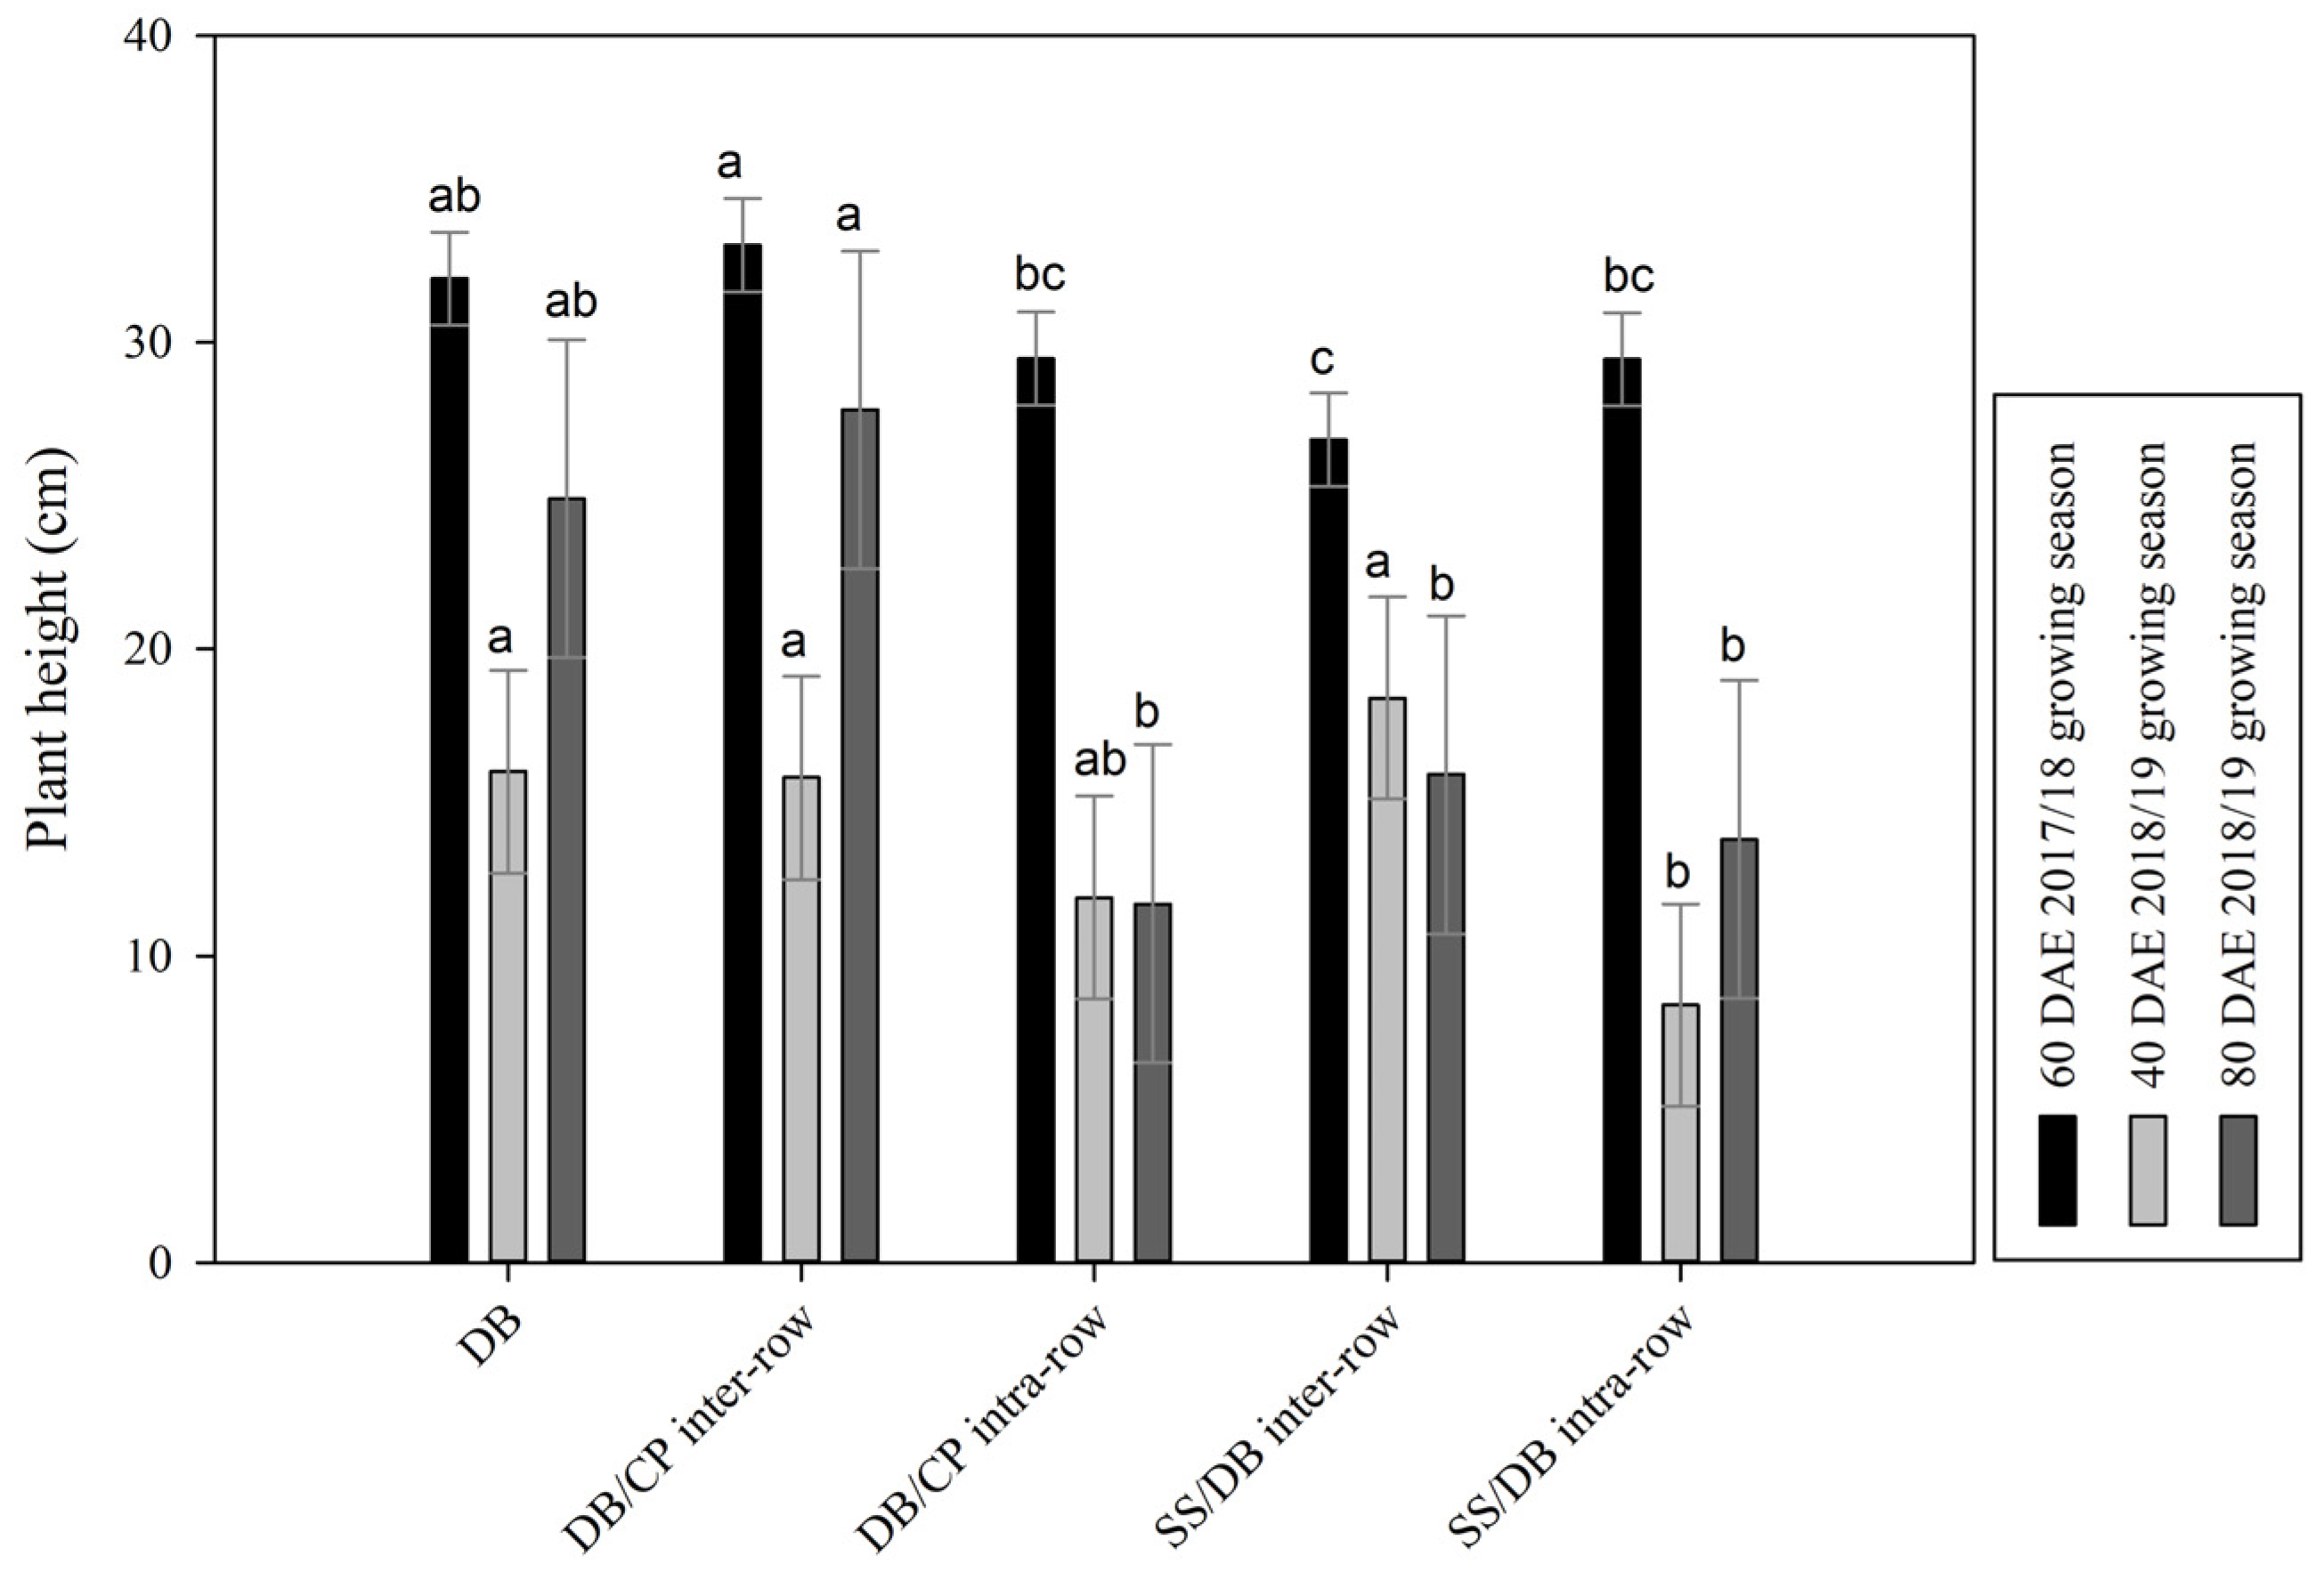
3.4. Intercropping Pattern Effect on Dry Bean Plant Height

The intercropping pattern significantly impacted dry bean plant height at 60 DAE during the 2017/18 growing season and at 40 and 80 DAE in the 2018/19 growing season (Figure 5). The highest plant height was recorded at DB/CP inter-row intercropping, and the lowest plant height was observed at SS/DB inter-row intercropping at 60 DAE during the 2017/18 growing season (Figure 5). The intercropping pattern significantly influenced dry bean height at 40 DAE and 80 DAE in the 2018/19 growing season (Figure 5). The SS/DB inter-row had the highest plant height, whereas the SS/DB intra-row had the lowest plant height, and the DB/CP intra-row and SS/DB intra-row showed insignificant effects against each other at 40 DAE during the 2018/19 growing season (Figure 5). At 80 DAE during the 2018/19 growing season, the highest plant height was recorded on the DB/CP inter-row and the lowest on the DB/CP intra-row; however, SS/DB inter-row, SS/DB intra-row, and DB/CP were not significant among the treatments (Figure 5).

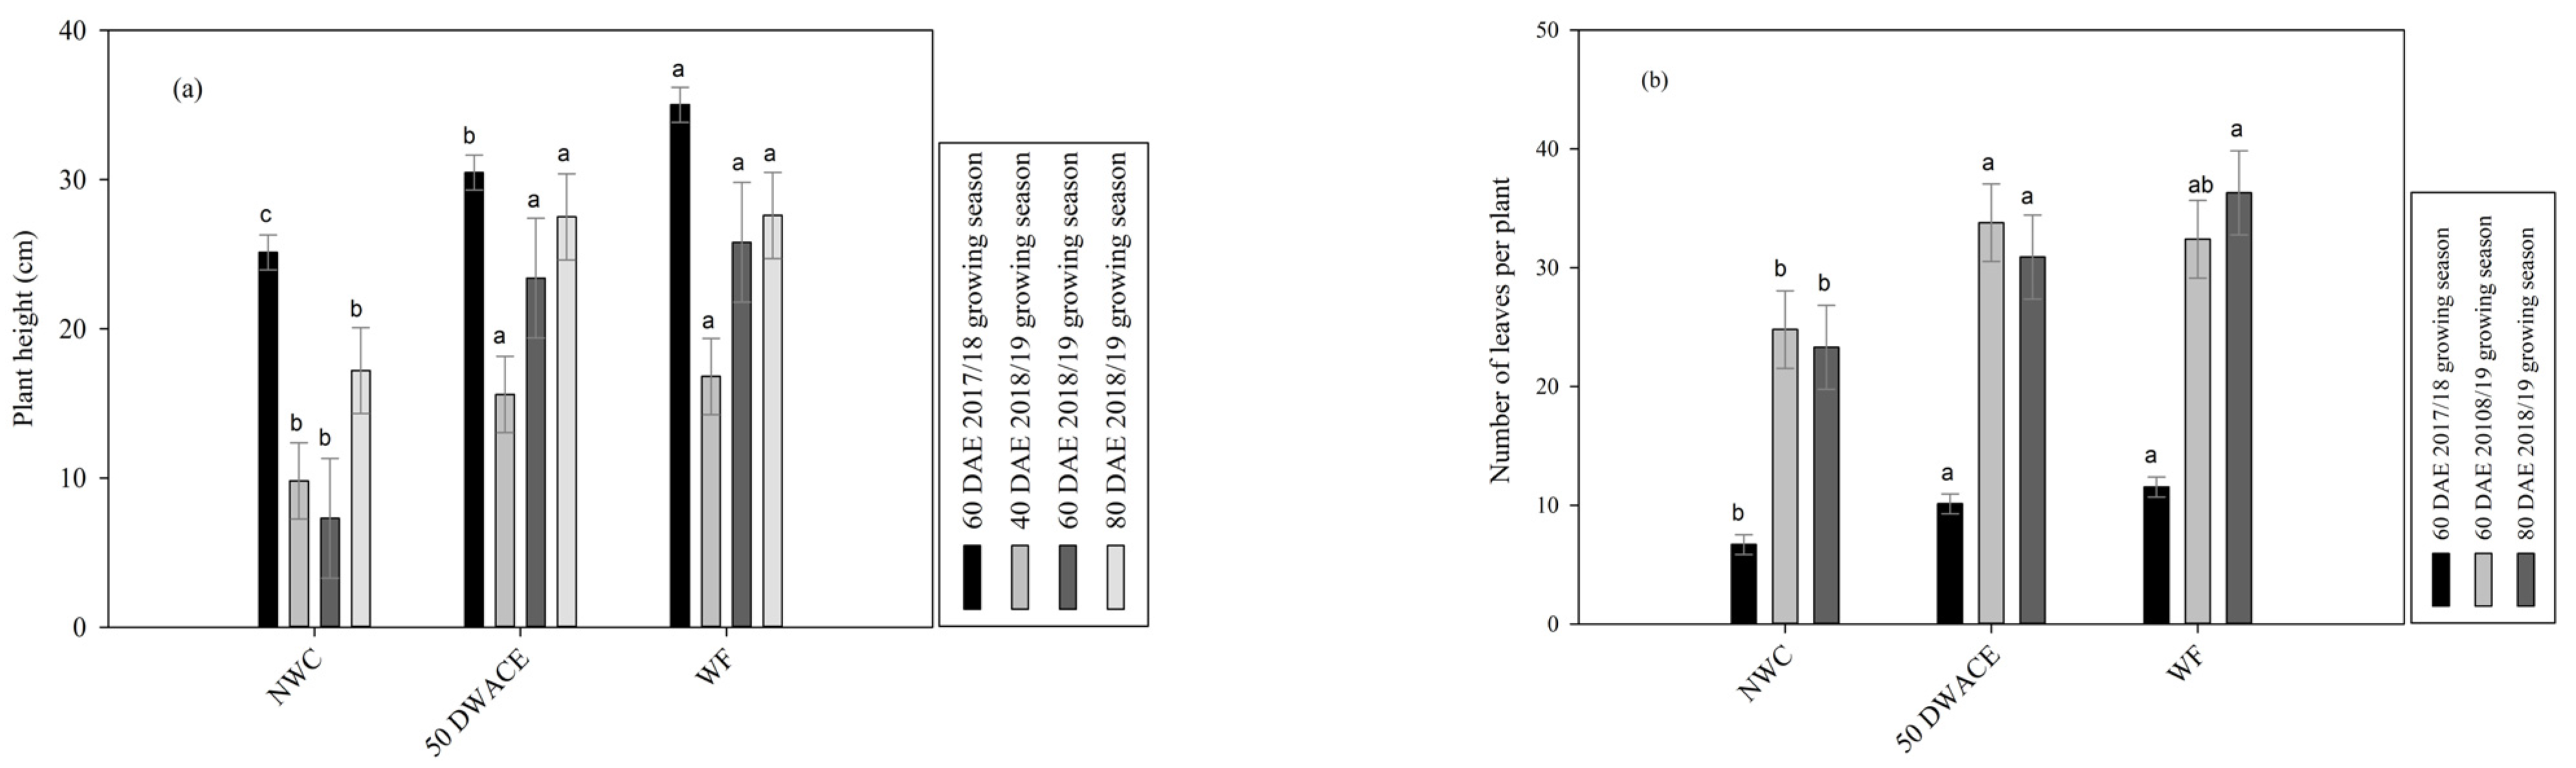
3.5. Weeding Frequency Effects on Dry Bean Height and Number of Leaves per Plant

The results showed that weeding frequency significantly impacted 60 DAE dry bean height; the highest plant height was observed at weed-free and declined as weeding frequency reduced during the 2017/18 growing season (Figure 6a). Weeding frequency did not have significant effects on dry bean height at 40 DAE during the 2017/18 growing season, whereas, during the 2018/19 growing season, a significant effect was observed at 40 DAE (Figure 6a). However, the highest 40 DAE dry bean height was observed at weed-free and declined as weeding frequency reduced during the 2018/19 growing season (Figure 6a). The same was noted at 60 and 80 DAE during the 2018/19 growing season; moreover, insignificant differences were observed between intermediate and weed-free frequencies.
Dry bean number of leaves per plant responded significantly to weeding frequency. No weed control had the lowest number of leaves per plant, and the number of leaves per plant increased as weeding frequency increased at 60 DAE during the 2017/18 growing season, and 60 and 80 DAE only during the 2018/19 growing season (Figure 6b).

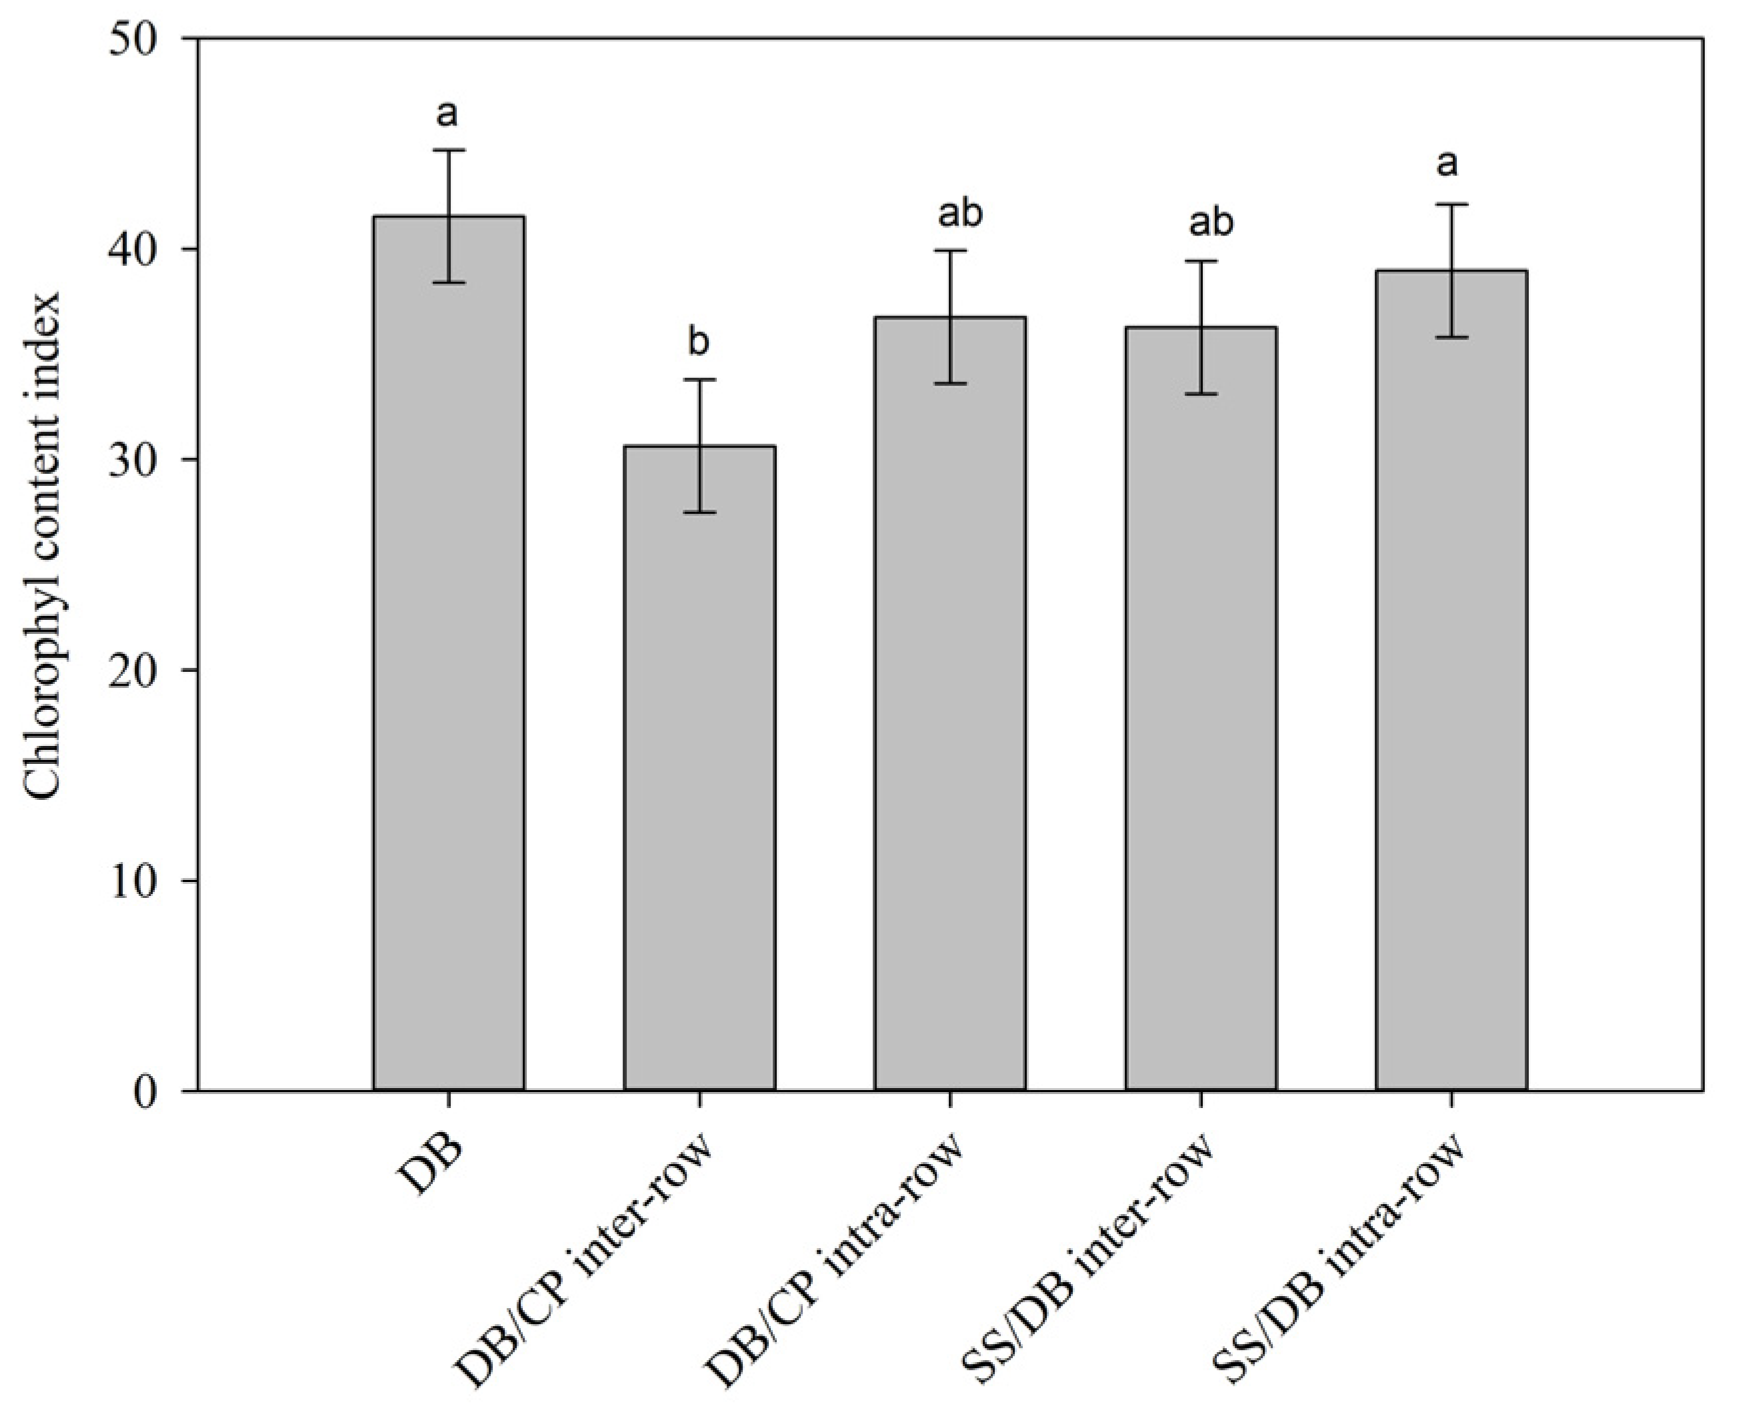
3.6. Intercropping Pattern Effect on Dry Bean Chlorophyll Content

The significant intercropping pattern effect on dry bean leaf chlorophyll existed at 80 DAE in the 2017/18 growing season only, and the highest chlorophyll content was observed on sole DB, whereas DB/CP inter-row intercropping had the lowest chlorophyll content (Figure 7).

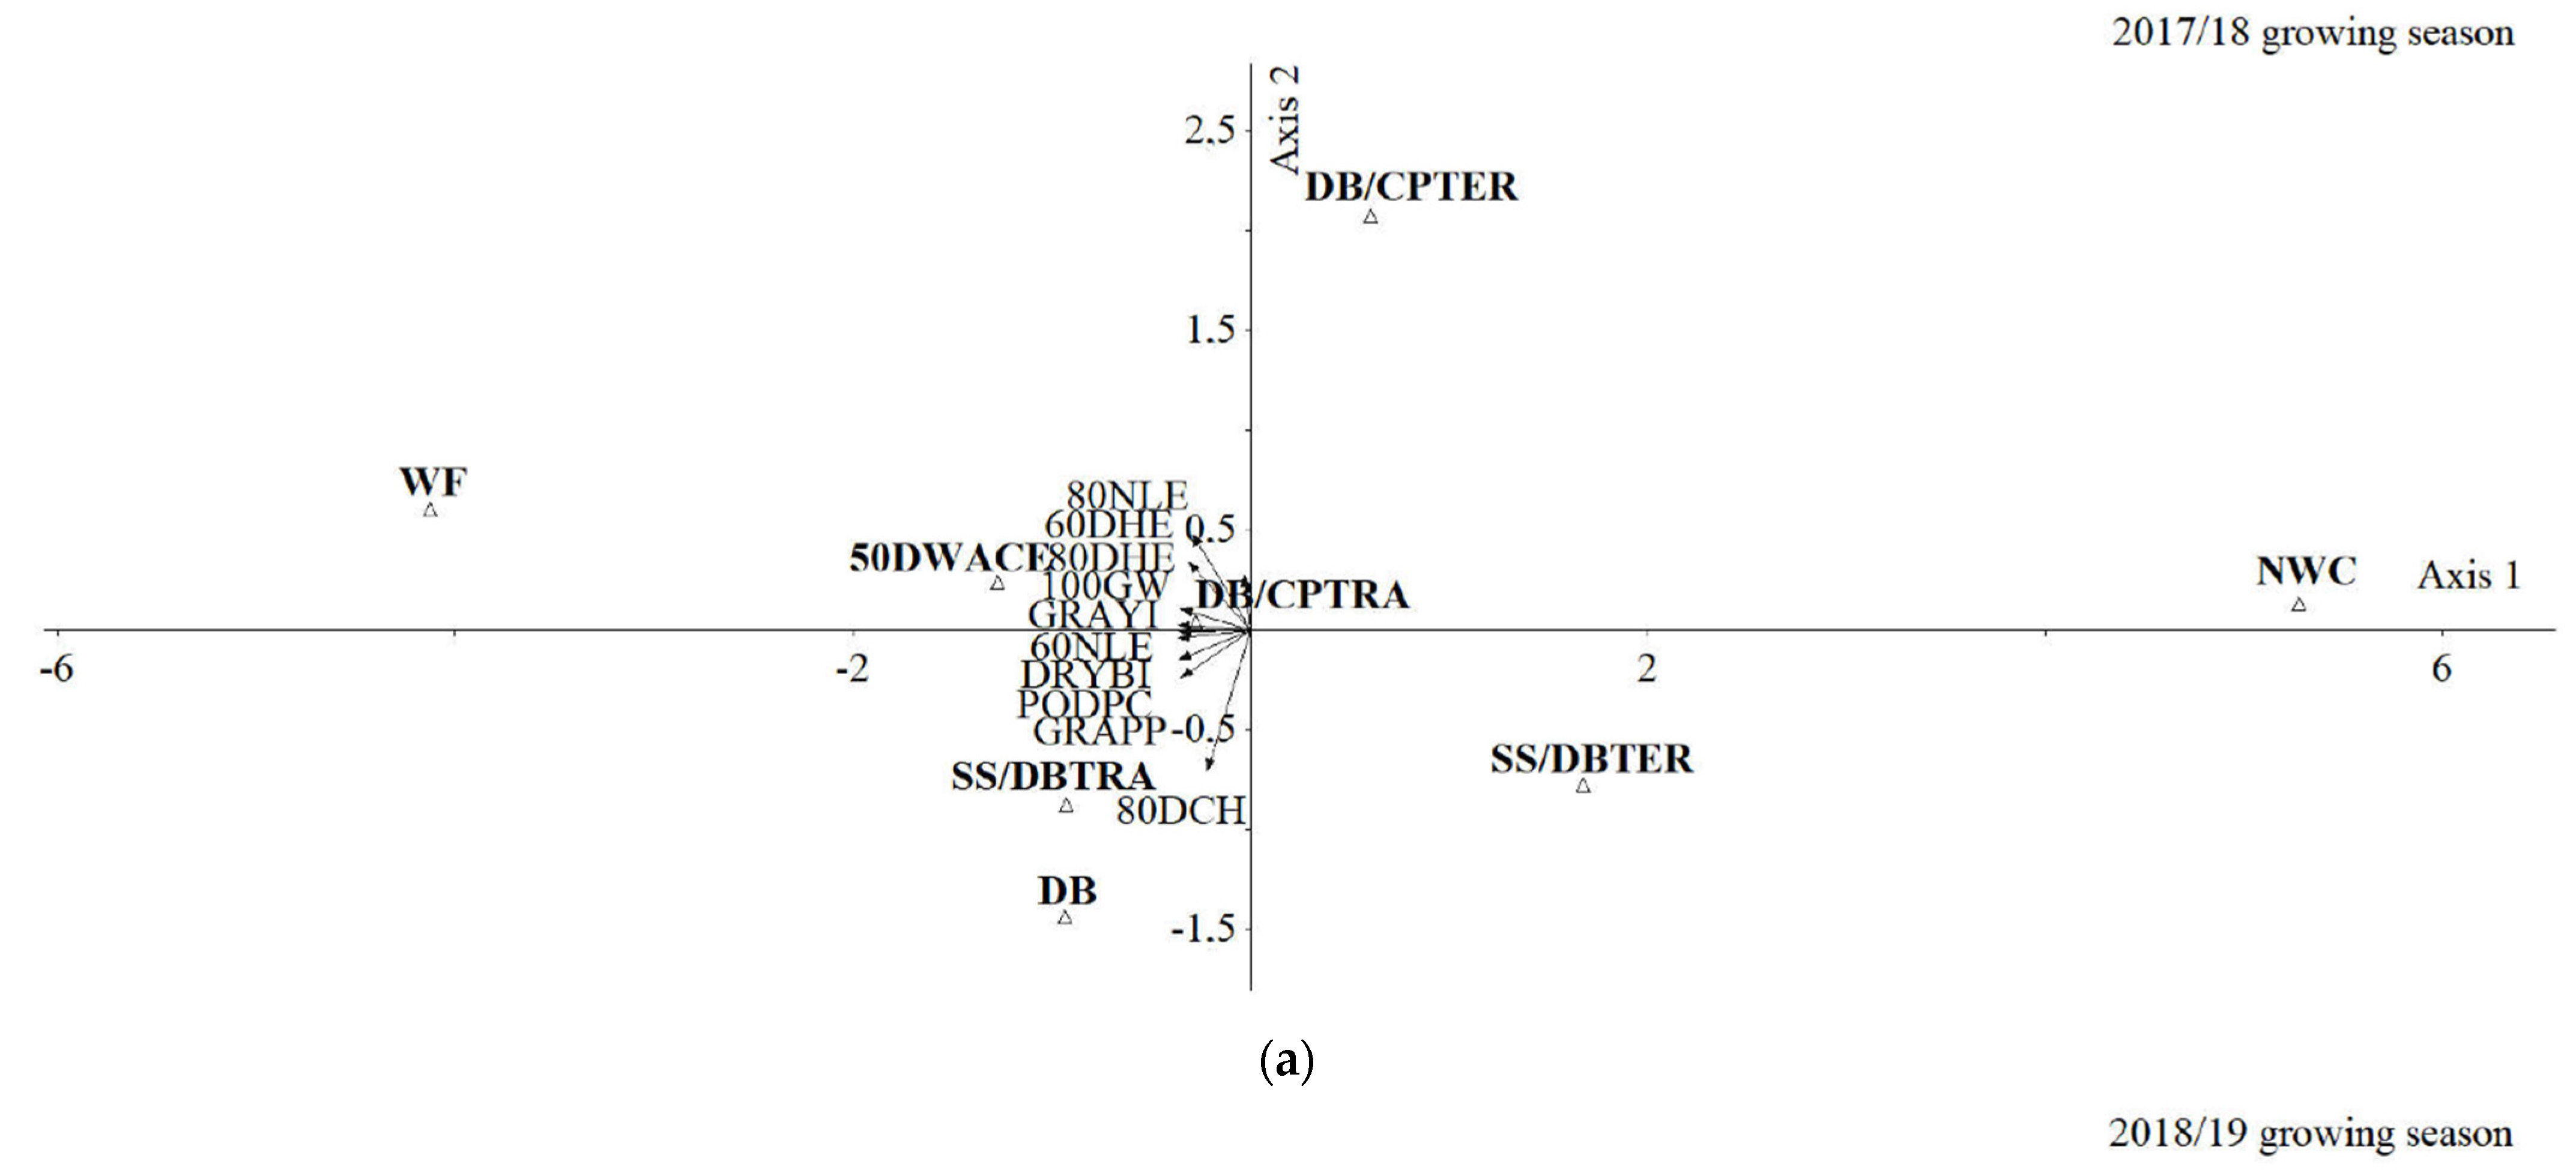
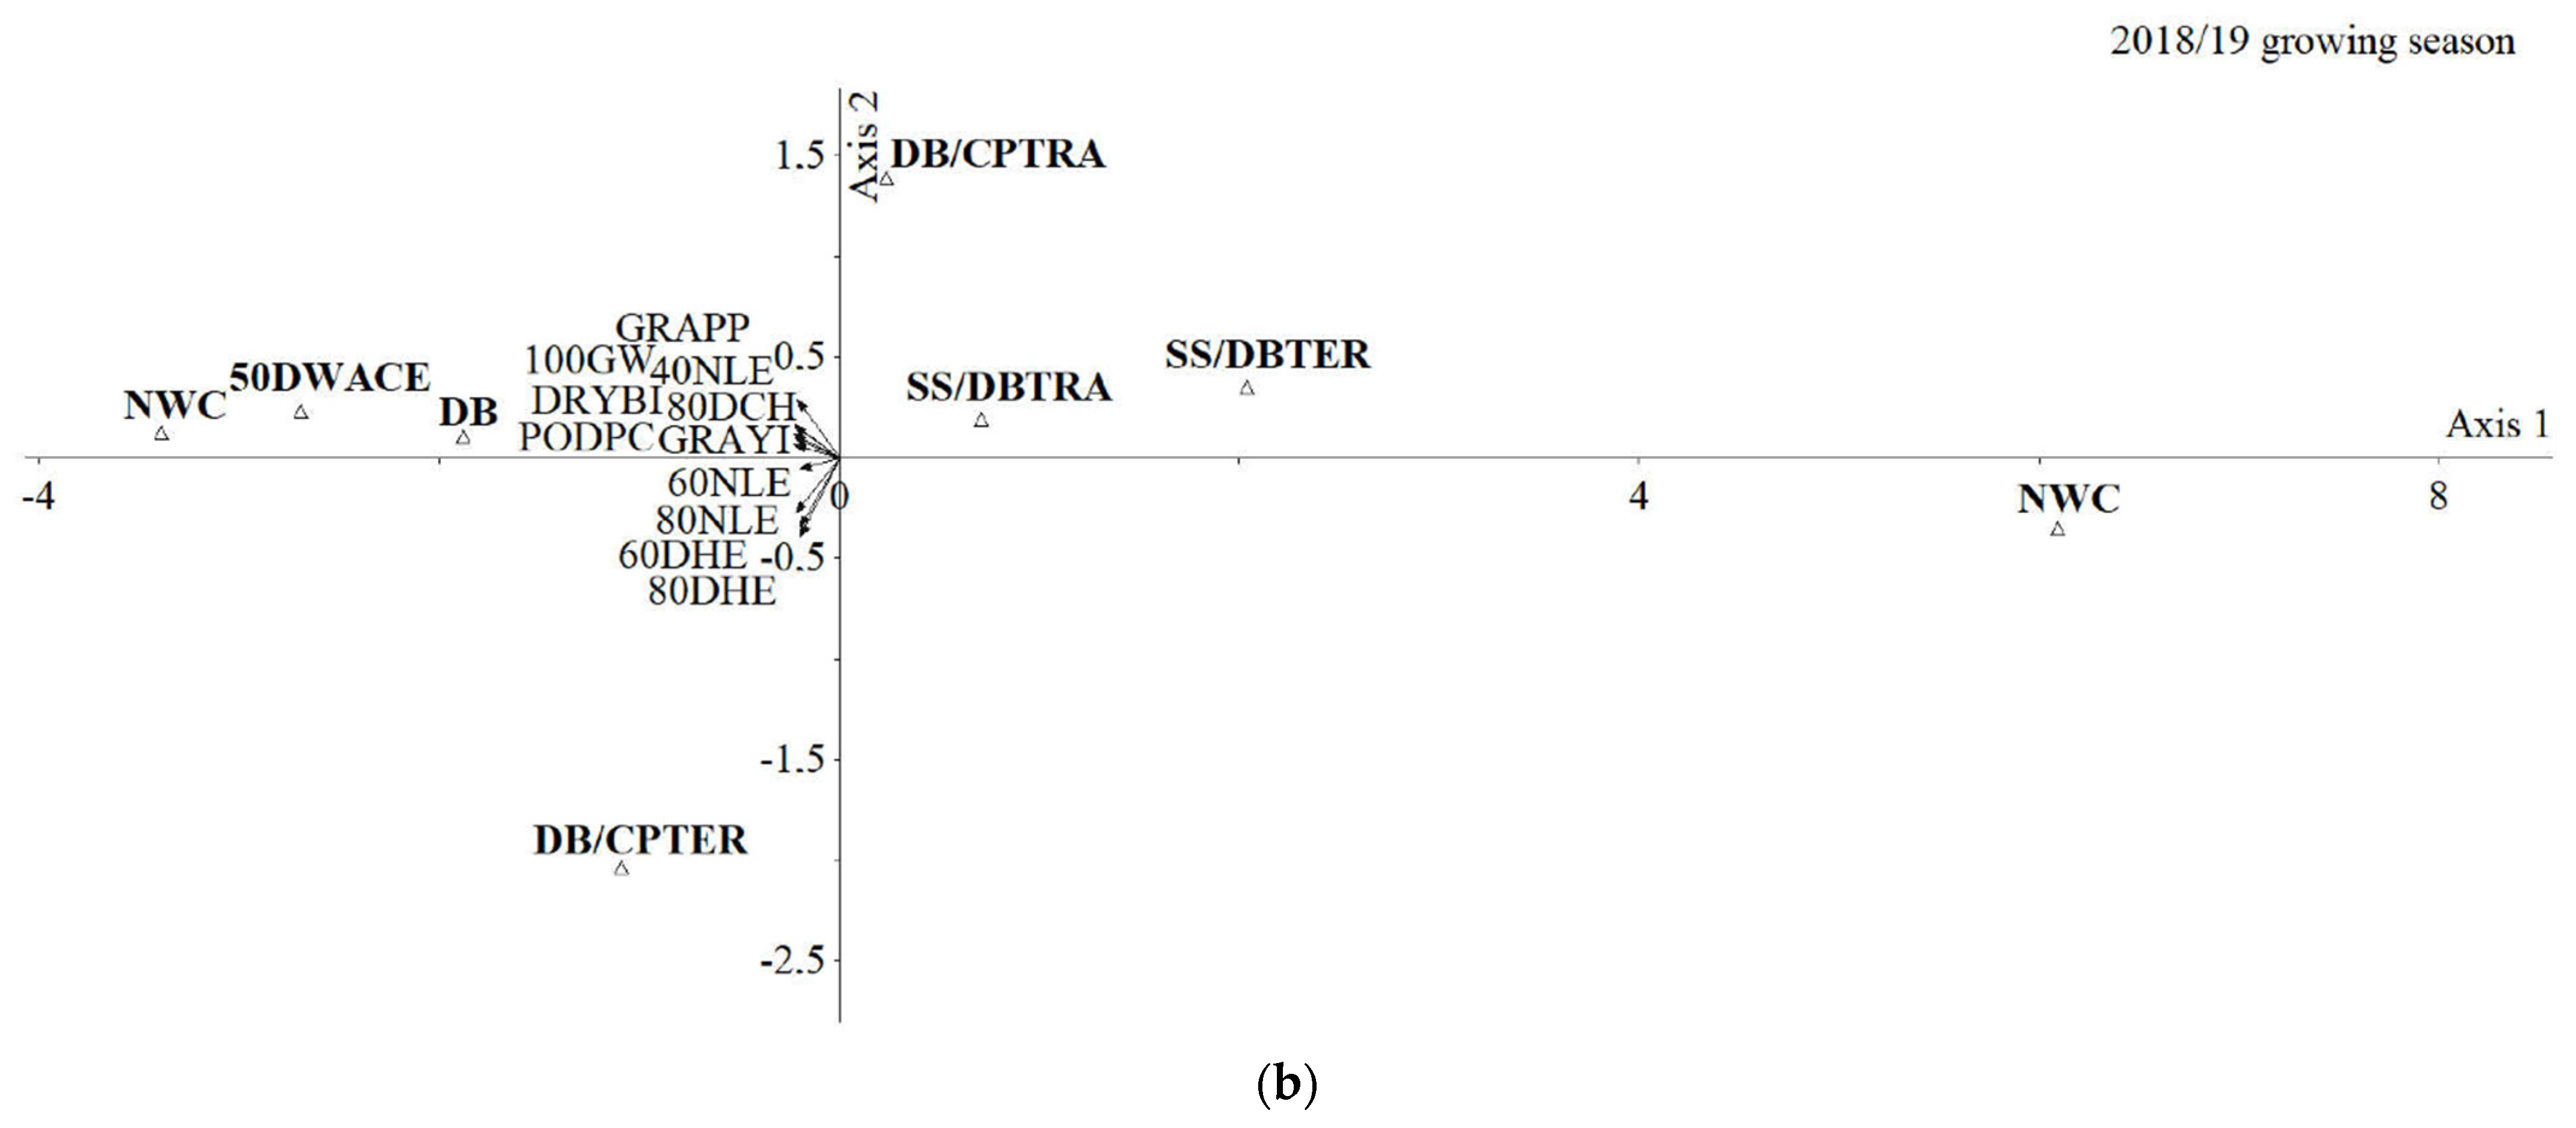
3.7. LER Values and PCA Analysis of Sweet Sorghum/Dry Bean or Cowpea Intercropping under Weed Interference

The effects of intercropping pattern and weeding frequency on dry bean/sweet sorghum or cowpea intercropping performance on the LER value are shown in Table 3. During the 2017/18 growing season, the LER value ranged between 0.91 and 3.75, whereas, in the 2018/19 growing season, the LER value ranged between 0.10 and 2.65 (Table 3). During the 2017/18 growing season, the DB/CP intra-row combined with 50 DWACE resulted in greater LER 3.75 than other treatments, while in the 2018/19 growing season, the SS/DB intra-row altogether with no weed control resulted in higher LER 2.65 than other treatments (Table 3). The intercropping pattern and weeding frequency influenced the LER values; however, the intra-row intercropping pattern had greater LER values than the inter-row intercropping pattern (Table 3). Moreover, all the intercropping treatments had an LER above 1.0, except no weed control, signifying that intercropping was advantageous over sole cropping.
Principal component analysis was used to evaluate correlations of 100-grain weight, dry biomass, grain yield, grains per pod, pods per plant, 60 and 80 DAE plant height, 60 and 80 DAE number of leaves per plant, and 80 DAE chlorophyll with sole DB, DB/CP inter-row intercropping, DB/CP intra-row intercropping, SS/DB inter-row intercropping, SS/DB intra-row intercropping, no weed control, 50 DWACE, and weed-free (Figure 8). The first and second principal components displayed 73.55 and 11.65% for the 2017/18 growing season, and 84.81 and 8% for the 2018/19 growing season of the data variation (Figure 8).

4. Discussion

4.1. Dry Bean 100-Grain Weight

A change in precipitation and other crop growth factors may affect weed species’ distribution and competitive ability between the weed population and the crop [23]; this could explain the fewer weeding frequencies in the second season. Inconsistent progress has been observed in exploring the intercropping pattern and weeding frequency on dry bean performance growth and productivity in dry bean/sweet sorghum or cowpea intercropping over the seasons. The current study evaluated the intercropping pattern and weeding frequency in terms of their interaction on dry bean 100-grain weight, dry biomass, grain yield, grains per pod, pods per plant, plant height, number of leaves per plant, and chlorophyll content. The current research result aligns with the findings of [24], who also reported the reduction in 100-grain weight under weed-infested conditions. However, contrary to Nassary et al. [25], the results found that 100-seed weight was affected by different rainfall distribution over seasons. However, the findings that sole legumes had greater above-ground biomass yields than the associated intercrops were supported [25,26]. The different bean varieties and the cereal used could explain the 100-grain weight contradictions.

4.2. Dry Biomass Yield

Biomass yields declined with decreasing soil fertility status, but this decline varied among legume species and sites [26]. Resource limitation during the weed–crop interaction is a significant yield-reducing factor [13]. The nearby weeds negatively affect common bean yield more than prolonged weed interference or resource limitation, particularly in vegetative stages [13]. The poor performance of dry bean owing to weed interference could be linked to their short and shallow root system, affecting their ability to be competitive for nutrient resources [27].

4.3. Dry Bean Grain Yield

The difference in grain between the 2017/18 and 2018/19 growing seasons could be explained by the drastically different rainfall distribution between the growing seasons, triggering a high interspecific competition between the crops. The lower rainfall received during the second season could have contributed to limited moisture, and hence low yields [26]. The reduction in grain yield in the presence of weeds can be attributed to interspecific competition between crop and weed growth factors [28]. This is probably because of shade provided by the weed canopy on the dry bean, which might have filtered sun radiation for photosynthesis [29], or the shade provided by the sweet sorghum.
Simultaneous sowing of cereal and a grain legume might affect the performance of the legume biomass and the grain yield [25]. Delayed growth before flower setting is one of the bean traits rather than delayed development, pods’ production, and smaller seed size, particularly during adverse environmental conditions [30]. Weed interference throughout the vegetative growth stages of common bean prompts the shade avoidance response, which negatively affects the bean performance, resulting in irretrievable depleted CO2 assimilation, photosynthesis efficiency, and yield; the inhibition of photosynthesis is attributed to the biochemical limitation to the Calvin cycle [13]. McKenzie-Gopsill et al. [13] further stated that all these could be avoided given that the common bean is kept weed-free throughout the vegetative growth stages; moreover, the depletion in photosynthesis and gas exchange correlates with common bean yield during vegetative growth stages.

4.4. Dry Bean Number of Pods per Plant and Grains per Pod

It is worth noting that dry bean was diseased in the 2018/19 growing season; this could be the other reason for the difference in the measured variables between the two seasons. Past research showed that flowering, pod setting, and maturation of grain legume as intercrops could coincide with high precipitation, resulting in high frequency of diseases and pest pressure, thus reducing grain yield as a result of early planting, whereas poor grain yields of the grain legume were the outcome of late planting owing to the late onset of rainfall [31]. Bean pods produced per plant influence grains and yield; hence, cropping systems are supposed to be a pivotal factor to consider in each agro-ecological zone [30]. Depending on weeds’ severity, the greater light competition with high weed density explains the bean grain reduction when compared with low weed density [32]. The increase in the crop productivity of incompatible crop species in an intercropping system is linked with facilitation, sharing, and complementarity in resource acquisition, as well as efficient utilization [33].
The current study results support those of Esmaeilzadeh and Aminpanah [28], that grains per pod and pods per plant were lower under weed-infested environments than weed-free environments. Tapetal degeneration in the dry bean is common, particularly in higher temperatures where photosynthesis declines with excessive flower drop and pollen sterility, negatively affecting grains per pod and pods per plant [34]. In all weed pressure levels, bean leaf area and leaf chlorophyll increased linearly with an increase in N rate application [24]. Shading affects far-red radiation more than red-radiation, leading to great plant height under weed interference [35]. Smith [36] reported that neither cell division nor node formation rate changes were observed under weed interference on stem elongation, but cell division increased.

4.5. Dry Bean Number of Leaves per Plant

The provisioned shade by weeds or sweet sorghum canopy on dry beans might have reduced the sun radiation for photosynthesis [29]. Furthermore, most C3 plants, such as dry beans, are sensitive to limited moisture stress, especially under weed interference [37]. As a result, this affects the development of leaves and causes a reduction in the dry bean leaf area index; it probably minimizes the capacity to photosynthesize, consequently decreasing its production capability, affecting yield components [38].

4.6. LER Values and PCA Ordination

Land equivalent ratio values differed across all the treatment combinations as affected by intercropping and weeding frequency. The intercropped treatments had an LER value above one, compared with sole cropping treatments, except for some treatments under no weed control, which means intercropping was superior to sole cropping. Legumes intercropped with legumes or legumes intercropped with cereals yielded higher LER values; this could suggest that the crop species complement each other by efficiently acquiring growth resources or soil phosphorus (P) [39]. A higher LER for grain yield was reached in the P-deficient soil than in the P-sufficient soil [39], which indicates that intercropping is more advantageous under low soil fertility conditions [26].
The PCA ordination clustered the measured dry bean attributes accordingly with the treatments. Moreover, it showed a consistent relationship between 100-grain weight, grain yield, and 50 DWACE over seasons. The diseased dry bean during the 2018/19 growing and the difference in the amount of rainfall received over the seasons might have contributed to the inconsistency in the number of leaves per plant, plant height, dry biomass, pods per plant, and chlorophyll content with DB/CP inter-row intercropping, 50 DWACE, and sole dry bean.

5. Conclusions

The dry bean growth traits were significantly affected by intercropping patterns and weeding frequency. Intercropping patterns significantly affected the dry bean height and pods per plant. The impact of weeding frequency on dry bean’s significant measured attributes showed an increasing trend, as weeding frequency increased, but somehow remained insignificant between intermediate weeding frequency and weed-free, particularly during the second growing season. Weed control at 50 DAE is critical for maximizing dry bean production under dry bean/sweet sorghum or cowpea intercropping. The further implementation of weed control 50 days after crop emergence could increase crop injury, thus affecting dry bean growth performance or incurring unnecessary labour costs. However, it is recommended that future research should focus on more long-term trials in different regions to observe the dry bean performance in sweet sorghum or cowpea intercropping under weed interference. More growing seasons are needed to answer the questions about which dry bean agronomic traits stabilize in intercropping patterns and weed interference after a certain period.

Author Contributions

Conceptualization, C.B. and A.T.M.; methodology, C.B. and A.T.M.; resources, C.B.; data curation, C.B.; writing—original draft preparation, C.B.; writing—review and editing, C.B., A.T.M. and A.D.N.; supervision, A.T.M. and A.D.N.; funding acquisition, A.D.N. and A.T.M. All authors have read and agreed to the published version of the manuscript.

Funding

This study was funded by the Agricultural Research Council—Soil, Climate, and Water (ARC-SCW) and the University of KwaZulu-Natal.

Institutional Review Board Statement

Not applicable.

Informed Consent Statement

Not applicable.

Data Availability Statement

The data presented in this study are available in the manuscript.

Acknowledgments

Agricultural Research Council—Soil, Climate, and Water (ARC-SCW) and the University of KwaZulu-Natal.

Conflicts of Interest

The authors declare no conflict of interest.

References

  1. Mathobo, R.; Marais, D.; Steyn, J.M. The effect of drought stress on yield, leaf gaseous exchange and chlorophyll fluorescence of dry beans (Phaseolus vulgaris L.). Agric. Water Manag. 2017, 180, 118–125. [Google Scholar] [CrossRef] [Green Version]
  2. Weisany, W.; Zehtab-Salmasi, S.; Raei, Y.; Sohrabi, Y.; Ghassemi-Golezani, K. Can arbuscular mycorrhizal fungi improve competitive ability of dill+common bean intercrops against weeds? Eur. J. Agron. 2016, 75, 60–71. [Google Scholar] [CrossRef]
  3. MacLaren, C.; Storkey, J.; Menegat, A.; Metcalfe, H.; Dehnen-Schmutz, K. An ecological future for weed science to sustain crop production and the environment, A review. Agron. Sustain. Dev. 2020, 40, 24. [Google Scholar] [CrossRef]
  4. Fung, K.M.; Tai, A.P.K.; Yong, T.; Liu, X.; Lam, H.M. Co-benefits of intercropping as a sustainable farming method for safeguarding both food security and air quality. Environ. Res. Lett. 2019, 14, 44011. [Google Scholar] [CrossRef]
  5. Fernandez, M.R.; Zentner, R.P.; Schellenberg, M.P.; Leeson, J.Y.; Aladenola, O.; McConkey, B.G.; St. Luce, M. Grain Yield and Quality of Organic Crops Grown under Reduced Tillage and Diversified Sequences. Agron. J. 2019, 111, 793–804. [Google Scholar] [CrossRef] [Green Version]
  6. Fernando, N.; Florentine, S.K.; Naiker, M.; Panozzo, J.; Chauhan, B.S. Annual ryegrass (Lolium rigidum Gaud) competition altered wheat grain quality: A study under elevated atmospheric CO2 levels and drought conditions. Food Chem. 2019, 276, 285–290. [Google Scholar] [CrossRef] [Green Version]
  7. Stagnari, F.; Pisante, M. The critical period for weed competition in French bean (Phaseolus vulgaris L.) in Mediterranean areas. Crop Prot. 2011, 30, 179–184. [Google Scholar] [CrossRef]
  8. Owen, M.D.K.; Beckie, H.J.; Leeson, J.Y.; Norsworthy, J.K.; Steckel, L.E. Integrated pest management and weed management in the United States and Canada. Pest Manag. Sci. 2014, 71, 357–376. [Google Scholar] [CrossRef]
  9. Dusabumuremyi, P.; Niyibigira, C.; Mashingaidze, A.B. Narrow row planting increases yield and suppresses weeds in common bean (Phaseolus vulgaris L.) in a semi-arid agro-ecology of Nyagatare, Rwanda. Crop Prot. 2014, 64, 13–18. [Google Scholar] [CrossRef]
  10. Van Der Weide, R.Y.; Bleeker, P.O.; Achten, V.T.J.M.; Lotz, L.A.P.; Fogelberg, F.; Melander, B. Innovation in mechanical weed control in crop rows. Weed Res. 2008, 48, 215–224. [Google Scholar] [CrossRef]
  11. Knezevic, S.Z.; Evans, S.P.; Blankenship, E.E.; Van Acker, R.C.; Lindquist, J.L. Critical period for weed control: The concept and data analysis. Weed Sci. 2002, 50, 773–786. [Google Scholar] [CrossRef] [Green Version]
  12. Sardana, V.; Mahajan, G.; Jabran, K.; Chauhan, B.S. Role of competition in managing weeds: An introduction to the special issue. Crop Prot. 2017, 95, 1–7. [Google Scholar] [CrossRef]
  13. McKenzie-Gopsill, A.G.; Amirsadeghi, S.; Fillmore, S.; Swanton, C.J. Duration of Weed Presence Influences the Recovery of Photosynthetic Efficiency and Yield in Common Bean (Phaseolus vulgaris L.). Front Agron. 2020, 2, 24. [Google Scholar] [CrossRef]
  14. Soltani, N.; Dille, J.A.; Gulden, R.H.; Sprague, C.L.; Zollinger, R.K.; Morishita, D.W.; Lawrence, N.C.; Sbatella, G.M.; Kniss, A.R.; Jha, P.; et al. Potential Yield Loss in Dry Bean Crops Due to Weeds in the United States and Canada. Weed Technol. 2018, 32, 342–346. [Google Scholar] [CrossRef]
  15. Tursun, N.; Datta, A.; Budak, S.; Kantarci, Z.; Knezevic, S.Z. Row spacing impacts the critical period for weed control in cotton (Gossypium hirsutum). Phytoparasitica 2016, 44, 139–149. [Google Scholar] [CrossRef]
  16. Buerkert, A.; Schlecht, E. Agricultural innovations in small-scale farming systems of Sudano-Sahelian West Africa: Some prerequisites for success. Sci. Chang. Planétaires/Secher. 2013, 24, 322–329. [Google Scholar] [CrossRef]
  17. Rosa-Schleich, J.; Loos, J.; Mußhoff, O.; Tscharntke, T. Ecological-economic trade-offs of Diversified Farming Systems—A review. Ecol. Econ. 2019, 160, 251–263. [Google Scholar] [CrossRef]
  18. Brooker, R.W.; Karley, A.J.; Newton, A.C.; Pakeman, R.J.; Schöb, C. Facilitation and sustainable agriculture: A mechanistic approach to reconciling crop production and conservation. Funct. Ecol. 2016, 30, 98–107. [Google Scholar] [CrossRef] [Green Version]
  19. Altieri, M.A.; Nicholls, C.I.; Montalba, R. Technological Approaches to Sustainable Agriculture at a Crossroads: An Agroecological Perspective. Sustainability 2017, 9, 349. [Google Scholar] [CrossRef] [Green Version]
  20. Snapp, S.; Rahmanian, M.; Batello, C. Pulse Crops for Sustainable Farms in Sub-Saharan Africa; Calles, T., Ed.; Food and Agriculture Organization of the United Nations (FAO): Rome, Italy, 2018. [Google Scholar] [CrossRef] [Green Version]
  21. Buruchara, R.; Chirwa, R.; Sperling, L.; Mukankusi, C.; Rubyogo, J.C.; Muthoni, R. Development and delivery of bean varieties in Africa: The Pan-Africa bean research alliance (PABRA) model. Afr. Crop Sci. J. A J. Trop Crop Sci. Prod. 2011, 19, 227–245. [Google Scholar]
  22. Baker, C.; Modi, A.T.; Nciizah, A.D. Sweet Sorghum (Sorghum bicolor) Performance in a Legume Intercropping System under Weed Interference. Agronomy 2021, 11, 877. [Google Scholar] [CrossRef]
  23. Amare, T. Review on Impact of Climate Change on Weed and Their Management. Am. J. Biol. Environ. Stat. 2016, 2, 21. [Google Scholar] [CrossRef] [Green Version]
  24. Saberali, S.F.; Mohammadi, K. The above-ground competition between common bean (Phaseolus vulgaris L.) and barnyardgrass (Echinochloa crus-galli L.) affected by nitrogen application. Phytoparasitica 2019, 47, 451–460. [Google Scholar] [CrossRef]
  25. Nassary, E.K.; Baijukya, F.; Ndakidemi, P.A. Productivity of intercropping with maize and common bean over five cropping seasons on smallholder farms of Tanzania. Eur. J. Agron. 2020, 113, 125964. [Google Scholar] [CrossRef]
  26. Kermah, M.; Franke, A.C.; Adjei-Nsiah, S.; Ahiabor, B.D.K.; Abaidoo, R.C.; Giller, K.E. Maize-grain legume intercropping for enhanced resource use efficiency and crop productivity in the Guinea savanna of northern Ghana. Field Crop. Res. 2017, 213, 38–50. [Google Scholar] [CrossRef]
  27. Karuma, A.N.; Gachene, C.K.K.; Gicheru, P.T.; Mtakwa, P.W.; Amuri, N. Effects of tillage and cropping systems on maize and beans yield and selected yield components in a semi-arid area of Kenya. Trop Subtrop. Agroecosyst. 2016, 19, 167–179. [Google Scholar]
  28. Esmaeilzadeh, S.; Aminpanah, H. Effects of planting date and spatial arrangement on common bean (Phaseolus vulgaris) yield under weed-free and weedy conditions. Planta Daninha. 2015, 33, 425–432. [Google Scholar] [CrossRef] [Green Version]
  29. Ghamari, H.; Ahmadvand, G. Weed Interference Affects Dry Bean Yield and Growth. Not. Sci. Biol. 2012, 4, 70–75. [Google Scholar] [CrossRef] [Green Version]
  30. Nassary, E.K.; Baijukya, F.; Ndakidemi, P.A. Assessing the productivity of common bean in intercrop with maize across agro-ecological zones of smallholder farms in the Northern highlands of Tanzania. Agriculture 2020, 10, 117. [Google Scholar] [CrossRef] [Green Version]
  31. Kermah, M.; Franke, A.C.; Ahiabor, B.D.K.; Adjei-Nsiah, S.; Abaidoo, R.C.; Giller, K.E. Legume-Maize Rotation Or Relay? Options For Ecological Intensification Of Smallholder Farms In The Guinea Savanna Of Northern Ghana. Exp. Agric. 2018, 55, 673–691. [Google Scholar] [CrossRef] [PubMed] [Green Version]
  32. Tollenaar, M.; Nissanka, S.P.; Aguilera, A.; Weise, S.F.; Swanton, C.J. Effect of Weed Interference and Soil Nitrogen on Four Maize Hybrids. Agron. J. 1994, 86, 596–601. [Google Scholar] [CrossRef]
  33. Brooker, R.W.; Bennett, A.E.; Cong, W.F.F.; Daniell, T.J.; George, T.S.; Hallett, P.D.; Hawes, C.; Iannetta, P.P.; Jones, H.G.; Karley, A.J.; et al. Improving intercropping: A synthesis of research in agronomy, plant physiology and ecology. New Phytol. 2015, 206, 107–117. [Google Scholar] [CrossRef]
  34. Muñoz-Perea, C.G.; Terán, H.; Allen, R.G.; Wright, J.L.; Westermann, D.T.; Singh, S.P. Selection for Drought Resistance in Dry Bean Landraces and Cultivars. Crop Sci. 2006, 46, 2111–2120. [Google Scholar] [CrossRef] [Green Version]
  35. Röhrig, M.; Stützel, H. Canopy development of Chenopodium album in pure and mixed stands. Weed Res. 2001, 41, 111–128. [Google Scholar] [CrossRef]
  36. Smith, H. The perception of light quality. In Photomorphogenesis in Plants; Springer Science + Business Media: Dordrecht, The Netherlands, 1986; pp. 187–217. [Google Scholar]
  37. Bukun, B. Critical periods for weed control in cotton in Turkey. Weed Res. 2004, 44, 404–412. [Google Scholar] [CrossRef]
  38. Ghamari, H.; Ahmadvand, G. Growth Analysis of Dry Bean (Phaseolus vulgaris L.) in Different Weed Interference Situations. Not. Sci. Biol. 2013, 5, 394–399. [Google Scholar] [CrossRef] [Green Version]
  39. Latati, M.; Bargaz, A.; Belarbi, B.; Lazali, M.; Benlahrech, S.; Tellah, S.; Kaci, G.; Drevon, J.J.; Ounane, S.M. The intercropping common bean with maize improves the rhizobial efficiency, resource use and grain yield under low phosphorus availability. Eur. J. Agron. 2016, 72, 80–90. [Google Scholar] [CrossRef]
Figure 1. Weed frequency effect on dry bean (a) 100-grain weight and (b) dry biomass during the 2017/18 growing season. The error bars denote S.E.D, and different letters indicate significant differences.
Sustainability 13 12328 g001
Figure 2. Weeding frequency effect on dry bean (a) grain yield, (b) grains per pod, and (c) pods per plant during the 2017/18 and 2018/19 growing season, as well as (d) dry bean leaf chlorophyll content during the 2018/19 growing season. The error bars denote S.E.D, and different letters indicate significant differences.
Sustainability 13 12328 g002aSustainability 13 12328 g002b
Figure 3. Intercropping pattern and weeding frequency interaction effect on (a) 100-grain weight, (b) dry biomass, and (c) 40 DAE number of leaves per plant during the 2018/19 growing season, as well as (d) 80 DAE plant height during the 2017/18 growing season. The error bars denote S.E.D, and different letters indicate significant differences.
Sustainability 13 12328 g003
Figure 4. Intercropping pattern effect on the number of dry bean pods per plant during the 2017/18 and 2018/19 growing seasons. The error bars denote S.E.D, and different letters indicate significant differences.
Sustainability 13 12328 g004
Figure 5. Intercropping pattern effect on dry bean plant height during the 2017/18 and 2018/19 growing seasons. The error bars denote S.E.D, and different letters indicate significant differences.
Sustainability 13 12328 g005
Figure 6. Weeding frequency effect on dry bean (a) plant height and (b) the number of leaves per plant in the 2017/18 and 2018/19 growing seasons. The error bars denote S.E.D, and different letters indicate significant differences.
Sustainability 13 12328 g006
Figure 7. Intercropping pattern effect on dry bean leaf chlorophyll content at 80 DAE during the 2017/18 growing season. The error bars denote S.E.D, and different letters indicate significant differences.
Sustainability 13 12328 g007
Figure 8. Principal component analysis of intercropping pattern and weeding frequency on dry bean performance under sweet sorghum or cowpea intercropping during the (a) 2017/18 growing season and (b) 2018/19 growing season. Vectors indicate measured variables from the first axis and second axis. 100GW = 100-grain weight, 80DCH = 80 DAE chlorophyll, DRYBI = dry bean biomass, GRAYI = dry bean grain yield, 60DHE = 60 DAE height, 80DHE = 80 DAE plant height, GRAPP = grains per pod, 60NLE = 60 DAE number of leaves, 80NLE = 80 DAE number of leaves, PODPC = pods per plant. NWC = no weed control, 50 DWACE = 50 days weed control after crop emergence, WF = weed-free, DB = sole dry bean, DB/CPTER = dry bean/cowpea inter-row intercropping, DB/CPTRA = dry bean/cowpea intra-row intercropping, SS/DBTER = sweet sorghum/dry bean inter-row intercropping, SS/DBTRA = sweet sorghum/dry bean intra-row intercropping.
Sustainability 13 12328 g008aSustainability 13 12328 g008b
Table 1. Analysis of variance of dry bean measured attributes during the 2017/18 growing season.
Source of VariationIntercropping PatternWeeding FrequencyIntercropping Pattern × Weeding FrequencyResidualCV
df
42828
ms
100-grain weight81 ns3974 ***145.8 ns102.128.2
Dry biomass0.26 ns4.4 ***0.16 ns0.1040.1
Grain yield15,350 ns240,969 ***18,336 ns841153.6
Grains per pod0.80 ns10.86 ***0.82 ns0.3719.9
Pods per plant219.11 **2920.69 ***40.3 ns44.9630.0
Plant height60 DAE55.73 **368.36 ***7.09 ns10.348.2
80 DAE20.35 ns111.96 ***21.63 *9.1213.1
Chlorophyll80 DAE146.96 **127.18 ns18.01 ns44.774.7
ns: not significant; *, **, and *** significant at 0.05, 0.01, and 0.001 probability levels, respectively.
Table 2. Analysis of variance of dry bean measured attributes during the 2018/19 growing season.
-Intercropping PatternWeeding FrequencyIntercropping Pattern × Weeding FrequencyResidualCV
df
42828
ms
100-grain weight58.82 ns8812.18 ***68.33 *29.7418.1
Dry biomass0.04 **0.35 ***0.02 *0.0145.6
Grain yield4201 ns55,951 ***2385 ns167026.1
Grains per pod0.98 ns75.71 ***1.34 ns0.7131.7
Pods per plant42.78 *1037.95 ***21.4 ns11.452.0
Plant height40 DAE140.44 *211.65 ***94.73 ns49.0749.8
60 DAE140.75 ns533.99 ***131.90 ns62.7032.8
80 DAE453.9 **1513.9 ***106.9 ns120.74.2
Number of leaves40 DAE9.44 ns114.83 ***24.52 *10.6331.7
60 DAE26.39 ns70.04 ***20.94 ns18.7454.2
80 DAE30.73 ns203.05 **23.61 ns24.7565.2
Chlorophyll40 DAE150.15 ns425.48 *118.6 ns89.7649.6
80 DAE219.5 ns4061 *131.8 ns160.945.8
ns: not significant; *, **, and *** significant at 0.05, 0.01, and 0.001 probability levels, respectively.
Table 3. Dry bean, sweet sorghum, and cowpea LER for the 2017/18 and 2018/19 growing seasons.
Growing SeasonIntercropping PatternWeeding FrequencyTotal PlotYield Type
NWC50 DWACEWF
2017/18DB/CP inter-row-1.721.031.60Grain t/ha
DB/CP intra-row1.153.751.432.13
SS/DB inter-row0.912.031.701.66Dry biomass t/ha
SS/DB intra-row1.122.782.12.19
2018/19DB/CP inter-row0.132.271.671.71Grain t/ha
DB/CP intra-row0.102.381.671.73
SS/DB inter-row1.271.651.821.96Dry biomass t/ha
SS/DB intra-row2.651.841.601.75
NWC, no weed control; 50 DWACE, 50 days weed-control after crop emergence; WF, weed-free; DB/CP inter-row, dry bean/cowpea inter-row intercropping; DB/CP intra-row, dry bean/cowpea intra-row intercropping; SS/DB inter-row intercropping, sweet sorghum/ dry bean inter-row intercropping; SS/DB intra-row intercropping, sweet sorghum/dry bean intra-row intercropping.
Publisher’s Note: MDPI stays neutral with regard to jurisdictional claims in published maps and institutional affiliations.

