Abstract
Data-driven modeling, action, and strategies have become popular, and the education community has witnessed increased interest in data-driven decision-making (DDDM). DDDM values and prioritizes decisions supported by high-quality, verifiable data that has been effectively processed and analyzed. The objective of our study is to describe the design, development, and implementation of a data-driven, evidence-based model of academic development in the context of CUNY Graduate School of Public Health and Health Policy (CUNY SPH) utilizing SMAART (Sustainability Multisector Accessible Affordable Reimbursable Tailored) model. The alignment of academic and student affairs within CUNY SPH brought with it several challenges. Defining roles and responsibilities across different student and academic affair units with a goal of collaborative leadership model and lack of meaningfulness were key challenges. It was important to listen to the experiences and recommendations of various individuals performing various functions in different capacities. A unified framework of key data indicators was needed to create a transparent and equitable model. An innovative interactive SMAART SPH dashboard designed, developed, and implemented to guide data-driven, evidence-based decision-making. Institutions can use a large amount of data from various sources to improve students’ learning experience, enhance research initiatives, support effective community outreach, and develop campus infrastructure to bring in sustainability.
1. Background
In recent years, data-driven modeling, action, and strategies have become popular, and the education community has witnessed increased interest in data-driven decision-making (DDDM) [1]. “Driven by data” requires more than just the existence of good data. It requires a meaningful process for developing data frameworks, questions, conducting exploration and analysis, and ultimately, using the data to help arrive at strategies and solutions. It is critical to leverage data-driven decision-making and spurn innovation in higher education by having an optimal strategy that prioritizes data standardization, integration, transparency, quality, and reliability and makes the most of their resources. Data-driven decision-making values and prioritizes decisions supported by high-quality, verifiable data that has been effectively processed and analyzed. Institutions can use a large amount of data being generated from various sources to improve the students’ learning experience, enhance research initiatives, support effective community outreach, and develop campus infrastructure to bring in sustainability [2].
Early intervention with at-risk students through coordinated student support services can enhance student retention and student success rates and ultimately student satisfaction and enhanced learning. However, faculty productivity levels are just as important as student success rates. Enrollment numbers can often affect faculty productivity levels, which is why a reliable and predictive reporting process is vital. The unique structure and culture of higher education workplaces and the ways in which faculty work is assigned, assumed, and rewarded also contribute to workload mismatch and faculty dissatisfaction [3]. Departments include faculty members of different career stages, appointment types, and concentration areas. Faculty workloads differ depending on discipline, institution, and the various contributions faculty members can make in domains of scholarship [4]. Although frameworks for work activities are fixed (e.g., teaching load), other modifiers are discretionary and unregulated. Faculty typically choose whether or not to serve on committees, take on new students as advisees, prepare academic programs for external review, and apply for and pursue externally funded research, to name only a few work activities. The organization of faculty workload and distribution allows for significant unintended ambiguity and or inequities. Research has shown that educational practitioners make decisions based on intuition [5]. Problems of equity are rarely resolved quickly and without considerable price in faculty morale. Lack of accountability and transparency, ambiguity built into the system, a continuum of preferred/rewarded roles, and lack of department consensus on equity across domains of scholarship can help explain why so many national faculty surveys report high levels of workload dissatisfaction [6].
It is important to use data to determine the causes of a problem before taking improvement actions. We aim to improve: transparency in what faculty are doing, accountability, clarity in roles and expectations, and flexibility to acknowledge and reward diversity in performance and participation. Transparency increases the sense of accountability and trust between members and leaders, facilitates perceptions of procedural and distributive justice, and leads to greater organizational commitment [7]. The immediate need is to establish robust data systems, combined with a well-coordinated, multi-stakeholder collaboration across administrative and academic units to drive evidence-based modeling of academic management. Data-driven decision-making will enable administrators to determine successes and challenges, identify areas of improvement, and help evaluate the effectiveness of programs [8]. Aligning meaningful goals for evidence-based academic management brings with it unique opportunities and challenges. These include assembling high-quality raw data, conducting analysis that ensures results are relevant, and using relevant data to inform academic decisions. It is important to maximize data utilization and interpretation to evaluate past challenges and predict future ones; use both quantitative and qualitative data; understand data limitations; turn to multiple sources of data; and integrate, review, and validate data. Work allocation systems with comprehensive, objective criteria can help resolve inequity. Prior literature has highlighted the use of data to better understand our own operations and pave the way for developing new, innovative approaches for greater institutional efficiency. Transparency increases the sense of accountability and trust between team members and leaders and is conducive to greater organizational commitment [9,10].
The objective of our study is to describe the design, development, and implementation of a human-centered, internet-enabled dashboard, with data-driven, evidence-based models of academic development in the context of CUNY Graduate School of Public Health and Health Policy utilizing the SMAART model. To the best of our knowledge, it is the first study outlining the value of implementing collaborative, coordinated, data-driven decision-making approaches across various administrative and academic units towards enhancement of a transparent, equitable, sustainable environment of academic success.
2. SMAART Model
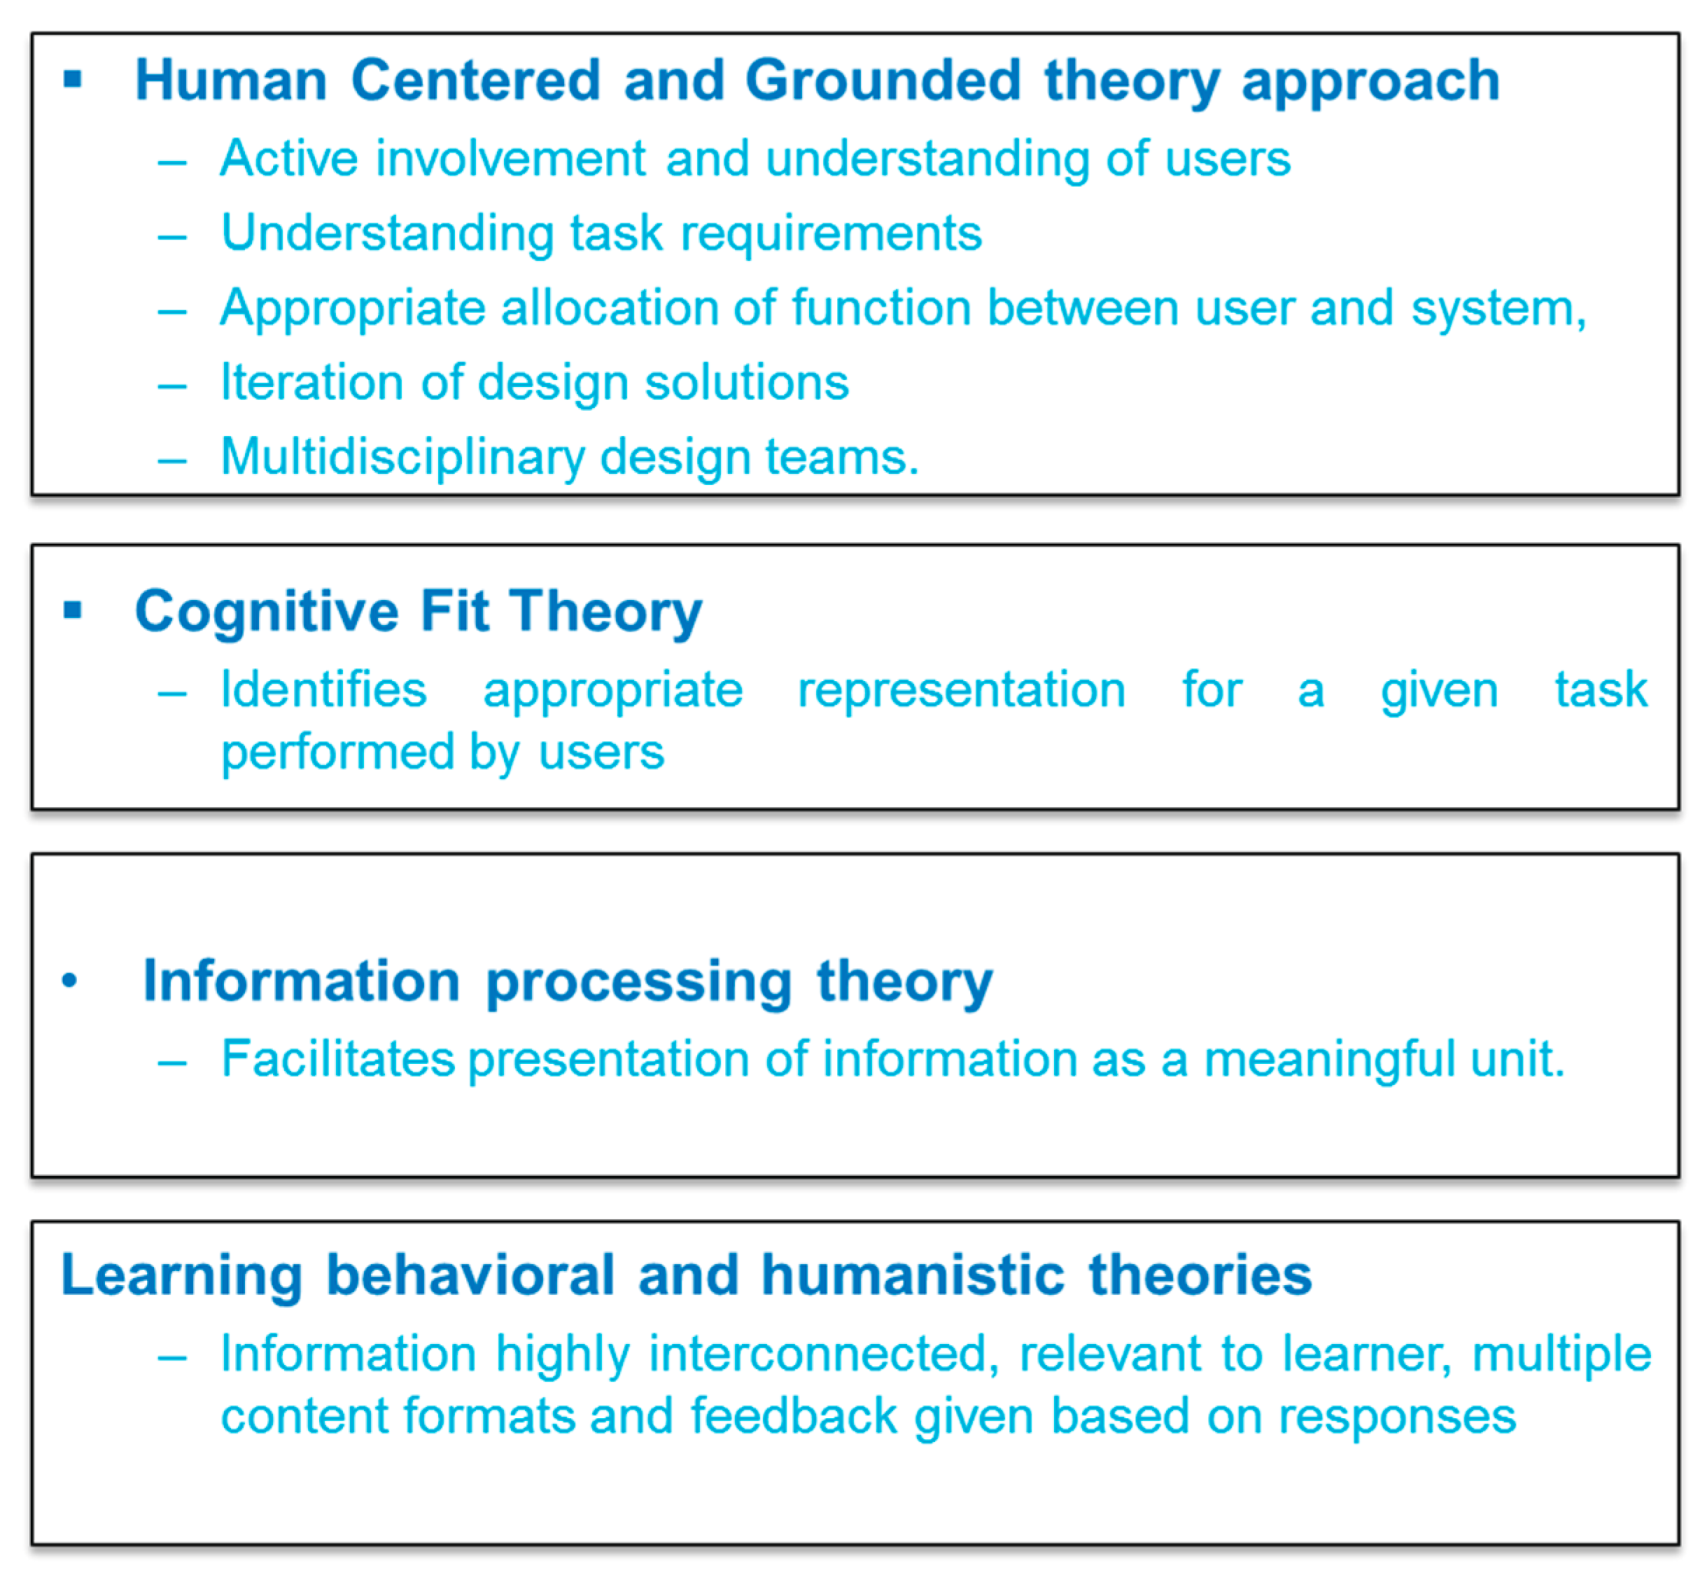
The SMAART model (Sustainable, Multisector, Accessible, Affordable, Reimbursable, and Tailored), a Population Health Informatics (PopHI) framework, is conceptualized using the principles of Data, Information, and Knowledge (DIK); human-centered approach; cognitive fit theory; information processing theory; and humanistic, behavioral, and learning theories to develop a data-driven, evidence-based model of academic management (Figure 1). The DIK pathway makes data more meaningful [11,12]. The principles of a human-centered approach involve: (a) active involvement and understanding of users, (b) understanding task requirements, (c) appropriate allocation of function between user and system, (d) iteration of design solutions, and (e) multidisciplinary design teams [11,12]. Understanding users is an important aspect for creating useable health information applications. Task classification has shown to create useful applications [13]. Cognitive fit theory (CFT) explains how graphical displays affect the decision processes [14,15]. CFT depends upon fit between information presentation and tasks used by decision maker. Cognitive fit identifies an appropriate representation for a given task performed by users [15]. Information processing theory facilitates presentation of information as a meaningful unit [16]. When the information presentation matches the task, it produces faster and more accurate results. These benefits translate into system and task-related performance factors. Learning, behavioral, and humanistic theories suggest that information needs to be highly interconnected, relevant to the learner, in multiple content formats and with feedback given based on responses [17].
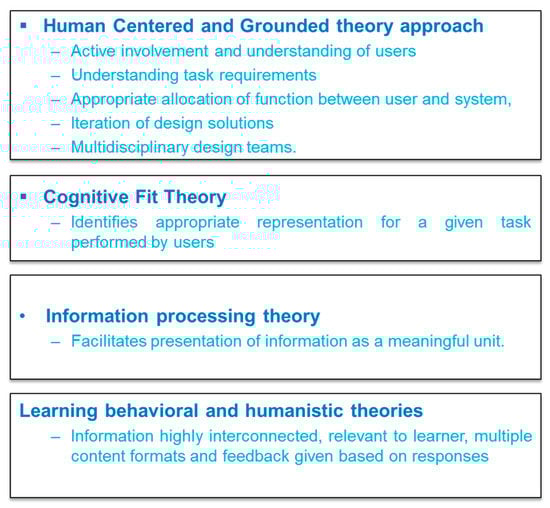
Figure 1.
Theoretical framework of the SMAART Model.
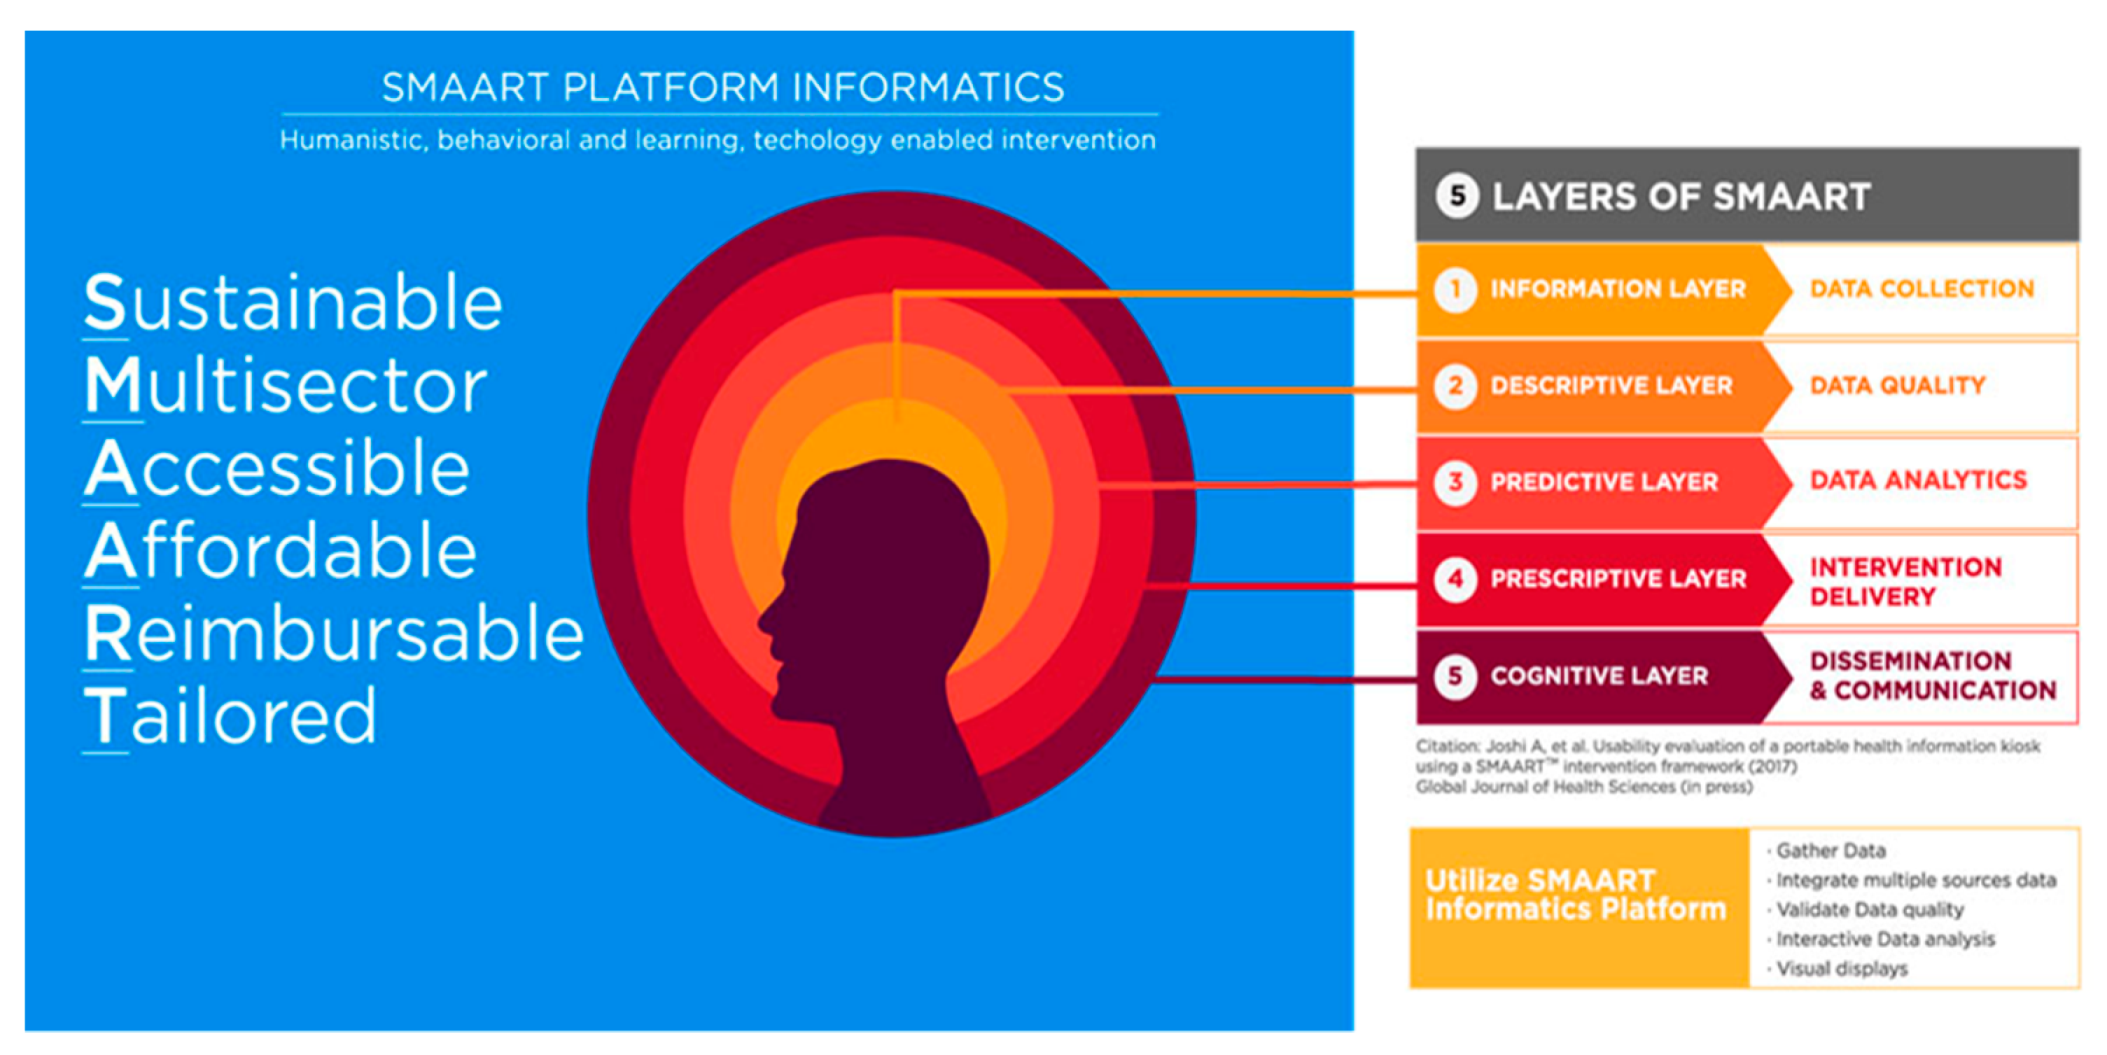
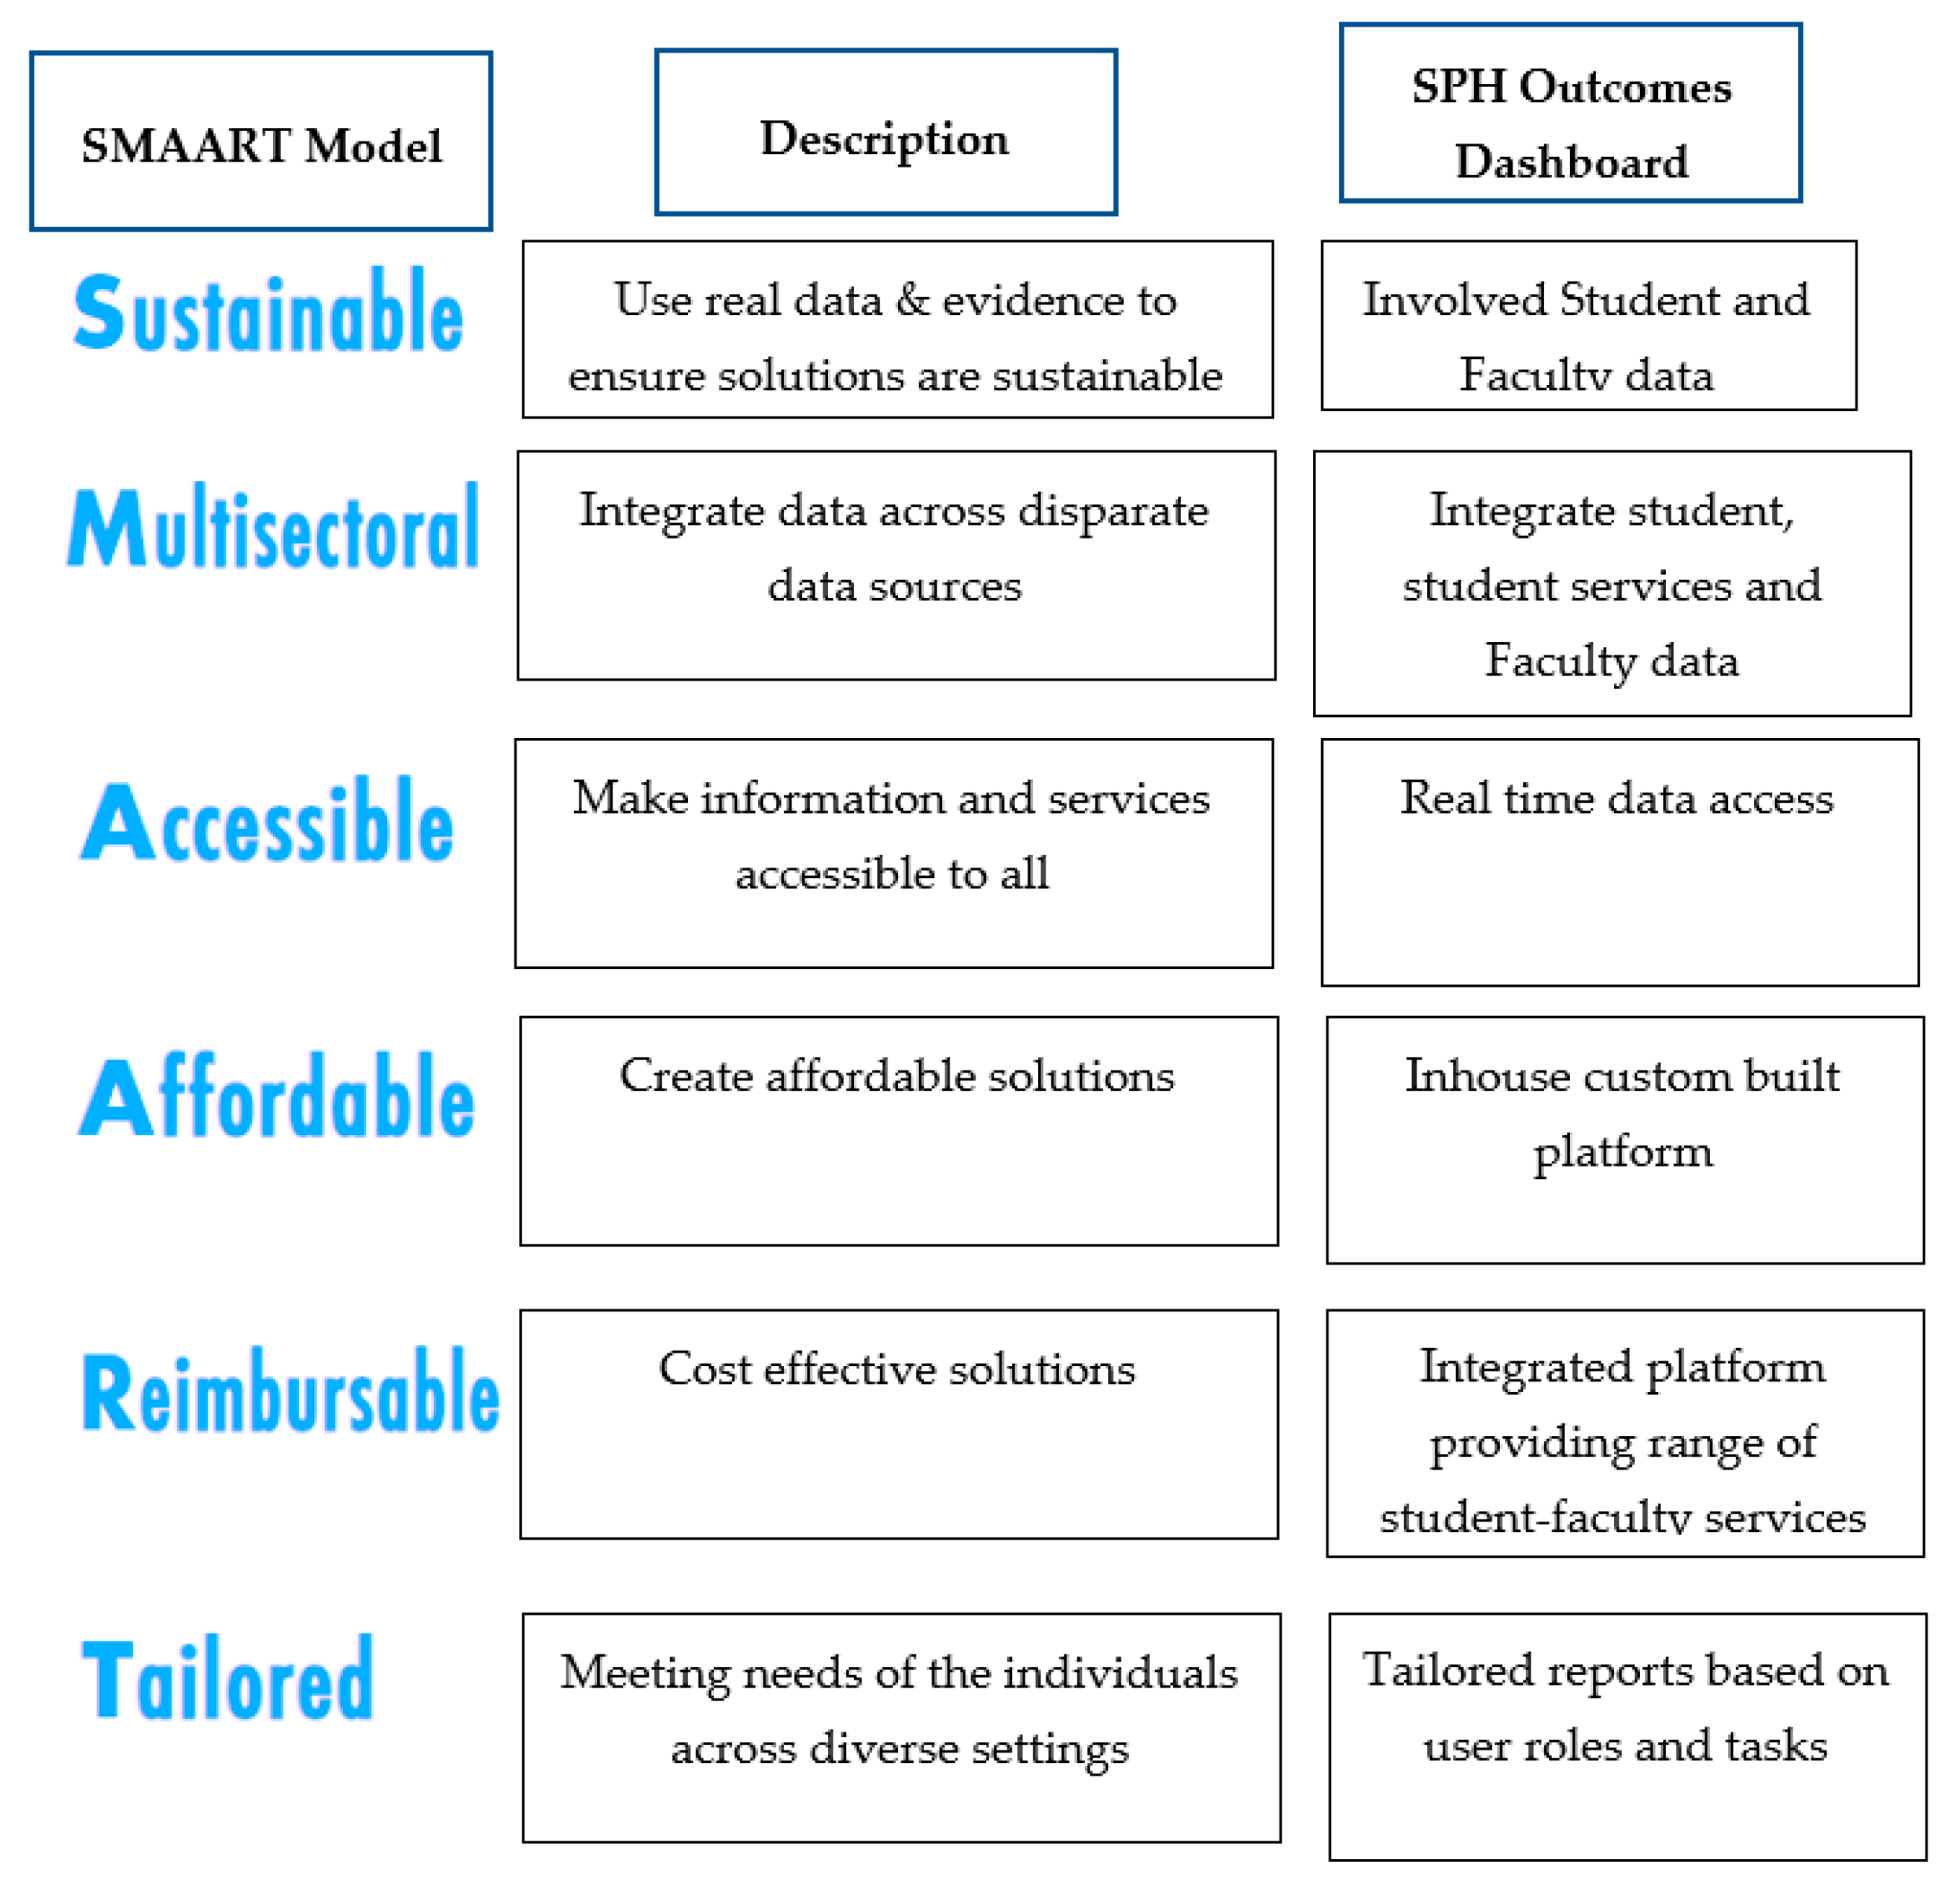
In the SMAART Model, Sustainability highlights the use of real data and evidence to ensure that developed solutions are Sustainable, Multisectoral indicates integration of data from disparate sources to influence outcomes, Accessible indicates making information and services accessible to all, Affordable indicates creating solutions that are affordable to all, Reimbursement reflects upon return on investment with cost-effective solutions, and Tailored indicates meeting the needs of the individuals across diverse settings.
SMAART Informatics Platform
The SMAART informatics platform is an internet-enabled platform that has been designed, developed, and implemented and includes several layers such as (a) information layer (emphasis on data collection), (b) descriptive layer (emphasis on data quality), (c) predictive layer (emphasis on data analytics), (d) prescriptive layer (emphasis on intervention delivery), and (e) cognitive layer (emphasis on dissemination and communication). The layers of SMAART informatics platform facilitates (a) transmission and integration of data, (b) interpretation of data in an evidence-based manner, (c) addressing specific consumer needs, (d) provision of timely feedback to the consumer, and (e) repetition of the feedback loop of information processing. The SMAART informatics platform gathers multi-faceted, multi-level, and multi-dimensional data and analyzes that data into meaningful information that is contextually relevant (Figure 2) [11,12].
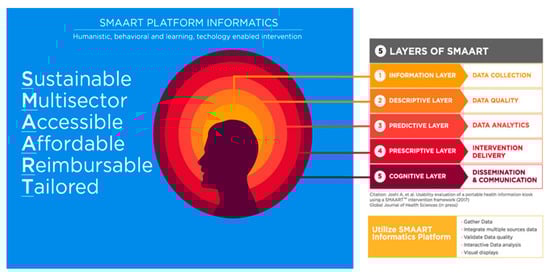
Figure 2.
Layers of SMAART informatics platform.
3. Methods
The alignment of academic and student affairs within the CUNY Graduate School of Public Health and Health Policy was institutionalized in July 2018 with the goal of a collaborative leadership model to ensure its optimal functioning. This alignment brought with it several challenges and opportunities.
One challenge was to define roles and responsibilities as there were several functions that overlapped across different student and academic affair units.
Second, it was important to listen to the experiences and recommendations of the administrative staff of various units who were responsible for performing student functions in various capacities. This required continuous, ongoing coordination and collaboration across multiple individuals from different units with different perspectives incorporating the principles of diversity, inclusiveness, and equity. These activities involved meticulous and continuous oversight and involved several rounds of deliberations and meetings with various stakeholders.
Third, data across faculty workload including teaching, research buy out, instructional class size, service, and new course development all was recorded across different formats and platforms, resulting sometimes in both data being incomplete or inaccurate. Each data source included different data fields in different data formats.
Fourth, similar data-related challenges were observed across student data related to various student support services including academic probation, student advisement, International Student Office, experiential learning, and career services. The data being recorded in various formats limited its integration, hindering optimal decision-making to provide tailored and student services.
We implemented combined principles of human-centered design, cognitive theory, information processing theory and learning, behavioral, and humanistic theories to conduct user, task, and requirement analysis.
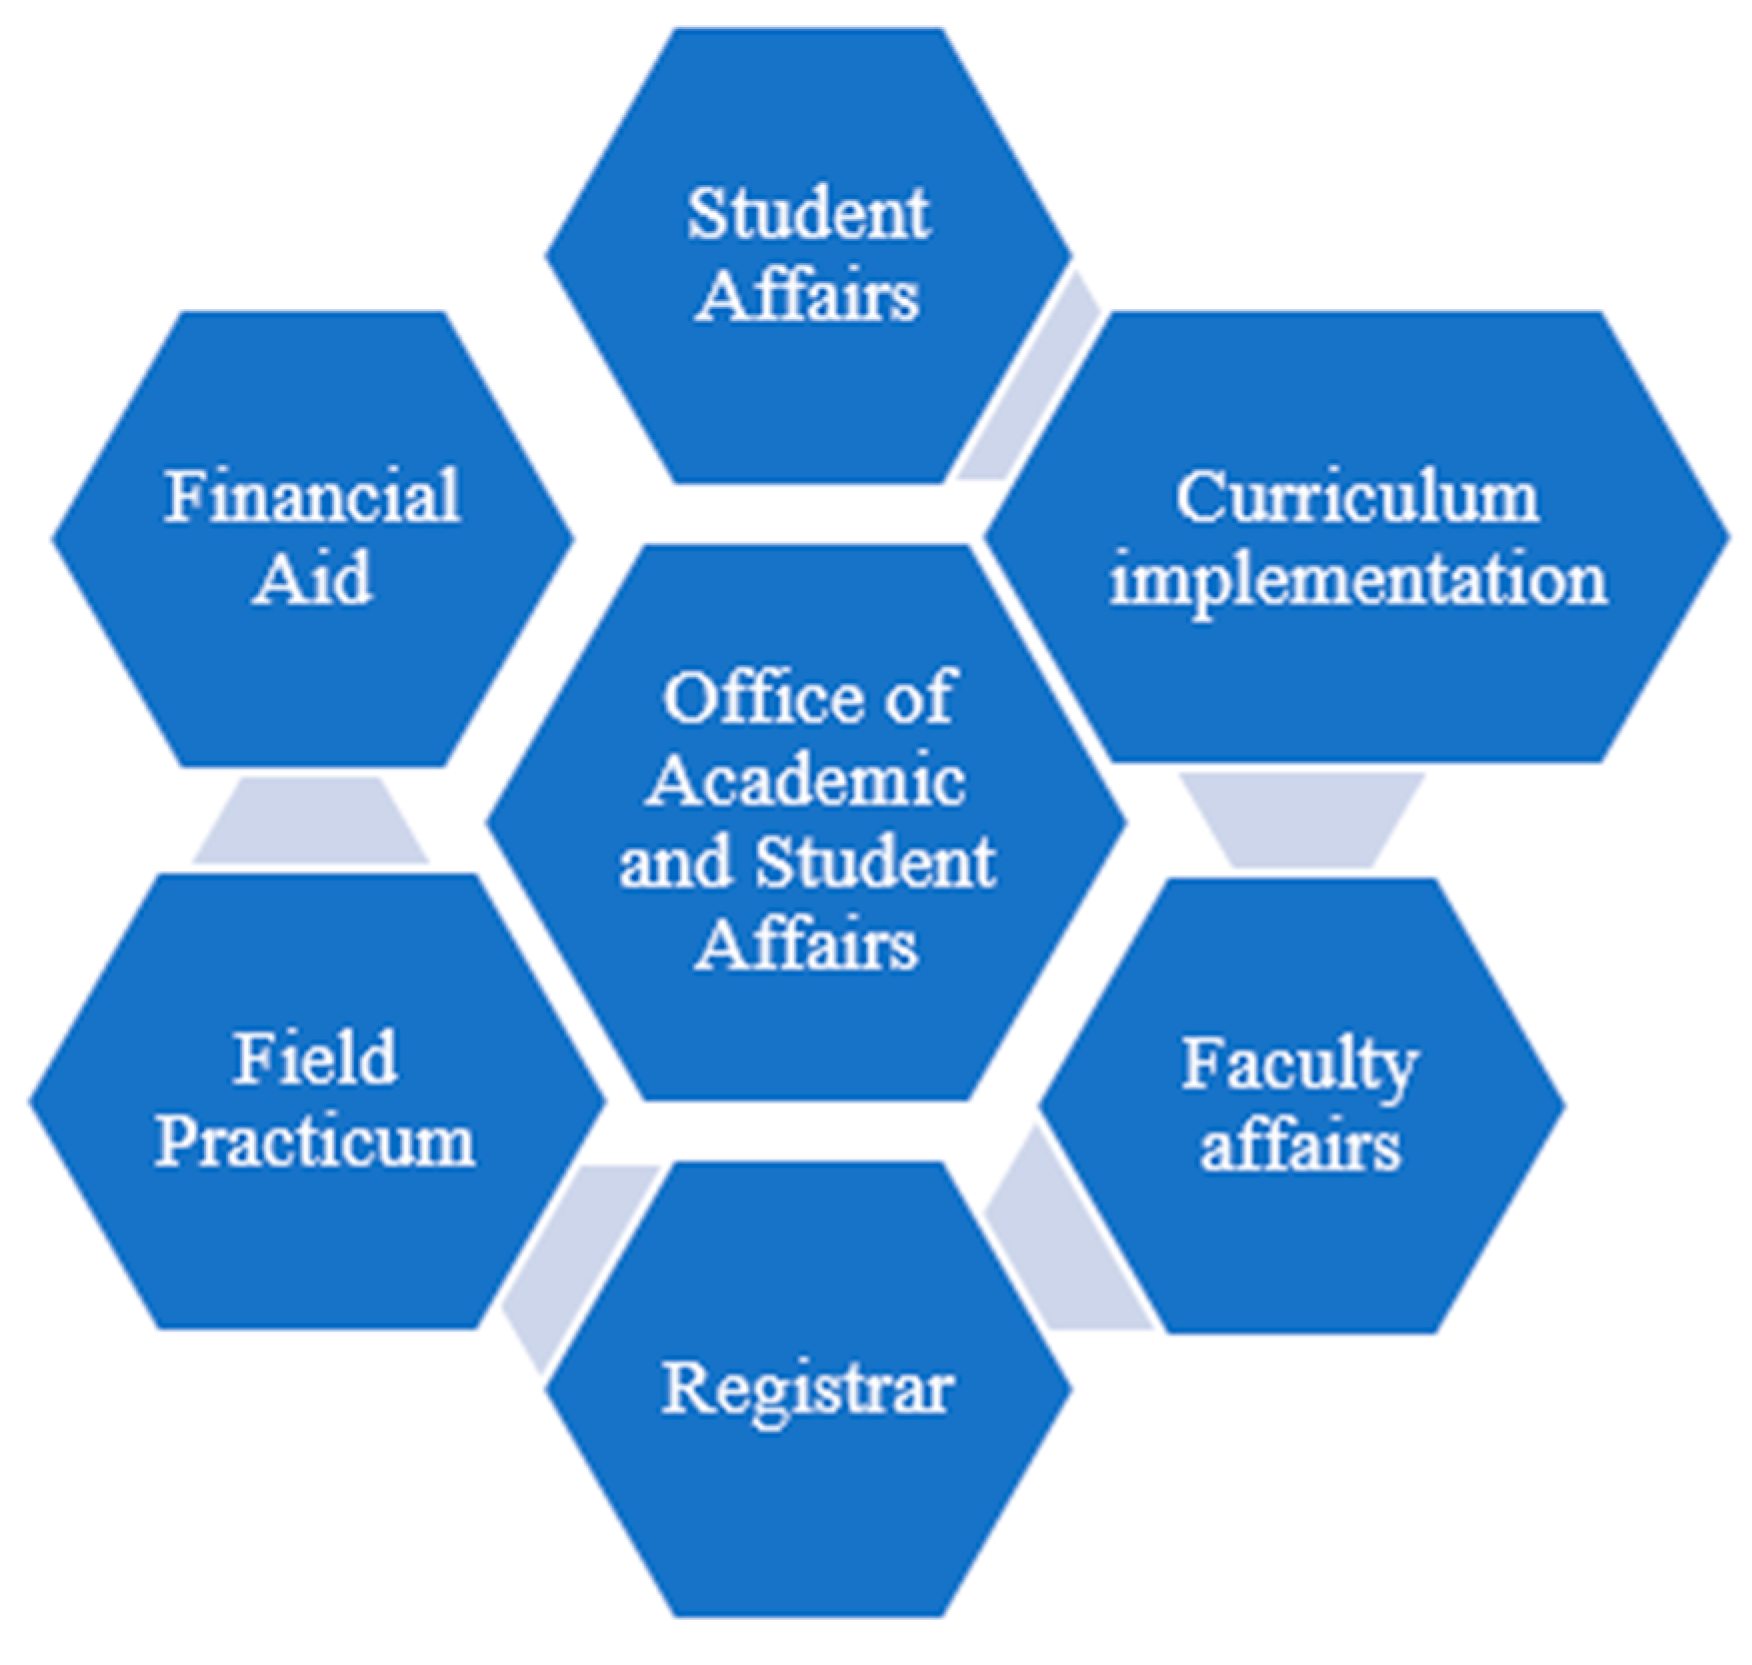
Users included staff of the various student and academic support services (Figure 3). Understanding user characteristics, needs, and preferences are critical for developing human-centered platforms. In addition, user tasks and operations need to be clearly defined and collectively evaluated to meet the goals of data exploration, analysis, and knowledge development. We gathered information on how students set up appointments with the various student support services, data elements recorded on existing intake forms, and methods of tracking these appointments.
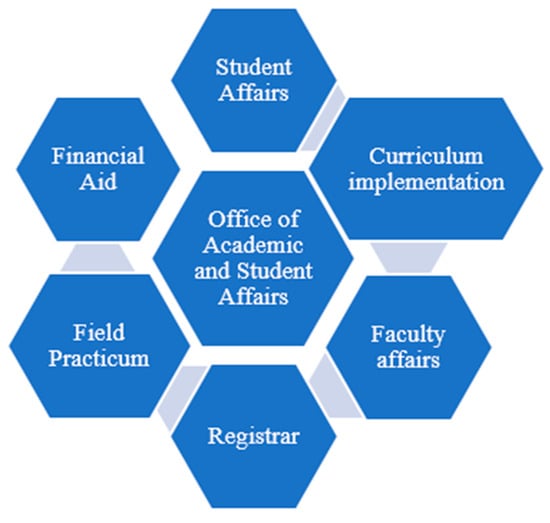
Figure 3.
Integration of various academic and student affairs units.
To develop data-driven, evidence-based model of academic management by designing, developing, and implementing SMAART SPH Outcomes Dashboard, the following steps were performed.
The following steps were performed towards developing a model of data-driven, evidence-based academic management.
- Establish working groups
The first step towards development of an evidence-based model of academic management involved formation of several working groups that would bring together representation of various academic and student affairs and other administrative services as needed. The working groups included Academic and Student Affairs Advisement, Academic Council, curriculum implementation and innovation, and online education (Table 1). Each working group was led by the Senior Associate Dean of Academic and Student Affairs with representation from different academic and administrative units (Table 1). The Academic and Student Affairs Advisement working group was aimed to discuss barriers and challenges related to student advisement across various academic and administrative units. Student advisement topics discussed were related to the choice of electives, course enrollment, financial aid and scholarship, field practicum placement, and software and hardware issues. The aim of the academic council working groups was to understand faculty needs, opportunities, and challenges related to implementation of new curricula and those involving approval of new academic programs. Issues related to faculty workload were also discussed. The curriculum implementation and innovation working group discussed issues related to the implementation of the new MPH curriculum and course offerings and examined these from the perspective of registration, advisement, and field practicum. Further, the focus was to discuss the tracking of online course development. Similarly, the goal of the online working group was to finalize instructors for developing the new online courses and related contracts and needed coordination with the Office of Legal Affairs. Tracking of the progress of the online course development and quality assurance to review the quality of content was finalized. This process helped to develop a repository of existing data sources and identify gaps in the availability of data elements critical towards evidence-based decision-making.

Table 1.
Academic, student affairs, and administrative units participating in working groups.
Activities planned during several of these working groups were aimed to ensure effective communication, collaboration, and coordination between various academic and administrative units.
- 2.
- Student data
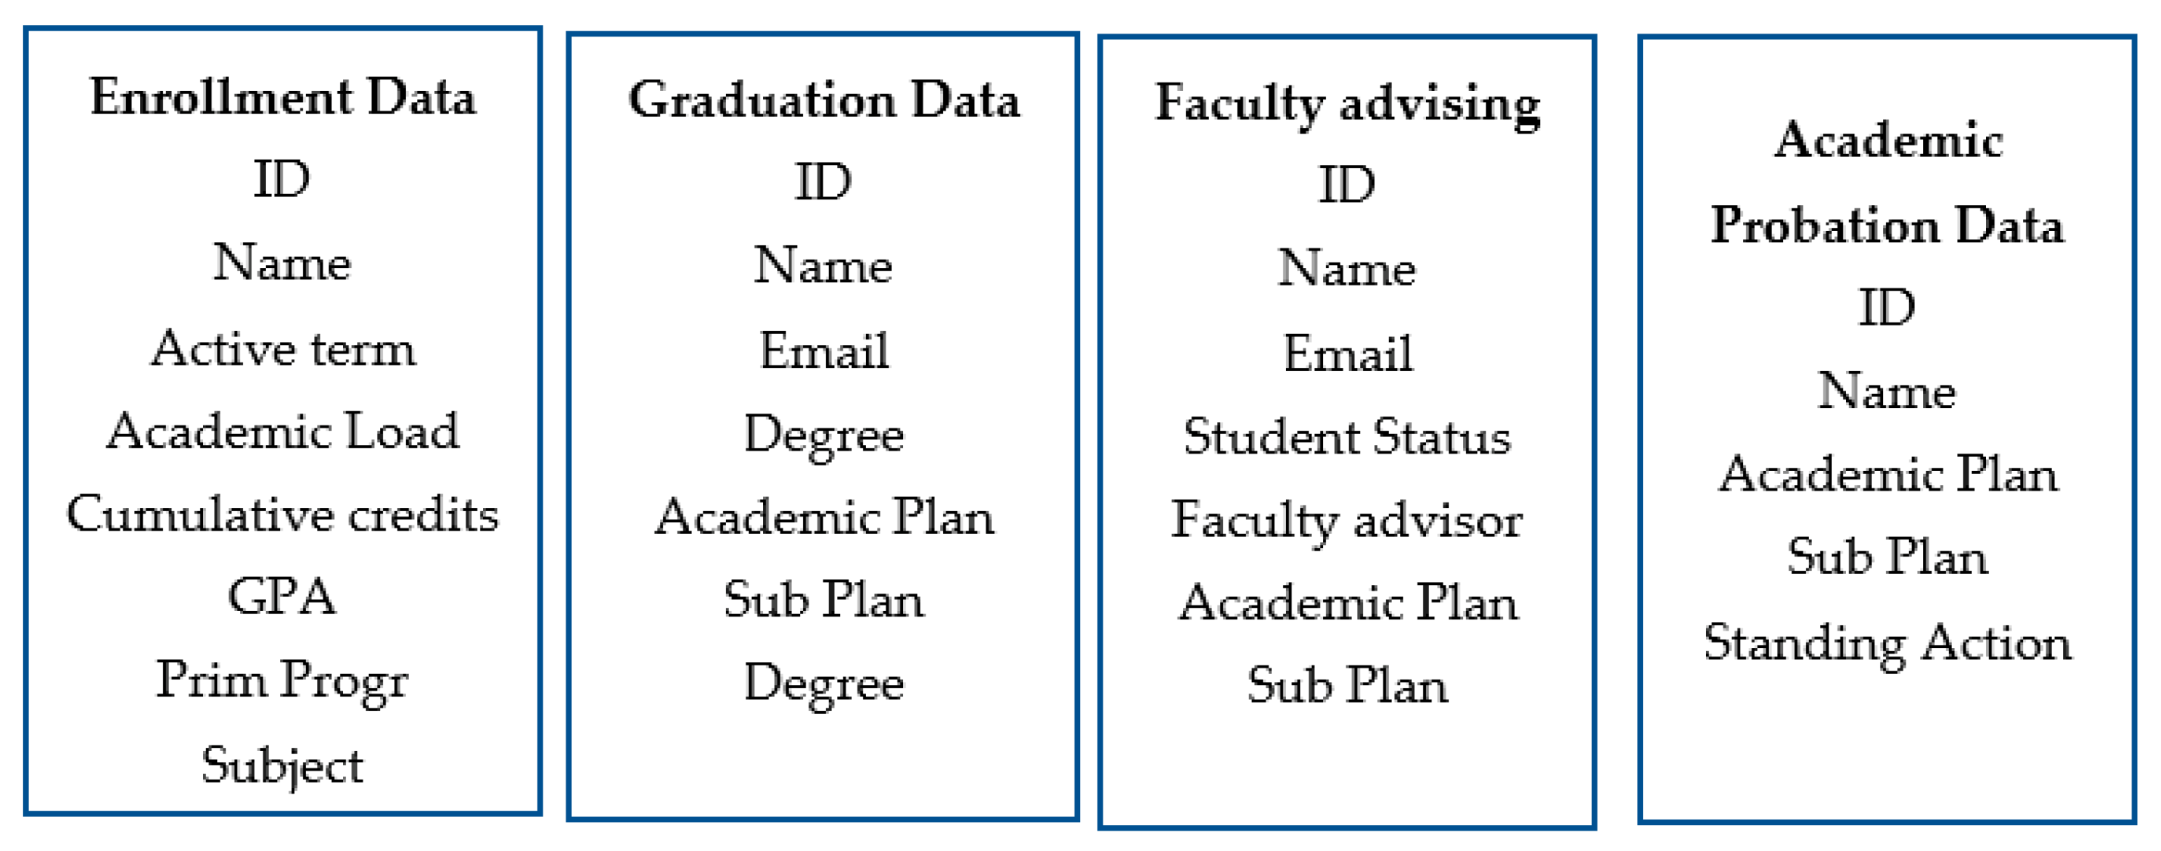
To provide sustainable, multisectoral, accessible, affordable, reimbursable, and tailored solutions for evidence-based academic management, several disparate data sources were recorded. These included student enrollment data, graduation data, academic probation data, and international student data. The goal was to integrate key data fields across all these different data sources in a format that is readily analyzable, useable, and can provide accessible and meaningful information to address the needs of the diverse stakeholders. Each data set had a unique set of variables that were essential and could generate meaningful insights (Figure 4). The unique ID across these various datasets was EMP ID and email address.
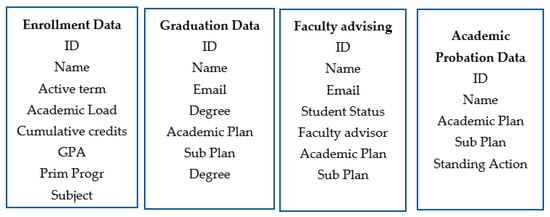
Figure 4.
Example data fields across various data sets.
- 3.
- Faculty workload data
Faculty members’ main responsibilities are teaching and research; however, they also manage outreach, service activities, and many times administrative work. Extensive faculty work also takes place outside of the classroom, such as advising, mentoring, writing grants, running labs, and guiding students through independent study. Data plays a pivotal role in contributing to the development of a transparent and an equitable model of academic development. However, several challenges related to the faculty workload data included:
- What are the key components of faculty workload data (teaching, research, etc.?).
- Lack of reporting and integration of teaching, research and administrative workload data in a timely manner.
- Clarification for classroom staffing such as rules for adjunct and college assistant allocations based on class size.
- Clearly defined compensation/credit buy-out for designated leadership roles.
- Framework for online course development and related compensation/course credit.
Additional challenges related to the faculty workload data included (i) disparate data sources, (ii) heterogeneity in data formats, (iii) validation of data, and (iv) integration of key data components of faculty workload such as teaching, research, and other administrative services. For implementation of new online courses, new academic programs, and new MPH curriculum, along with teaching of the existing curriculum, there existed a need for a clearly defined, fair, equitable faculty workload policy. These efforts required communication with all stakeholders including department chairs and school-wide faculty, budget, and finance units so that an optimal and an agreeable faculty workload policy and policy for classroom staffing could be implemented.
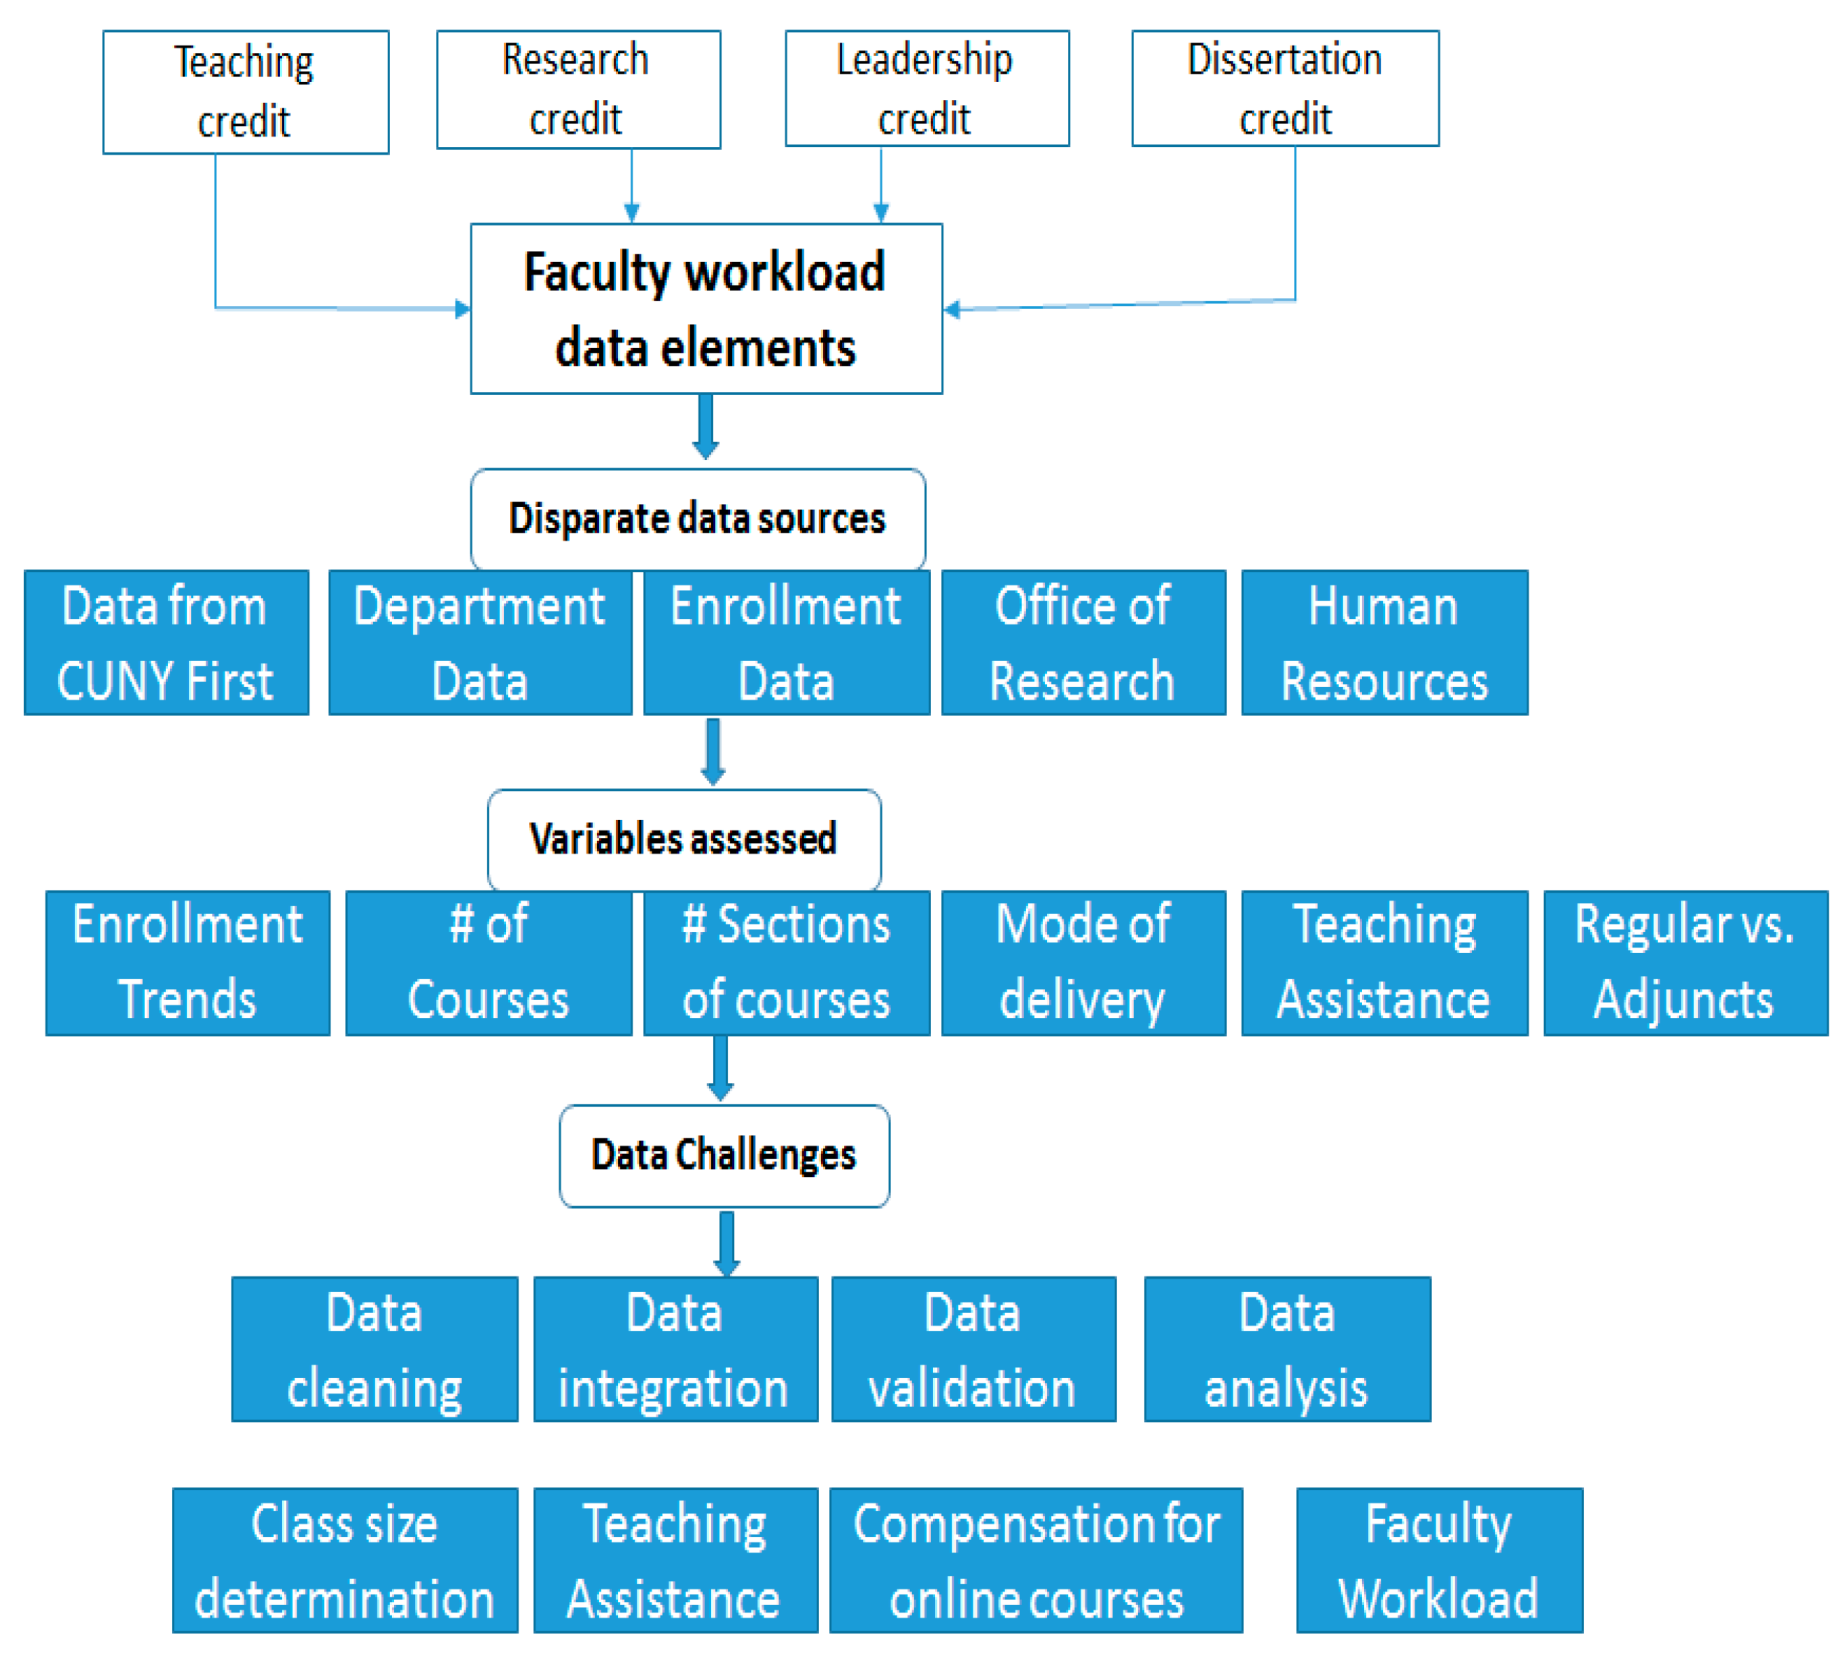
Prior faculty workload data was gathered, and information on various data variables including classroom size, additional teaching assistance, and research effort was all gathered to generate individual faculty workload profiles. Each faculty within the school submitted their faculty workload, and their approval was sought regarding the data validity. In addition, continuous ongoing deliberations with the department chairs and their department faculty and school leadership was done, and supporting data were presented to formulate new policy. Several iterations of the policy were done at the department and then at the school-wide level before a formal policy was institutionalized and ready to be implemented in the fall 2019. Several challenges were encountered in the management and tracking of faculty workload data and included data inconsistency, data redundancy, data completeness, and data reporting (Figure 5). We focused on workload inequity within departments because of the critical role departments play in faculty retention, satisfaction, recognition, and professional growth [18]. Senior faculty and department chairs can reduce workload inequity with routine practices and conditions that can shape a more positive work allocation experience.
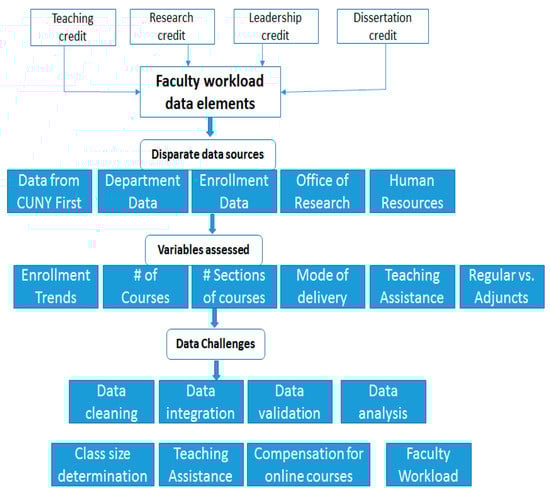
Figure 5.
Disparate data sources assessing faculty workload data, and instructional requirements.
- 4.
- Student services data
Various student support services recorded data across different platforms such as Microsoft Excel, Google Docs, FlexBooker, Calendly, and LibApps, thus limiting the integration of student service data in a meaningful manner. Some of the common data variables recorded across several student services such as academic advisement, career services, International Student Office, library, Office of Experiential Learning, and writing and quantitative services included first name, last name, email, degree, program, and open-ended information as notes (Table 2). Additional data fields were identified that would help better quantify the student needs and allow us to provide essential services and track its usage.
Table 2.
Data elements recorded across various student services.
4. Results
4.1. Design and Development of an Internet-Enabled, Interactive SMAART SPH Outcomes Dashboard
We described the process of enacting a data-driven, evidence-based model of academic management of the CUNY Graduate School of Public Health and Health Policy using SMAART Model. Through the lens of the learning theory of humanism, educators work to develop a whole-person approach that can facilitate making good, informed decisions for administrators, faculty, and staff [19].
To achieve Sustainable, Multisectoral, Accessible, Affordable, Reimbursable, and Tailored solutions, there was a need to design and develop a data-driven, evidence-based model of academic management that addresses the needs of the users and facilitates data integration, resulting in meaningful information for an informed decision-making. The first step in achieving this solution was to identify key data indicators that should be gathered across various academic and administrative services. This would help in defining the essential data elements to inform the design, development, and implementation of a transparent and an equitable platform.
The proposed internet-enabled, interactive SMAART SPH Outcomes Dashboard facilitates unified data framework using SMAART model to bring together faculty, student, and student support services data on one common platform that can guide informed decision-making (Figure 6). The proposed dashboard had the goal of improving understanding of data-driven decision-making strategies implemented at the system level. At the same time, it was also an opportunity to enhance academic and administrative effectiveness.
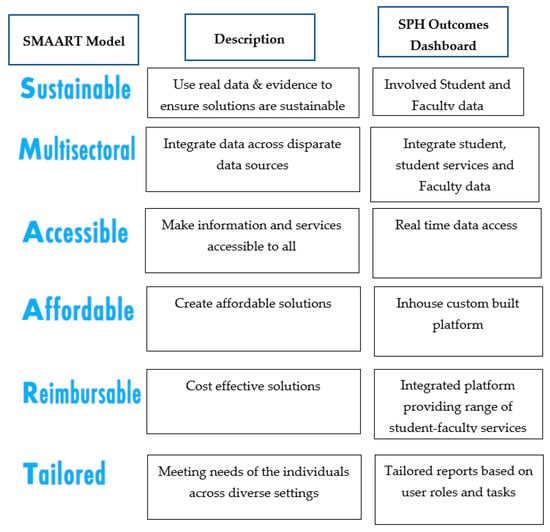
Figure 6.
Adapting SMAART model to design and develop SPH Outcomes Dashboard.
The designed and developed innovative, human-centered SMAART SPH Outcomes Dashboard included several modules:
4.1.1. Faculty Module
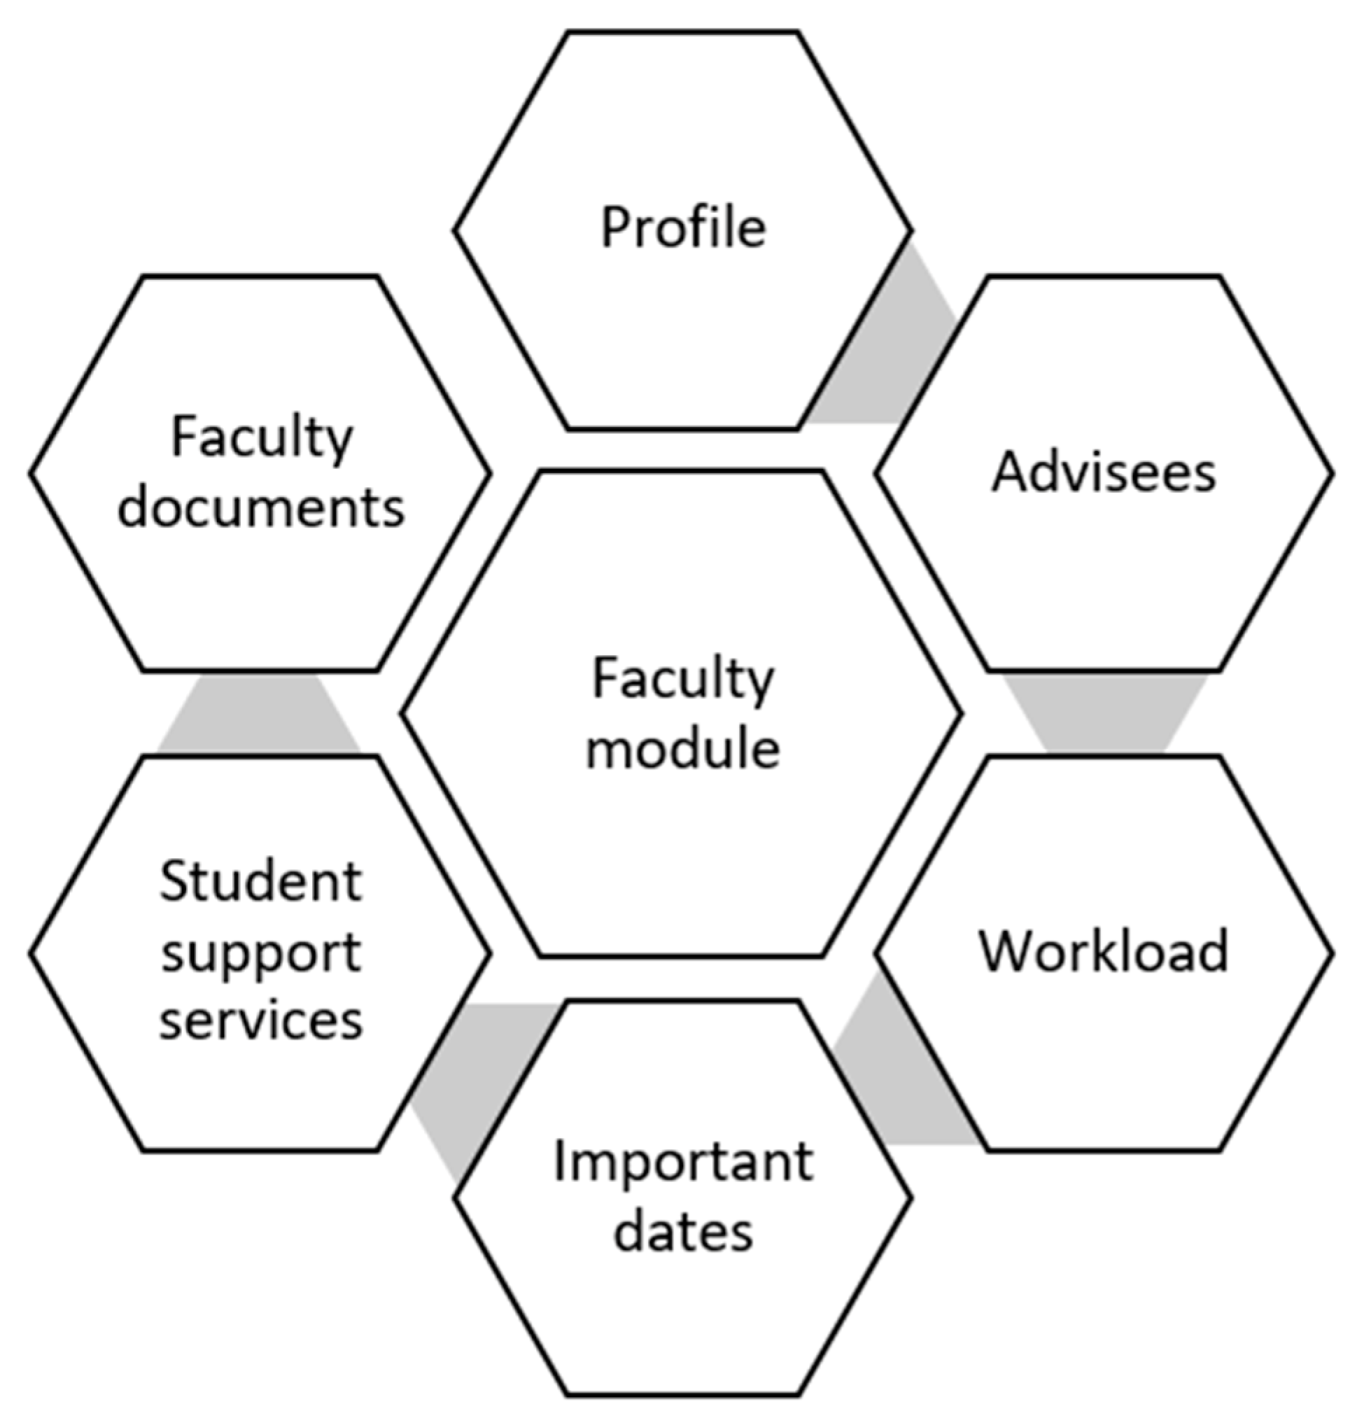
The faculty module includes a dashboard of faculty work activities, including student advisees, class size, committee assignments, and administrative roles (Figure 7). Different reports can be generated by faculty based on their roles. Having accurate and timely information is critical. Departments need to add transparency to make their work activities and processes more equitable. This will allow departments to talk about equity issues based on actual data rather than perceptions. It will help faculty members doing more to see that they need to pull back and those doing less to see that they need to step up.

Figure 7.
Data elements of the faculty module.
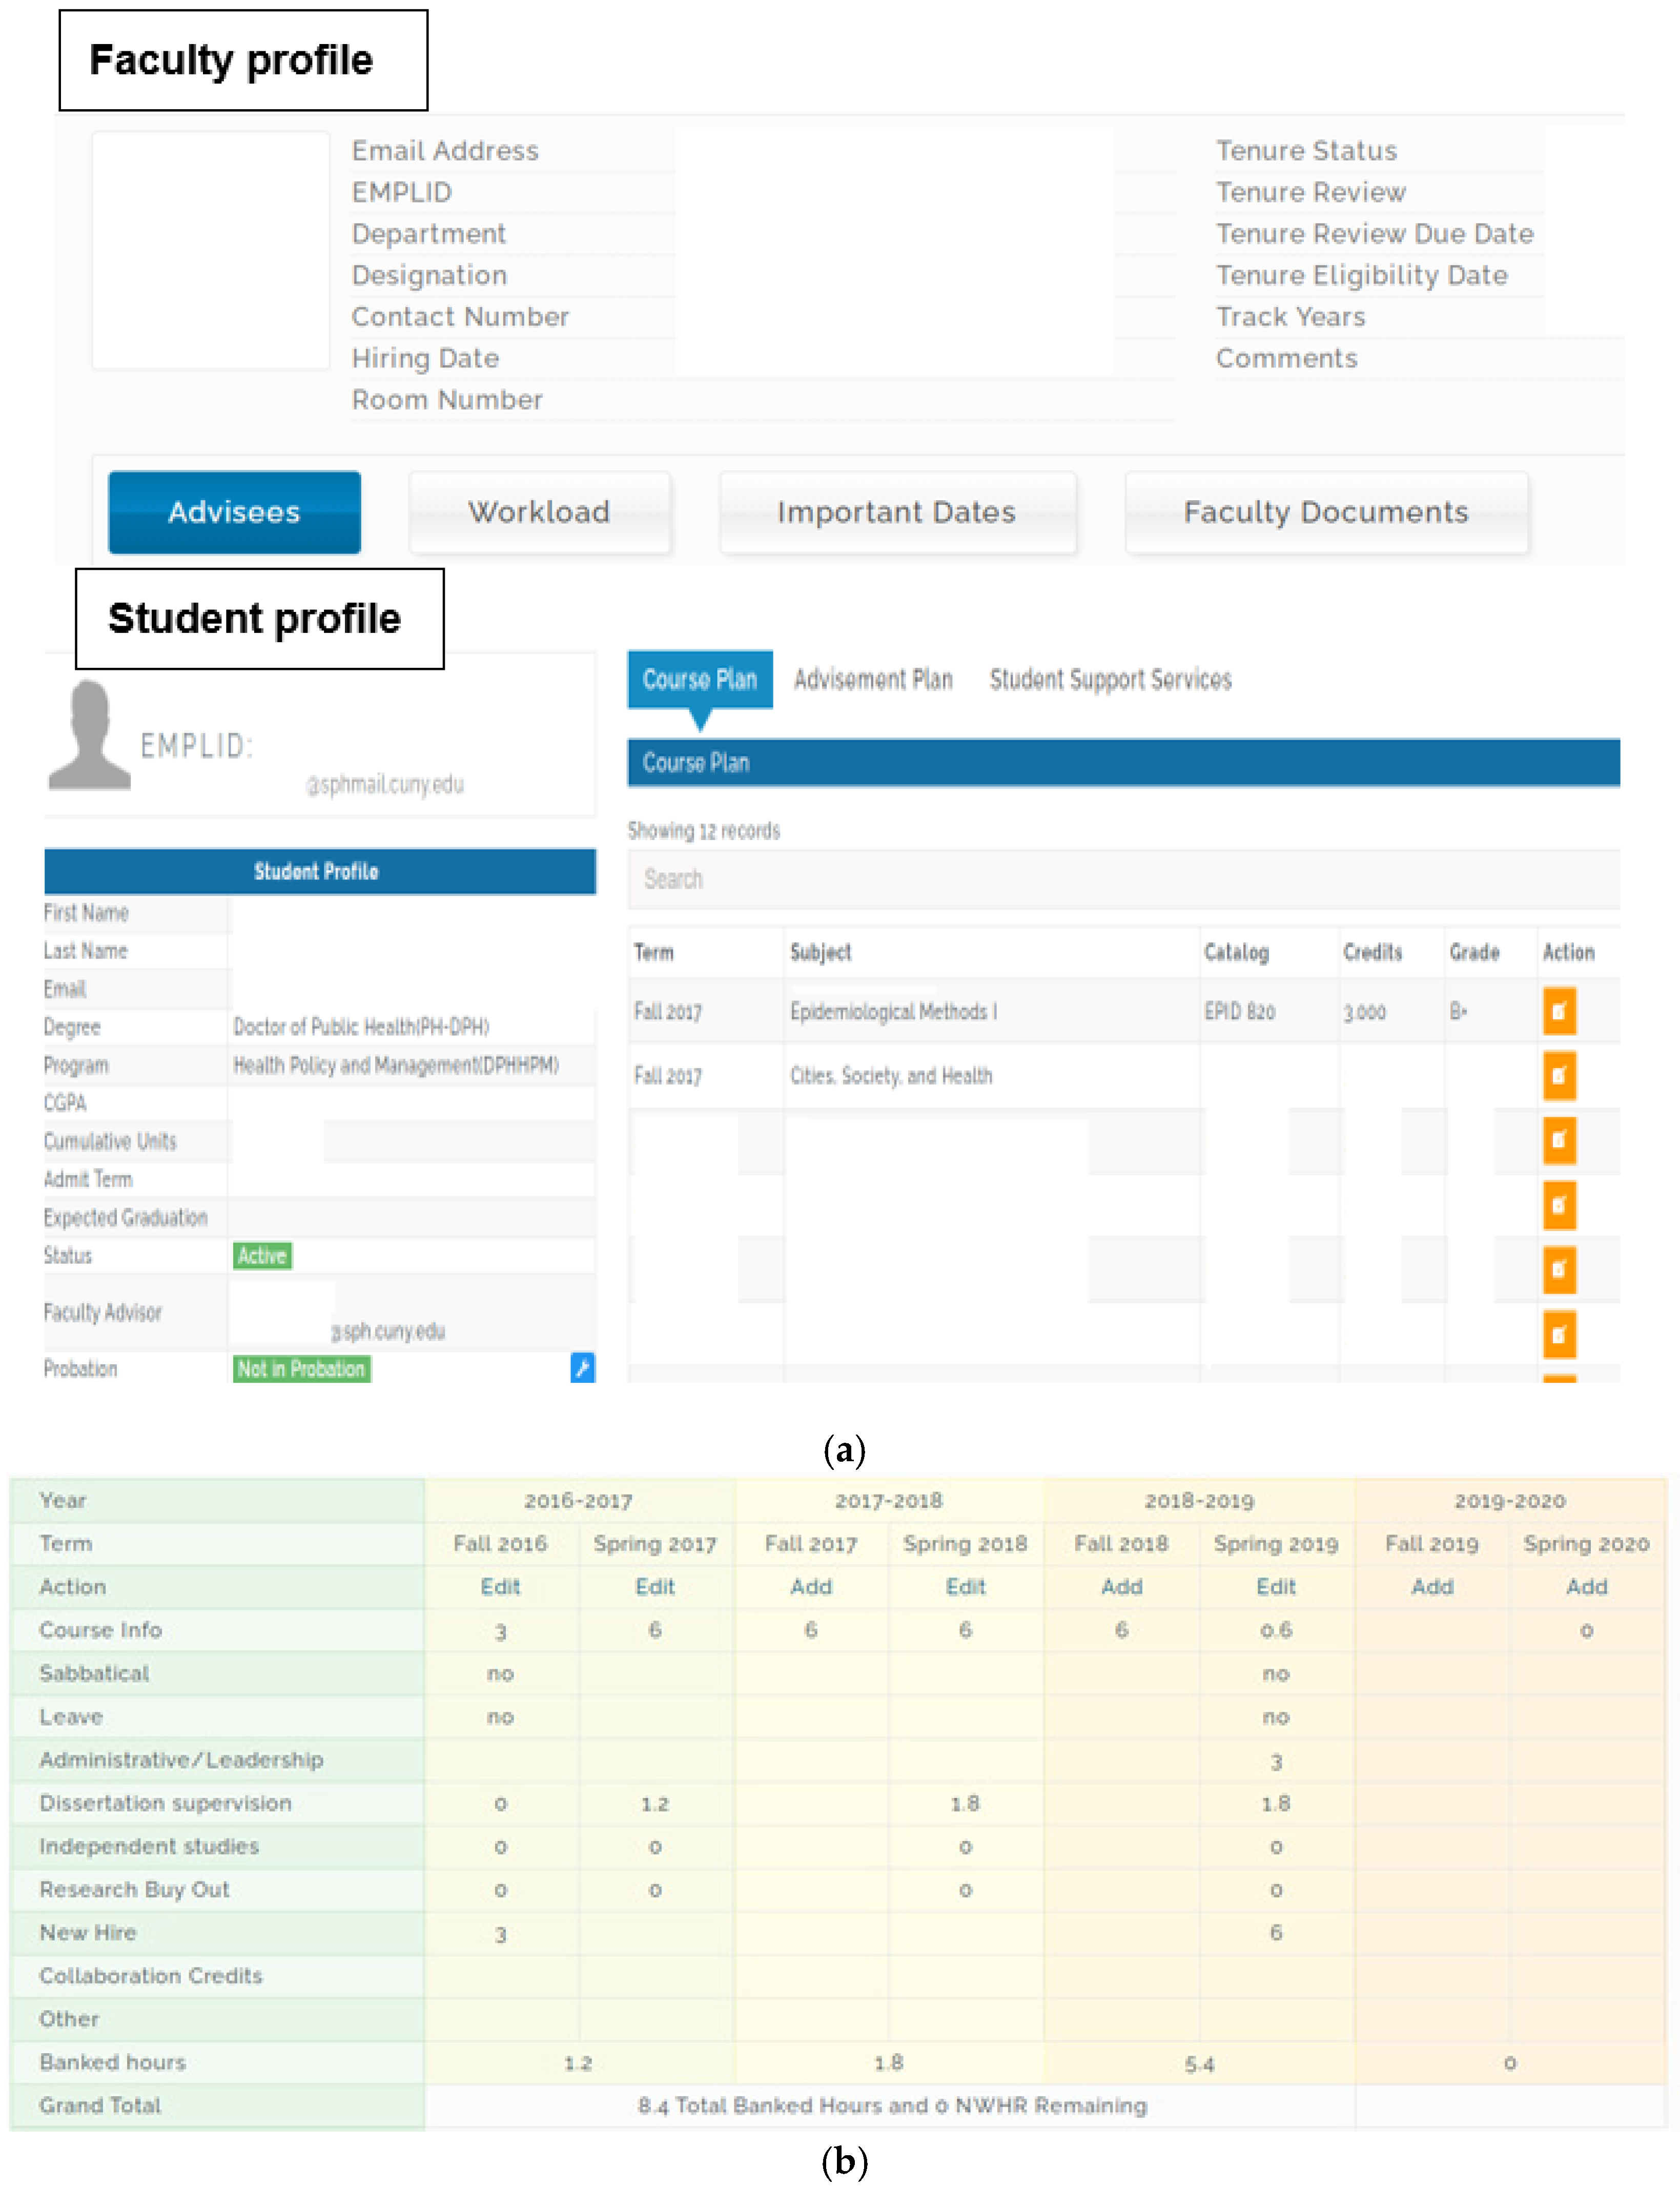
The following are the sub-components of the faculty module (Figure 8a):

Figure 8.
(a) Faculty profile view; (b) Faculty workload view.
- Faculty profile: Information recorded includes department affiliation, contact information, and their tenure status and tenure deadlines.
- Student support services: Each faculty has the ability to communicate individually or as a group with individuals offering various student support services such as offices of experiential learning, International Student Office, library, career services, Human Research Protection program, writing and quantitative services, and administrative student advisement. The goal is to enhance collaboration and coordination among various academic and administrative units.
- Student advisees: Information recorded includes list of advisees for each faculty. Information gathered related to each advisee includes:
- Program and degree enrolled;
- Course plan reflects the courses taken so far;
- Academic GPA reflects the current GPA or at any risk of academic probation;
- Advisement plan information reflects the courses need to be taken to complete the program.
- Faculty workload: Information recorded on each faculty workload included teaching credits, administrative/leadership role, dissertation supervision, independent study, research buyout, new hires, and banked hours. Faculty workload information is gathered on a per-semester basis so that at the end of each year, an aggregated report on faculty workload can be prepared (Figure 8b).
- Important dates: Includes information related to key dates and deadlines for various administrative activities.
- Faculty documents: Includes repository of all essential forms related to various faculty activities such as their offer letter, annual evaluation, peer observation, and course evaluation.
The ability to keep track of the faculty workload has helped to ensure tracking of course buy-out credits and credit overload to ensure that there is effective, transparent, and equitable decision-making. In addition, tracking of the advisees allows to ensure the student advisement to faculty ratio to ensure equitable distribution of student assignment across different faculty members. In addition, it also helps to expand on providing both student support services and academic advisement.
4.1.2. Student Module
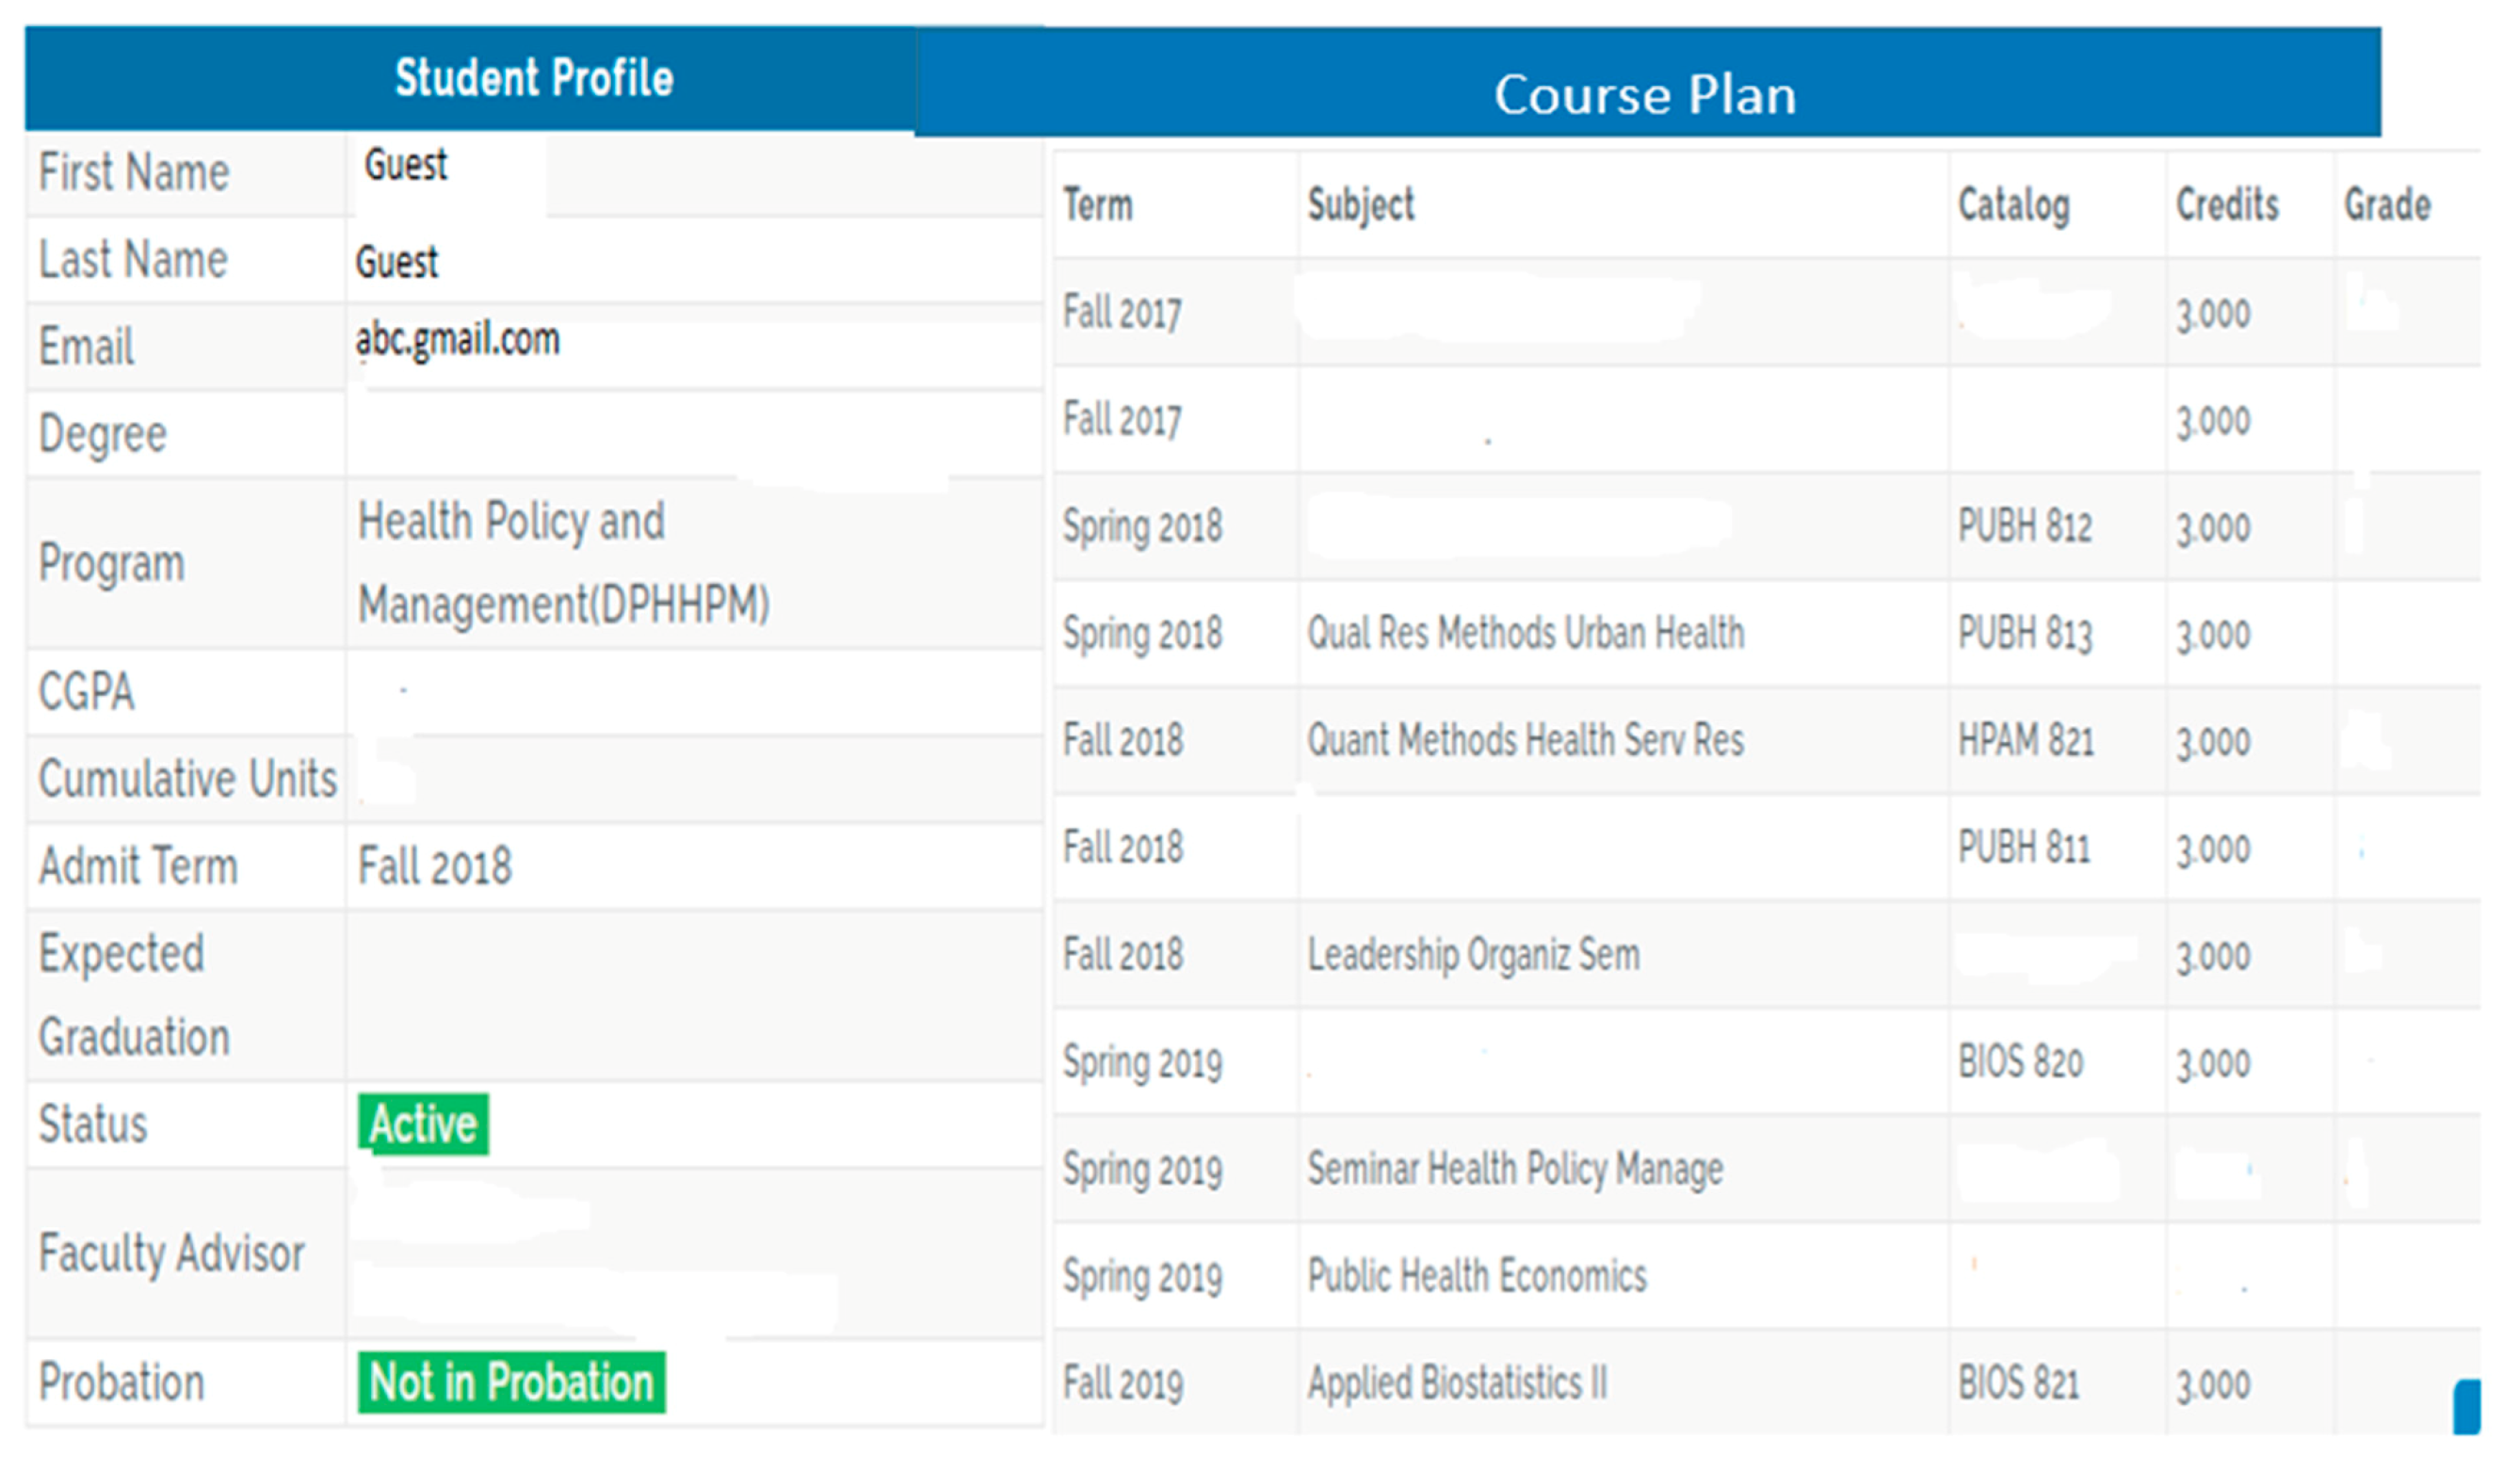
The SMAART student module facilitates individual students in viewing a summary of their profile. Various data elements captured in the profile include: program and degree information, cumulative GPA and credits earned, faculty advisor, and whether the student is in good academic standing. The students can also view a summary of the courses they have taken and the courses left to fulfill their program requirement (Figure 9).

Figure 9.
Student module view.
Students also have the opportunity to communicate with their faculty advisor and the staff of student support services including Offices of Experiential Learning, International Student Office, library, career services, Human Research Protection Program, writing and quantitative services, and administrative student advisement. Students can submit their queries to individual or multiple offices simultaneously to facilitate coordination and collaboration between the various offices to respond to student queries.
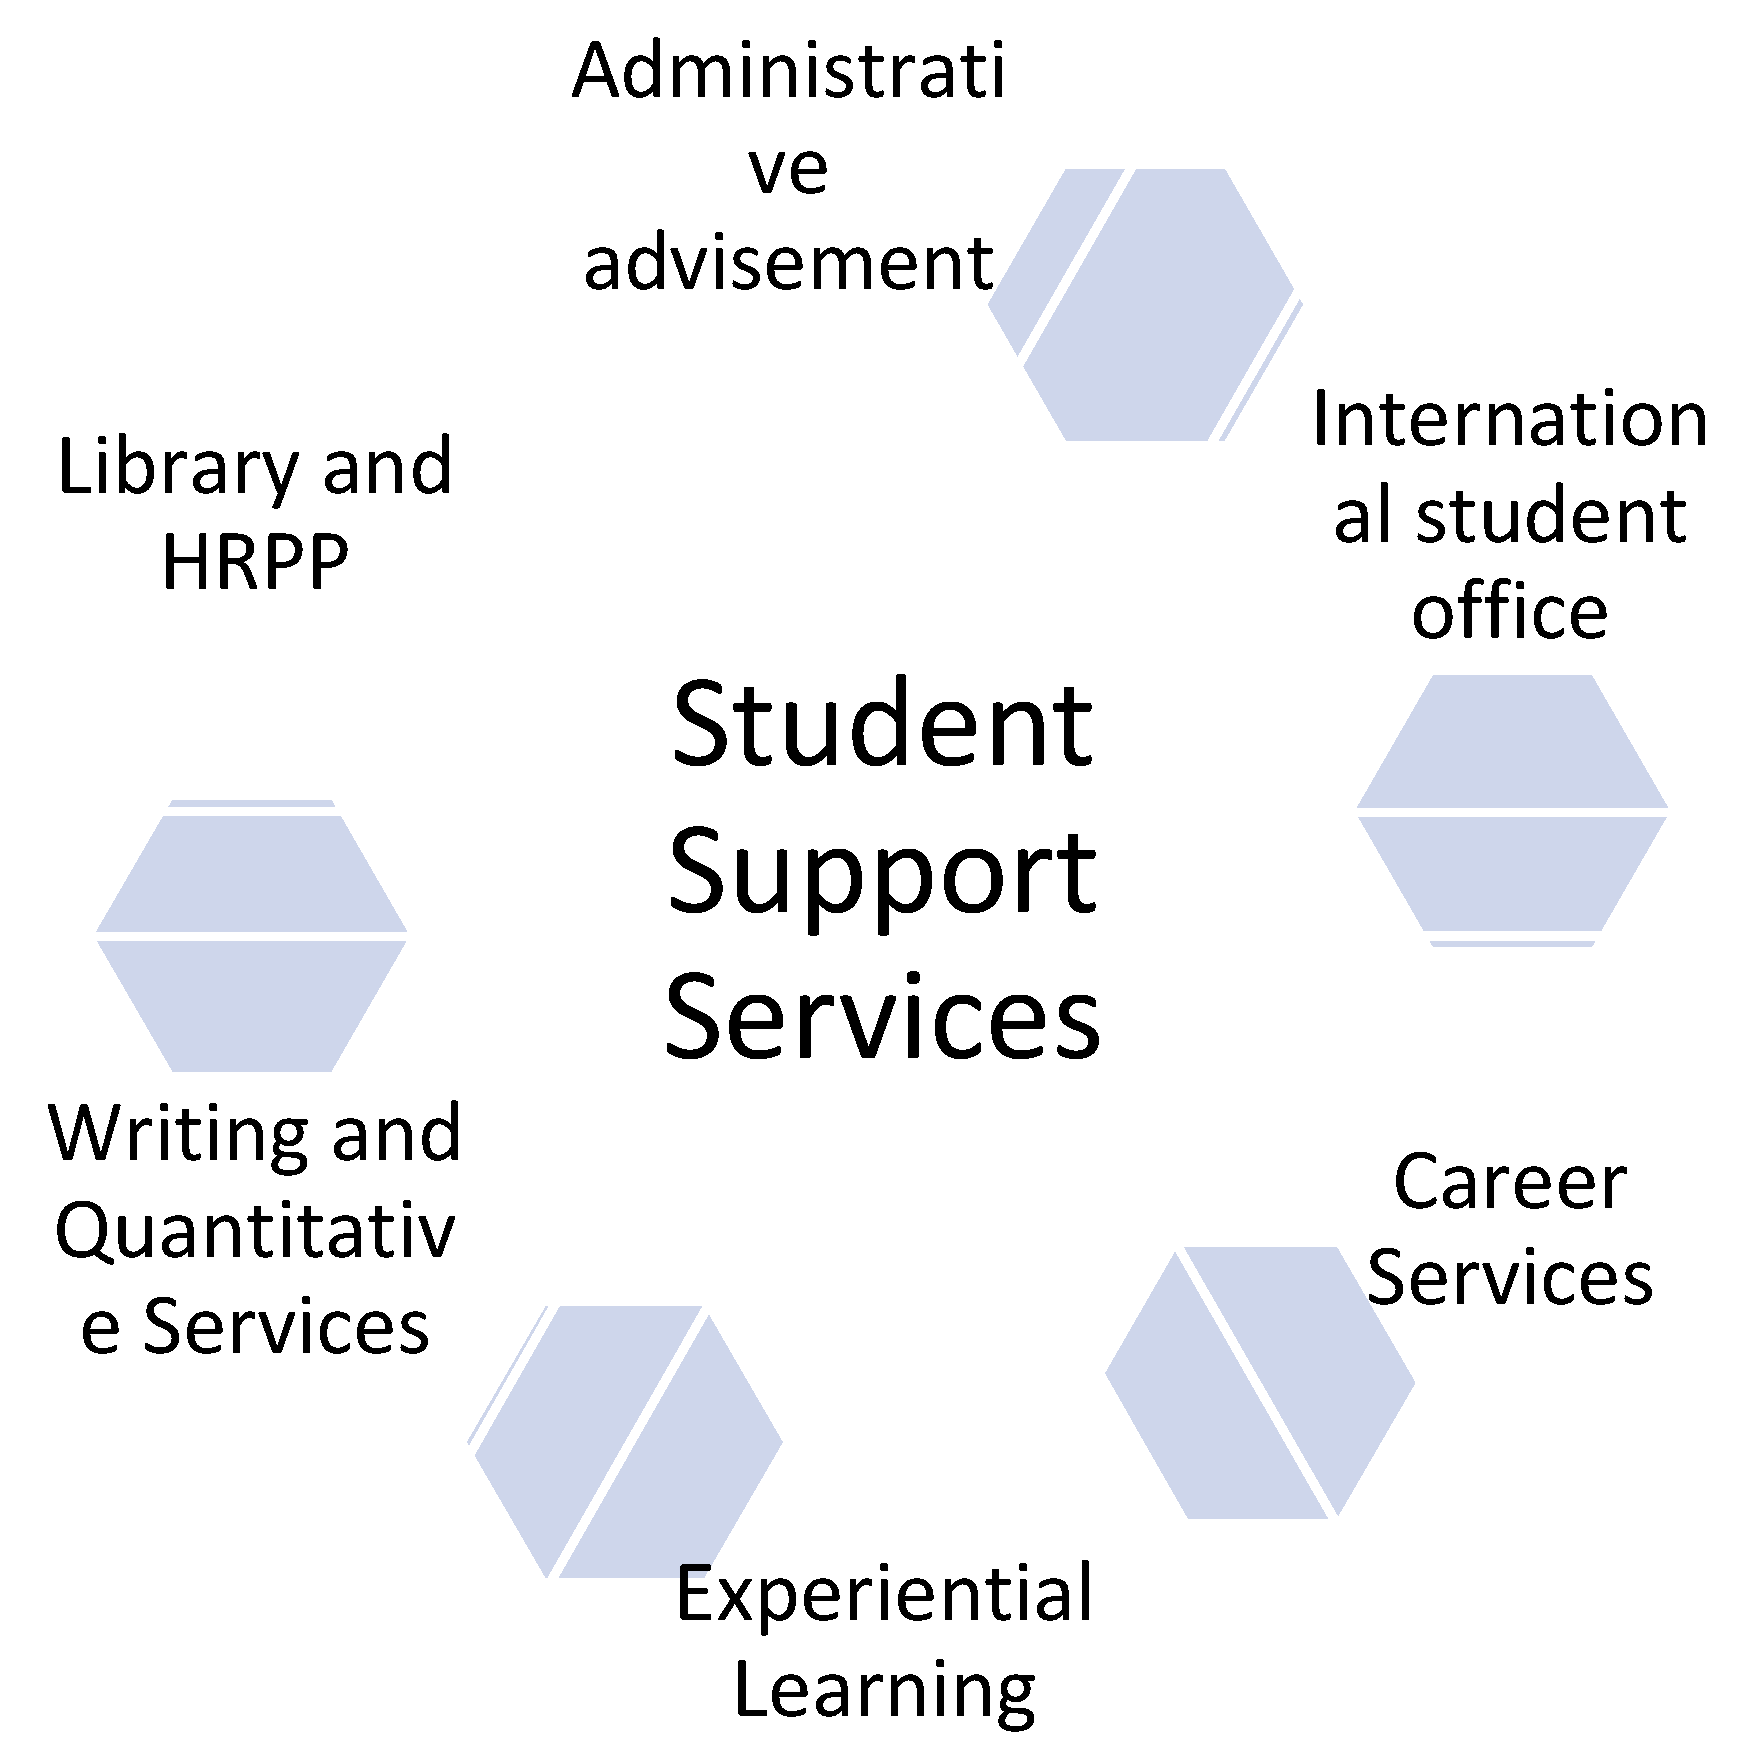
4.1.3. Student Support Services Module
The student support services cover various student services such as administrative advisement, career services, HRPP, International Students, Experiential Learning, library, and quantitative and writing services (Figure 10).
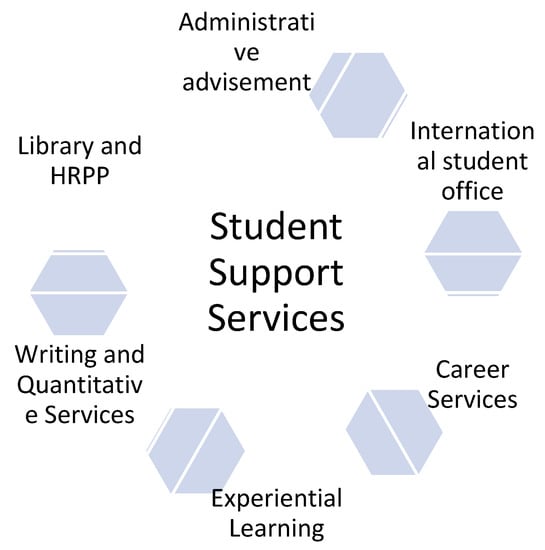
Figure 10.
Student support services.
Prior to the implementation of the SMAART informatics platform, each student support service had its own intake form and collected different data elements and managed their data independently across different data platforms with different set of variables being recorded. Minimal data sharing was observed across various administrative and academic units. A common data element framework is established so that consistent student information is gathered across different student services (Figure 11). Information on data elements specific to each student service is recorded.
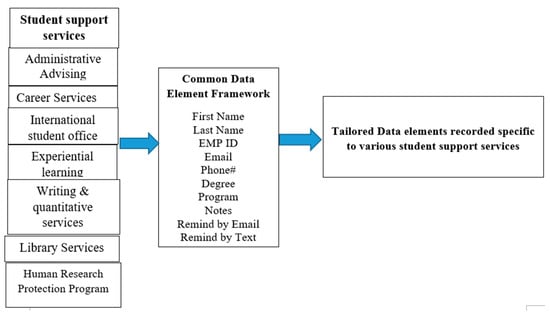
Figure 11.
Common data element framework of student support services.
Variable information recorded on each student support service was reported.
4.1.4. Administrative Advising
Variable information gathered on students included academic goal planning, School of Public Health policies and procedures, degree requirements, schedule building, advising, hold on account, and other.
4.1.5. Career Services
Information recorded on students included whether the student reached out for assistance on job/internship strategy, resume/cover letter, networking, interviewing, salary negotiation, career transitioning strategy, and other.
4.1.6. International Student Office
Variable information gathered included student status and whether the students were seeking information assistance regarding travel, on-campus employment, optional practicum training, STEM extension, or change of status.
4.1.7. Experiential Learning
Information was recorded on each student planning to begin their fieldwork, seeking assistance with fieldwork site search, understanding fieldwork project requirements, preparing for an interview with a fieldwork site, help with developing learning agreement, help with human subjects, research determination process, fieldwork project name, and fieldwork project site.
4.1.8. Writing Services
Information gathered on students seeking writing services included course enrolled, whether assistance was sought for capstone, reviewing paper draft, project proposal, or submission of final paper for specific course.
4.1.9. Quantitative Services
Information gathered on students seeking quantitative services included courses enrolled and if assistance was sought related to R, SAS, SPSS, recoding, programming, exploratory data analysis, statistical methods, sample size/power calculation, and construction of data tables.
4.1.10. Library Services
Information gathered on students seeking library services included courses enrolled and if assistance was sought related to general research support, database searching, and accessing books and circulation.
4.1.11. HRPP
Information gathered on students seeking HRPP services included the Human Subjects Research (HSR) Assessment Form, IRB application development, IDEATE access or use, human subjects research training requirements, and information on common rules and research ethics.
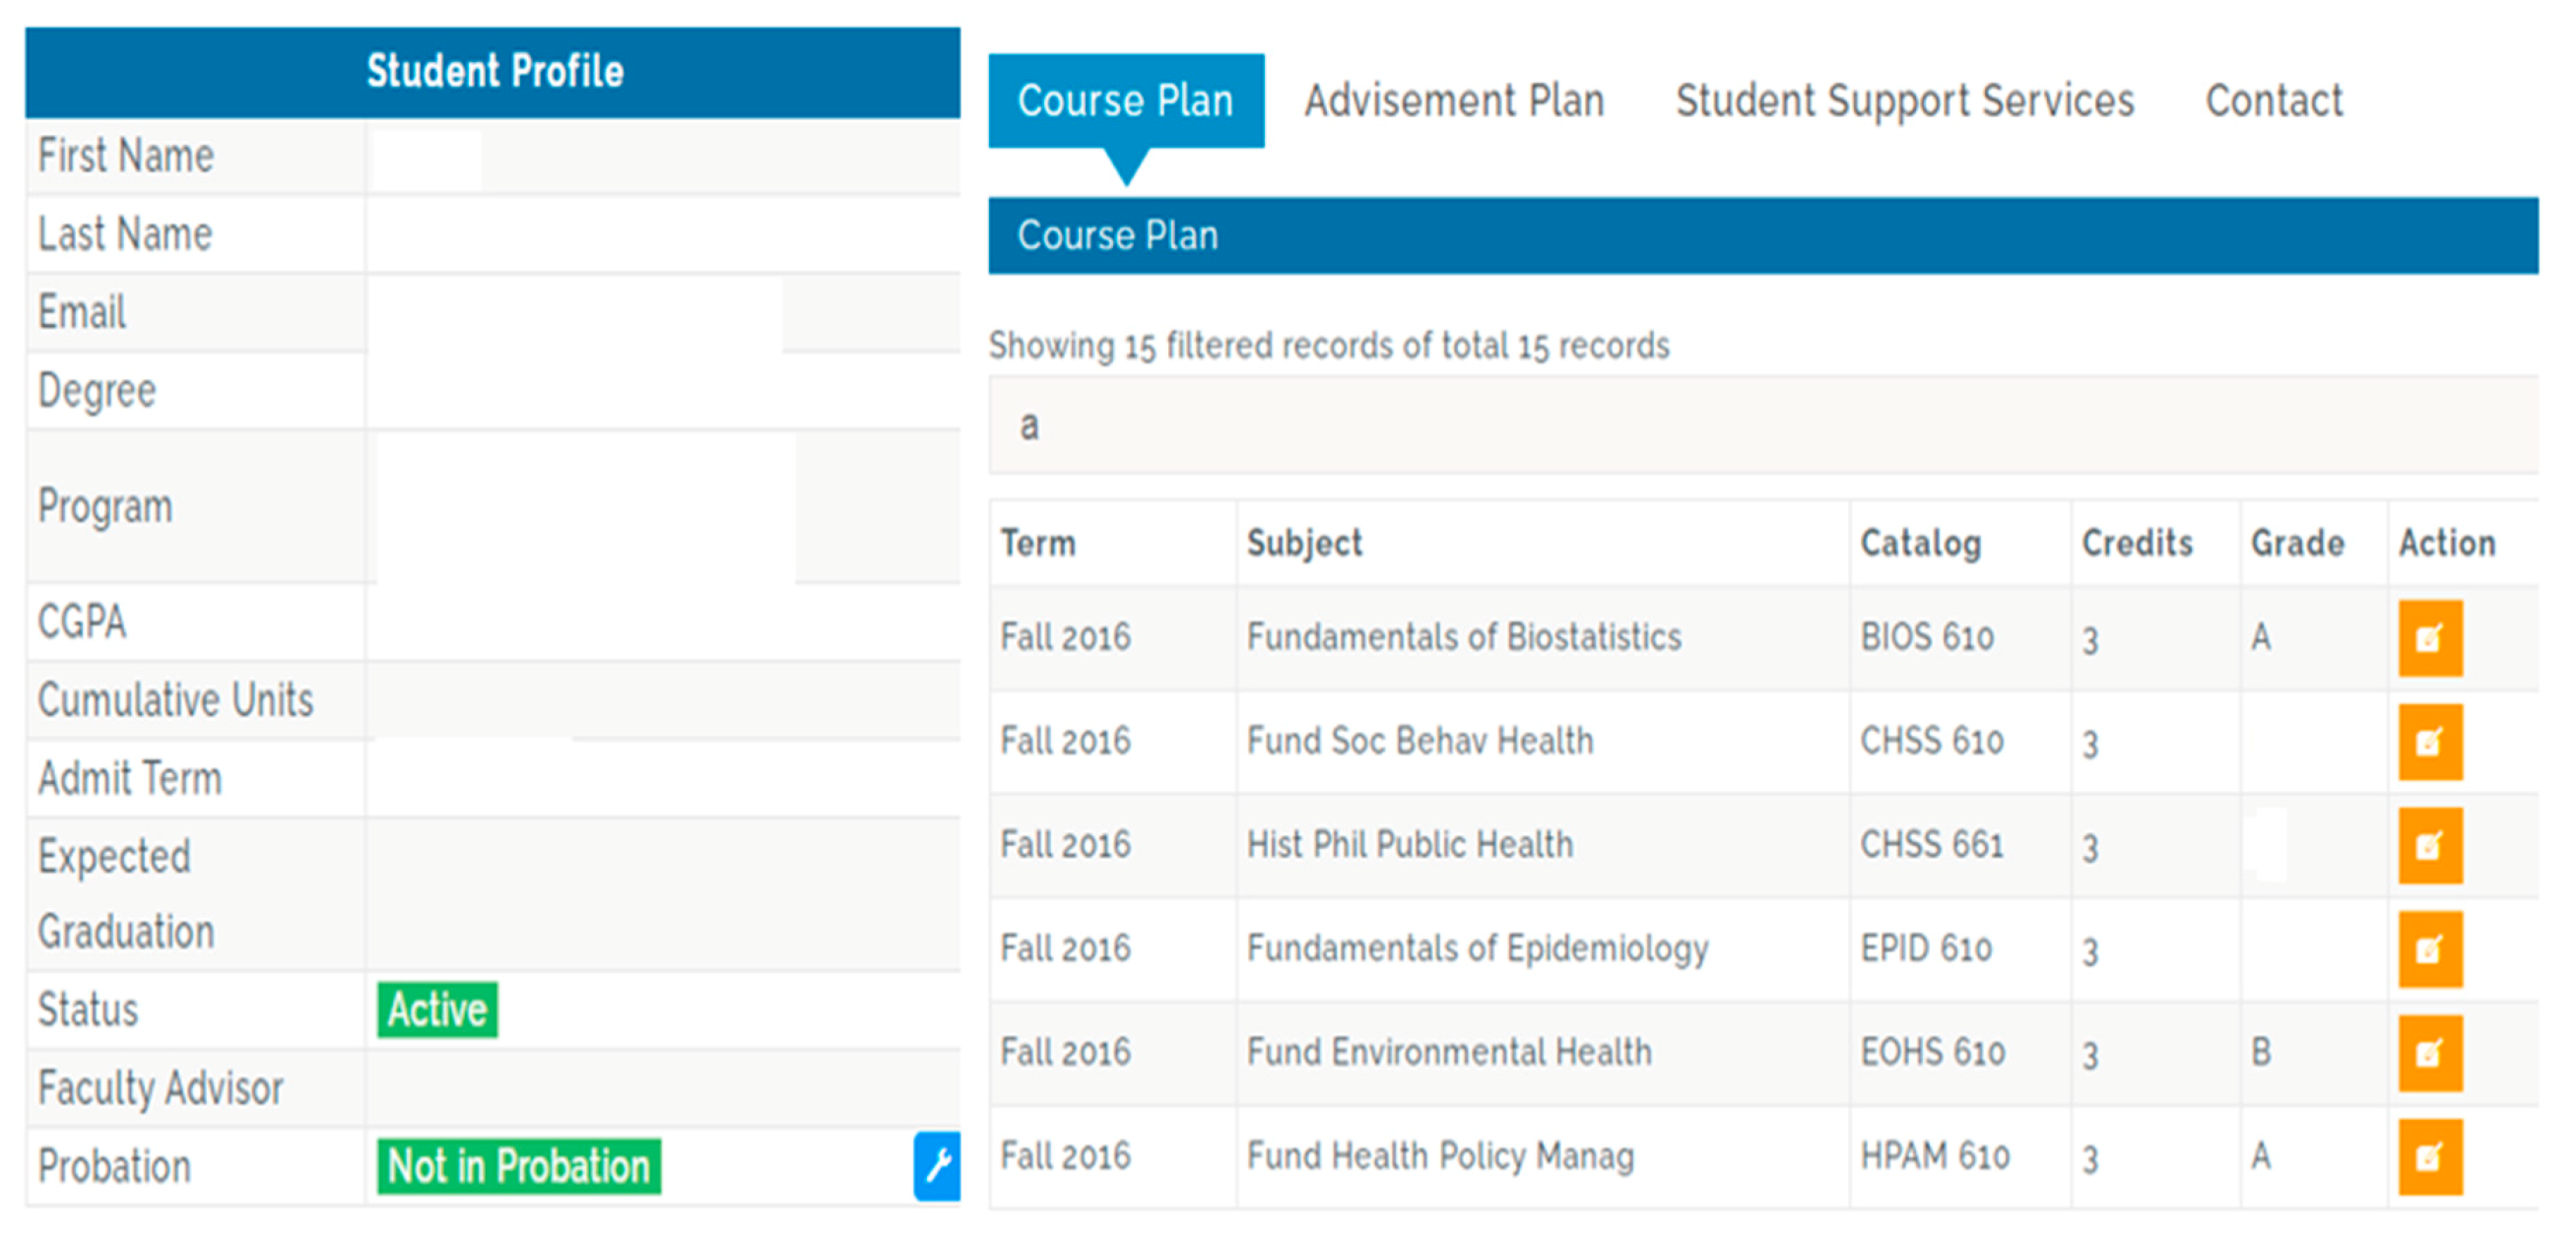
Each student support service staff had a list of active students and could access individual students’ profiles, documenting the specific summary of courses taken, advisement plan, and they had an ability to receive and send messages to other student support service staff, faculty advisors, or to the student itself (Figure 12). This ability to communicate with other stakeholders can generate easy access and a coordinated and a collaborative approach to addressing student needs.
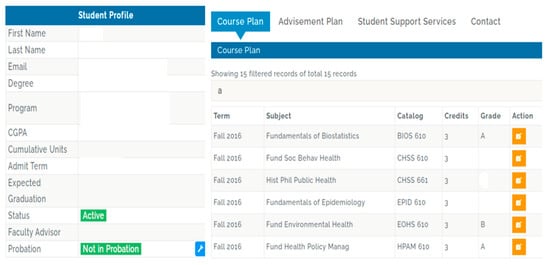
Figure 12.
Student support service view.
The ability to interact, engage, and share information across various student support services helps to develop a unified approach to student success and provides useful, timely insights so that data-driven, evidence-based actionable items can be undertaken by different administrative offices to enhance student support for overall student success.
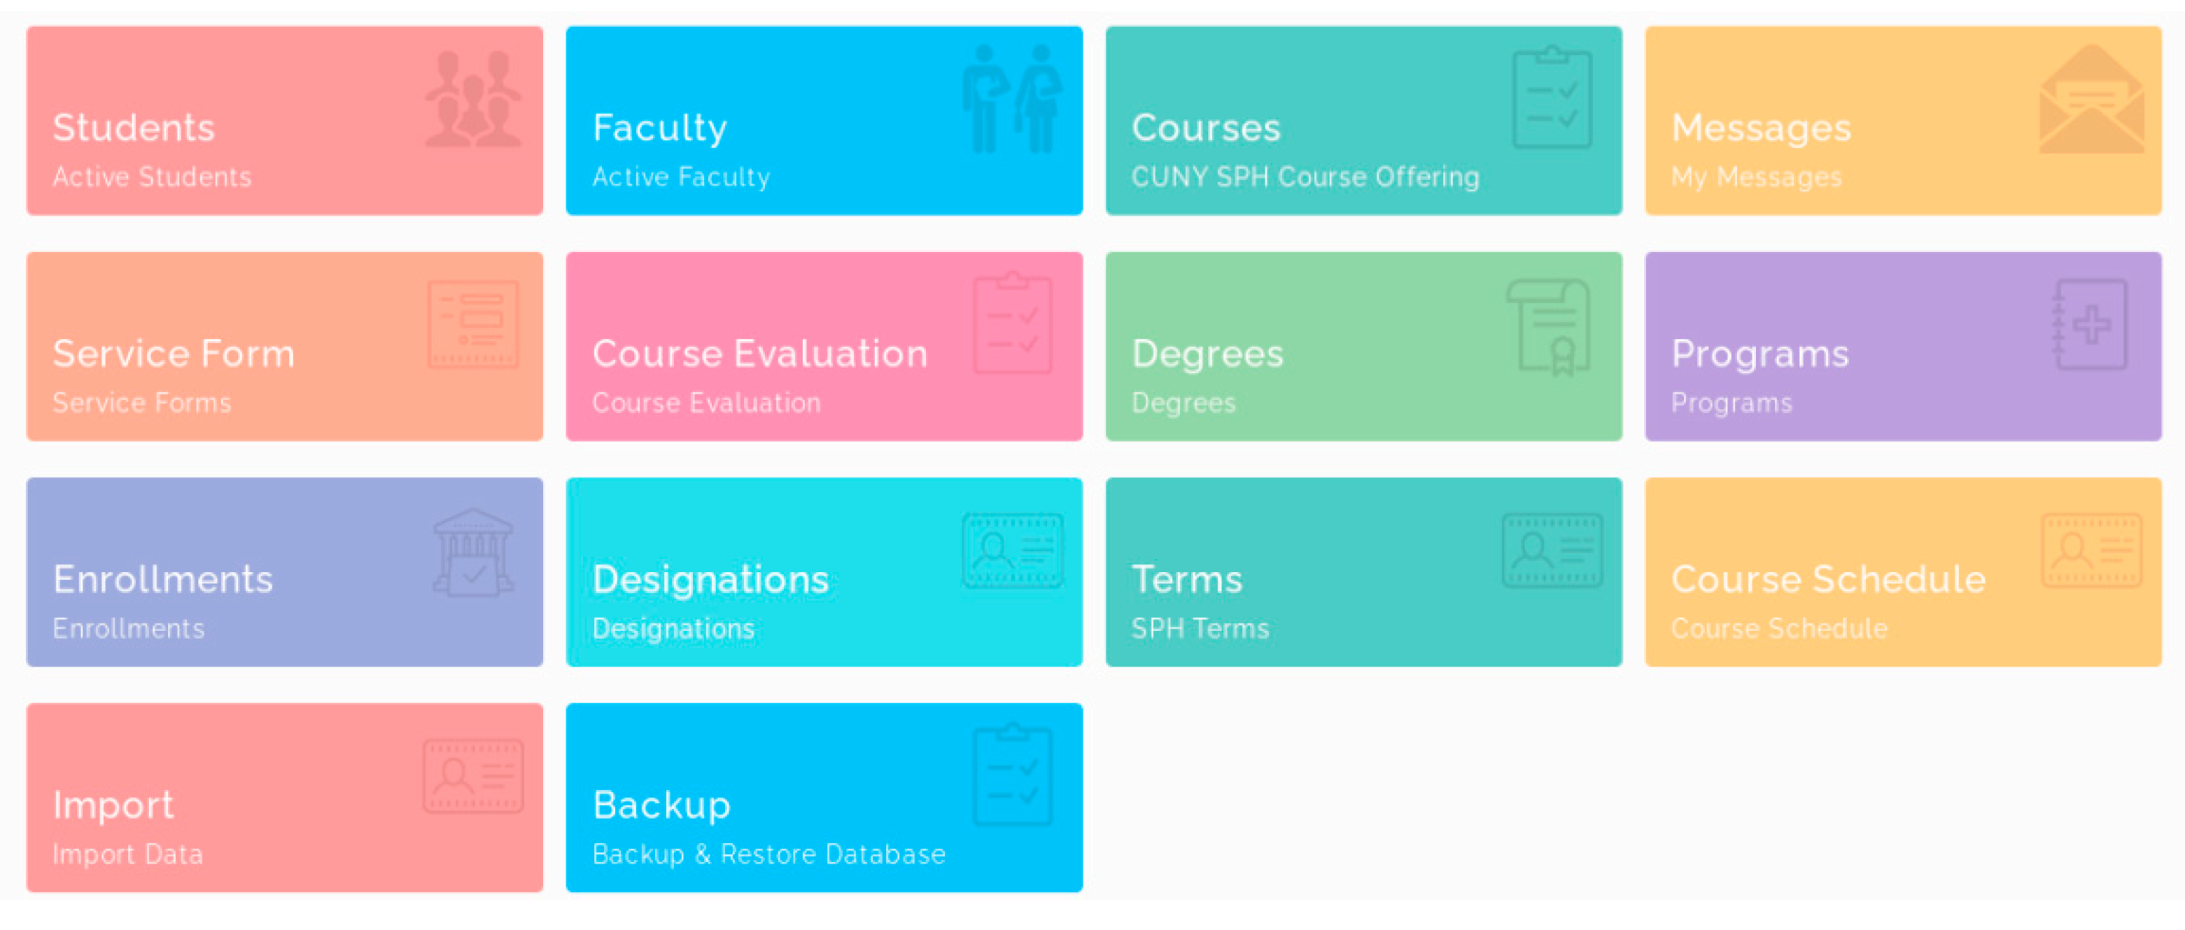
4.1.12. Administrator Module
This module provides administrators with a dashboard access and allows administrators to view/edit/add/delete/update information on students, faculty, and course and degree offerings (Figure 13). Administrator can also manage the user accounts and can set access controls to access their respective data depending on the role of the users. Further, the module allows for importing additional data that might be critical in supporting an evidence-based decision-making model of academic management. This module allows administrators to manage centralized data across all academic and administrative units, allowing for an evidence-based model of academic management.

Figure 13.
Administrator dashboard.
The administrator module provides one-point access to all administrative and academic processes that can drive evidence-based decision-making for the implementation of transparent and equitable programs and policies for institutional effectiveness.
Faculty workload policy, classroom size, and additional classroom assistance was for the first time implemented in fall 2019, observing nearly 100% compliance to the policy both in fall 2019 and spring 2020.
5. Discussion and Conclusions
Using the principles of Data, Information, and Knowledge, combined with principles of a human-centered approach and available data sources, we designed, developed, and implemented an internet-enabled interactive SMAART SPH Outcomes Dashboard to enhance a model of evidence-based academic management.
The SMAART SPH Outcomes Dashboard addresses the need to establish a cohesive, coordinated, and multi-stakeholder collaboration and aims to contribute towards a transparent, equitable, data-driven, and evidence-based model of academic management. The results of our approach describe the importance of reviewing, compiling, and validating previous faculty workload as well as implementing a new approved faculty workload policy, policy for compensation of designated leadership roles, and classroom staffing with rules of adjunct and college assistant allocations. As such, departments that make data visible (e.g., number of advisees, committees, class sizes) and replace informal processes with readily available systematized policies are likely to have faculty with higher levels of satisfaction.
Faculty are often evaluated on perceptions of their teaching effectiveness, their service activities, and their research productivity [20]. However, faculty must properly allocate and manage their time to meet their institutional standards in each area. Administrators and department chairs have the means to facilitate or hinder faculty research productivity through teaching and service assignments [20].
Leadership is critical in determining the results of change-management programs. During periods of change management, leaders must demonstrate skills and behaviors that deepen trust and commitment, align strategies, focus actions, expand capabilities, and clarify progress. The SMAART model facilitates collaborative, cohesive, and well-coordinated decision-making. It guides relevant stakeholder engagement, recording of meaningful data, and generating meaningful information to communicate relevant findings back to the stakeholders for input and facilitate a transparent, equitable, evidence-based model of academic management.
In a data-driven culture, decisions are based on factual, verifiable information with an underlying data-driven identification of trends and projections for future needs. The availability of ‘big data’ for large-scale analysis and the development of advanced technologies and practices have established new modes of quantitative knowledge production and decision-making [21].
Silos across an institution are far too common, but there is a good chance that multiple departments may be facing similar challenges which can be revealed by data available to all. Data-driven breakdown of silos can facilitate inter-departmental collaboration towards the common goals of student success and knowledge creation. Similarly, a data-driven culture requires storing consistent, reliable, and validated data in a systematic way and specifically with savings in time and cost. In addition, the use of historical data can guide predictions on what is to come in the future. The datafication of teaching in higher education remains a key focus for future studies [21]. The flow in data use in education has provoked widespread concern with the development of teachers’ (and students’) data literacy. Teachers need the data skills to be able to use new data systems and to be able to comprehend and utilize the data they produce for purposes of professional improvement, assessment of students, and better institutional management. Hence, critical data literacy should be a requirement of university managers and administrators.
One of the limitations of the proposed study is to describe the broader, long-term impact of the SMAART Outcomes Dashboard to facilitate equitable, data-driven, evidence-based decision-making.
Future work is planned to evaluate the practical application and value as well as effectiveness of the SMAART model in facilitating the implementation of faculty workload policy, classroom size, and additional teaching assistance in a uniform, equitable, transparent manner across multiple departments and increasing faculty satisfaction. In addition, the impact of the SMAART model will be measured to assess timely, at-risk intervention of students going into academic probation and how the various student services coordinate, collaborate, and communicate with each other, enhancing not only student outcomes but also overall institutional effectiveness.
The aim of this paper is to describe the approach that higher education institutions could possibly follow to implement evidence-based, data-driven thinking in a sustained manner. Decisions in higher education institutions have an impact on various stakeholders. It is critical to make the best-informed decision possible. The evidence-based practice facilitates evidence from multiple sources in a conscientious, explicit, and judicious manner [22].
Author Contributions
Conceptualization, A.J.; methodology, A.J.; software, A.J., writing—original draft preparation, AJ.; writing—review and editing, R.G., L.R. and A.E.-M. project administration, A.J. All authors have read and agreed to the published version of the manuscript.
Funding
This research received no external funding.
Institutional Review Board Statement
Ethical review and approval were waived for this study as it was a quality improvement project.
Informed Consent Statement
Not applicable.
Data Availability Statement
No data report.
Conflicts of Interest
The authors declare no conflict of interest.
References
- Schildkamp, K. Data-based decision-making for school improvement: Research insights and gaps. Educ. Res. 2019, 31, 257–273. [Google Scholar] [CrossRef] [Green Version]
- Jason, L. Building a Smarter University: Innovation, Analytics, and Big Data; SUNY Press: Albany, NY, USA, 2014. [Google Scholar]
- O’Meara, K.; Jaeger, A.; Misra, J.; Lennartz, C.; Kuvaeva, A. Undoing disparities in faculty workloads: A randomized trial experiment. PLoS ONE 2018, 13, e0207316. [Google Scholar] [CrossRef] [PubMed]
- Available online: https://www.insidehighered.com/advice/2018/06/27/how-make-faculty-service-demands-more-equitable-opinion (accessed on 16 August 2020).
- Slavin, R.E. Evidence-based education policies: Transforming educational practice and research. Educ. Res. 2002, 31, 15–21. [Google Scholar] [CrossRef] [Green Version]
- Hurtado, S.; Eagan, K.; Pryor, J.H.; Whang, H.; Tran, S. Undergraduate Teaching Faculty: The 2010–2011 HERI Faculty Survey; Higher Education Research Institute: Los Angeles, CA, USA, 2012. [Google Scholar]
- Avolio, B.J.; Gardner, W.L. Gardner Authentic leadership development: Getting to the root of positive forms of leadership. Leadersh. Q. 2005, 16, 315–338. [Google Scholar] [CrossRef]
- Mason, S. Turning data into knowledge: Lessons from six Milwaukee public schools. In Proceedings of the Annual Meeting of the American Educational Research Association, New Orleans, LA, USA, 1–5 April 2002. [Google Scholar]
- Bilimoria, D.; Joy, S.; Liang, X. Breaking Barriers and Creating Inclusiveness: Lessons of Organizational Transformation to Advance Women Faculty in Academic Science and Engineering. Hum. Resour. Manag. 2008, 47, 423–441. [Google Scholar] [CrossRef]
- Norman, S.M.; Avolio, B.; Luthans, F. The impact of positivity and transparency on trust in leaders and their perceived effectiveness. Leadersh. Q. 2010, 21, 350–364. [Google Scholar] [CrossRef] [Green Version]
- Joshi, A.; Arora, M.; Malhotra, B. Usability Evaluation of a Portable Health Information Kiosk Using a SMAART Intervention Framework. Glob. J. Health Sci. 2017, 9, 153. [Google Scholar] [CrossRef]
- Joshi, A.; Arora, A.; Amadi-Mgbenka, C.; Mittal, N.; Sharma, S.; Malhotra, B.; Grover, A.; Misra, A.; Loomba, M. Burden of household food insecurity in urban slum settings. PLoS ONE 2019, 14, e0214461. [Google Scholar] [CrossRef] [PubMed]
- Kayser, L.; Kushniruk, A.; Osborne, R.H.; Norgaard, O.; Turner, P. Enhancing the Effectiveness of Consumer-Focused Health Information Technology Systems Through eHealth Literacy: A Framework for Understanding Users’ Needs. JMIR Hum. Factors 2015, 2, e9. [Google Scholar] [CrossRef] [PubMed] [Green Version]
- Huang, Z.; Chen, H.; Guo, F.; Xu, J.J.; Wu, S.; Chen, W.-H. Expertise visualization: An implementation and study based on cognitive fit theory. Decis. Support Syst. 2006, 42, 1539–1557. [Google Scholar] [CrossRef]
- Teets, J.M.; Tegarden, D.P.; Russell, R.S. Using Cognitive Fit Theory to Evaluate the Effectiveness of Information Visualizations: An Example Using Quality Assurance Data. IEEE Trans. Vis. Comput. Graph. 2010, 16, 841–853. [Google Scholar] [CrossRef] [PubMed]
- Joshi, A.; Wilhelm, S.; Aguirre, T.; Trout, K.; Amadi, C. An interactive, bilingual touch screen program to promote breastfeeding among Hispanic rural women: Usability study. JMIR Res. Protoc. 2013, 2, e47. [Google Scholar] [CrossRef] [PubMed]
- Smith, M.K. The Encyclopedia of Informal Education. 2003. [26 October 2009]. webcite Learning Theory. Available online: http://www.infed.org/biblio/b-learn.htm (accessed on 15 October 2021).
- O’Meara, K.; Lennartz, C.J.; Kuvaeva, A.; Jaeger, A.; Misra, J. Department Conditions and Practices Associated with Faculty Workload Satisfaction and Perceptions of Equity. J. High. Educ. 2019, 30, 744–772. [Google Scholar] [CrossRef]
- Merriam, S.B.; Caffarella, R.S.; Baumgartner, L.M. Learning in Adulthood: A Comprehensive Guide, 3rd ed.; Jossey-Bass Higher and Adult Education Series; John Wiley & Sons Inc.: Hoboken, NJ, USA, 2007. [Google Scholar]
- Griffith, A.S.; Altinay, Z. A framework to assess higher education faculty workload in U.S. universities. Innov. Educ. Teach. Int. 2020, 37, 691–700. [Google Scholar] [CrossRef]
- Ben Williamson, B.; Bayne, S.; Shay, S. The datafication of teaching in Higher Education: Critical issues and perspectives. Teach. High. Educ. 2020, 35, 351–365. [Google Scholar] [CrossRef]
- Meleg, Á.; Vas, R. Towards Evidence-Based, Data-Driven Thinking in Higher Education. In Electronic Government and the Information Systems Perspective; Kő, A., Francesconi, E., Kotsis, G., Tjoa, A., Khalil, I., Eds.; EGOVIS; Lecture Notes in Computer Science; Springer: Cham, Switzerland, 2020; Volume 12394. [Google Scholar]

Publisher’s Note: MDPI stays neutral with regard to jurisdictional claims in published maps and institutional affiliations. |
© 2021 by the authors. Licensee MDPI, Basel, Switzerland. This article is an open access article distributed under the terms and conditions of the Creative Commons Attribution (CC BY) license (https://creativecommons.org/licenses/by/4.0/).