Abstract
This study examined the impacts of perceived risks on information search and risk reduction strategies as well as the relative importance of each risk reduction strategy. Multiple regression analysis was applied to analyze the sample of South Korean hotel customers and to test the hypotheses of the study. It was found that when hotel customers faced the same kind of risk, they adopted different information search strategies to reduce various risks during the COVID-19 pandemic. Moreover, ‘following hotel employee’s advice’ was perceived to be the most important information search strategy to reduce risks. This is the first study to compare the differences of perceived risk and information search strategies under the COVID-19 pandemic and normal conditions to help hotels to develop more effective strategies to recover from the pandemic. The results of the study should be interpreted with care since it was based on Korean hotel customers. The influence of cultural differences in perceived risk and information search strategy should be addressed in future studies. The study contributes to the tourism and hospitality information search and risk reduction strategy-related literature and recommends avenues for further research in the field.
1. Introduction
The COVID-19 outbreak has had devastating impacts on the lives of millions by causing unprecedented social and economic turmoil in societies worldwide. Governments across the world have adopted various countermeasures including quarantines, social distancing, avoidance of large gatherings, and travel restrictions to prevent the transmission of the virus from person to person. Suspending public transport services, shutting down entertainment venues, and banning public gatherings have helped to reduce the number of confirmed cases and prevent the further spread of the virus for a while [1]. At the same time, such countermeasures have had adverse impacts on the global economy, including the tourism and hospitality industry. The COVID-19 pandemic has had an unparalleled level of transmission causing devastating impacts on hospitality firms, employees, and customers compared with previous pandemics [2]. Customers become conscious of the risk when they recognize a demand for a product or service [3]. Therefore, customers’ perceived risk of purchasing hotel products and services is more intense under the COVID-19 pandemic than during normal conditions.
When customers perceive risks, they attempt to use specific risk reduction strategies to reduce the probability of negative results and increase their confidence in purchasing decisions [4]. The concept of perceived risk is multidimensional and related to various types of risk [5,6]. It was found that depending on the type of the perceived risk, customers adopt different risk reduction strategies [7]. Previous studies have examined the impacts of perceived risk on the customers in the travel, airline, and restaurant industries. They focused on terrorism, political instability, and economic crises within specific social environments. However, despite the growing importance, the health-related perceived risk and risk reduction strategies remain a barely examined area. Considering the fact that hotels must recover from the devastating effects of the pandemic, it is important to understand the main perceived risks of their customers in the context of health-related crises. Especially, it is crucial to understand what hotel customers will do to reduce their various perceived risks when purchasing hotel products and services under COVID-19.
Demographic factors such as age, gender, marital status, level of education, and income can influence hotel customers’ perceived risks and risk reduction strategies. Understanding the influence of different demographic characteristics on risk perception and risk reduction strategies can enable hoteliers to develop various strategies to reduce the risk for each target group [8]. At the same time, the impacts of demographic factors on the hotel customers’ risk reduction strategies remain vastly unexplored [9].
The ongoing COVID-19 pandemic is expected to significantly change the industry and cause substantial changes in the behavior of hotel customers [10]. Despite its significance, the subject area of the hotel customers’ perceived risks, customers’ risk reduction strategies, and the relative importance of each strategy during the pandemics remain unknown. It is critical to understand the changes in customer behaviors due to the pandemic. Accordingly, the main purposes of this study are as follows:
- To examine the impacts of South Korean hotel customers’ perceived risks on their risk reduction strategies along with the relative importance of each risk reduction strategy;
- To examine the differences between risk reduction strategies under the COVID-19 pandemic and the normal market conditions in South Korea;
- To investigate the effects of various demographic characteristics of South Korean hotel customers on their perceived risks and risk reduction strategies.
2. Literature Review and Hypotheses Development
2.1. The Impacts of the COVID-19 Pandemic
Existing studies examined the effects of the health-related crises on the hospitality and tourism industry [11]. They include the 2009 H1N1 flu [12,13], Ebola [14], and the foot-and-mouth disease [15,16]. One area of research that has received the most attention is the SARS pandemic [17]. The outbreak of SARS demonstrated how a pandemic can impact the travel and tourism industry [18,19,20,21]. Destination images are critical to tourists’ perception and travel decisions [22]. Heath-related crises impact tourists’ perceived risks and eventually lead to a sudden drop in tourism demand and exert negative pressure on socio-economic conditions, especially in tourism-dependent countries [14]. Pandemics such as COVID-19 and SARS are infrequent, yet they can pose more significant threats to the industry than terrorism due to their rapid transmission across geographic borders [23].
The COVID-19 pandemic caused a rapid decline of the global economy and the complete change of the trajectory of economic development almost overnight [2]. The existing evidence shows its negative impacts on the customer demand for air and sea travel and hotel accommodations. Most hotels were temporarily closed due to the ban on international travel and widespread restrictions on public gatherings [24]. The hospitality industry, unlike other business sectors, suffered a permanent loss of revenue due to the perishability of its products and services [25]. However, even though the COVID-19 pandemic presents unknown dangers and difficulties, it can also create new opportunities for hotel firms. For instance, social distancing and preventive measures dramatically accelerated the spread of ‘un-contact’ culture and promoted the development of the ‘un-contact’ technology in hotels [26]. ‘Un-contact’ service and technology such as private dining rooms, private buffet room service, and AI-powered concierges are being used to minimize the potential risks of infection while satisfying customers’ needs in the hotels.
The COVID-19 pandemic has caused complete social turmoil and created a demand for hotels to anticipate their consumers’ needs in the post-pandemic era [26]. It is indisputable that the epidemic has caused devastating impacts on all the stakeholders of the hotel and tourism industry [2]. Hotel customers should adapt to the new lifestyle changes and prepare for the ‘new normal’ in the post-pandemic era [27]. Similarly, to ensure their survival, industry practitioners are required to find new ways to adapt to the short-term and long-term behavioral changes of their customers to minimize their perceived risks associated with the purchase.
2.2. Customers’ Perceived Risk
The concept of risk includes two parts: uncertainty and potential negative consequences [28]. This usually represents losing something of value due to damage [29]. Bauer [30] divided risk into real risk or perceived risk. Real risk refers to the objective assessment of the potential of adverse outcomes, while perceived risk is the degree of subjective perception of potential losses. Perceived risk assessment requires careful consideration of two components: uncertainty and the seriousness of the purchase consequences. As perceived risk is an essential factor affecting customer decision-making, it has attracted extensive attention from researchers and managers [31]. The most common types of perceived risk include financial risk, performance risk, psychological risk, physical risk, social risk [6], and the risk of time loss [5].
Consumers are aware of the risks when making a purchase decision. If the perceived risk is within customers’ affordable range, they will make the purchase [32]. On the contrary, if the customer thinks the risks of buying a product or service are beyond their affordable range, they will adopt certain strategies to reduce those risks or avoid the purchase [7]. The perceived risk in the service industry is a crucial part of understanding customers’ purchasing behavior [33]. In the hotel industry, potential customers face various perceived risks that can include physical risks and time loss risks caused by the purchase of hotel products and services. For instance, customers could have concerns about being infected with the virus during their stay at the hotel. Moreover, they could have concerns regarding wasting time due to the safety and health preventive measures at the hotel.
Risk remains a significant factor especially for international travelers [34]. It is suggested that perceived risks beyond the acceptable level of potential tourists may affect travelers’ decisions [35]. Risks in the tourism industry may include risks caused by terrorism, natural disasters, political unrest, and epidemics. The most common perceived risk factors associated with tourism-related products and services include financial risk, performance risk, psychological risk, physical risk, and social risk [9]. Roehl and Fesenmaier [36] modified the concept of perceived risk theory to adapt it to the travel environment. They included environmental risk, financial risk, physical risk, psychological risk, satisfaction, social risk, and time-loss risk. In follow-up studies, Sönmez and Graefe [37,38] extended those risk factors by adding health risks, political instability, and terrorism risks. Furthermore, Kim [39] included physical risk, time-loss risk, economic risk, functional risk, and performance risk to the risks associated with overseas travel. The perceived risks of low-cost airline services were divided into five types: functional risk, time-loss risk, physical risk, psychosocial risk, and economic risk [40]. Kim et al. [41] studied the impact of risk perception on tourists’ attitudes and classified risks into physical risk, health risk, time-loss risk, social risk, and economic risk.
As it can be seen, most of the previous research focused on examining customers’ perceptions of risk associated with the purchase of tourism products and services. The research on the topic focusing entirely on the hotel industry during the pandemic has escaped the attention of researchers. In one of the few studies of hotel service and risk, Mitchell and Greatorex [33] identified various losses in the purchase of the hotel service in their early study. They included: financial loss, physical loss, psychological loss, and time loss. Later, Lim [42] carried out a detailed analysis of risks associated with the purchase of the hotel product and service and identified risks that included financial, physical, psychosocial, and time-loss risks.
Since customers’ perception of risk is very subjective even if customers purchase the same product or service, they may perceive a different type of risk. For example, while one can perceive the financial risk, another could pay more attention to the physical risk of the same hotel product or service [36]. Based on the study by Lim [42], the current study focused on the four dimensions of perceived risk such as financial risk, physical risk, psychosocial risk, and time-loss risk. Financial risk refers to “the possibility that service experience may not provide the value for the money spent” [43]. Physical risk during travel is related to the possibility of personal danger or injury [37]. In the context of the pandemic, the physical risk may include the possibility of being infected by the virus while traveling or staying in a hotel [44,45]. Psychosocial risk involves “the possibility of a negative effect of opinions of reference groups, self-image, and personality due to the purchase of products or services”. This is important since the purchase of hotel products and services is closely related to the customer’s social status and group identity [4]. A disappointing hotel stay can embarrass the customer and increase their psychosocial risk [46]. Time-loss risk is defined as “the possibility of wasting time or losing convenience from purchasing”. Various unpleasant and disappointing experiences during the stay may increase the time-loss risk of hotel customers [36].
2.3. Risk Reduction Strategy
When customers perceive risk beyond their level of tolerance, they attempt to use some risk reduction strategies [4]. The risk reduction strategy is any measure or method that helps to alleviate the uncertainty or negative consequences of customers’ purchasing decisions [47,48,49]. Hales and Shams [50] conceptualized risk reduction strategies as the modification of customer behavior and information search. Customer behavior modification refers to situations where hotel customers change their behavior to avoid certain risks or minimize their effects. The information search refers to the situation where customers collect useful information to avoid or minimize perceived risks. Common information search strategies can include getting advice from relatives and friends with previous experience and others via the Internet [44]. Moreover, free insurance, the local government’s guarantees of personal safety, information transparency related to risk events, and monitoring or protection measures were found to be effective strategies to reduce the risks associated with pandemics, terrorist attacks, and natural disasters [51]. Mitchell et al. [52] suggested that as the provider of services associated with high levels of risk, hotels should pay more attention to risk reduction strategies. This way they will be able to improve customers’ levels of confidence in their products and services. Mitchell and Vassos [53] reported that reading travel reviews and buying travel insurance are the most common risk mitigation strategies used by travelers. Additionally, Mitchell et al. [4] found that visiting the travel agent in person is another risk-reduction strategy applied by holidaymakers.
Lim [42] asserted that for hotel customers, risk reduction strategies can be conceptualized into five categories: searching for hotel information directly, seeking purchasing experiences, seeking higher prices, seeking lower prices, and checking hotel information. Table 1 shows a more detailed explanation about the five categories of risk reduction strategies derived from the study by Lim [42].

Table 1.
Categories of risk reduction strategies.
Previous studies confirmed that customers adopt different risk reduction strategies for different types of perceived risks [7]. Moreover, different customers may adopt different risk reduction strategies for the same kind of perceived risk. Mitchell and Greatorex’s [33] found that when hotel customers face financial and time loss risks, they tend to read service-related information or try some of the products and services before their purchase. Ju et al. [54] reported a significant relationship between the risk of time loss and searching for information directly, as well as between psychological risk and the brand image. Fast-food customers seek information based on the store image and advertisements to reduce physical risks and read the menu to reduce psychological risks [55]. It was found that hotel customers searched for hotel information directly and sought purchasing experiences to reduce financial and physical risks [42]. Besides, hotel customers sought lower prices to reduce the risk of time loss and to alleviate psychosocial risks they picked higher or lower prices. Based on the most recent study by Lim [42], risk reduction strategies were divided into five types to compare the differences before and after the COVID-19 pandemic. The following research hypothesis was formulated:
Hypothesis 1.
The impacts of each perceived risk on risk reduction strategies are significantly different under the COVID-19 pandemic market situation.
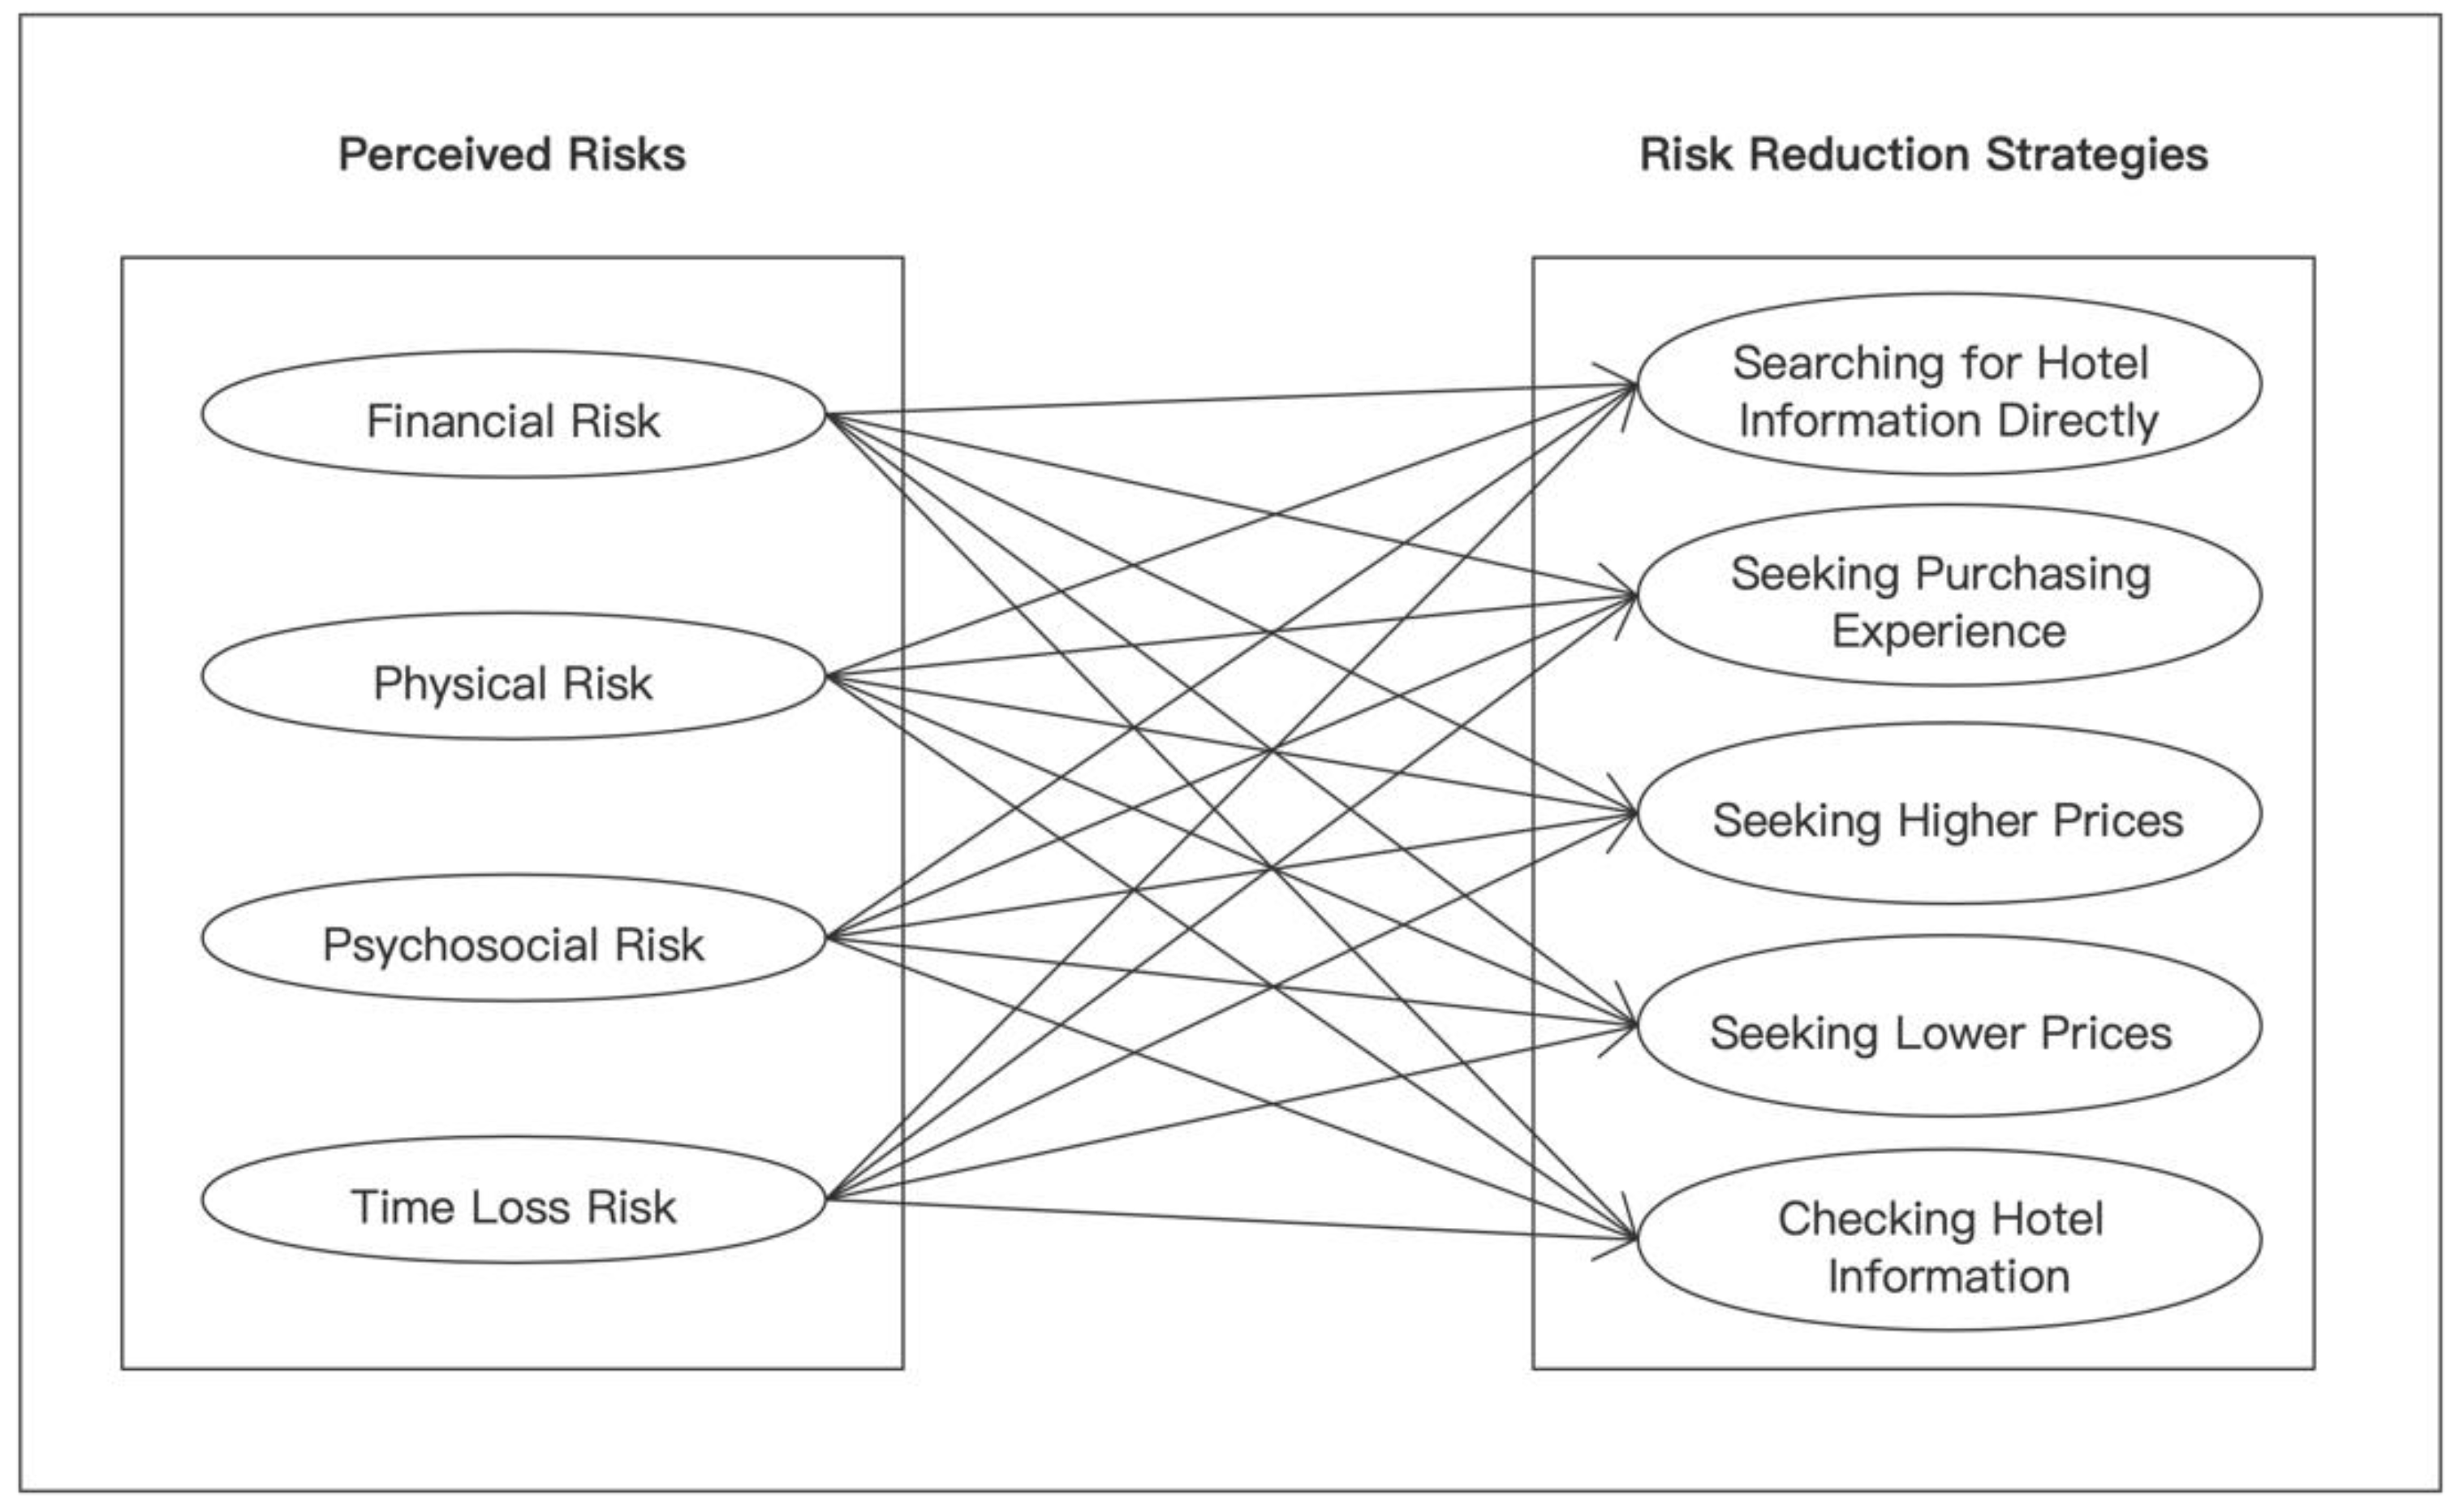
The research model is shown in Figure 1 to explain the relationship between perceived risks and risk reduction strategies.
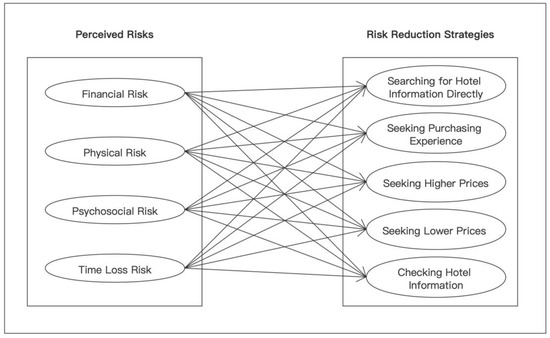
Figure 1.
Research Model.
Customers may prefer some strategies over others depending on the method of purchase and types of the products and services. It is believed that customers have a clear sequence preference when selecting a specific type of risk reduction strategy [5]. Tourism and hospitality-related studies have ranked a range of risk reduction strategies based on their importance. Kim et al. [7] found that reputation, well-known brand, safety approval symbols, and family and friends’ recommendations are the preferred strategies for reducing risks when buying airline tickets online. The most common risk reduction strategy for backpackers in Ghana was to use the local guides, avoid crowded places, travel with friends, and seek advice from the consulate and local tourism bureau [9]. When buying travel insurance, Hong Kong residents brought extra cash and searched for the latest information about the destination as their risk reduction strategy for leisure travel [49]. Mitchell and Greatorex [33] found that the most used risk reduction strategy was reading hotel product information. However, a more recent study by Lim [42] found that brand loyalty was the most important risk reduction strategy among hotel customers in South Korea.
To deal with the dynamically changing markets due to the pandemic, hotels need to choose adequate risk mitigation strategies based on the changing customer types. To do so, hotels must understand the changes in the importance of each risk reduction strategy pre and under the COVID-19 market situation. Hence, the second hypothesis of the study was formulated as follows:
Hypothesis 2.
The relative importance of each risk reduction strategy is significantly different between the COVID-19 pandemic market situation and normal market conditions.
2.4. Demographic Characteristics
Demographic characteristics that influence travelers’ perceived risk include gender, age, level of income, marital status, religion, and culture. Simpson and Siguaw [56] found that travelers’ travel risks decrease as they become older. Moreover, older people are less likely to change their travel plans when they experience travel risks compared with their counterparts. In addition, physical risks are higher for females than for males [57]. Gender, age, level of income, and marital status had an impact on customers’ perceived risks when buying airline tickets online [7]. Similarly, Adam [9] found that religion and culture are important factors that affect the perceived risk of backpackers. In addition, Mitchell and Vassos [53] identified some differences across gender and nationality on the risk reduction strategies employed by customers while purchasing packaged holidays. Married people showed a more conservative attitude toward travel during the pandemic [26]. Men generally exhibited a lower sense of perceived risks than women when it came to traveling during the COVID-19 [58]. Even though the influence of socio-demographic factors on perceived risk has been studied, its impacts on the risk reduction strategies under the COVID-19 pandemic have not been examined. Hence, the following research hypothesis was proposed:
Hypothesis 3.
Customers with different demographic characteristics have significant differences in risk perceptions and risk reduction strategies.
3. Methodology
3.1. Data Collection
To collect the data, the study employed the convenience sampling technique [59]. The online survey was conducted in order to reach more participants during the COVID-19 pandemic because of the social distancing restrictions. The survey was conducted through an online survey agency Embrain from 13 October to 23 October 2020. Embrain is a global market research and public investigation service provider which has the largest number of panels among domestic research firms in Korea. Collecting data through a public investigation service company could ensure that there is no personal preference of the researcher during the selection process, and that the sample used is representative. The sample was composed of South Korea’s customers above the age of 18 who had used hotel services during the past year. A total of 349 questionnaires were collected. After excluding incomplete questionnaires and questionnaires with the Z-score of the respondents lower than −3, the total sample size was 313 (89.7%).
3.2. Questionnaire Design
The study questionnaire was designed based on the previous studies of Mitchell and Greatorex [33] and Lim [42]. The first section of the questionnaire identified each perceived risk factor’s relative importance during the hotel product and service purchase under the COVID-19 pandemic in the country. The second section of the questionnaire was centered on each risk reduction strategies’ relative importance during the COVID-19. A 5-point Likert scale was utilized from 1 (strongly disagree) to 5 (strongly agree). The third part of the questionnaire included demographic factors and the frequency of visits to hotels in the past year.
3.3. Model and Statistical Analyses
The study conducted frequency analysis, descriptive statistics, exploratory factor analysis (EFA), reliability analysis, multiple regression analysis, analysis of variance (ANOVA), and the t-test. First, the research model was tested to determine the relationship between perceived risks and risk reduction strategies of hotel customers under the COVID-19 pandemic. The multiple regression analysis was used to identify the impact of the four perceived risk dimensions on each risk reduction strategy category and measure the relative importance of each risk reduction strategy during the pandemic.
The regression model proposed was as follows:
where Ŷi: Dependent variables (Y1: Searching direct information, Y2: Following purchase experience, Y3: Taking high prices, Y4: Seeking low prices, Y5: Exploring company information); β0: Coefficient of intercept; β1 ⋯ βn: Regression coefficients of the latent factors; X1 ⋯ Xn: Independent variables (X1: Financial Risk, X2: Physical Risk, X3: Psychosocial Risk, X4: Time-Loss Risk). The results of the current study were compared with the results of the latest study on the risk and risk reduction strategy of Korean hotel customers before the COVID-19 by Lim [42].
Ŷi = β0 + β1×1 + β2X2 + ⋯ + βnXn
4. Analyses and Results
4.1. Demographic Characteristics
Table 2 shows the descriptive statistics of the sample.
Table 2.
Demographic Characteristics of Respondents (N = 313).
The sample consisted of 55.3% of female respondents and 44.7% of male respondents. The majority of the respondents were 18–27 years old (31.3%) followed by 28–37 (25.6%) years old. The largest group of the respondents had a monthly income of 2,000,000 KRW–3,000,000 KRW (24.9%) and had a college or university degree (52.1%). The majority of the survey participants were single (55%) and had no children (60.1%). Moreover, 45.4% of the respondents stayed 1–2 times at a hotel during the COVID-19 pandemic.
4.2. Applicability and Reliability Analysis
Table 3 summarizes the results of the exploratory factor analysis and reliability tests of perceived risk items. The analysis was performed on the 13 explanatory variables that were used to capture perceived risks. All factor loading scores were higher than 0.60. Four dimensions of perceived risks accounted for more than 70% (73.715%) of the variation, meaning the four perceived risk dimensions were applicable. All Cronbach’s alpha coefficients were larger than 0.600 [60].
Table 3.
Applicability and reliability analysis of perceived risk items.
Table 4 summarizes the results of the exploratory factor analysis and reliability tests of risk reduction strategy items. The analysis was performed on the 14 explanatory variables that were used to explain the risk reduction strategy and 12-factor loading scores were higher than 0.60. Four dimensions of risk reduction strategy accounted for 60.196% of the variation. In addition, Cronbach’s alpha values were: Factor 1 (0.737), Factor 2 (0.691), Factor 3 (0.577), and Factor 4 (0.597). Although the factor analysis divided 14 strategies into four dimensions in this result, the strategies in follow-up analysis were still grouped into five dimensions according to Lim’s [42] study. This was carried out to compare the differences in the results before and during the COVID-19 pandemic in South Korea.
Table 4.
Applicability and reliability analysis of risk reduction strategy items.
4.3. Hypotheses Testing
4.3.1. The Impacts of the Perceived Risks on Risk Reduction Strategies
As shown in Table 5, the coefficients of determination (R2) were: 0.188 (Y1); 0.093 (Y2); 0.184 (Y3); 0.050 (Y4); 0.072 (Y5). The Durbin-Watson statistic values were: 1.602 (Y1); 1.715 (Y2); 1.901 (Y3); 1.962 (Y4); 1.825 (Y5). The F ratio values were: 17.772 (Y1); 7.904 (Y2); 17.405 (Y3); 4.040 (Y4); 5.959 (Y5), and significance at 0.000 (Y1, Y2, Y3, Y5) and 0.003 (Y4). The results showed that all five regression models adopted in this study were statistically significant.
Table 5.
The results of multiple regression analysis.
The t-test results showed that three out of four dimensions were significant independent variables (p ≤ 0.05) in the regression model of Y1. In Y2, Y3, Y4, there are two, three, and two dimensions that were significant independent variables (p ≤ 0.05). In Y5, only one dimension was a significant independent variable (p ≤ 0.05). This means hypothesis 1 was supported at least at the 0.05 significance level. In other words, there is a difference in the impacts of perceived risks on risk reduction strategies under the COVID-19 pandemic market situation.
Results showed that hotel customers would seek hotel information directly, seek purchasing experiences, and seek higher prices or lower prices to reduce risks of time loss during the pandemic. When hotel customers face physical risks, they would choose to seek hotel information directly and check hotel information, and seek purchasing experiences to reduce risks. Moreover, hotel customers would search for hotel information directly and choose higher prices or lower prices to reduce psychosocial risks during the pandemic. It was found that financial risks had a negative impact on seeking higher prices and had no statistically significant correlation with other strategies. This means that when hotel customers perceive financial risks, they are price-sensitive, and thus they are not likely to adopt any risk reduction strategy to reduce risks.
Compared with the previous study [42], the results showed that when customers face the same kind of risk, they may adopt different strategies during the COVID-19. Searching for direct hotel information directly includes: checking the quality guarantee and guidelines of the hotel, comparing with other hotels, and experiencing some of the hotel services in advance are the most significant strategies to reduce hotel customers’ risks during the pandemic. The information provided by the hotels is an important factor influencing customers’ purchase intentions. In addition, the customers who feel financial risks are more price-sensitive during the pandemic are less likely to adopt risk reduction strategies.
4.3.2. The Relative Importance of Each Risk Reduction Strategy
To test the second hypothesis, the one-sample t-test was used to compare the mean of each test variable to a specified constant (each previous mean) to determine if the sample mean is significantly different from that value of the previous study by Lim [42]. The results are shown in Table 6 below.
Table 6.
The relative importance of risk reduction strategies.
The one-sample t-test results showed that the mean value of nine strategies was significantly different from the mean of the previous study, and hypothesis 2 was supported (p < 0.05). The results showed that the ‘following hotel employee’s advice (3.89)’ was perceived to be the most important risk-reduction strategy to hotel customers during the COVID-19 pandemic. Interestingly, this strategy was ranked only 10th before the pandemic in the country. This demonstrates that the guidelines and information provided by hotel employees are important to customers. While the most important risk-reduction strategy for customers during the normal market conditions was ‘using hotel brands used in the past (4.00), it was ranked 7th (3.64) under COVID-19. Interestingly, “choosing a cheaper hotel (2.65)” was the least used strategy by the customers before and during the pandemic.
4.3.3. The Impact of Customers’ Demographic Characteristics
t-test and ANOVA were applied to examine whether significant relationships and differences existed between the respondents’ risk perceptions, risk reduction strategies, and their demographic characteristics. As shown in Table 7 and Table 8, hypothesis 3 was supported at least at the 0.05 significance level.
Table 7.
Risk perception according to demographic characteristics.
Table 8.
Risk reduction strategy according to demographic characteristics.
Table 7 shows the difference between customers’ risk perceptions and their demographic characteristics. Physical risk perception was higher for females in comparison with males. Younger respondents perceived higher time loss risks than older respondents. The results also revealed that the respondents’ perceived risk was differently related to psychosocial risks among different income levels. In terms of marital status, married people perceived higher financial risk than singles.
Table 8 shows the difference between risk reduction strategies and their demographic characteristics. Hotel customers with higher income are more likely to seek purchasing experience to reduce risk than their lower-income counterparts. In terms of the level of education, customers with higher levels of education are more likely to seek lower prices to reduce their risk than customers with a lower level of education. The results also revealed that customers who used hotel services more often are more likely to seek purchasing experience and higher prices to reduce their perceived risks.
5. Discussion
Results compared with other studies shed light on the changes in hotel customers’ risk perception and risk reduction behavior before and after the COVID-19 pandemic. First of all, the current results revealed that when customers face the same kind of risk, they may adopt more kinds of strategies during the COVID-19 pandemic. The results of this study are consistent with the results of previous studies on risk reduction strategies showing that customers try to adopt multiple measures to reduce the various risks caused by the pandemic [61].
Second, searching for hotel information directly was found to be the most effective strategy for hotel customers during the COVID-19 pandemic. This has also been proved in other works on information searching behavior under pandemic conditions. In a study about information searching during COVID-19, it was found that people tend to search for information more actively when they have to achieve some specific solutions [62]. It was also stated that the safety information provided by the travel and service industry providers is essential. This result once again confirms the signaling theory that information provided by the hotels is an important factor influencing customers’ purchase intentions [63]. Thus, hotels must provide their customers with the latest information and do their best to actively communicate with the customers to make them feel safe.
Third, this study confirmed the influence of demographic characteristics on the perceived risks and risk reduction strategies associated with hotel customers under the pandemic. The result that differences in customers’ perceived risks exist depending on gender, age, income level, and marital status is highly consistent with results of the Kim et al.’s [7] study on airline customers. The study results also showed that income, education level, and the number of hotel stays affected customers’ chosen risk reduction strategies, which provided new evidence to prove the impact of demographic characteristics on risk reduction strategies under the health-related crisis. Therefore, managers need to especially target facets of perceived risk salient with each targeted demographic group by providing different risk reduction strategies [64].
Finally, comparison with other results of before and after the COVID-19 pandemic is difficult. This is due to the fact that only a few studies have addressed perceived risk and risk reduction strategies for hotel customers under COVID-19. However, the current study still managed to prove the importance of developing the extension of perceived risk theory during health-related crises [65].
6. Conclusions
6.1. Findings and Implications
This study aimed to determine the impacts of hotel customers’ perceived risks on their risk reduction strategies and the relative importance of each risk reduction strategy during the COVID-19 pandemic in South Korea. In addition, the impacts of hotel customers’ demographic characteristics on their perceived risks and risk reduction strategies were explored due to their importance.
The results of the analysis suggest that when hotel customers face the same kind of risk, they adopt different strategies during the COVID-19 pandemic. Specifically, hotel customers searched for hotel information directly, and sought purchasing experiences and higher or lower prices to reduce their risk of time loss. To reduce their physical risks, they searched hotel information directly, checked hotel information, or sought purchasing experiences. In order to mitigate psychosocial risks hotel customers sought hotel information directly and chose higher or lower prices. Hotel customers who felt financial risks were more price-sensitive than their counterparts before the COVID-19 were less likely to adopt any strategies to reduce their risks. Hotel customers’ concerns about the COVID-19 and the economic environment could have surpassed other risks. On the other hand, searching for hotel information directly, such as reading hotel guidelines and quality assurance information, experiencing some of the hotel services in advance, or comparing with other hotels were found to be the most effective strategies for hotel customers during COVID-19. Hence, hotels should be more active in providing consumers with the latest information through establishing more effective communication channels. ‘Following hotel employee’s advice’ was found to be the most important risk-reduction strategy for hotel customers during the pandemic. This was followed by ‘read product and service information in advance’, ranked relatively low before the pandemic [42]. This shows that the official information provided by hotels and employee recommendations are very important at the moment. Thus, hotels must provide timely and accurate information and enhance the training of front-line employees. Conversely, the purchasing experience has become less important to the customers. Due to social distancing and lifestyle changes, experiencing hotel products and services does not reduce consumers’ perceived risks. Instead, such strategies make consumers worry about their risks of infection even more. Hence, hotel managers are advised to change their marketing strategies and to provide more ‘un-contact’ services to minimize their customers’ potential risks of COVID-19.
The study results prove that demographic characteristics influence customers’ perception of risk for the threat or fear of pandemic [66]. Therefore, hotels must adopt different promotion and marketing strategies depending on the customer group. To survive, hotel firms must learn from the new trends. The study findings can be useful in developing more effective marketing strategies to recover after the end of the pandemic. The results can provide new insights not only to hoteliers in South Korea but also to international researchers and professionals in related industries.
6.2. Limitations and Future Research
This study has some limitations. An online survey had to be conducted due to the social distancing restrictions. This limitation may lead to concerns about external validity and representativeness. A larger sample could be acquired in future studies. The results of the study should be interpreted with care since it was based on the hotel customers during the COVID-19 pandemic in South Korea. Moreover, various cultural differences can have significant impacts on hotel customers’ perceived risks [67]. Therefore, the influence of cultural differences in perceived risk and risk reduction strategy should be addressed in future studies. Researchers can examine perceived risk in other tourism and hospitality-related industries such as airlines, cruise lines, and restaurants. Additionally, future studies can explore more extensive and diversified strategies risk reduction strategies such as SSTs (Self-Service Technologies) that can reduce direct contact and interaction between customers and hotel staff [68].
Author Contributions
Conceptualization, Y.-W.Z.; methodology, Y.-W.Z.; investigation, Y.-W.Z.; data curation, Y.-W.Z.; writing—original draft preparation, Y.-W.Z.; writing—review and editing, Y.-W.Z., J.-G.C. and A.R.A.; supervision, J.-G.C. and A.R.A. All authors have read and agreed to the published version of the manuscript.
Funding
This research received no external funding.
Institutional Review Board Statement
Not applicable.
Informed Consent Statement
Not applicable.
Data Availability Statement
Data will be made available on request from the authors.
Conflicts of Interest
The authors declare no conflict of interest.
References
- Tian, H.; Liu, Y.; Li, Y.; Wu, C.; Chen, B.; Kraemer, M.; Li, B.; Cai, J.; Xu, B.; Yang, Q.; et al. An investigation of transmission control measures during the first 50 days of the COVID-19 epidemic in China. Science 2020, 368, 638–642. [Google Scholar]
- Gursoy, D.; Chi, C. Effects of COVID-19 pandemic on hospitality industry: Review of the current situations and a research agenda. J. Hosp. Mark. Manag. 2020, 29, 527–529. [Google Scholar] [CrossRef]
- Burns, W.; Peters, E.; Slovic, P. Risk Perception and the Economic Crisis: A Longitudinal Study of the Trajectory of Perceived Risk. Risk. Anal. 2011, 32, 659–677. [Google Scholar] [CrossRef] [PubMed]
- Mitchell, V.; Davies, F.; Moutinho, L.; Vassos, V. Using Neural Networks to Understand Service Risk in the Holiday Product. J. Bus. Res. 1999, 46, 167–180. [Google Scholar] [CrossRef]
- Roselius, T. Consumer Rankings of Risk Reduction Methods. J. Mark. 1971, 35, 56–61. [Google Scholar] [CrossRef]
- Jacoby, J.; Kaplan, L. The Components of Perceived Risk. In Proceedings of the Third Annual Conference of the Association for Consumer Research, Chicago, IL, USA, 3–5 November 1972; Venkatesan, M., Ed.; Association for Consumer Research: College Park, MD, USA, 1972; pp. 382–393. Available online: https://www.acrwebsite.org/volumes/12016/volumes/sv02/SV-0225 (accessed on 21 September 2021).
- Kim, L.; Qu, H.; Kim, D. A study of perceived risk and risk reduction of purchasing air-tickets online. J. Travel. Tour. Mark. 2009, 26, 203–224. [Google Scholar] [CrossRef]
- Mitchell, V.; Boustani, P. Market Development Using New Products and New Customers: A Role for Perceived Risk. Eur. J. Mark. 1993, 27, 17–32. [Google Scholar] [CrossRef]
- Adam, I. Backpackers’ risk perceptions and risk reduction strategies in Ghana. Tour. Manag. 2015, 49, 99–108. [Google Scholar] [CrossRef]
- Hao, F.; Xiao, Q.; Chon, K. COVID-19 and China’s Hotel Industry: Impacts, a Disaster Management Framework, and Post-Pandemic Agenda. Int. J. Hosp. Manag. 2020, 90, 102636. [Google Scholar]
- Mair, J.; Ritchie, B.; Walters, G. Towards a research agenda for post-disaster and post-crisis recovery strategies for tourist destinations: A narrative review. Curr. Issues Tour. 2014, 19, 1–26. [Google Scholar] [CrossRef]
- Taglioni, F.; Cartoux, M.; Dellagi, K.; Dalban, C.; Fianu, A.; Carrat, F.; Favier, F. The influenza A (H1N1) pandemic in Reunion Island: Knowledge, perceived risk and precautionary behaviour. BMC Infect Dis. 2013, 13, 34. [Google Scholar]
- Kim, Y.; Zhong, W.; Jehn, M.; Walsh, L. Public Risk Perceptions and Preventive Behaviors During the 2009 H1N1 Influenza Pandemic. Disaster Med. Public Health Prep. 2015, 9, 145–154. [Google Scholar]
- Novelli, M.; Gussing Burgess, L.; Jones, A.; Ritchie, B. ‘No Ebola…still doomed’—The Ebola-induced tourism crisis. Ann. Tour. Res. 2018, 70, 76–87. [Google Scholar] [CrossRef]
- Frisby, E. Communicating in a crisis: The British Tourist Authority’s responses to the foot-and-mouth outbreak and 11th September, 2001. J. Vacat. Mark. 2003, 9, 89–100. [Google Scholar] [CrossRef]
- Irvine, W.; Anderson, A. The Impacts of Foot and Mouth Disease on a Peripheral Tourism Area: The Role and Effect of Crisis Management. J. Travel Tour. Mark. 2006, 19, 47–60. [Google Scholar] [CrossRef]
- Mason, P.; Grabowski, P.; Du, W. Severe acute respiratory syndrome, tourism and the media. Int. J. Tour. Res. 2005, 7, 11–21. [Google Scholar]
- Henderson, J.; Ng, A. Responding to crisis: Severe acute respiratory syndrome (SARS) and hotels in Singapore. Int. J. Tour. Res. 2004, 6, 411–419. [Google Scholar] [CrossRef]
- Dombey, O. The effects of SARS on the Chinese tourism industry. J. Vacat. Mark. 2004, 10, 4–10. [Google Scholar]
- McKercher, B.; Chon, K. The Over-Reaction to SARS and the Collapse of Asian Tourism. Ann. Tour. Res. 2004, 31, 716–719. [Google Scholar]
- Washer, P. Representations of SARS in the British newspapers. Soc. Sci. Med. 2004, 59, 561–2571. [Google Scholar]
- Choi, J.; Tkachenko, T.; Sil, S. On the destination image of Korea by Russian tourists. Tour. Manag. 2011, 32, 193–194. [Google Scholar]
- Breitsohl, J.; Garrod, B. Assessing tourists’ cognitive, emotional and behavioural reactions to an unethical destination incident. Tour. Manag. 2016, 54, 209–220. [Google Scholar] [CrossRef] [Green Version]
- Bartik, A.W.; Bertrand, M.; Cullen, Z.B.; Glaeser, E.L.; Luca, M.; Stanton, C.T. How are Small Businesses Adjusting to COVID-19? Early Evidence from a Survey; 2020. Available online: https://www.nber.org/system/files/working_papers/w26989/w26989.pdf (accessed on 21 September 2021).
- Gössling, S.; Scott, D.; Hall, C. Pandemics, tourism and global change: A rapid assessment of COVID-19. J. Sustain. Tour. 2020, 29, 1–20. [Google Scholar] [CrossRef]
- Bae, S.; Chang, P. The effect of coronavirus disease-19 (COVID-19) risk perception on behavioural intention towards ‘untact’ tourism in South Korea during the first wave of the pandemic (March 2020). Curr. Issues Tour. 2020, 24, 1017–1035. [Google Scholar]
- Key Consumer Behavior Thresholds Identified as the Coronavirus Outbreak Evolves. NielsenIQ, 2021. Available online: https://training.nielseniq.com/global/en/insights/analysis/2020/key-consumer-behavior-thresholds-identified-as-the-coronavirus-outbreak-evolves-2/ (accessed on 21 September 2021).
- Slovic, P. Perception of risk. Science 1987, 236, 280–285. [Google Scholar] [CrossRef] [PubMed]
- Chien, P.; Sharifpour, M.; Ritchie, B.; Watson, B. Travelers’ Health Risk Perceptions and Protective Behavior: A Psychological Approach. J. Travel Res. 2016, 56, 744–759. [Google Scholar]
- Bauer, R.A. Consumer Behavior as Risk Taking. In Dynamic Marketing for a Changing World, Proceedings of the 43rd Conference of the American Marketing Association, Chicago, IL, USA, 15–17 June 1960; Hancock, R.S., Ed.; American Marketing Association: Chicago, IL, USA, 1960; pp. 389–398. Available online: https://www.scirp.org/(S(351jmbntvnsjt1aadkposzje))/reference/ReferencesPapers.aspx?ReferenceID=1409819 (accessed on 21 September 2021).
- Ritchie, B.; Jiang, Y. A review of research on tourism risk, crisis and disaster management: Launching the annals of tourism research curated collection on tourism risk, crisis and disaster management. Ann. Tour Res. 2019, 79, 102812. [Google Scholar] [CrossRef]
- Dowling, G. Perceived risk: The concept and its measurement. Psychol. Mark. 1986, 3, 193–210. [Google Scholar]
- Mitchell, V.; Greatorex, M. Risk Perception and Reduction in the Purchase of Consumer Services. Serv. Ind. J. 1993, 13, 179–200. [Google Scholar] [CrossRef]
- Kozak, M.; Crotts, J.; Law, R. The impact of the perception of risk on international travellers. Int. J. Tour. Res. 2007, 9, 233–242. [Google Scholar]
- Chew, E.; Jahari, S. Destination image as a mediator between perceived risks and revisit intention: A case of post-disaster Japan. Tour. Manag. 2014, 40, 382–393. [Google Scholar] [CrossRef]
- Roehl, W.; Fesenmaier, D. Risk Perceptions and Pleasure Travel: An Exploratory Analysis. J. Travel Res. 1992, 30, 17–26. [Google Scholar] [CrossRef]
- Sönmez, S.; Graefe, A. Influence of terrorism risk on foreign tourism decisions. Ann. Tour. Res. 1998, 25, 112–144. [Google Scholar] [CrossRef] [Green Version]
- Sönmez, S.; Graefe, A. Determining Future Travel Behavior from Past Travel Experience and Perceptions of Risk and Safety. J. Travel Res. 1998, 37, 171–177. [Google Scholar] [CrossRef]
- Kim, H.J. A Study of the Effects of Risk Attributes and Types Perceptions on Travel Products Purchase Intentions and Purchase Recommend Intentions. Korean. J. Hosp. Tour. Res. 2012, 21, 137–152. [Google Scholar]
- Park, J.H. A Study on the Perceived Risk toward Low Cost Carrier Service. J. Tour. Leis. Res. 2017, 29, 175–189. [Google Scholar]
- Kim, H.B.; Lim, J.Y.; Kim, N.E. The Effect of Risk Perception on Worries and Attitudes of Tourists. Korean. J. Hosp. Tour. Res. 2010, 19, 171–193. [Google Scholar]
- Lim, H.J. A Study on Hotel Consumers’ Perceived Risk and Risk Reduction Strategy. J. Tour. Manag. Res. 2019, 23, 571–591. [Google Scholar]
- Basala, S.; Klenosky, D. Travel-Style Preferences for Visiting a Novel Destination: A Conjoint Investigation across the Novelty-Familiarity Continuum. J. Travel Res. 2001, 40, 172–182. [Google Scholar] [CrossRef]
- Michalko, G. Tourism Eclipsed by Crime. J. Travel Tour. Mark. 2004, 15, 159–172. [Google Scholar] [CrossRef]
- Richter, L. International Tourism and its Global Public Health Consequences. J. Travel Res. 2003, 41, 340–347. [Google Scholar] [CrossRef]
- Moutinho, L. Consumer Behaviour in Tourism. Eur. J. Mark. 1987, 21, 5–44. [Google Scholar] [CrossRef]
- Mitchell, V.; McGoldrick, P. Consumer’s risk-reduction strategies: A review and synthesis. Int. Rev. Retail Distrib. Consum. Res. 1996, 6, 1–33. [Google Scholar] [CrossRef]
- McCarthy, M.; Henson, S. Perceived risk and risk reduction strategies in the choice of beef by Irish consumers. Food Qual Prefer. 2005, 16, 435–445. [Google Scholar] [CrossRef]
- Lo, A.; Cheung, C.; Law, R. Hong Kong Residents’ Adoption of Risk Reduction Strategies in Leisure Travel. J. Travel Tour. Mark. 2011, 28, 240–260. [Google Scholar] [CrossRef]
- Hales, C.; Shams, H. Cautious Incremental Consumption: A Neglected Consumer Risk Reduction Strategy. Eur. J. Mark. 1991, 25, 7–21. [Google Scholar] [CrossRef]
- Law, R. The perceived impact of risks on travel decisions. Int. J. Tour. Res. 2006, 8, 289–300. [Google Scholar]
- Mitchell, V.; Moutinho, L.; Lewis, B. Risk Reduction in Purchasing Organisational Professional Services. Serv. Ind. J. 2003, 23, 1–19. [Google Scholar] [CrossRef]
- Mitchell, V.; Vassos, V. Perceived Risk and Risk Reduction in Holiday Purchases: A Cross-Cultural and Gender Analysis. J. Eur. Mark. 1998, 6, 47–79. [Google Scholar]
- Ju, S.H.; Koo, D.M.; Kim, J.J. The Effect of Product’s Intangibility on Risk Perception and Risk Reduction Behaviors of Consumers and the Moderating Effect of Self-Regulatory. J. Mark. Stud. 2013, 21, 27–57. [Google Scholar]
- Ahn, J.A.; Kim, B.C.; Choi, Y.H. Korean Youths’ Food Choices: Perceived Risk of Fast Food Consumers and Purchase Intension. J. Prac. Res. Adv. Pub. Relat. 2013, 6, 46–66. [Google Scholar]
- Simpson, P.; Siguaw, J. Perceived travel risks: The traveller perspective and manageability. Int. J. Tour. Res. 2008, 10, 315–327. [Google Scholar] [CrossRef]
- Boksberger, P.; Bieger, T.; Laesser, C. Multidimensional analysis of perceived risk in commercial air travel. J. Air Transp. Manag. 2007, 13, 90–96. [Google Scholar]
- Dryhurst, S.; Schneider, C.; Kerr, J.; Freeman, A.; Recchia, G.; van der Bles, A.; Spiegelhalter, D.; van der Linden, S. Risk perceptions of COVID-19 around the world. J. Risk Res. 2020, 23, 994–1006. [Google Scholar]
- Malhotra, N.K.; Peterson, M. Basic Marketing Research: A Decision-Making Approach; Prentice Hall: Englewood Cliffs, NJ, USA, 2006. [Google Scholar]
- Nunnally, J.C. Psychometric Theory, 2nd ed.; McGraw-Hill: New York, NY, USA, 1978. [Google Scholar]
- Shoaib, M.; Abdullah, F. Risk Reduction of COVID-19 Pandemic in Pakistan. Soc. Work Public Health 2020, 35, 557–568. [Google Scholar]
- MacSween, S.; Canziani, B. Travel booking intentions and information searching during COVID-19. Int. Hosp. Rev. 2021, in press. [Google Scholar] [CrossRef]
- Shin, H.; Kang, J. Reducing perceived health risk to attract hotel customers in the COVID-19 pandemic era: Focused on technology innovation for social distancing and cleanliness. Int. J. Hosp. Manag. 2020, 91, 102664. [Google Scholar]
- Sharma, S.; Singh, G.; Pratt, S. Modeling the Multi-dimensional Facets of Perceived Risk in Purchasing Travel Online: A Generational Analysis. J. Qual. Assur. Hosp. Tour. 2021, 1–29. [Google Scholar] [CrossRef]
- Choe, J.; Kim, J.; Hwang, J. Perceived risks from drone food delivery services before and after COVID-19. Int. J. Contemp. Hosp. Manag. 2021, 33, 1276–1296. [Google Scholar] [CrossRef]
- Raude, J.; Setbon, M. Lay perceptions of the pandemic influenza threat. Eur. J. Epidemiol. 2009, 24, 339–342. [Google Scholar] [CrossRef]
- Weber, E.; Hsee, C. Cross-Cultural Differences in Risk Perception, but Cross-Cultural Similarities in Attitudes Towards Perceived Risk. Manag. Sci. 1998, 44, 1205–1217. [Google Scholar] [CrossRef] [Green Version]
- Yang, K.; Choi, J.G.; Chung, J. Extending the Technology Acceptance Model (TAM) to Explore Customer’s Behavioral Intention to Use Self-Service Technologies (SSTs) in Chinese Budget Hotels. Glob. Bus. Finance Rev. 2021, 26, 79–94. [Google Scholar] [CrossRef]
Publisher’s Note: MDPI stays neutral with regard to jurisdictional claims in published maps and institutional affiliations. |
© 2021 by the authors. Licensee MDPI, Basel, Switzerland. This article is an open access article distributed under the terms and conditions of the Creative Commons Attribution (CC BY) license (https://creativecommons.org/licenses/by/4.0/).