Abstract
One of the goals of any oil terminal is to make a business while avoiding hazardous events and harmful effects for both humans and the environment. This can be achieved by creating a safe working place as well as by performing safe and acceptable activities regarding the impact on surrounding objects, including residential and industrial areas. The aim of the hazard analysis of the oil terminal is to assess the risks related to hazardous events or phenomena and to evaluate whether the assessed risks are acceptable. The hazard analysis and assessment of risk are also used for risk reduction while examining and limiting hazardous scenarios that, for instance, involve the loss-of-containment of flammable or combustible material. In this paper, the authors aim to contribute to risk research by providing a comprehensive methodology of risk assessment for oil terminals with case study results and discussion on features of the methodology, risk aggregation, its applicability for risk reduction, and industrial interests. The performed study considered the “Klaipedos Nafta AB” (an operator of the Klaipeda Oil Terminal, Lithuania) case study regarding hazardous materials that might be released from various tanks, devices, and associated pipelines. The performed quantitative risk assessment has enabled the determination of the probability regarding whether releases would ignite and, for instance, cause explosion. In the case study, the estimate of probability, i.e., the frequency, and the possible consequences of the hazardous events were evaluated, and both mitigation and risk reduction measures were also considered.
1. Introduction
Oil terminals as other energy objects play a crucial role in the national energy system, as their main function in the distribution chain is to provide temporary storage for oil products for redistribution to end-users and to directly supply large commercial companies. The storage of a huge amounts of dangerous substances can cause serious threats to humans and the environment. This might be related to improper maintenance, operation, management, construction, or even design. An emergency in an oil terminal can cause uncontrolled flow-outs, fires, explosions, etc., potentially leading to environmental catastrophe or the loss of human life. For instance, a series of large fire and explosion accidents took place in oil depots in the past, including the “Hertfordshire Oil Storage Terminal” fire (Buncefield oil depot explosion in London, UK; 11 December 2005); an explosion at the “Caribbean Petroleum Corporation’s Bayamon” oil storage (San Juan, Puerto Rico; 23 October 2009); and an explosion at the “Indian Oil Corporation’s Hazira” depot (5 January 2013).
The activities of oil terminals’ operators are controlled by the regulatory authorities and associated regulatory requirements at a national level. In the European Union (EU), this complies with the “Directive 2012/18/EU of the European Parliament and the Council on the control of major accident hazards involving dangerous substances” [1]. In this way, EU operators are obliged to prepare and periodically renew safety reports to ensure proper management, operation, and maintenance. Additionally, the risk assessment is a major part of the safety report, the content of which is still not standardized or harmonized and is not based on state-of-the-art methodologies.
The final goal of risk assessment is to evaluate risk levels and to provide support to decision-makers. Both the results and the application of the risk or safety assessment could be adapted for this aim, as “This has evolved from a traditional deterministic perspective, via a risk-based philosophy to an integrated, risk-informed approach” [2]. Indeed, the choice of approach and decision-making is a question of balancing the deterministic and probabilistic considerations depending on the effects of the problem at hand. The issue grows when other factors beyond risk are considered. As demonstrated by Christou and Mattarelli [3], the integration of economic considerations, local community land use planning, and safety is quite problematic.
In general, there are many literature sources for risk assessment methodology and applications in different fields; however, papers directly dedicated to risk analysis application to oil terminals or separate parts are quite rare. For instance, to identify optimal firefighting strategies for oil terminals, Khakzad [4] considered the impact of safety measures, especially when the number of fire trucks is not sufficient to cope with fire, and performed a risk assessment and modeling of the domino effect. Before that, Shebeko et al. [5] considered large-scale oil terminals. As the main task, they identified fire safety and presented a detailed fire risk assessment. They calculated potential, individual, and societal risks. As a result, they presented the potential risk for various parts of the terminal and the individual risk (IR) of various categories of personnel. The potential risks varied between 1.5 × 10⁻⁵ and 3.7 × 10⁻⁵ per year, and the IR in the range 1.1 × 10⁻⁶–2.2 × 10⁻⁵ per year.
Similar to oil terminals, an integrated risk assessment methodology for LNG terminals was presented [6]. In this case, six basic steps were identified, including, in sequential order, the identification of hazard, modeling of accident sequence, data acquisition, estimation of parameters, quantification of accident sequence, assessment of consequence, and integration of results where risk indices are assessed. As a practical implementation of the presented methodology, they assessed onshore and offshore LNG terminal risks. Fu et al. [7] presented a very similar risk assessment methodology for the LNG-fueled vessel. The main difference between these two papers is that for the consequence, the assessment probabilistic method [6] is used instead of computational fluid dynamics simulation [7].
Kang et al. [8] proposed a quite new risk evaluation method for the oil tank zone based on two types of hazard theory. The main idea consists of three steps: calculation severity of the consequence via the first type of hazards; based on the risk evaluation of the second type of hazards’ determination of the probability of accidents; and obtaining of the comprehensive evaluation result of the major hazards upon the coupling effect of the two types of hazards.
HAZID techniques for offshore installations were summarized in various reports, such as in [9] and [10]. Wadhwani, Kumar, and Singh [11] applied the HAZID technique to identify the hazards on the offshore platforms. Chang and Lin [12] categorized the causes that led to 242 accidents of storage tanks that occurred in the last 40 years.
Fuentes-Bargues et al. [13] presented a risk analysis of a fuel storage terminal using a methodology that combines HAZard and OPerability analysis (HAZOP) and fault tree analysis (FTA) for fuel storage terminals. For the relevant risk-assessment approach, Marhavilas et al. [14] integrated HAZOP with multi-criteria decision-making. Wu and Lind [15] addressed the importance of understanding system complexity for HAZOP studies in the oil and gas industry.
Romero-Faz and Camarero-Orive [16] proposed a risk assessment methodology with new parameters of complex infrastructures, in general, and of commercial ports, in particular. The new parameters reflect the intrinsic risks both to a port and to the type of terminal, representing terminal layout, accessibility, and how key elements are operationally relevant to port operations. In addition, exploration of the complex interrelationships between the risk of energy-critical infrastructure or other infrastructures and oil systems was widely considered by Jaradat and Keating [17].
To meet the recommendations of safety-related guides, the risk must be aggregated for various risk contributors with the ultimate goal of evaluating the overall risk profile. Risk aggregation is the process of creating a combined representation of risk across the various contributors, which requires the application of appropriate risk metrics and proper treatment of uncertainties. A review of the state of practice in this field has revealed the need for a description of the general framework of risk aggregation and, therefore, this paper includes a part that will contribute to a methodology on risk aggregation as well as will describe the state of practice for the specific case study.
Thus, the objective of this paper is to present a comprehensive methodology of risk assessment for oil terminals, with case study results and discussion on risk aggregation, features of methodology, its applicability for risk reduction, and industrial interests. This paper is organized as follows. Section 2 presents the quantitative risk assessment methodology. The following sections summarize the major findings from the risk assessment. Discussion on risk assessment and risk aggregation is placed at the end of Section 3. Finally, Section 4 presents the conclusions of the study.
2. Materials and Methods
In general, risk assessment is a process, which encompasses different aspects, such as a comparison of risk analysis results, a definition, and an application of risk criteria to evaluate whether the risk posed by the object is acceptable. In other words, risk assessment answers the three fundamental questions: “What can go wrong?”, “How likely is it?”, and “What are the consequences?”
Risk is defined as a harmful outcome of an activity. Referencing the study of Zohuri and Fathi [18], it can be characterized by two “quantities”: the severity of the unfavorable consequence(s) that can potentially result from the given action and/or activity, and from the likelihood of the occurrence of the given unfavorable consequence(s). The risk assessment is a powerful analytic tool to assess risk level or safety performance, while the severity of hazard could be measured as a number of potentially injured or dead humans.
As indicated by Kang et al. [8], the complex systems, their interactions, and failure modes of specific equipment have a significant impact in increasing the frequency of an accident that occurs in oil storage tank zones. In addition, petroleum industries and oil storage tanks pose serious environmental hazards due to the large quantities of the hazardous materials (HAZMATs) contained in them.
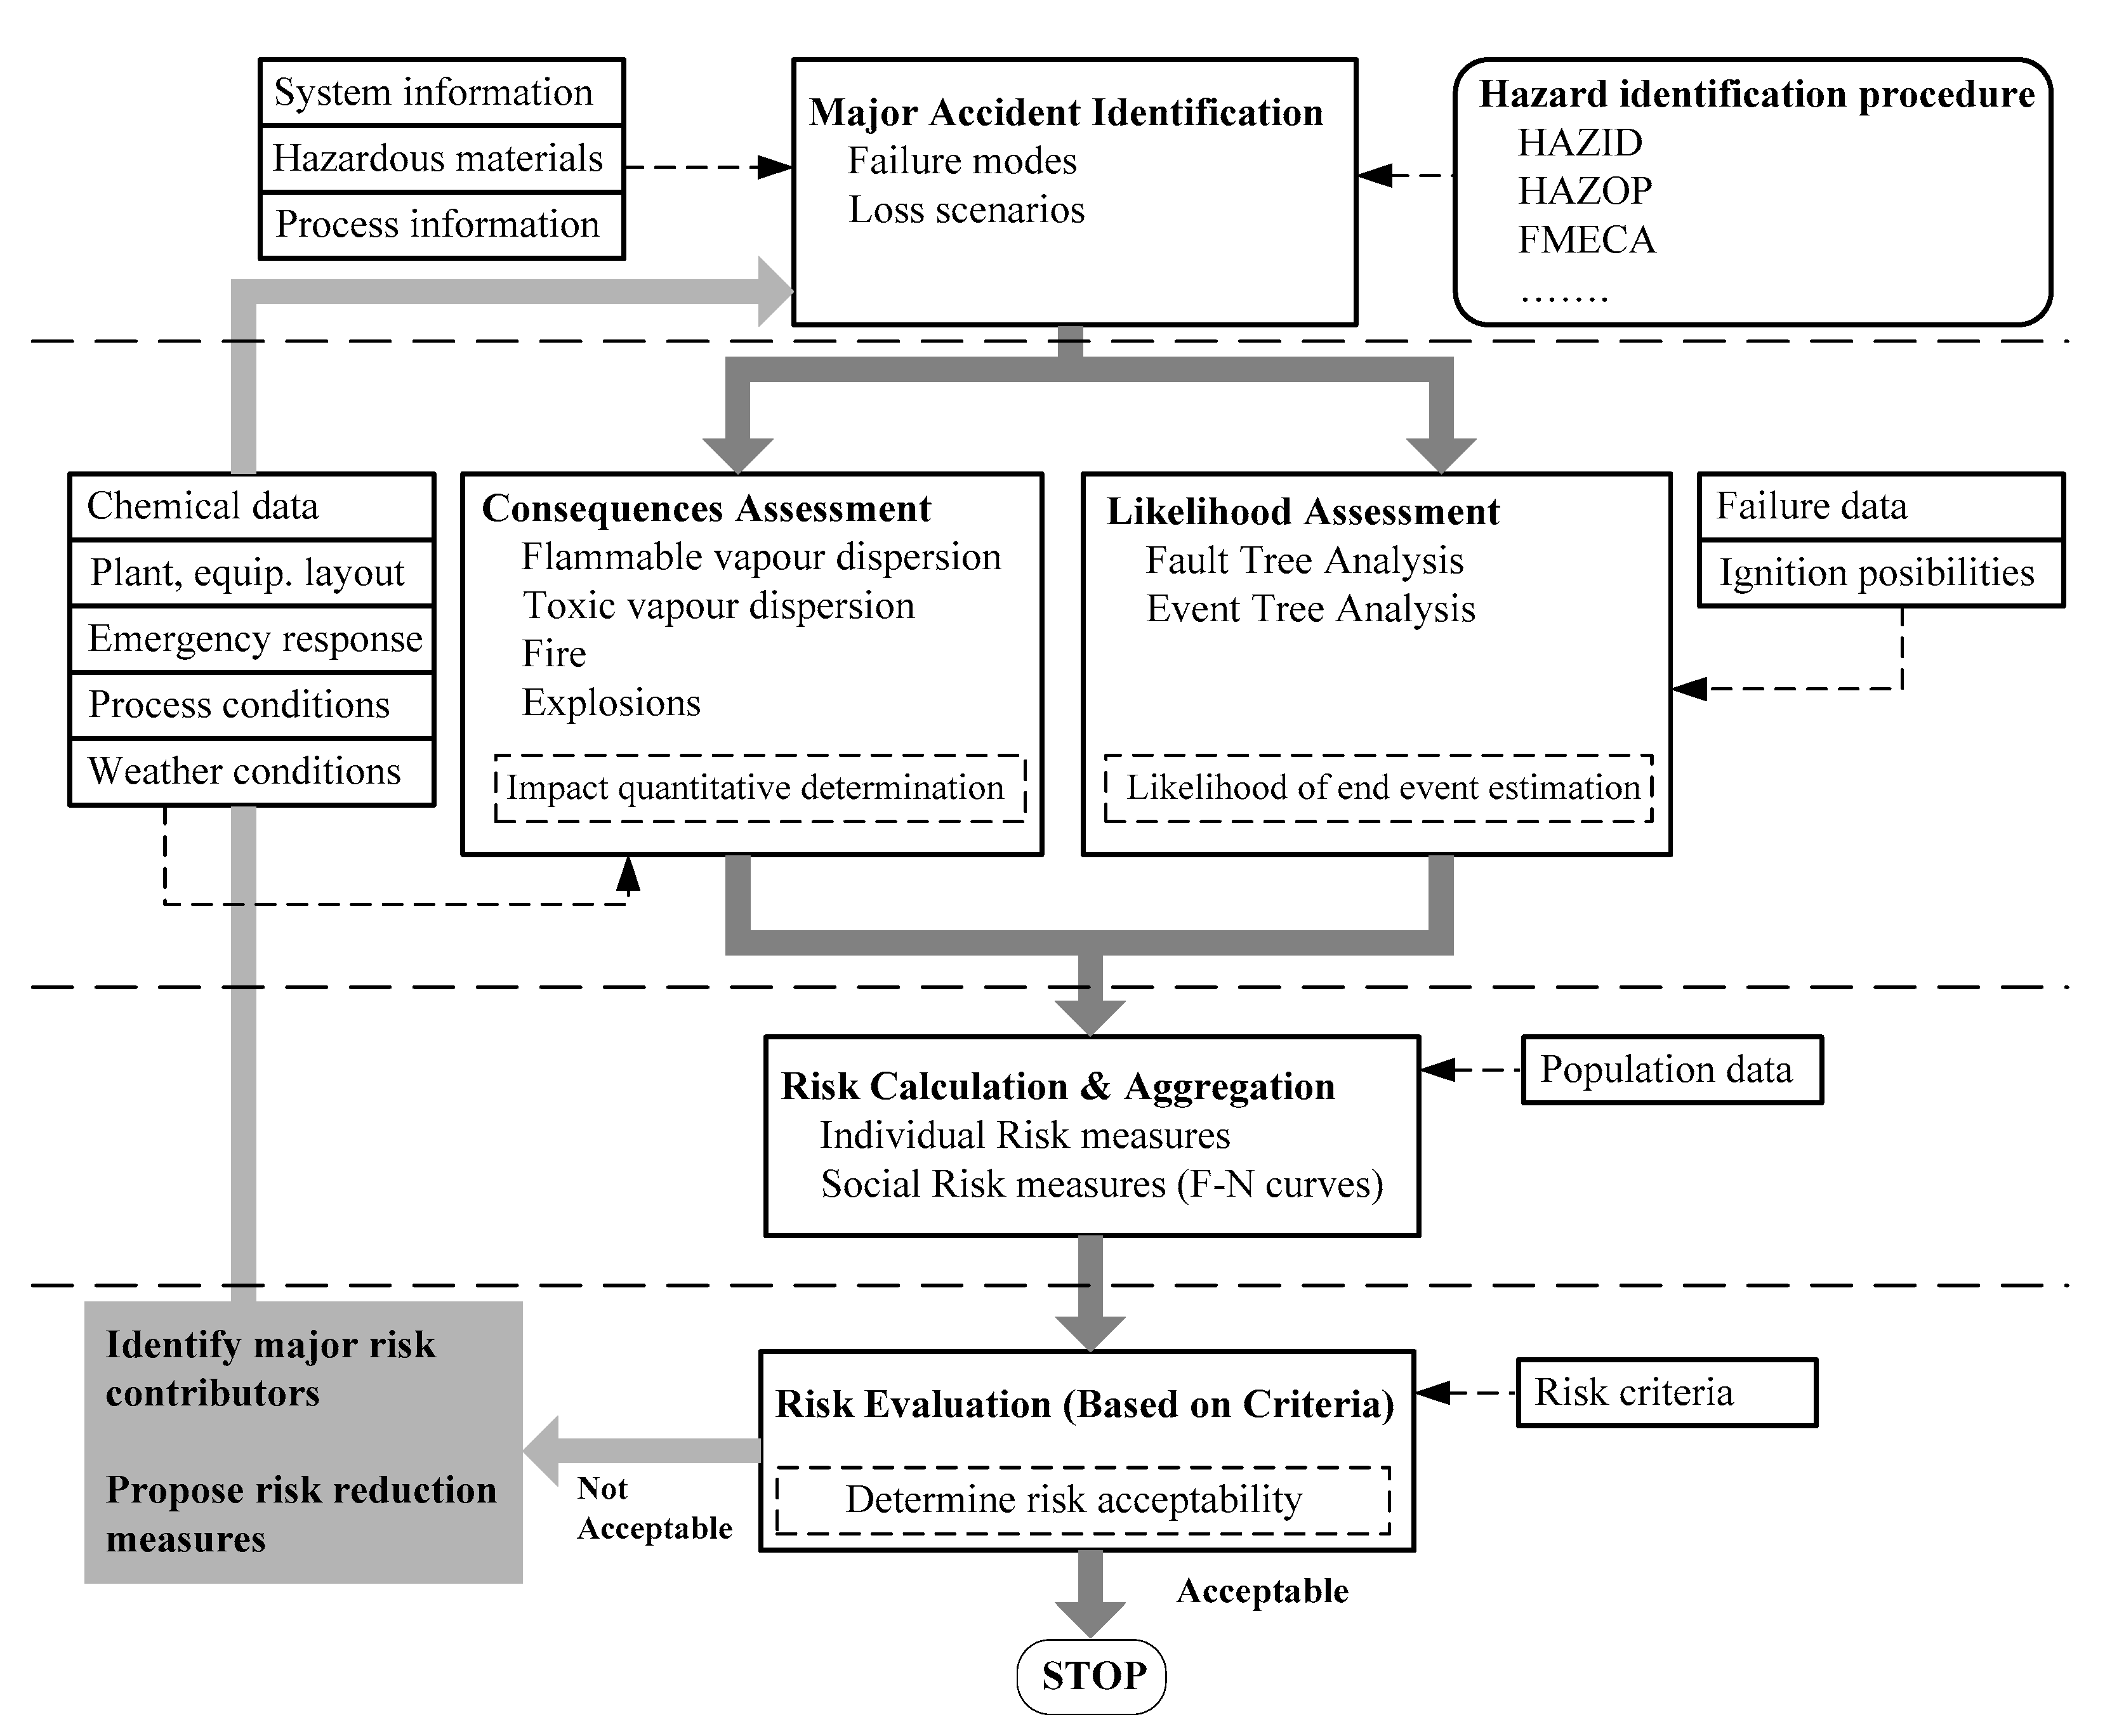
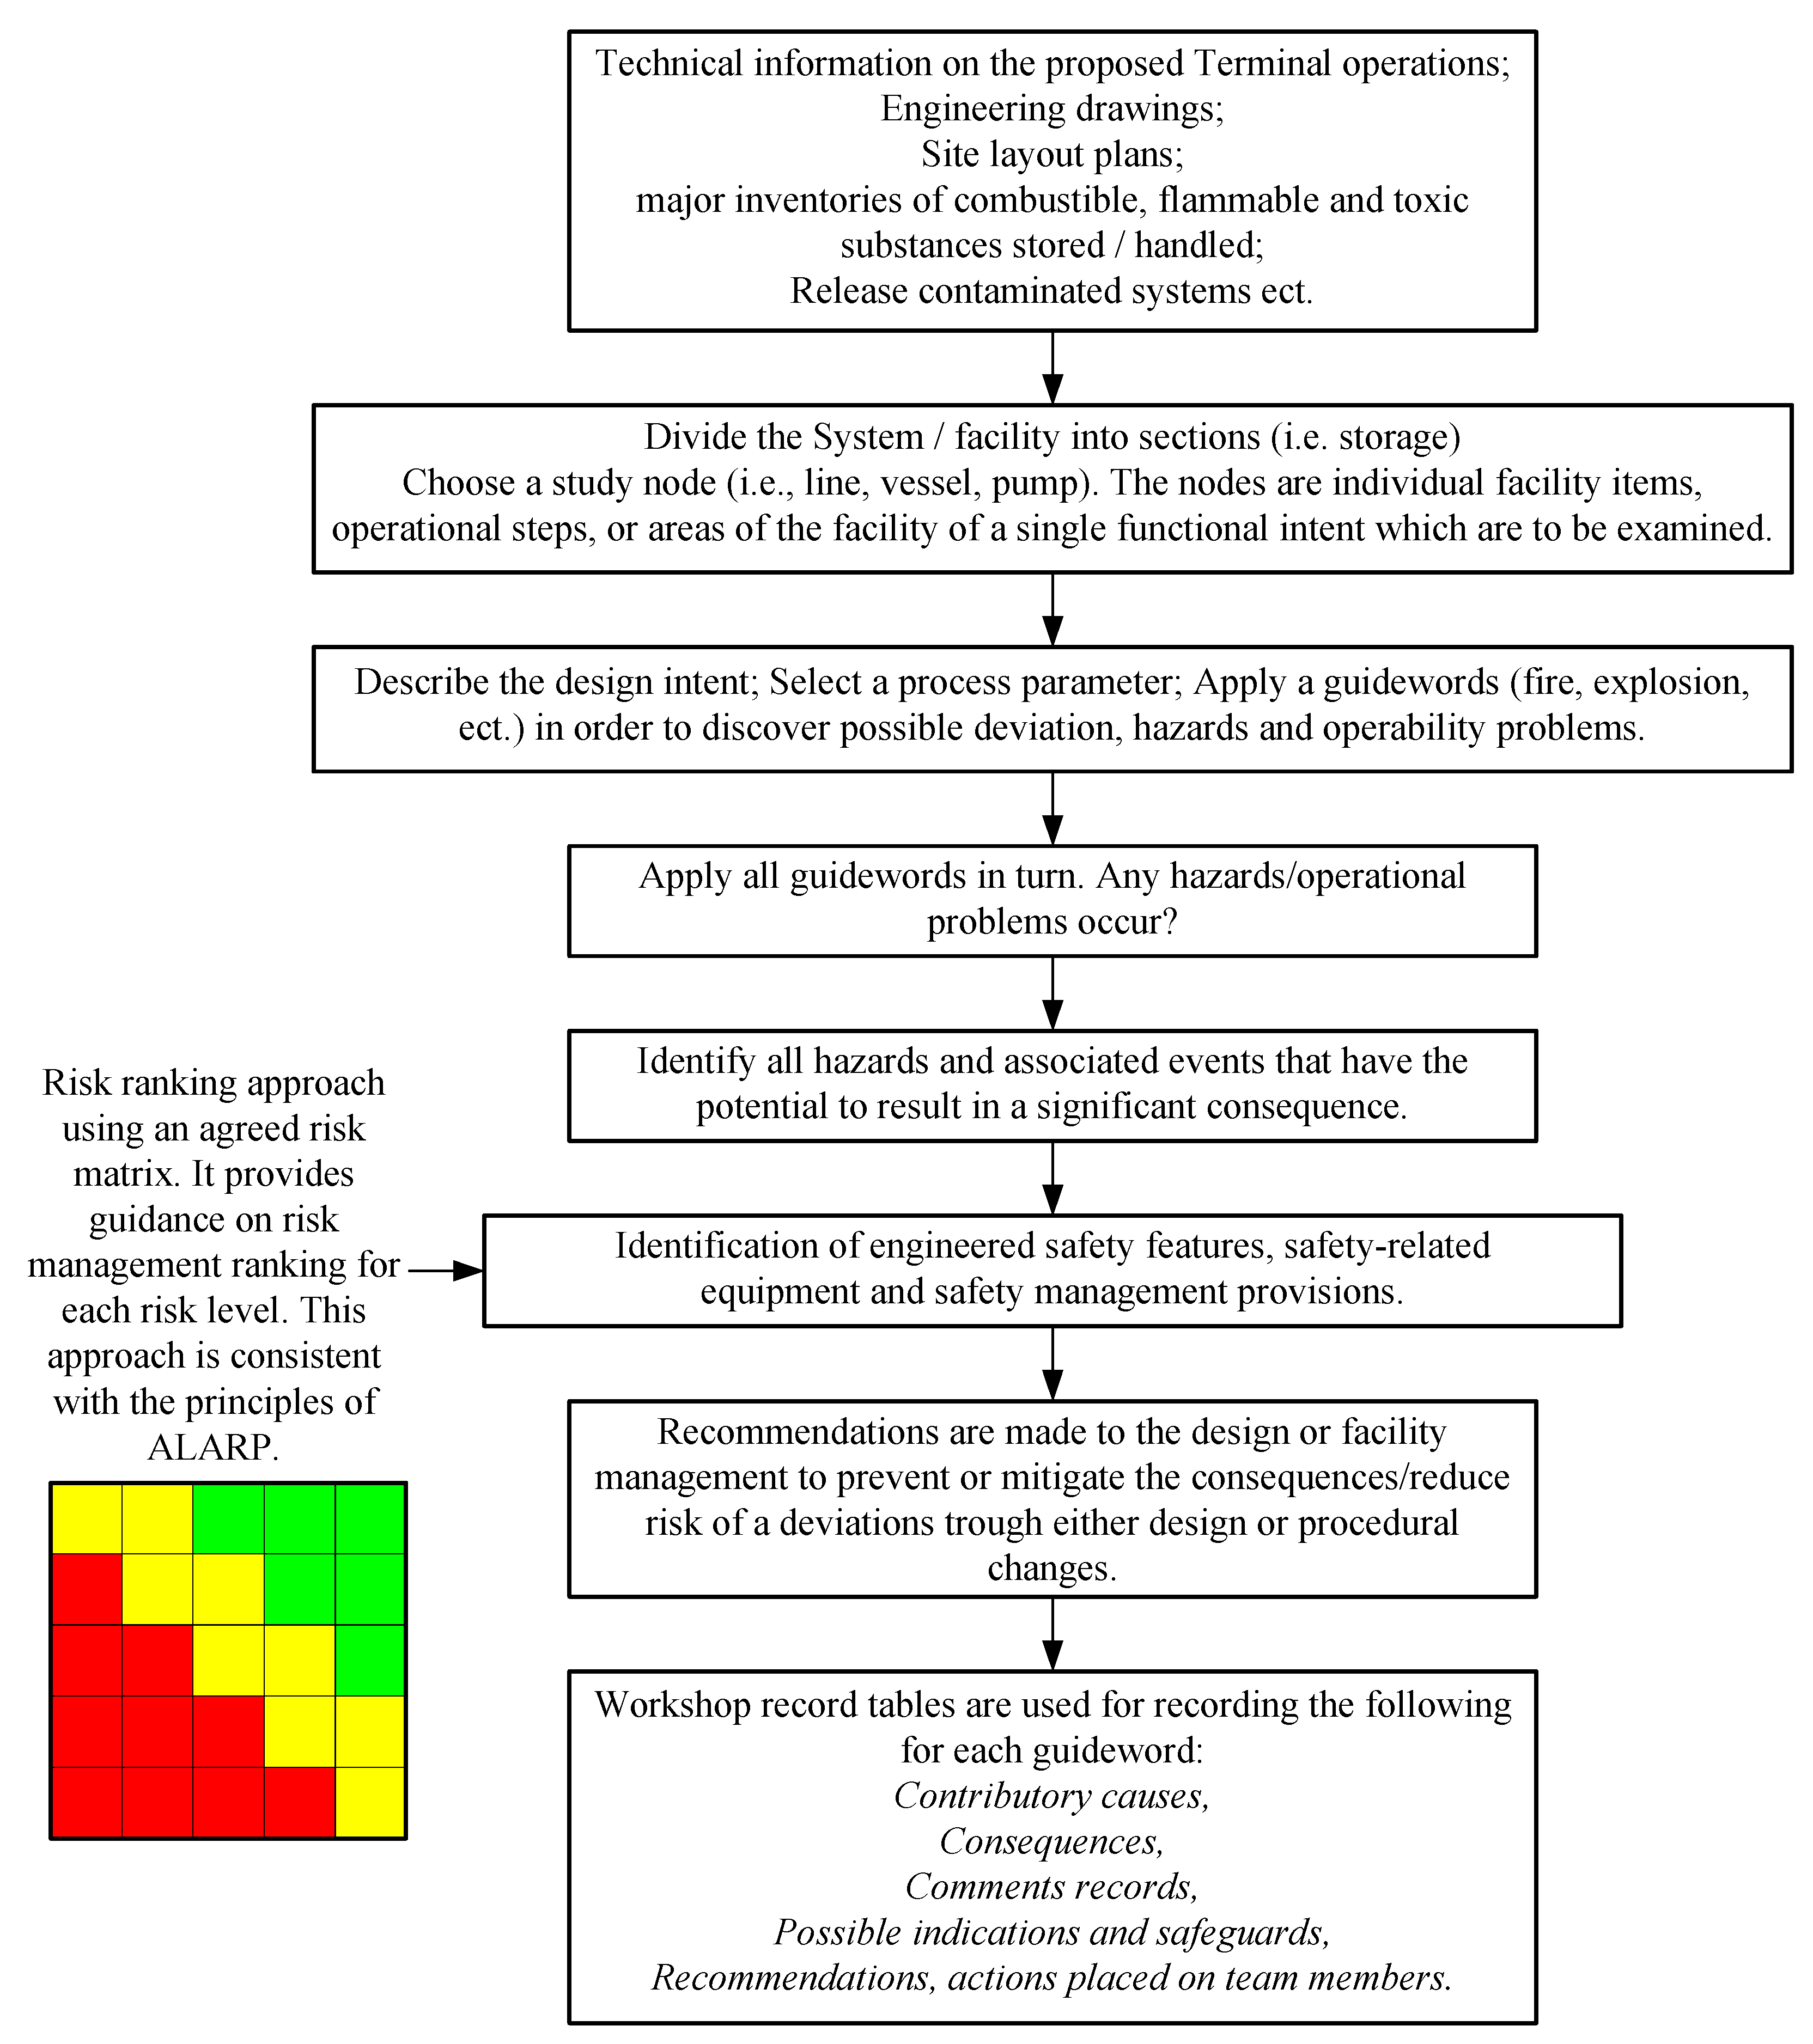
In this paper, the above-posed issues and relevant risk assessment will be considered in the aggregated risk assessment process, as described by the workflow chart (Figure 1). Steps of the risk assessment will be discussed in Section 2.1, Section 2.2, Section 2.3 and Section 2.4 separately.
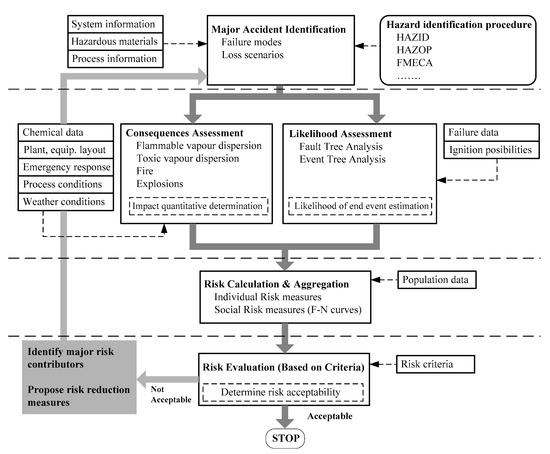
Figure 1.
Risk assessment and management workflow chart.
2.1. Hazard Identification Procedure
“Hazard identification” is the process of identifying hazards, which is the basis of the essential first step of a risk assessment. Carter Gregory and Smith Simon D. [19] emphasized that the introduction of hazard identification indices can be used as a measure of the degree of hazard identification in various projects. The guidelines [20] provide us with detailed descriptions of the various Hazard Identification Studies’ (HAZID) techniques that are used in the process industry. The guide [9] provides a summary of HAZID techniques that are available and appropriate for oil terminals. Eades et al. [10] summarized the HAZID techniques that are applicable in offshore safety cases. Naciri and Poldervaart [21] carried out their work on the modeling of LNG terminals and emphasized their design work on the HAZID conclusion. In the paper of Wadhwani, Kumar, and Singh [11], an attempt was made to review the possible hazards that exist on offshore platforms and it also suggested the safeguards necessary to take proper action to minimize them. The HAZID technique was used to identify possible existing hazards.
A methodology for risk analysis in chemical and allied industries was presented by Fuentes-Bargues et al. [13]. It is based on a combination of hazard identification techniques and a quantitative analysis of the most relevant risks through the development of both fault trees and fault tree analysis (FTA) performance. Wu and Lind [15] presented insight regarding system complexity from a perspective of hazard identification. The research highlighted the importance of understanding system complexity in the oil and gas industry.
These first steps encompass the identification of all hazardous events related to the operation of the oil storage site and that which can be detrimental to it. Many causes can lead to such events, as indicated by Chang and Lin [12], such as operational errors (e.g., oil leaks due to operational errors, drain valves left open accidentally, overfill, high inlet temperature, and vent closed during loading), maintenance errors (e.g., sparks, welding, poor grounding of soldering equipment, and circuit shortcut), tank cracks/ruptures (e.g., corrosion, high-pressure liquid from downstream vessels moving back up, poor fabrication, and poor soldering), equipment/instrument failure (e.g., thermostat failure, relief valves failure, heater failure, sunk, floating roof, level indicator, and discharge valve rupture), lightning (e.g., rim seal leaks, poor grounding, and flammable liquid leak from seal), and piping ruptures/leaks (e.g., pump leak and cut accidentally by a contractor), among others. This can be considered, i.e., how the oil and gas industry performs risk mitigation: finding and fixing errors when they occur, and exploring what factors in the work environment relate to a risk-accommodating environment [22].
Hazard identification is usually based on expert judgment in a qualitative approach. Much of hazard identification techniques are appropriate not only for the identification of hazards but they also help to perform a qualitative evaluation of hazard significance and a valuable consideration of risk reduction measures as well. The consistent sequence of procedures for the identification of potential risks and hazards is presented in Figure 2.

Figure 2.
Application process of the HAZID method.
The hazard identification process aims to identify, as far as reasonably practicable, all potential hazards and associated events of safety significance that could occur. For example, a hazard identification of an oil terminal facility may be conducted to identify potential hazards that could result from personnel (fatalities and injuries), environment (pollution and oil spills), and financial asset (e.g., production delay or loss) concerns.
2.2. Likelihood Assessment
The safety-related likelihood assessment initially covers the determination of the sources, which may cause releases, and the likelihood (probably estimate or frequency) of various releases, excluding the specific security-related issues [23]. The release risk assessment is a process of two stages that includes the probabilistic calculation of the frequency and the estimation of the likelihood of the possible severe consequences of the release. The last is usually done by performing an analysis of various scenarios and using an event tree.
The likelihood of the hazardous scenarios is estimated using failure rates and historical frequency data, which is taken from relevant industry failure databases. The likelihood of equipment failure (or of a particular section) was used to determine the likelihood of a potential release of HAZMAT from a considered isolatable system. Many items or fittings of the system can fail and it may result in a small or large release. Thus, to obtain the total failure frequency, the assessment includes a consideration of these items (e.g., pumps, valves, flanges, and fittings) and an estimation of their failure rates. The failure data of piping, storage tanks, valves, pumps, loading arms, and other relevant items were taken from available references, databases, and other sources. Mainly the following publicly available historical failure or reliability data sources were used for the assessment:
- “Reports of International Association of Oil & Gas Producers” [24,25,26,27];
- “Guidelines for Quantitative Risk Assessment (Purple Book)” CPR18E [28]; and
- “Failure Rate used for Land Use Planning Risk Assessments” [29].
The likelihood of the potential consequences resulting from the release was estimated by the appropriate event trees that were developed during the next step.
2.3. Consequences Assessment
As it is mentioned in various public sources, e.g., in [30], for each hazardous scenario, the magnitude of harm depends on the various conditions, such as release conditions, release source, chemical properties, and atmospheric conditions.
The main significant consequences for oil terminals are identified as flammable vapor dispersion, toxic vapor dispersion, fire (pool fire), and explosion. Their magnitude directly depends on the release of the amount. Thus, fluid dynamics analysis is recommended for the calculation of the actual releases of hazardous fluids and considers process parameters such as pressure, temperature, volume, flow rate as well as viscosity, and density of the fluid. The main result of the fluid dynamics analysis is the evaluation of the dynamic behavior during an accident, such as time to accumulate the significant (dangerous) amount of hazardous fluid, which can also be used later to optimize the timing of accident consequences and other risk mitigation measures.
As it was studied by Cirimello et al. [31], such an analysis could be expanded using even the most complicated CFD methods, wherein the authors showed that in the case of a large opening, a 2000 m3 storage tank of crude oil could be emptied in less than a minute, while the leak flow could pose huge loadings on the containment enclosure. However, in the case study presented in this paper, such secondary effects were not considered and since the full collapse of the storage tank was assumed, fluid dynamics calculations were not necessary for this specific scenario.
2.4. Risk Calculation and Aggregation Approach
For risk-informed decision-making, individual risk (IR) could be aggregated in various ways. This depends on the individual risk definition and the process of aggregation. We treated individual risk similarly as it was described in [32], i.e., IR is “The risk to a person in the vicinity of a hazard. This includes the nature of the injury to the individual, the likelihood of the injury occurring, and the period over which the injury might occur”.
The measure of IR could be applicable for various analyses and for the management of risk in places where at least one person could be located. IR also helps when the risk in relation to a single person is considered or when risk concerning a group of people is assessed while we aggregate the risk and have spatial knowledge, i.e., information of the location of that person or the group. IR at a certain point (x, y) might be defined by the following simple expression [32]:
where IRx,y corresponds to the probability that expresses the total IR of location-specific fatality; IRx,y,I corresponds to the IR of fatality due to incident i at location x, y; n represents the number of relevant incidents; fi represents the frequency or estimate of probability that incident i occurs; and pf,I corresponds to the probability that the fatality was caused by incident i.
There are many different risk measures; for instance, the following list represents a possible set. IR is related to “Risk Contours” or, in particular, to contours of “Location-Specific Individual Risk”, “Fatal Accident Rate”, “Total Population Average”, “Maximum for Actual Person Average”, “Risk Transect Maximum”, and “Exposed Population Average”. In addition, societal risk can be reflected by “F-N Curve”, “Aggregate Risk Curve”, “Equivalent Social Cost Index”, “Aggregate Risk Index”, and “Average Rate of Death”.
Individual and societal risk measures can be estimated to represent the risk profile of any oil terminal. In general, for each of the hazardous scenarios, these measures are calculated using the product of frequency and consequence estimates. In various public sources, as a risk, the following measures are mainly considered and presented in a specific way:
- Contours of “Location-Specific Individual Risk” (LSIR) are used to estimate injury and fatality risk. They are schematic IR reflections that represent the levels of risk at specific location points to provide so-called iso-risk contours. They are given on a risk-related graphic indicating the range of risk values for the considered place.
- Societal risk “F-N Curve” is also given as a graphical representation and is a “societal risk” measure. It reflects the possibility for various hazards or incidents to cause fatalities at different locations by plotting the estimate of probability, i.e., present “N or more fatalities” frequency (F) against the fatalities’ number (N).
The estimation of the risk, especially the measure of societal risk, requires the population distribution data. The societal risk assessment approach and even acceptance criteria can be site-specific or country-specific [33]. In any case, the following data is necessary for each place where a person or group can be present:
- Exact location;
- Timing and number of people present; and
- Information about building types and persons located indoors.
For the calculation of individual risk measures, at first, a list of the most relevant risk initiators or contributors at a specific place is identified. This enables the most significant contributors or root causes of the risk to be considered as well as the chance of most probable hazards and their most severe consequences to be determined. Then, by applying this information, risk evaluation and comparison can be performed, and recommendations can be provided. In following them, the most relevant risk reduction actions can be defined. In the ideal case, such identification of action may ensure the greatest reduction in risk, i.e., practically the most effective risk reduction outcome. Indeed, the commutation of risk and vulnerability is not applicable: “reduced vulnerability always means reduced outcome risk, but reducing the outcome risk does not always reduce vulnerability” [34]. That is why, for the decrease of the frequency of a hazardous event, they, at first, recommend modifying a system and reducing its vulnerability to the event. Conversely, Aven [35] states that risk reduction is rarely a final goal. The aim of risk analysis and management is not just to seek risk reduction but also to uncover information for decision-makers in a wider context.
Additionally, the challenge of risk aggregation first appears on the level of a single object (treat), where the problem is related to the aggregation of risks deriving from different hazard groups and different operational states. Then, the problem of risk aggregation propagates to the multi-source level (multi-facility), where it is connected to the aggregation of risks deriving from different facilities (e.g., oil terminal and LNG terminal). Different facilities might have different definitions of an undesired event and corresponding risk metrics, which could create obstacles for risk aggregation.
Finally, the aggregation of risk may represent the available information in a way that is useful for visualization and comparison with the criteria. Starting from the individual risk formalization, there is a possibility to define the approach of risk aggregation and its application. The aggregate risk index (ARI) is usually used, although it is only focused on the risk to people [36].
Additionally, the proposed extension of risk aggregation may consider an individual risk contour (IRC). The contour C is a curve with points representing the individual risk values. Usually, the contours are developed only for specific levels, i.e., orders of magnitude (for instance: 10−3, 10−4, etc.). In addition, by knowing the coordinates (x and y) of points, it is possible to estimate area A, in which the considered individual risk value is reached or exceeded.
In this case, the calculated areas for orders of magnitude of risk could be proposed for the future calculation as the aggregated individual risk measure (AIRM), which represents the individual risk (IR) area, similar to the individual risk contour (IRC). It could be quite relevant if even no population is in the vicinity of a hazardous location and could be easily used for risk reduction and decision-making if it is compared with specific limiting criteria of acceptable risks and acceptable areas AL with equal or higher risk. This is quite applicable for cases when impact or contamination (even if not affecting people) is still hazardous and may lead to huge expenses.
Having a measure of aggregated risk, such as AIRM, might be used and compared together with ARI. Taking this into account, the more common ARI might be defined as the average rate of death (ROD) from all potential incidents for the on-site people. This could be also well-fitted to the considered methodology of risk assessment. For future practical applications, ARI (fatalities per year) could be calculated by summing up the products of the calculated number of fatalities Ns due to each incident i for the site-specific group of people (employees) and the ROD (fatalities per year) for the considered incident. Then, the proposed ARI formula is as follows:
where Ni represents the number of fatalities (not limited to the site) due to incident i and Px,y represents the number of people at specific place x and y.
Proper risk aggregation could be also important for communicating the risk among stakeholders (e.g., regulatory body, utilities, and the public). In this context, the information about uncertainties is an essential part of the visualization of risk analysis results and for further steps in the decision-making process. Therefore, risk aggregation also needs to imply the proper propagation of uncertainties and should represent uncertainties in quantitative results, e.g., probabilistically. Thus, any risk assessment should be followed by an uncertainty analysis (due to the limited scope of this paper, it is not considered here and is left for future studies).
2.5. Risk Criteria and Evaluation
Oil terminals as high-level dangerous objects are controlled by Directive 2012/18 of the EU [1]. This directive ensures that the prevention of severe accidents and the reduction of consequences are considered in the policies of EU Member States. The key aspect of risk assessment is the consequence of major industrial accidents. For this purpose, by applying acceptable safety distances and similar preventive measures, it shall be necessary to maintain safe distances between dangerous facilities and persons in various buildings and transport means.
The risk of major industrial accidents from oil storage and handling facilities (oil terminals) is related to the properties of the materials, the most important of which is the flammability and formation of explosive mixtures.
As we considered for the case study in Lithuania, most of the risk criteria are based on recommendations or references to normative documents of other EU countries. Safety studies are to be prepared in accordance with the Resolution of the Government of Lithuania “On the Approval of the List of Regulations on the Prevention, Liquidation, and Investigation of Industrial Accidents and the List of Hazardous Substances and Mixtures, their Qualification Quantities and the Classification of Chemical Substances and Mixtures for Hazardous Substances” (approved by Decree No. 517 on 6 July 2015), which covers the provisions of the Seveso III Directive. Additionally, the risk assessment is a major part of a safety study.
In Lithuania, the recommendations for the preparation of the risk evaluation, which set out the minimum requirements for the safety analysis, are approved in national guidelines. These guidelines define exposure limit values for cases of fire and explosion. As in other EU countries, individual and social risk indicators should be considered to assess the risk of major accidents involving high-level dangerous objects. Dangerous doses and mortality criteria, i.e., IR or, more specifically, individual risk per annum (IRPA) can be applied to calculate the acceptable risk. In general, the risk level of 1 × 10⁻⁷ in terms of probability usually needs to be achieved.
The IRPA indicator, which is the probability of the death of a worker, considers one’s working time in the workplace over a year and sometimes the summarized potential loss of life indicator is defined as the total sum of IRPAs, considering the working time of each worker for the whole staff. Individual risks can be calculated and presented in tables for individual groups of workers and residents in defined areas per year. When estimating the risk, the number of exposed people is not relevant for IRPA. The estimates are calculated for all groups of employees and the surrounding population if they fall into individual contours of individual risk with a probability higher than 1 × 10⁻⁹.
The normative documents of the Republic of Lithuania do not establish the criteria for IRPA. However, concerning the IRPA indicator for different types of areas, the following criteria (see Table 1) are recommended by the “Health and Safety Executive” in the UK [29].

Table 1.
Criteria for the IRPA indicator.
The previously mentioned LSIR ratio and IRPA are used to identify individual risk. LSIR is considered as the probability that at a certain location, a person will be fatally injured all year-round. The LISR indicator is usually used to determine the public’s risk to the object being analyzed.
The different levels of individual risk visualized at specific locations on the map reflect the contours of individual risk, indicating different probabilities. The outline of the individual risk does not depend on the time the person is exposed.
The normative documents of the Republic of Lithuania do not specifically define the LISR criteria. For the location-specific study, well-known criteria for the public are recommended by the UK [29]. Finally, after the analysis of various criteria for the acceptable risks applicable in the EU Member States, the following LSIR values were considered (Table 2).
Table 2.
Criteria for the LSIR indicator.
Risk for society generally might be reflected as the occurrence frequency (F) that is related to the number of dead or harmed persons (N) and usually is given graphically in the F-N curve. Additionally, scenarios or initial events (incidents) to be considered in the risk analysis can be specified as having a specific frequency (f) and an event-caused consequence. Initially, the frequency (F) with the upper case was used to indicate the total frequency, i.e., this reflects the sum of the frequencies of all the hazardous events that might lead to N (number of casualties) or more fatalities.
Guidance on the preparation of risk evaluation for hazardous facilities provides the recommended contours of acceptable social risk (Figure 3). The quantitative risk assessment uses the criteria for distinguishing the ALARP zone. The assessment of social risk identifies unacceptable, ALARP, and non-significant or broadly acceptable social risk areas.
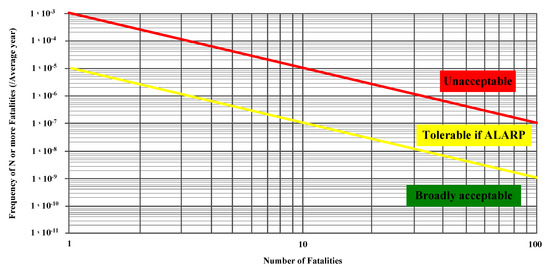
Figure 3.
Social risk criteria for the F-N curve.
Tolerability and acceptability of the estimated risk are evaluated by comparison with a relevant risk criterion or safety goal. In various public sources, the criteria reflect the risk zones:
- Unacceptable, defined above the “unacceptable” risk-level or margin, where the total risk is considered as too high, even if there is no issue meeting IR criteria;
- “As low as reasonably practicable” (ALARP) level, the zone in which the activities should reduce the risk as far as practical for the minimal or “negligible” risk level (for instance, demonstrating that risk is reasonably decreased to a level as low as practicable); and
- Broadly acceptable, meaning that it is below the “broadly acceptable” risk zone which reflects that the societal risk is considered as insignificant, while all individual risk criteria are met as well.
3. Case Study and Results
3.1. Brief Description of the KN Oil Terminal
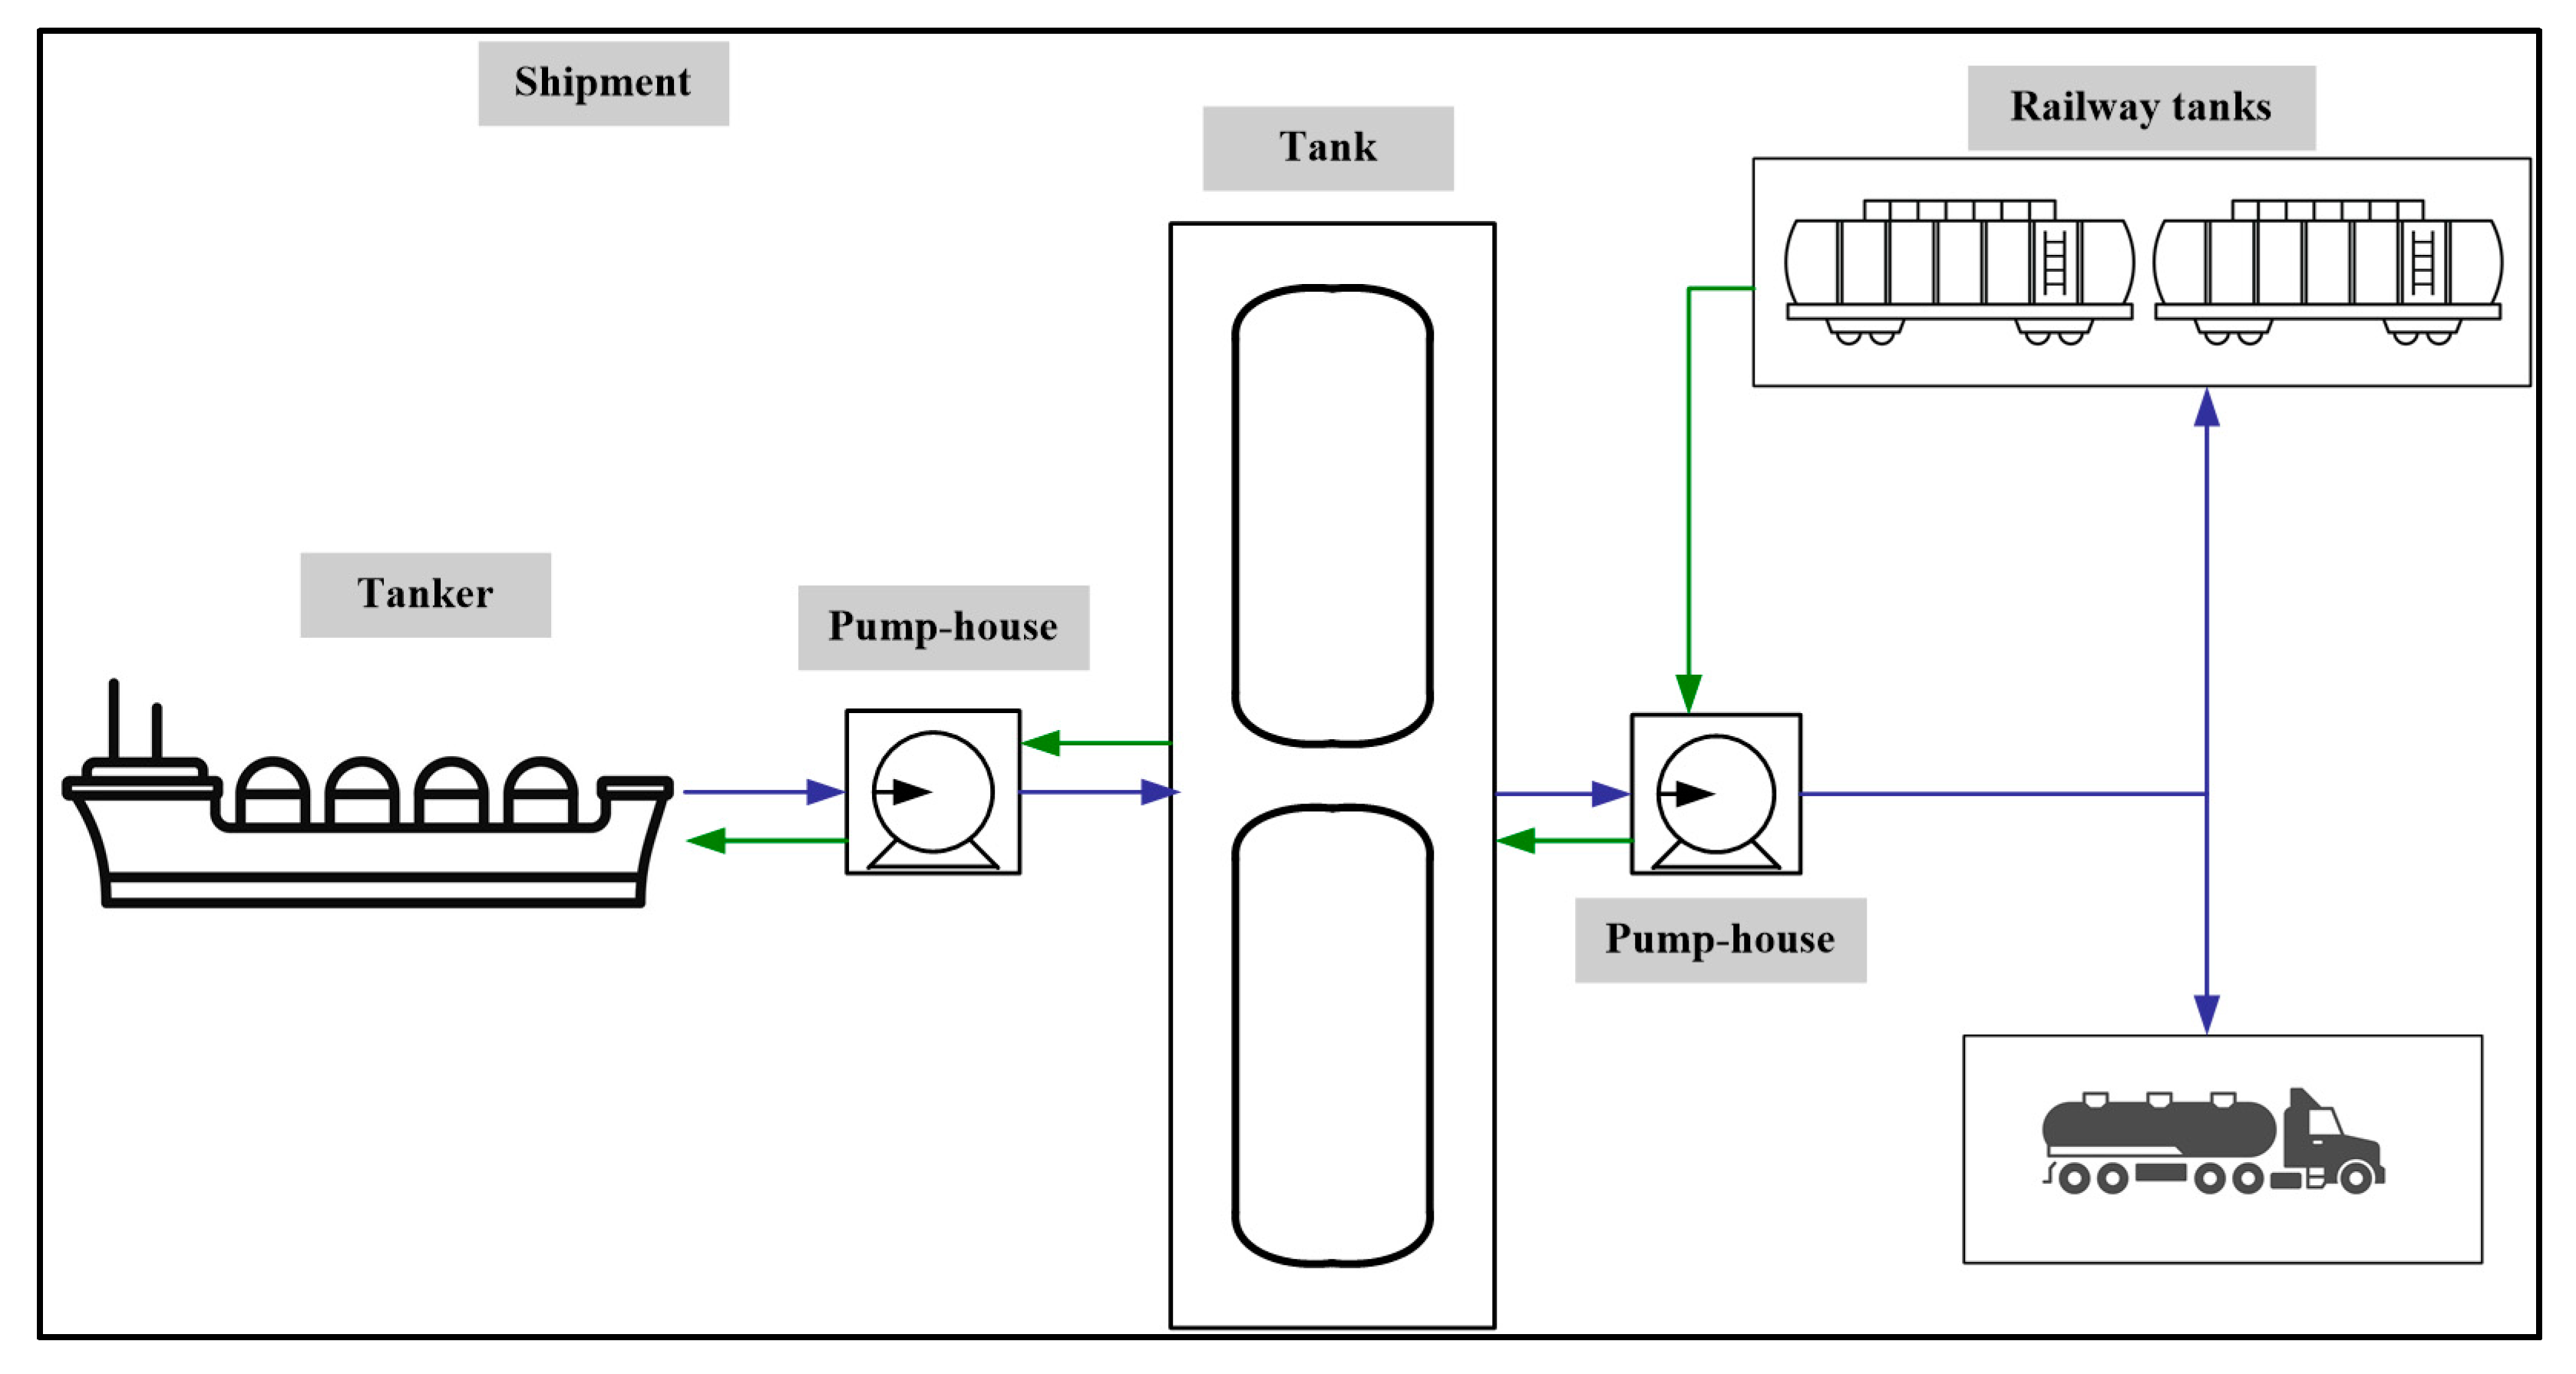
The purpose of the Lithuanian state-owned oil product terminal “Klaipedos Nafta AB” (KN) is to handle and import oil products and liquefied natural gas (LNG). It is in the territory of Klaipeda Seaport. The company handles light and dark oil products (fuel oil, diesel, aviation fuel, gasoline, and others), as well as provides the discharge of crude oil products from railway tanks into tankers, and oil products from tankers into railway tanks. The storage of crude oil and oil products, alongside the discharge of gasoline and diesel fuel for the Lithuanian market, from tankers to tank trucks, are provided in KN oil storage tank parks.
The design capacity of the Klaipeda oil terminal is 7.1 million tons of oil and oil products per year, while the total capacity of oil and oil product storage facilities (30 tanks in total) is 450,000 cubic meters. The company also owns the LNG terminal in Klaipeda. The only function of the LNG terminal is to receive LNG in the LNG storage and regasification unit, to perform regasification, and to supply to the main natural gas pipelines in Lithuania using a high-pressure gas interconnector.
A brief scheme of the operations at the KN oil terminal is presented in Figure 4.
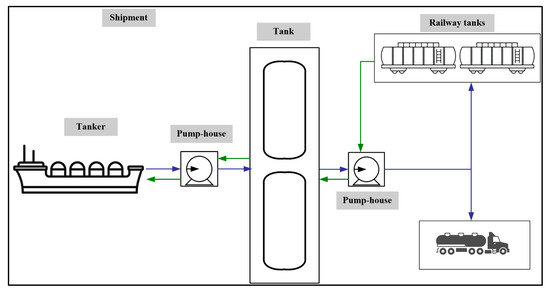
Figure 4.
Scheme of the operations at the KN oil terminal.
3.2. Identification of Hazards at the KN Oil Terminal
The hazards identification process covers data collection, identification of areas and terminal nodes, and determination of risk degree.
Data collection. Data regarding the terminal and hazards possibly occurring at the site were taken from technical information and engineering drawings; area plans; descriptions about population densities and surrounding land; major inventories of stored dangerous substances; systems/strategies of release detection/isolation; and release containment systems.
Identification of areas and nodes. For the identification of areas and nodes, the segmentation of the oil terminal’s area was done to facilitate the identification of hazards and to consistently go through the whole technological process. The whole plant was subdivided to an extent that allows for the identification and definition of individual process steps that are linked to both equipment and a limited number of lines connected to it. The equipment and infrastructure of the KN oil terminal were divided into 26 nodes/areas of existing and designed oil storage tanks, pumping stations, railroad tracks and truck loading platforms, pump station discharge lines, etc. As different materials are loaded and stored, the HAZID procedure discusses all possible variants of specific nodes.
Determination of risk degree. The degree of risk was assessed for each potential hazard according to the risk matrix (Table 3). The probability or frequency of an event was defined according to Table 4.
Table 3.
Criteria for the IRPA indicator.
Table 4.
Risk level definition and relevant actions.
In the HAZID procedure of the KN oil terminal facilities, a conservative approach of assessment was adopted without separating the pipelines into sections, regardless of the valves installed in the pipelines, and considering that the leaks from the systems covered the entire volume. A relatively short maximum pipeline length of 1443 m makes it possible to adopt a conservative method of assessment without significantly reducing the volume of leakage and unreasonably increasing the risk of installation. The conservative approach also was selected based on the capabilities of the quantitative risk assessment software to optimize the number of scenarios selected for quantitative evaluation. Keywords (e.g., pool fire and fireball) were used to describe risks and the hazardous events associated with them. Situations that may lead to initiating events are identified in Table 5.
Table 5.
Identification of possible initiating events.
HAZID procedure results. The HAZID procedure did not reveal unacceptable risk events. For further assessment, all medium-risk events were selected and 132 event trees of possible accident scenarios were developed. The results of the HAZID were carried forward for use in subsequent safety studies, notably the quantitative risk assessment (QRA), and for proving that risk is managed to be as low as reasonably practicable.
The potential accidents concerning the HAZID results. Possible hazard scenarios that fell into the ALARP zone were selected for risk analysis. The risk analysis was carried out in two stages: an initial analysis of consequences and the quantitative risk assessment. The following sequence of analysis had been selected for the quantitative risk analysis:
- Identification of hazards posed by hazardous materials stored at the KN terminal;
- Initial analysis of the consequences/determination of the possible impact zones with the maximum amount of hazardous substance spillage;
- Assessment of the hazardousness of the substances and evaluation of their consequences in the initial analysis (to distinguish the most hazardous substance);
- Combining similar initial events and identifying the most dangerous material for the quantitative analysis; and
- Quantitative risk assessment for the selected hazardous substance scenarios.
During the preparation for the QRA of the KN oil terminal, the ignition probability was calculated following the IOGP publication, i.e., the “International Association of Oil and Gas Producers” [27], and the HSE publication, i.e., the “Health and Safety Executive” [29], while considering the leakage rate in each scenario. The correlation function allows the ignition probability to be determined for a specific leakage scenario following the provided local characteristics and rates of the leakage place. Depending on data, the likelihood of the consequences was estimated for different holes’ sizes and ignition times.
3.3. Hazardous Scenario Development
For the representation of the potential consequences and failures, a set of scenarios was developed. First, the full range of potential failure modes for pumps, storage tanks, and related internal pipelines was considered. These failure modes were related to different releases and holes’ sizes (five sizes were selected at a maximum). The identified scenarios represent the spill or release of combustible or flammable liquids, which may cause a fire when ignited. Then, considering the material properties and transfer alternatives, these scenarios were investigated using QRA.
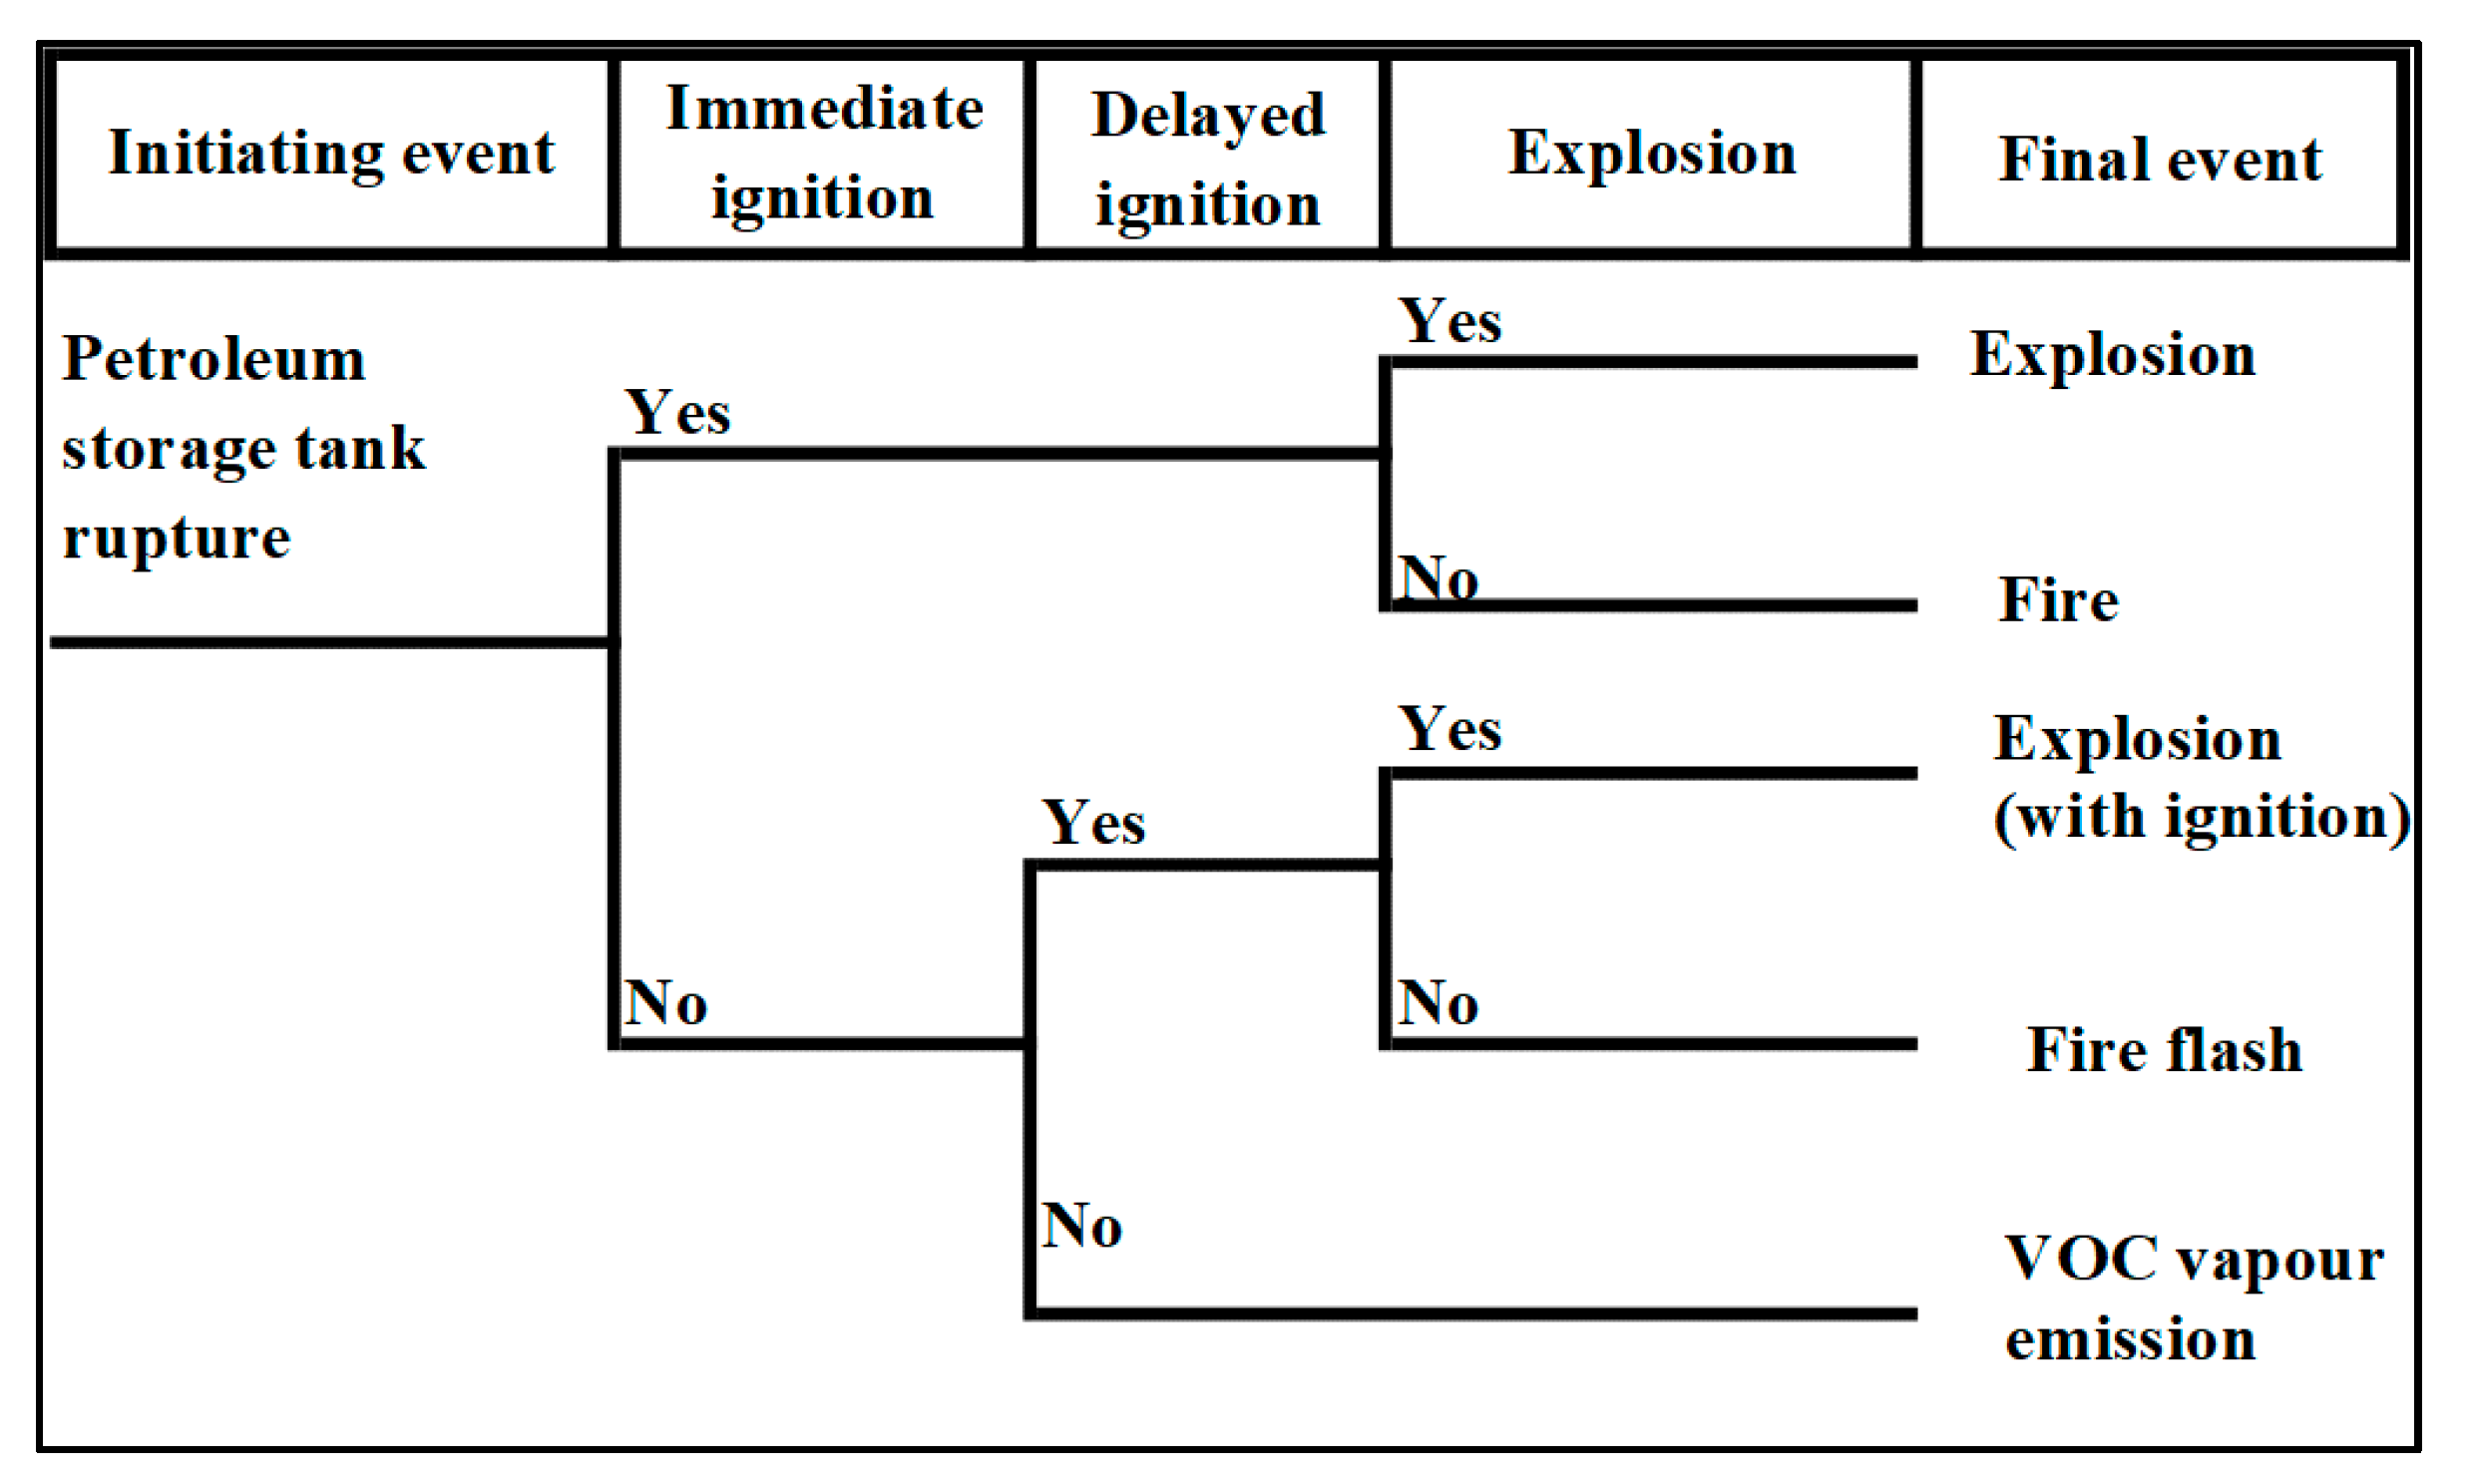
Leak detection, inventory, isolation strategies, and other factors (for non-conservative cases) were considered to define the quantities of hazardous materials from the release. Concerning each potential release scenario and due to particularities of the initiating events (related to a different node, hole size with the related amount of released hazardous substance, and the kind of hazard substance), finally, 136, event tree models were developed. As an example, an event tree associated with the petroleum storage tank rupture is presented in Figure 5.
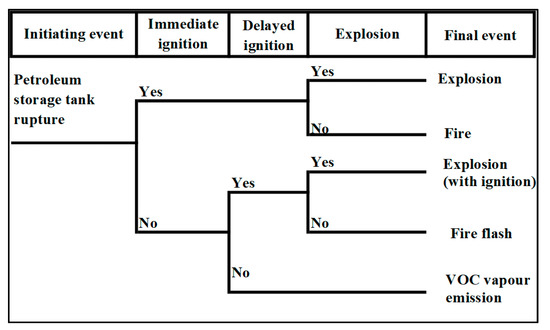
Figure 5.
Scenario development of an accident initiated by storage tank rupture.
For the quantitative risk assessment, the analyzed scenarios were combined following the hazards identified in the HAZID procedure, as well as following the hazardousness of the substances and their hazardous areas of exposure. The scenarios having the potential to result in major accidents and the scenarios being classified as of medium risk, were combined in each node. Certainly, scenarios where crude oil and gasoline were involved led to cases of large areas being affected.
The initial analysis of the severity of consequences was performed using the ALOHA software (affected areas of fires and explosions) following the following assumptions:
- The most adverse meteorological conditions (wind speed of 1 m/s) are accepted;
- The instantaneous spill of the substance is kept in the storage tank;
- The vaporization time until the spray surface is covered with foam is defined as 1 h (3600 s);
- The influence of the wind direction is not considered to obtain the thermal impact zone of a fire and fireball;
- An explosion is possible anywhere in the area where a hazardous concentration is reached;
- The explosive (flammable) mixtures can be formed by all stored materials; and
- IDLH (immediately dangerous to life or health) concentrations and relevant exceedance areas are calculated using a model for heavy gas dispersion.
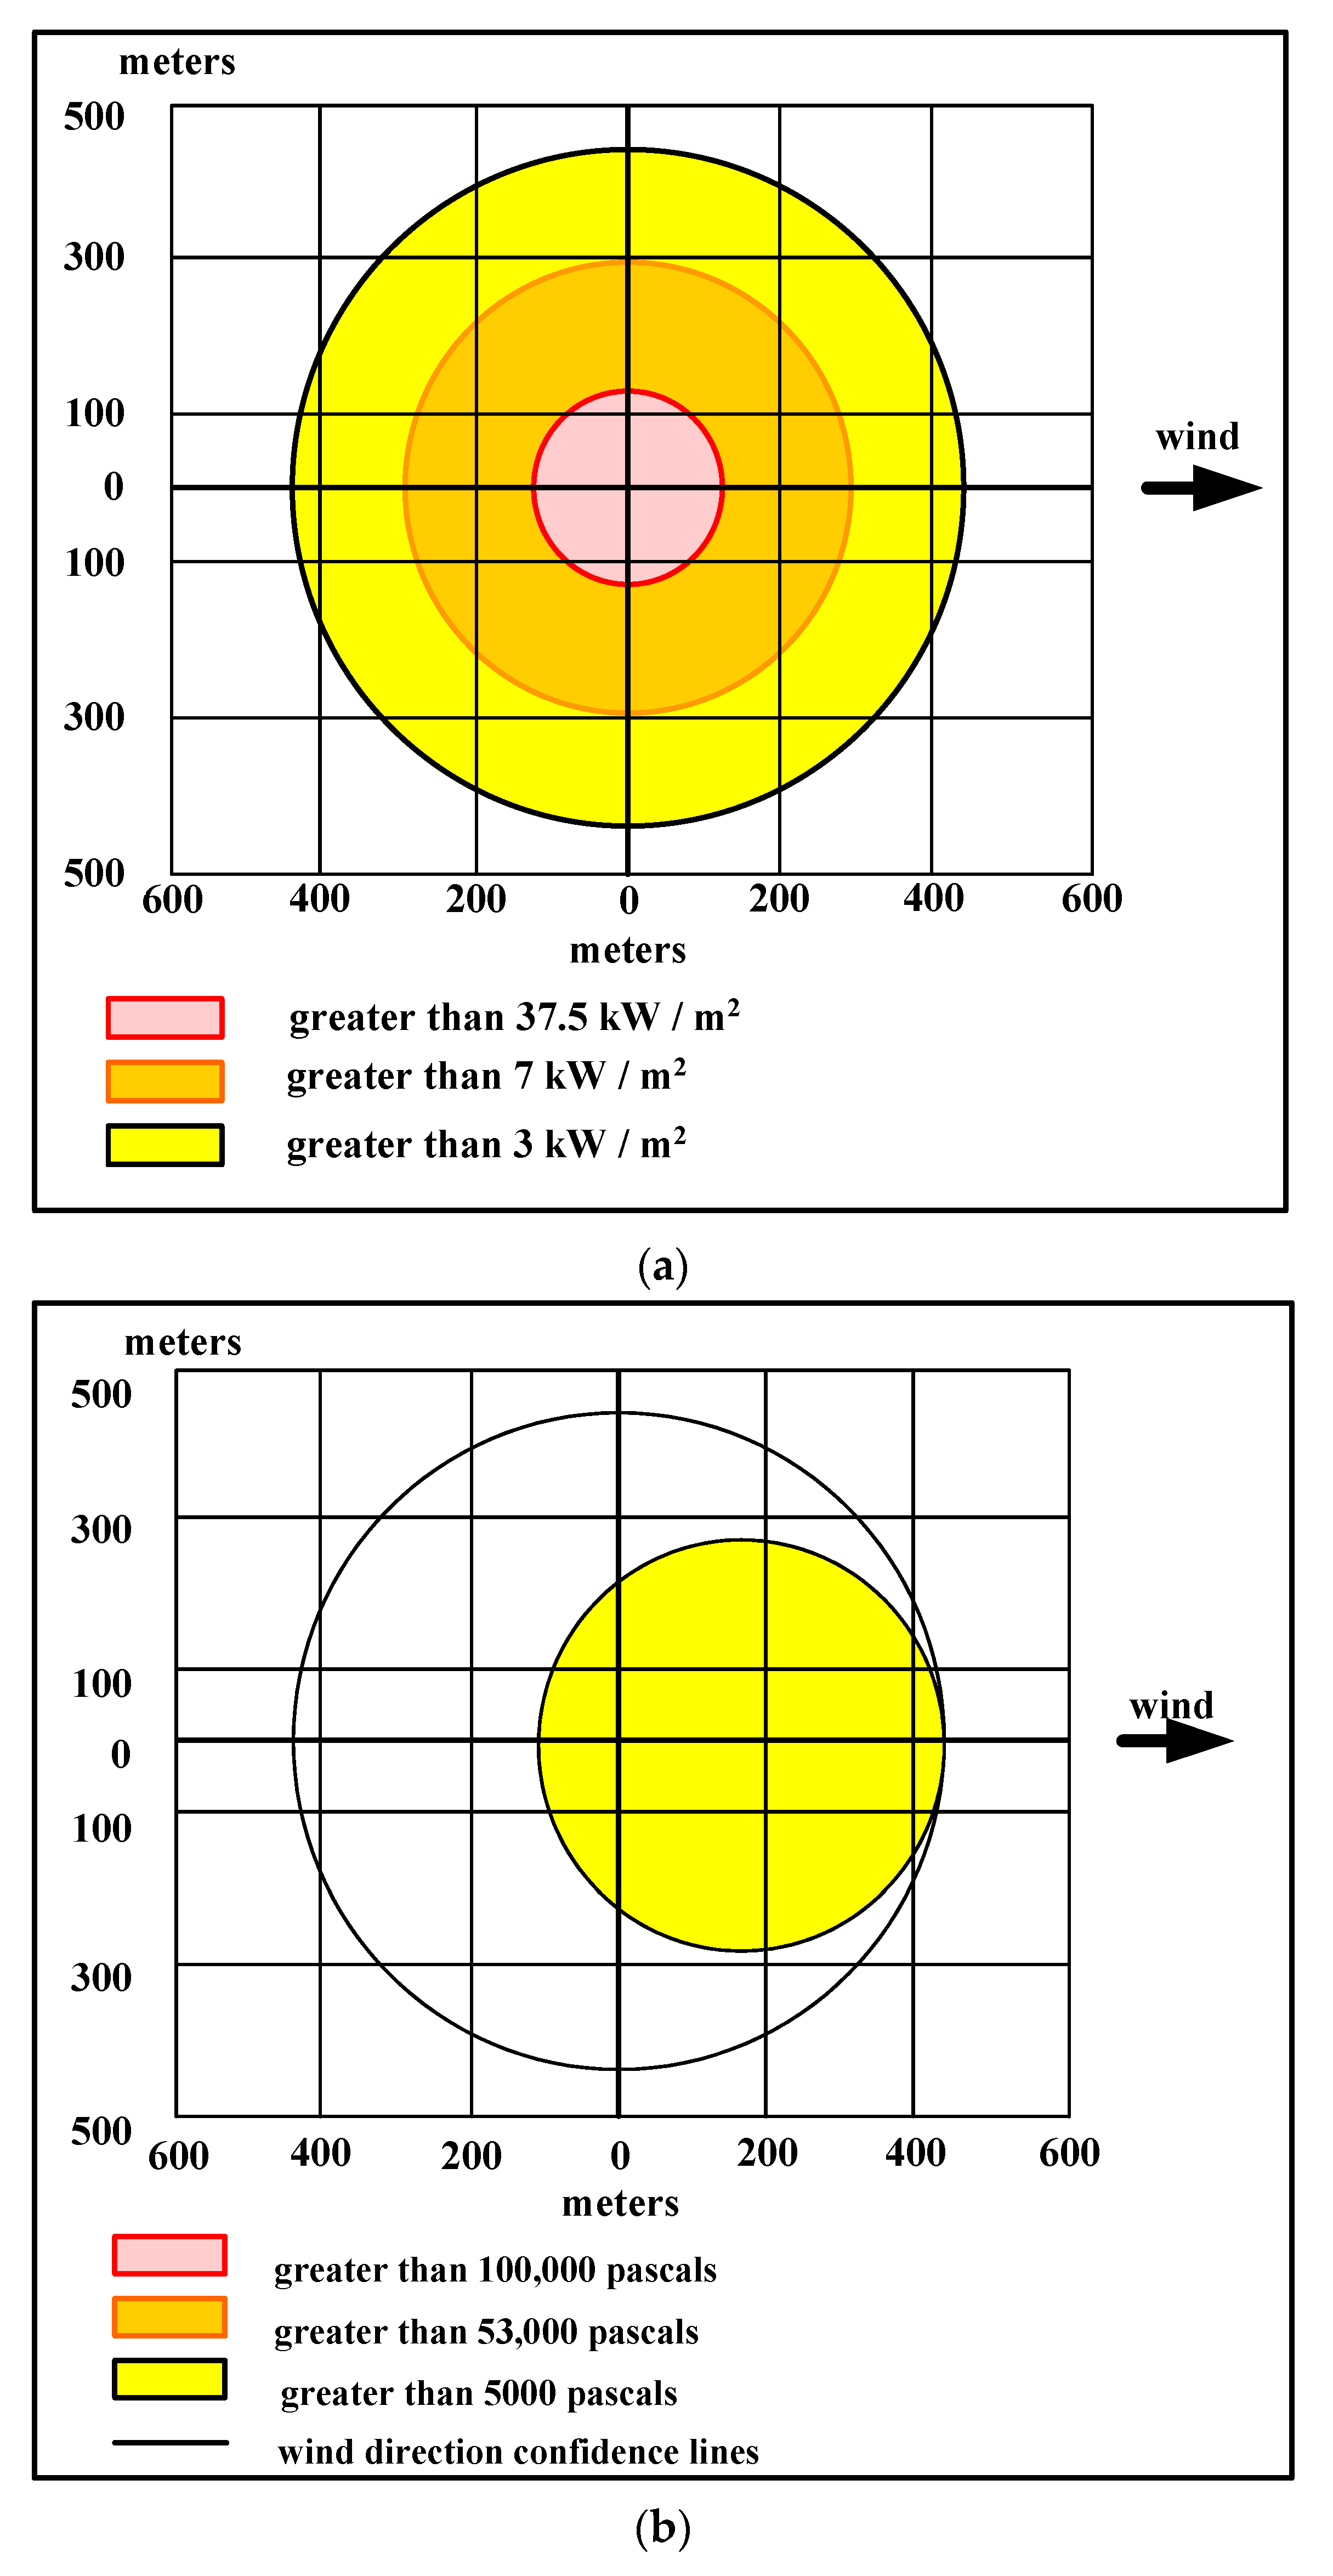
Some results of the performed calculations using ALOHA software are presented in Figure 6, while determining areas of the maximum effect are indicated in Table 6.
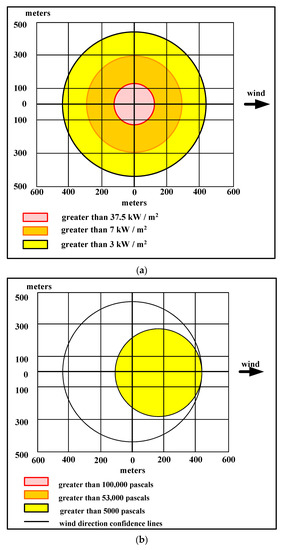
Figure 6.
Affected areas of fires (a) and explosions (b) in the case of the release of petroleum.
Table 6.
Areas of the maximum effect.
The possibility of cascading accidents in a particular scenario is assessed by comparing the intensity of the impact of explosion, pool fire, and fireball (leading to boiling liquid, expanding vapor explosion) at adjacent facilities, equipment, or tanks. It is assumed that a cascading accident is possible if the relevant impact values exceed the thresholds; the results are presented in Table 7. These results (Table 6 and Table 7) were used for the estimation of IR and social risk.
Table 7.
Cascading accidents.
3.4. Assessment Results Interpretation
The hazard analysis examined major scenarios that reflected the loss of the containment of combustible or flammable material. In the study, various hazardous materials (HAZMATs) that might be accidentally released from storage tanks, including devices such as pumps, and the associated pipelines were considered. The QRA helped to determine the possibility that released HAZMATs could be ignitable and, for instance, could result in a so-called pool fire. In this study, the estimate of probability, i.e., the frequency and possible hazardous consequences, were also estimated by applying the QRA. To map the on-site and off-site risks, mainly two measures were considered:
- LSIR contours, i.e., an estimate of the individual risk; and
- The F-N curve as an estimate of the societal risk.
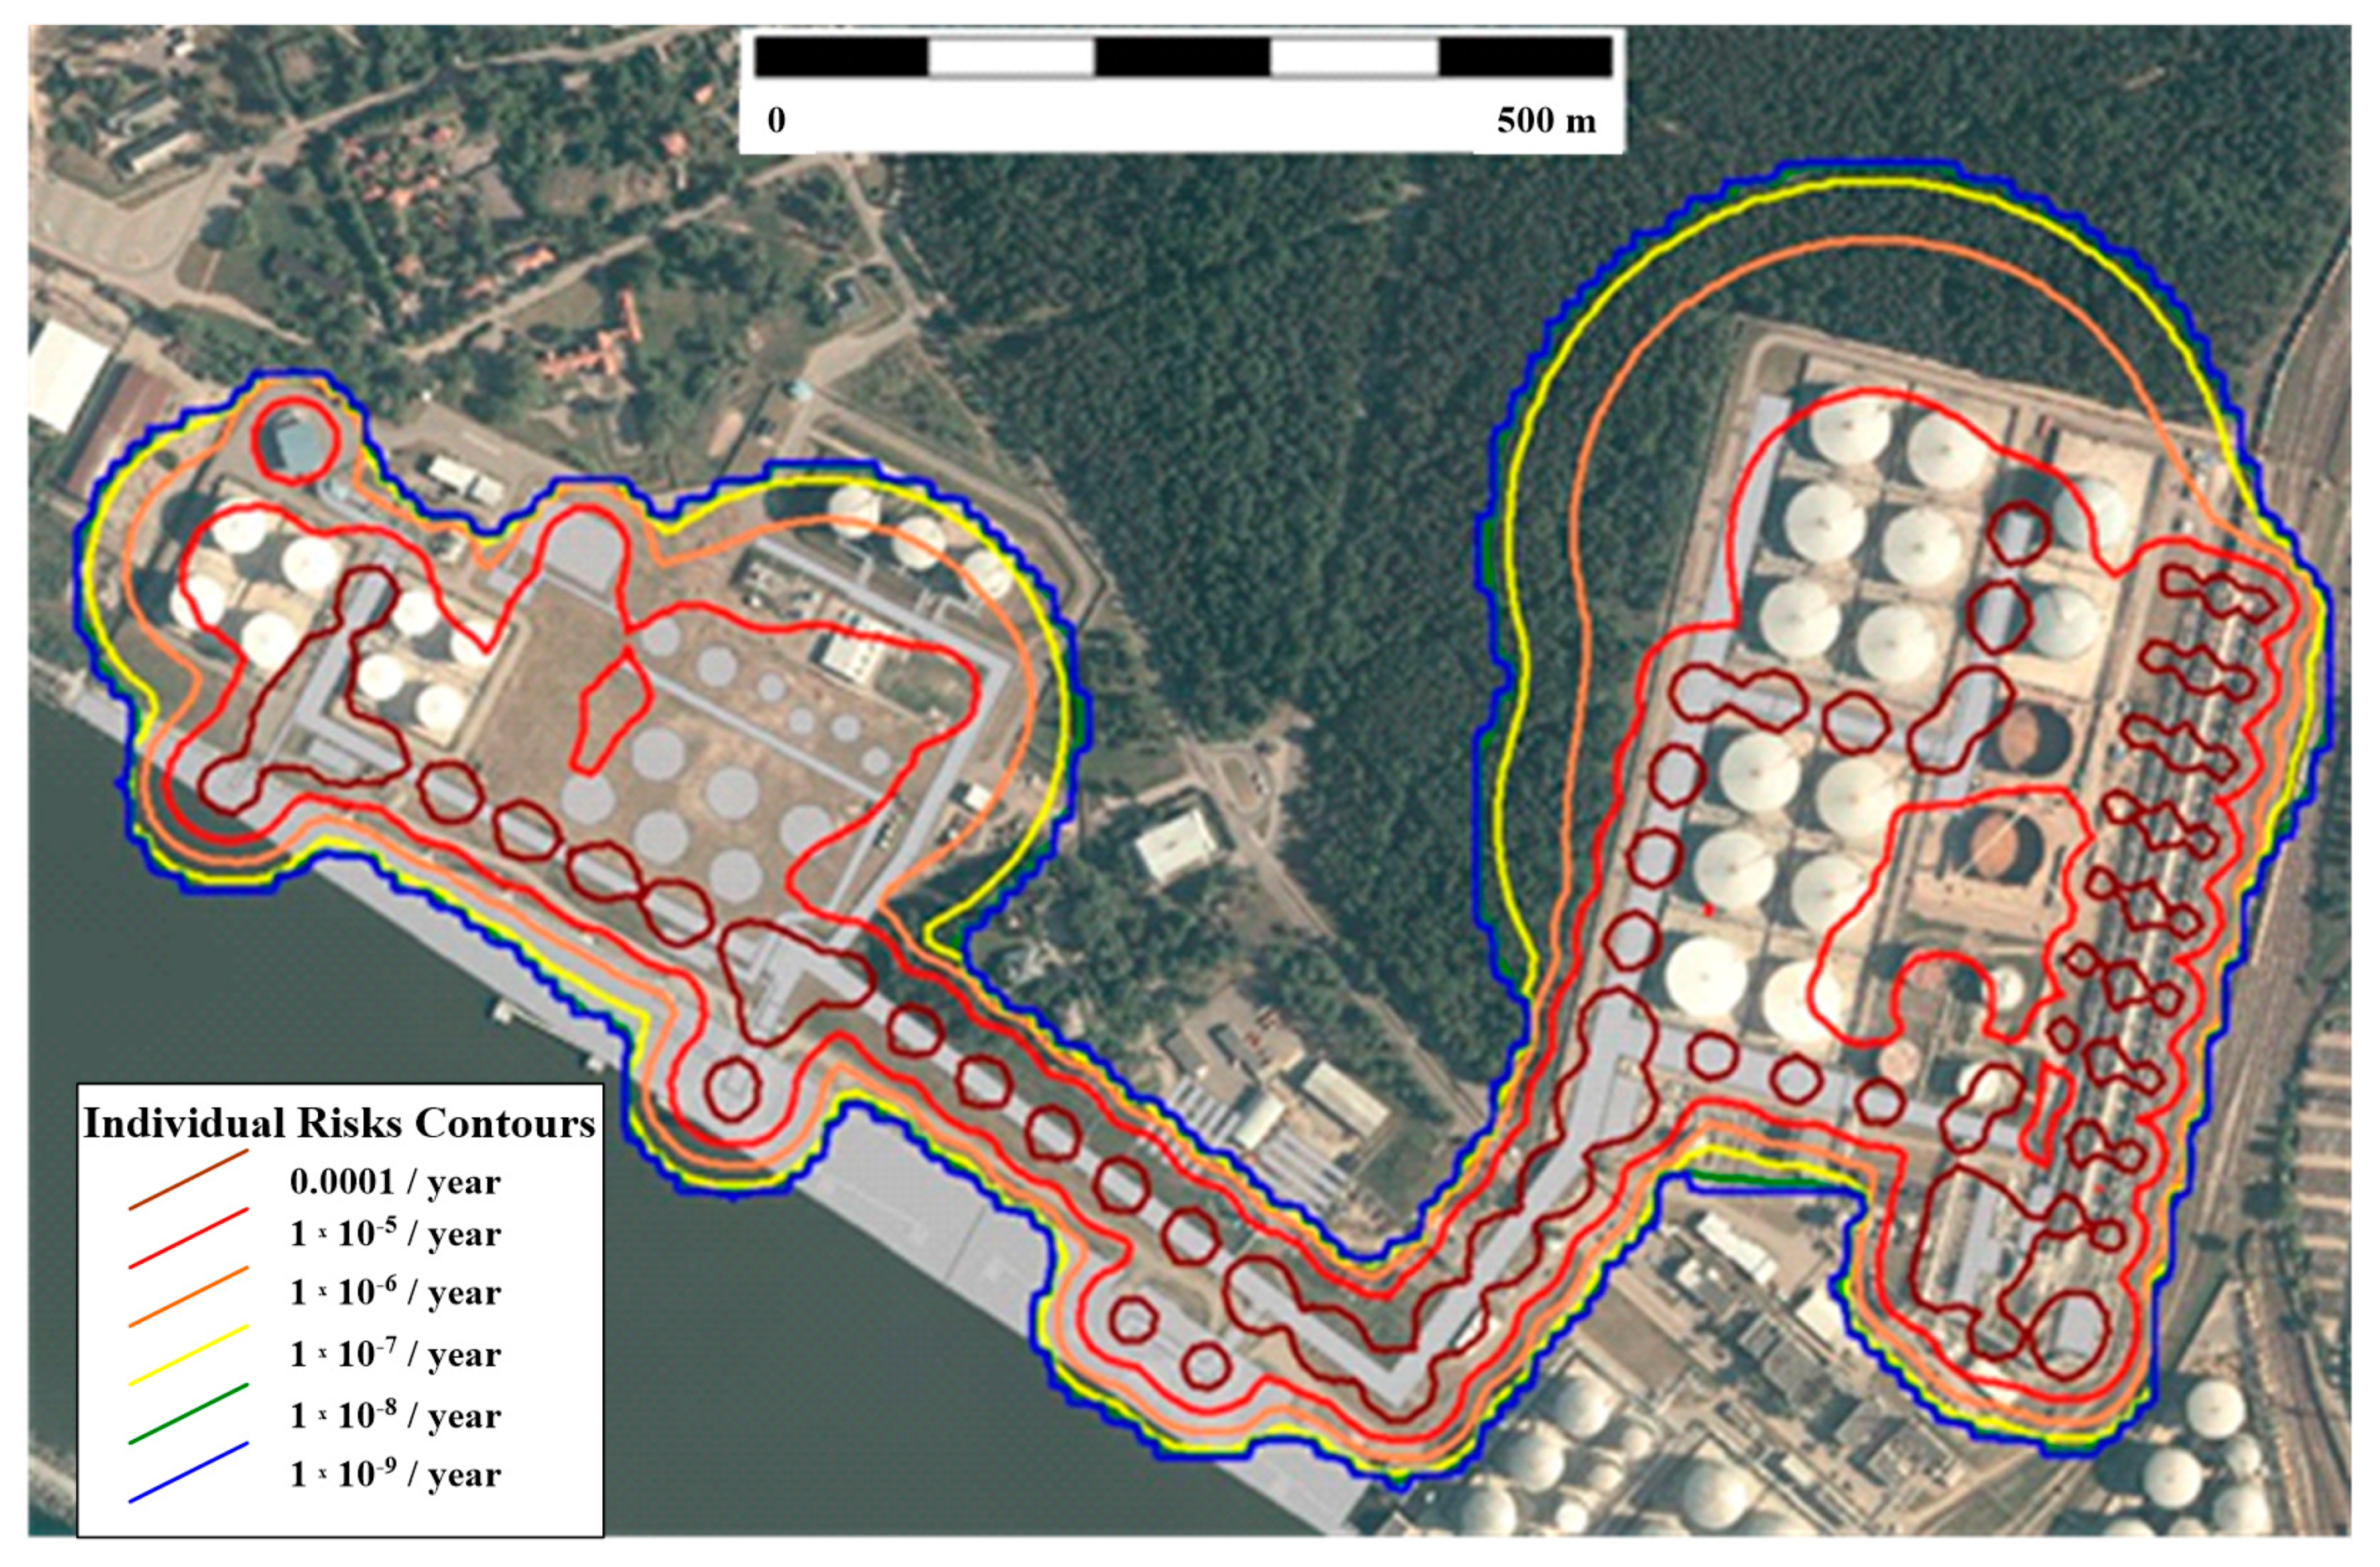
The analysis of the individual risk contours (see Figure 7) using site-specific information, i.e., the location-specific individual risk ratio, showed that the individual risks arising from the considered economic activity in the territory of the KN oil terminal varies within the limits of 1 × 10⁻⁹–1 × 10⁻⁴ in a particular zone and is not in the unacceptable zone (see Table 1). The individual risk outside the territory of the KN oil terminal also varies within the limits of 1 × 10⁻⁹–2.5 × 10⁻⁴ (close to the industrial areas) and is in the tolerable (ALARP) zone.
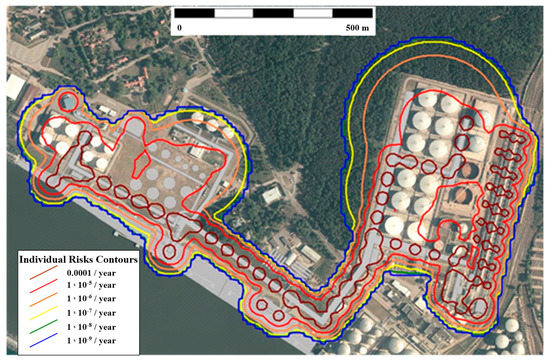
Figure 7.
Individual risk contours for the KN oil terminal (using TNO’s advanced risk-curves 9.0.26. software for QRA from the petrochemical industry).
Calculations according to the individual risk per annum showed that the individual risks to the employees of the KN oil terminal and nearby facilities are acceptable. Tanker drivers, who control the filling of tanks, as well as company employees and service personnel, who carry out the maintenance, servicing, and repairing of technological equipment, fell into the ALARP zone. The risk to these employees was acceptable by applying risk mitigation measures to reach a reasonably acceptable level. Individual risks for residents of the nearest residential areas were insignificant (<1 × 10⁻⁹ per year).
The estimated F-N curve, representing societal risk, reflected the possible risk exposure on the staff and on the off-site population as well. The acceptability and tolerability of the risk on the off-site population were assessed using the approved recommendations and relevant criteria. While staff works near the facilities in many cases, the social risk may just exceed the limit of the broadly acceptable risk, while the risk to personnel was assessed in the range of the tolerable ALARP zone. The measure of societal risk was evaluated against the criteria, which is reflected in Figure 8 (presents the F-N curve, calculated for the western part of the terminal and is associated with the maximum social risk from all KN parts).
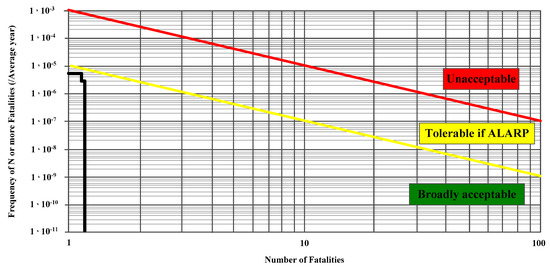
Figure 8.
Social risk criteria and the F-N curve estimate for the western part of the KN oil terminal.
In the considered case, the obtained results reveal that the F-N curve (black line in Figure 8) does not belong to the “Unacceptable” zone. Thus, the societal risk is evaluated as acceptable and also the analysis demonstrates that other criteria (including individual risk) are maintained. As presented in Section 2.5, the criteria (relevant for fatality and injury) of individual risk are met. Thus, in this case, according to criteria definitions, the risk was considered to be tolerable or acceptable.
3.5. Practical Actions and Recommendations
The ALARP principle is applied to the KN oil terminal for all risks arising from the operation of new and existing facilities. There are measures to prevent accidents, reduce risks, and protect both workers and the public (i.e., technical solutions for safety equipment, buildings, and structures; personal protective equipment; rules and technical regulations for technological equipment and work in hazardous areas; isolation of hazardous areas; rules for work with dangerous substances; etc.). Emergency response tools are used to mitigate accidents (firefighting equipment and equipment, preparation of emergency plans, training and preparation of employees, etc.). To gain acceptance for a decision, it is more practical to limit the consequences than to reduce the probabilities.
The company provides and implements the necessary design as well as the organizational and technological measures for the prevention of major accidents; provides necessary emergency measures and fire-fighting measures; and has installed firefighting water supplies and firefighting accesses at each berth at the Kursiu (Curonian) Lagoon. The measures implemented to meet the requirements of normative documents are sufficient for mitigating the prevention of accidents and their consequences.
4. Conclusions
This paper was aimed at presenting the comprehensive risk assessment methodology applicable to oil terminals. Additionally, the particular hazard identification study, its contribution to the quantitative risk assessment, the risk aggregation approach via various risk measures, and the risk evaluation criteria to be used in practice have been discussed in detail.
A case study of risk assessment for an oil product terminal owned by “Klaipedos Nafta AB” (in Lithuania) was presented as a practical example of the methodology application. Societal and individual risk measures were assessed by obtaining the F-N curve and the location-specific individual risk contours. The obtained results revealed that the values of both measures fall to acceptable regions of individual and societal risks. It is necessary to note that the quantitative risk assessment carried out at an early stage of the design allows for avoiding the risk of exposure to the surrounding communities at the lowest cost. This should be understood in a wide sense in that this applies not only to newly constructed oil terminals but also to the introduction of new terminal activities. The risk assessment at an early stage of the project allows for efficient risk reduction. In such a way, the KN oil terminal possesses sufficient material resources and equipment to prevent big accidents, as well as to react and mitigate the consequences.
Based on the worldwide industrial practice and the relevant methodology, the aggregated risk assessment for the oil terminal is a positive example which illustrates that the risk of major accidents can be managed and acceptably decreased. This can be achieved by regularly monitoring technological operations that pose risks of possibly big accidents, as well as by collecting, aggregating, generalizing, discussing the details of such operations, and applying risk mitigation measures.
Author Contributions
Conceptualization, F.A., L.M., J.A., S.R. and R.A.; methodology, R.A., R.K., J.A., I.S., M.V. (Mindaugas Vaisnoras) and E.B.; software, F.A. and T.I.; validation, F.A., R.K., I.S. and R.A.; formal analysis, I.S., R.K., M.V. (Mindaugas Valincius), E.B., T.I. and R.A.; investigation, all authors; resources, F.A., L.M. and R.A.; data curation, I.S., R.K., M.V. (Mindaugas Valincius), T.I., F.A. and R.A.; writing—original draft preparation, R.A., R.K., I.S., M.V. (Mindaugas Vaisnoras), M.V. (Mindaugas Valincius), E.B. and T.I.; writing—review and editing, R.A., R.K., I.S., M.V. (Mindaugas Vaisnoras), E.B. and S.R.; visualization, E.B., I.S. and T.I.; supervision, S.R., J.A., R.A., R.K., I.S., M.V. (Mindaugas Vaisnoras) and E.B.; project administration, R.A., S.R., F.A. and E.B.; funding acquisition, S.R. and R.A. All authors have read and agreed to the published version of the manuscript.
Funding
This research received no external funding.
Institutional Review Board Statement
Not applicable.
Informed Consent Statement
Not applicable.
Data Availability Statement
Not applicable.
Conflicts of Interest
The authors declare no conflict of interest.
Abbreviations
| AICE | American Institute of Chemical Engineers |
| AIRM | aggregated individual risk measure |
| ALARP | as low as reasonably practicable |
| ARI | aggregate risk index |
| IR | individual risk |
| IRC | individual risk contour |
| IRPA | individual risk per annum |
| EU | European Union |
| HAZID | HAZard IDentification Study |
| HAZMAT | HAZardous MATerial |
| HAZOP | HAZard and OPerability Study |
| KN | Klaipedos Nafta AB |
| LNG | liquefied natural gas |
| LSIR | location-specific individual risk |
| ROD | rate of death |
| QRA | quantitative risk assessment |
References
- EU. Directive Directive 2012/18/EU of the European Parliament and of the Council of 4 July 2012 on the Control of Major-Accident Hazards Involving Dangerous Substances, Amending and Subsequently Repealing Council Directive 96/82/EC. Off. J. Eur. Union 2012, 55, 1–37. [Google Scholar]
- Zio, E.; Pedroni, N. Overview of Risk-Informed Decision-Making Processes; Foundation for an Industrial Safety Culture: Toulouse, France, 2012; ISBN 21003874. [Google Scholar]
- Christou, M.D.; Mattarelli, M. Land-use planning in the vicinity of chemical sites: Risk-informed decision making at a local community level. J. Hazard. Mater. 2000, 78, 191–222. [Google Scholar] [CrossRef]
- Khakzad, N. Which Fire to Extinguish First? A Risk-Informed Approach to Emergency Response in Oil Terminals. Risk Anal. 2017, 38, 1444–1454. [Google Scholar] [CrossRef] [Green Version]
- Shebeko, Y.; Bolodian, I.; Molchanov, V.; Deshevih, Y.; Gordienko, D.; Smolin, I.; Kirillov, D. Fire and explosion risk assessment for large-scale oil export terminal. J. Loss Prev. Process. Ind. 2007, 20, 651–658. [Google Scholar] [CrossRef]
- Aneziris, O.; Papazoglou, I.; Konstantinidou, M.; Nivolianitou, Z. Integrated risk assessment for LNG terminals. J. Loss Prev. Process. Ind. 2014, 28, 23–35. [Google Scholar] [CrossRef]
- Fu, S.; Yan, X.; Zhang, D.; Li, C.; Zio, E. Framework for the quantitative assessment of the risk of leakage from LNG-fueled vessels by an event tree-CFD. J. Loss Prev. Process. Ind. 2016, 43, 42–52. [Google Scholar] [CrossRef] [Green Version]
- Kang, J.; Liang, W.; Zhang, L.; Lu, Z.; Liu, D.; Yin, W.; Zhang, G. A new risk evaluation method for oil storage tank zones based on the theory of two types of hazards. J. Loss Prev. Process. Ind. 2014, 29, 267–276. [Google Scholar] [CrossRef]
- CMPT. A Guide to Quantitative Risk Assessment for Offshore Installations; the Centre for Marine and Petroleum Technology; DNV Technica: Oslo, Norway, 1999; ISBN 978-1-870553-36-0. [Google Scholar]
- Eades, M. Approaches to Hazard Identification; Health and Safety Executive; Health & Safety Executive: Sheffield, UK, 1998.
- Wadhwani, R.; Kumar, V.; Singh, P. Hazards on Offshore Platform: A Review. In Proceedings of the Chemcon, Manjusar, India, 27 December 2012. [Google Scholar]
- Chang, J.I.; Lin, C.-C. A study of storage tank accidents. J. Loss Prev. Process. Ind. 2006, 19, 51–59. [Google Scholar] [CrossRef]
- Fuentes-Bargues, J.L.; González-Cruz, M.C.; González-Gaya, C.; Baixauli-Pérez, M.P. Risk Analysis of a Fuel Storage Terminal Using HAZOP and FTA. Int. J. Environ. Res. Public Health 2017, 14, 705. [Google Scholar] [CrossRef] [PubMed]
- Marhavilas, P.K.; Filippidis, M.; Koulinas, G.K.; Koulouriotis, D.E. A HAZOP with MCDM Based Risk-Assessment Approach: Focusing on the Deviations with Economic/Health/Environmental Impacts in a Process Industry. Sustainability 2020, 12, 993. [Google Scholar] [CrossRef] [Green Version]
- Wu, J.; Lind, M. Management of System Complexity in HAZOP for the Oil &Gas Industry. IFAC PapersOnLine 2018, 51, 211–216. [Google Scholar] [CrossRef]
- Romero-Faz, D.; Camarero-Orive, A. Risk assessment of critical infrastructures—New parameters for commercial ports. Int. J. Crit. Infrastruct. Prot. 2017, 18, 50–57. [Google Scholar] [CrossRef]
- Jaradat, R.M.; Keating, C.B. Fragility of oil as a critical infrastructure problem. Int. J. Crit. Infrastruct. Prot. 2014, 7, 86–99. [Google Scholar] [CrossRef]
- Zohuri, B.; Fathi, N. Thermal-Hydraulic Analysis of Nuclear Reactors; Springer International Publishing: New York, NY, USA, 2015; ISBN 9783319174334. [Google Scholar]
- Carter, G.; Smith, S.D. Safety Hazard Identification on Construction Projects. J. Constr. Eng. Manag. 2006, 132, 197–205. [Google Scholar] [CrossRef]
- Centar for Chemical Process. Safety. Guidelines for Hazard Evaluation Procedures; Wiley: Hoboken, NJ, USA, 2011; ISBN 9781118211663. [Google Scholar]
- Naciri, M.; Poldervaart, L. Design Aspects of SPM LNG Terminals in Shallow Water. In Proceedings of the Offshore Technology Conference, Houston, TX, USA, 3–6 May 2004. [Google Scholar] [CrossRef]
- Stackhouse, M.R.D.; Stewart, R. Failing to Fix What is Found: Risk Accommodation in the Oil and Gas Industry. Risk Anal. 2016, 37, 130–146. [Google Scholar] [CrossRef] [PubMed]
- Landucci, G.; Argenti, F.; Cozzani, V.; Reniers, G. Assessment of attack likelihood to support security risk assessment studies for chemical facilities. Process. Saf. Environ. Prot. 2017, 110, 102–114. [Google Scholar] [CrossRef]
- International Association of Oil and Gas Producers. Risk Assessment Data Directory—Process Release Frequencies; Report 434-01; International Association of Oil and Gas Producers: London, UK, 2010. [Google Scholar]
- International Association of Oil and Gas Producers. Risk Assessment Data Directory—Storage Incident Frequencies; Report 434-03; International Association of Oil and Gas Producers: London, UK, 2010. [Google Scholar]
- International Association of Oil and Gas Producers. Risk Assessment Data Directory—Riser and Pipeline Release Frequencies; Report 434-04; International Association of Oil and Gas Producers: London, UK, 2010. [Google Scholar]
- International Association of Oil and Gas Producers. Risk Assessment Data Directory—Ignition Probabilities; Report 434-06; International Association of Oil and Gas Producers: London, UK, 2010. [Google Scholar]
- Committee for the Prevention of Disasters. Guidelines for Quantitative Risk Assessment: Purple Book; Committee for the Prevention of Disasters: The Hague, The Netherlands, 1999; ISBN 9789012087964. [Google Scholar]
- Health and Safety Executive. Failure Rate and Event Data for Use within Land Use Planning Risk Assessment; UK Health and Safety Executive: Bootle, UK, 2010.
- Pintarič, Z. Assessment of the Consequences of Accident Scenarios Involving Dangerous Substances. Process. Saf. Environ. Prot. 2007, 85, 23–38. [Google Scholar] [CrossRef]
- Cirimello, P.; Otegui, J.L.; Ramajo, D.; Carfi, G. A major leak in a crude oil tank: Predictable and unexpected root causes. Eng. Fail. Anal. 2019, 100, 456–469. [Google Scholar] [CrossRef]
- Center for Chemical Process Safety. Guidelines for Chemical Process Quantitative Risk Analysis; John Wiley & Sons: Hoboken, NJ, USA, 1989; ISBN 978081690400. [Google Scholar]
- De Silva, K.; Gunasekera, M.; De Alwis, A. Derivation of a societal risk acceptance criterion for major accident hazard installations in Sri Lanka. Process. Saf. Environ. Prot. 2017, 111, 388–398. [Google Scholar] [CrossRef]
- Sarewitz, D.; Pielke, R.; Keykhah, M. Vulnerability and risk: Some thoughts from a political and policy perspective. Risk Anal. 2003, 23, 805–810. [Google Scholar] [CrossRef] [PubMed] [Green Version]
- Aven, T. Misconceptions of Risk; John Wiley & Sons Ltd.: Chichester, UK, 2010; ISBN 9780470686539. [Google Scholar]
- Center for Chemical Process Safety. Guidelines for Evaluating Process Plant Buildings for External Explosions and Fires; John Wiley & Sons Ltd.: Chichester, UK, 1996; ISBN 9780816906468. [Google Scholar]
- Center for Chemical Process Safety. Layer of Protection Analysis: Simplified Process Risk Assessment; John Wiley & Sons, Inc.: Hoboken, NJ, USA, 2010; ISBN 9780470935590. [Google Scholar]
- Crowl, D.A. Understanding Explosions, 1st ed.; American Institute of Chemical Engineers: New York, NY, USA, 2003; ISBN 9780816907793. [Google Scholar]
- Mannan, S. Lees’ Loss Prevention in the Process Industries: Hazard Identification, Assessment and Control; Elsevier: Oxford, UK, 2012; ISBN 9780123971890. [Google Scholar]


Publisher’s Note: MDPI stays neutral with regard to jurisdictional claims in published maps and institutional affiliations. |
© 2021 by the authors. Licensee MDPI, Basel, Switzerland. This article is an open access article distributed under the terms and conditions of the Creative Commons Attribution (CC BY) license (https://creativecommons.org/licenses/by/4.0/).