Article

Retrieval of Chlorophyll a Concentration in Water Considering High-Concentration Samples and Spectral Absorption Characteristics

1
School of Municipal and Surveying Engineering, Hunan City University, Yiyang 413000, China
2
Key Laboratory of Metallogenic Prediction of Nonferrous Metals and Geological Environment Monitoring, Central South University, Changsha 410083, China
3
School of Computer Science and Information Security, Guilin University of Electronic Technology, Guilin 541004, China
4
Hunan Provincial Natural Resources Affairs Center, Changsha 410004, China
*
Author to whom correspondence should be addressed.
Sustainability 2021, 13(21), 12144; https://doi.org/10.3390/su132112144
Submission received: 2 October 2021 / Revised: 29 October 2021 / Accepted: 1 November 2021 / Published: 3 November 2021

Abstract

:
The envelope removal method has the advantage of suppressing the background spectrum and expanding the weak absorption characteristic information. However, for second-class water bodies with a relatively complex water quality, there are few studies on the inversion of chlorophyll a ( C h l - a ) concentration in water bodies that consider the spectral absorption characteristics. In addition, the current research on the inversion of the C h l - a concentration was carried out under the condition of sample concentration equilibrium. For areas with a highly variable C h l - a concentration, it is still challenging to establish a highly applicable and accurate C h l - a concentration inversion model. Taking Dongting Lake in China as an example, this study used high-concentration samples and spectral absorption characteristics to invert the C h l - a concentration. The decap method was used to preprocess the high-concentration samples with large deviations, and the envelope removal method was used to extract the spectral absorption characteristic parameters of the water body. On the basis of the correlation analysis between the water C h l - a concentration and the spectral absorption characteristics, the water C h l - a concentration was inverted. The results showed the following: (1) The bands that were significantly related to the C h l - a concentration and had a large correlation coefficient were mainly located in the three absorption valleys (400–580, 580–650, and 650–710 nm) of the envelope removal curve. Moreover, the correlation between the C h l - a concentration and the absorption characteristic parameters at 650–710 nm was better than that at 400–580 nm and 580–650 nm. (2) Compared with the conventional inversion model, the uncapped inversion model had a higher RP2 and a lower RMSEP, and was closer to the predicted value of the 1:1 line. Moreover, the performance of the uncapped inversion model was better than that of the conventional inversion model, indicating that the uncapped method is an effective preprocessing method for high-concentration samples with large deviations. (3) The predictive capabilities of the ER_New model were significantly better than those of the R_New model. This shows that the envelope removal method can significantly amplify the absorption characteristics of the original spectrum, which can significantly improve the performance of the prediction model. (4) From the inversion models for the absorption characteristic parameters, the prediction models of A650–710 nm_New and D650–710 nm_New exhibited the best performance. The three combined models (A650–710 nm&D650–710 nm_New, A650–710 nm&NI_New, A650–710 nm&DI_New) also demonstrated good predictive capabilities. This demonstrates the feasibility of using the spectral absorption feature to retrieve the chlorophyll concentration.

1. Introduction

Lake eutrophication is one of the most important water-related environmental problems facing humanity [1,2,3]. Although the current degree of eutrophication in Dongting Lake is relatively low, as a result of the influence of social and economic development in the basin, the nitrogen and phosphorus pollution in Dongting Lake is evident, the water quality has deteriorated, and the eutrophication trend has intensified [4,5]. Chlorophyll is an important component of phytoplankton, and chlorophyll a ( C h l - a ) is the type of chlorophyll contained in all phytoplankton categories. C h l - a concentration is an important index used to characterize the autotrophic biomass of light energy. It can also be used to estimate the biomass and productivity of phytoplankton, and it is also an important parameter reflecting the degree of nutrition of water bodies [6,7,8]. Monitoring the spatial-temporal changes in the chlorophyll a concentration in lakes helps to assess the progress towards the sustainable development goals (SDGs) outlined by the government, especially in terms of measuring the SDG 6.6.1 indicators. The current water quality monitoring method can accurately determine the various indicators of water quality at a certain location, but it is costly, time-consuming, and the range of monitoring points is limited, which does not reflect the distribution of water quality in time and space [9,10,11]. Hyperspectral remote sensing has the advantages of multiple and narrow bands. It can quickly obtain surface reflection spectra of water bodies, detect the relationship between spectral characteristics and water quality indicators, and provide a powerful tool for real-time, rapid, and large-scale water quality monitoring [12,13,14,15,16].
At present, the method of measuring C h l - a concentration based on hyperspectral remote sensing mainly uses the change rule of hyperspectral reflectance with the C h l - a concentration, and quantitative inversion of the C h l - a concentration through various related indicators [17,18,19]. There is little in-depth discussion on the potential of using spectral absorption characteristic parameters for quantitative inversion of the C h l - a concentration. Studies have shown that the envelope removal method is an effective spectral analysis method [20,21,22]. The envelope refers to the background contour line covering the upper part of the spectrum curve, which is composed of the connecting line of the local maximum at the inflection point of the reflectance spectrum [23,24]. Taking the envelope as the background, the envelope is removed to obtain the characteristic absorption band of the spectrum, so that the spectral absorption characteristic parameters can be extracted. This method can eliminate irrelevant background information, enhance the absorption feature of interest, and normalize it to a uniform spectral background, thus having the advantage of suppressing the background spectrum and expanding the weak absorption feature information. The envelope removal method was originally used for mineral mapping, and later extended to soil composition inversion, vegetation mapping, etc. [25,26,27,28,29,30,31]. However, there is no report on the use of the envelope removal method to extract the spectral absorption characteristic parameters and invert the C h l - a concentration of water bodies.
In addition, the current research on the inversion of the C h l - a concentration is carried out under the condition of sample concentration equilibrium [32,33,34,35,36]. For areas with highly variable C h l - a concentrations in water bodies, in order to improve the accuracy of inverting C h l - a concentrations, existing studies often remove samples that exceed the standard as outliers [37,38,39,40,41,42,43]. However, these outliers are often the focus of researchers. Therefore, on the basis of existing research, this paper proposes a new preprocessing method (the decap method) for the hyperspectral retrieval of the C h l - a concentration in order to improve the accuracy of C h l - a concentration retrieval for excessive samples with large deviations.
Taking Dongting Lake in China as an example, this study takes into account high concentration samples and spectral absorption characteristics to retrieve the C h l - a concentration. The decap method was used to preprocess the high-concentration samples with large deviations, and the envelope removal method was used to extract the water spectral absorption characteristic parameters. On the basis of C h l - a concentration correlation analysis and the spectral absorption characteristics, the C h l - a concentration was inverted. It is expected to provide a useful reference for the use of hyperspectral data to carry out large-scale normalized C h l - a concentration monitoring, and to provide theoretical and technical support for the environmental protection and sustainable development of Dongting Lake.

2. Materials and Methods
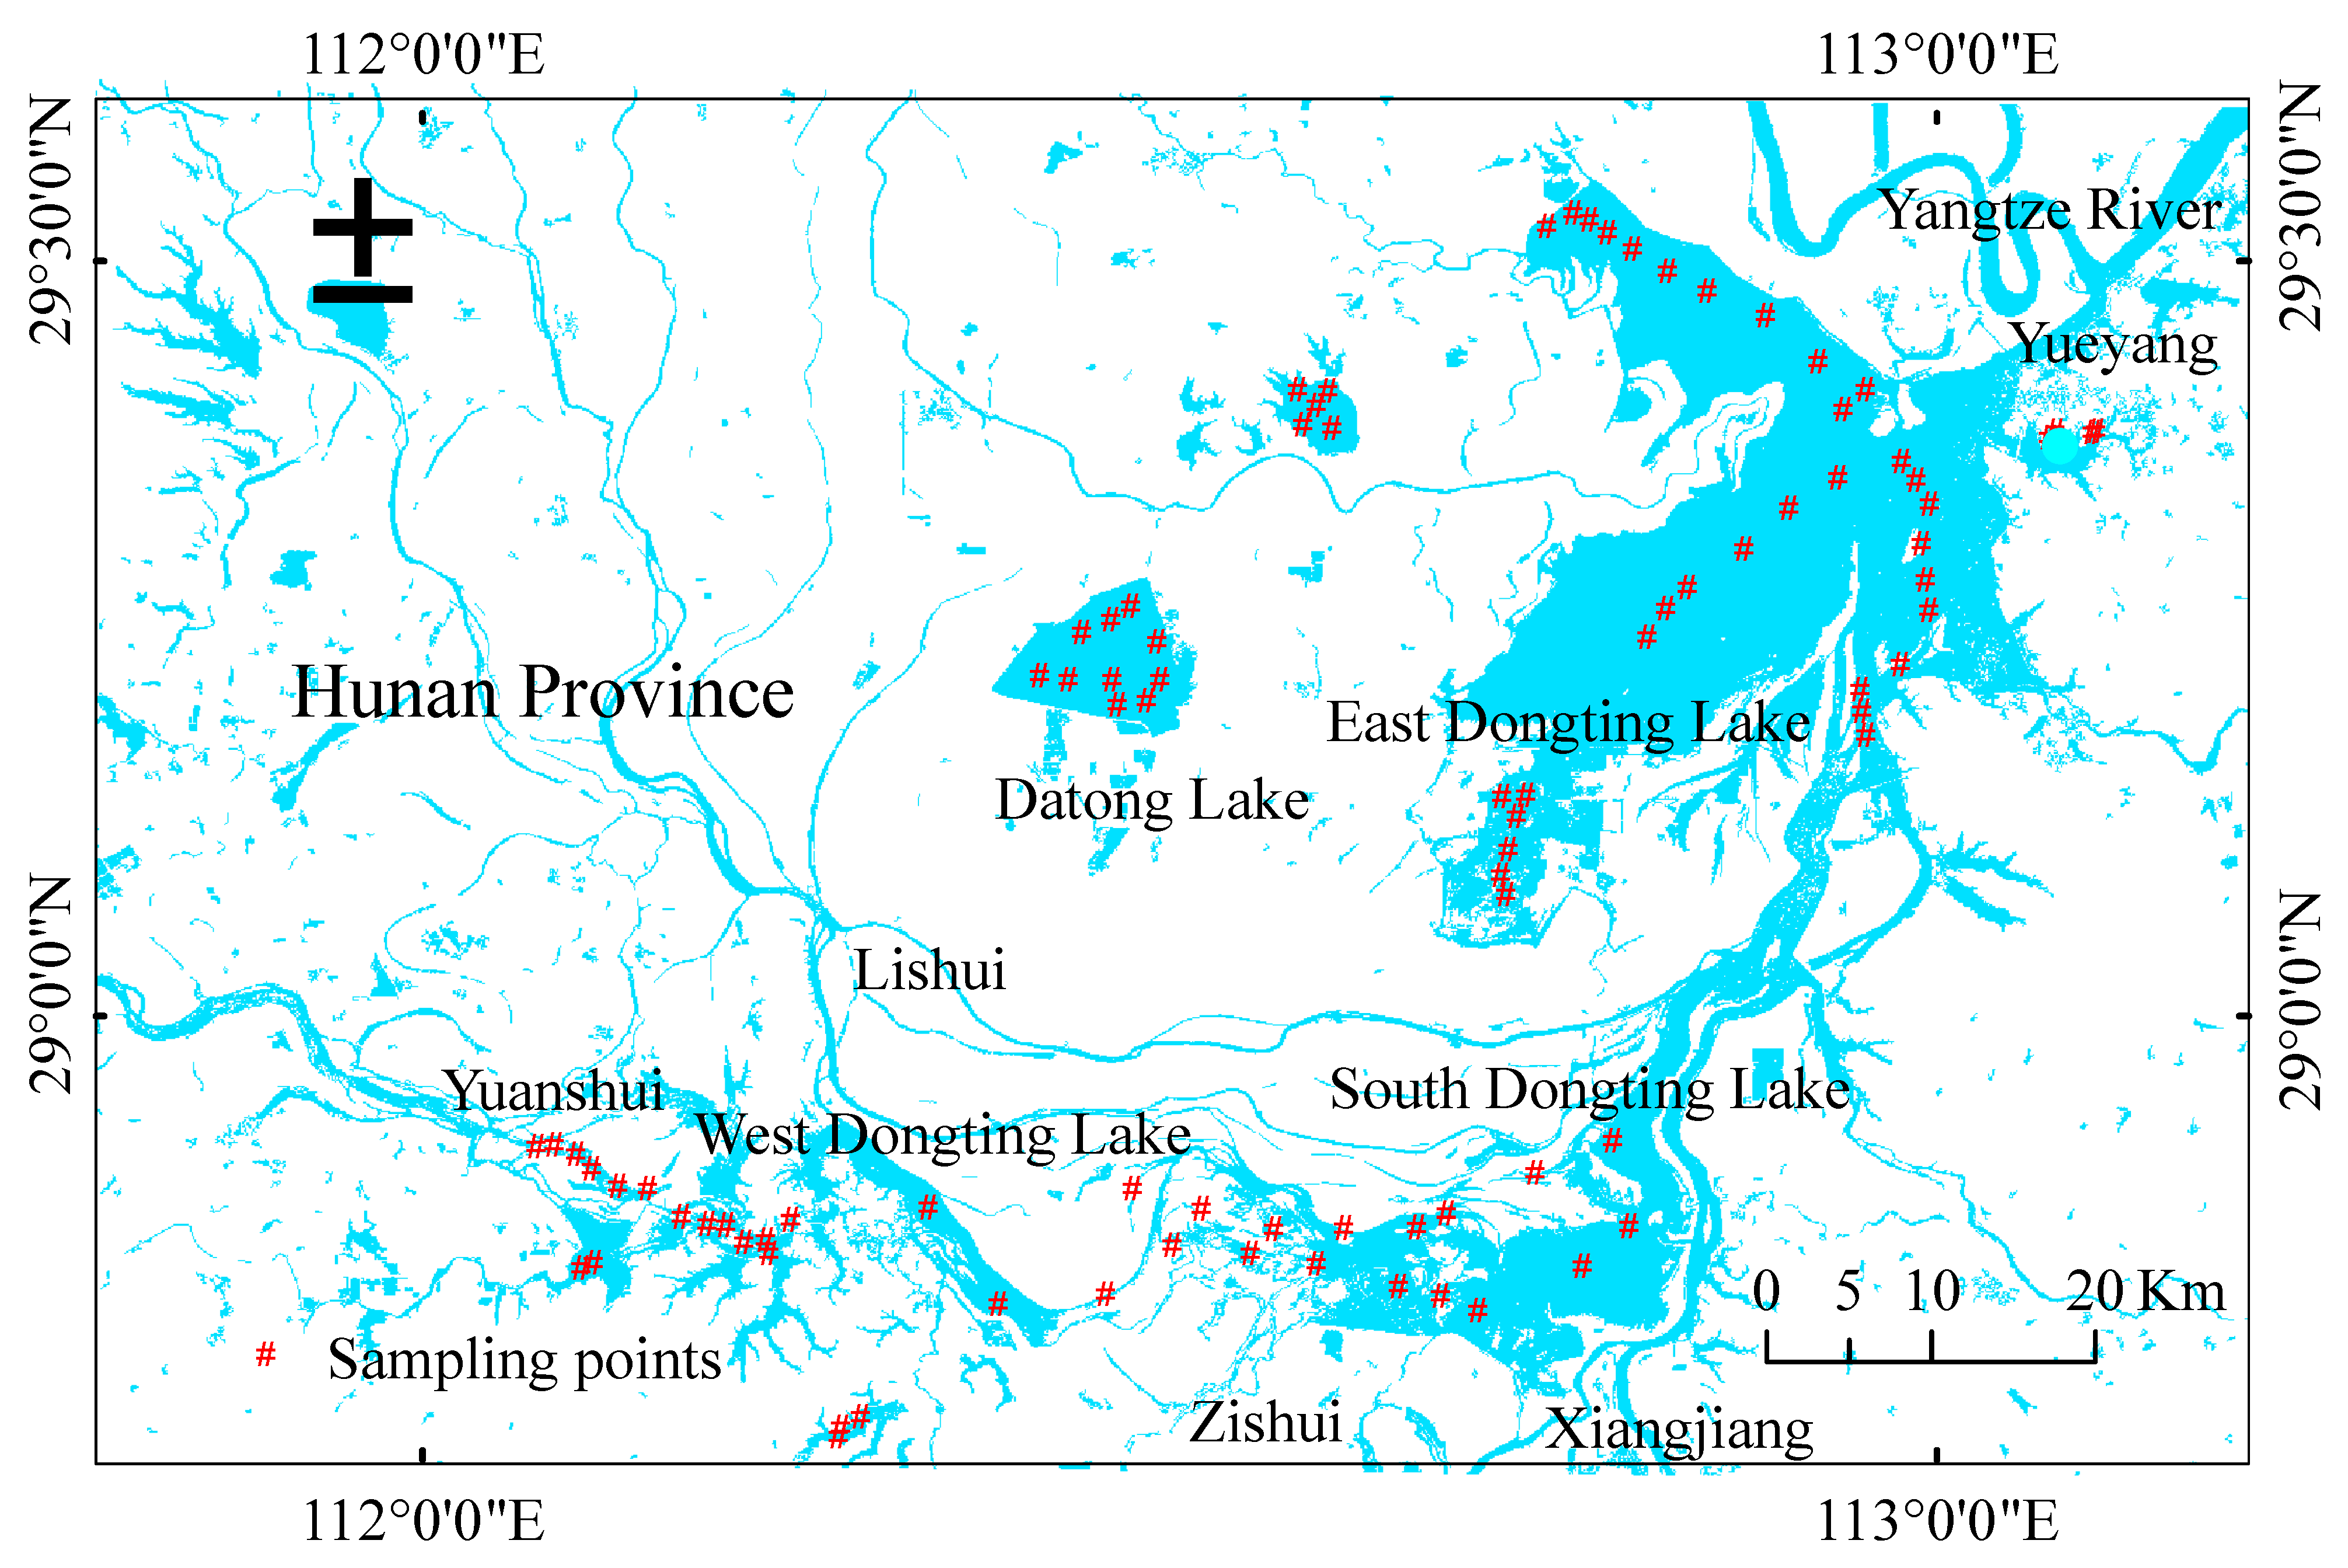
2.1. Study Area

Dongting Lake is located in the northern part of Hunan Province, China, south of the Yangtze River. It is the second largest freshwater lake in China and an internationally important wetland. The geographical location is between 28°30′–29°31′ N and 111°40′–113°10′ E. Four waters (Xiangjiang, Zishui, Yuanshui, and Lishui) flow into Dongting Lake from the south, and the north side of Dongting Lake is connected to the Yangtze River. It is a typical water-passing lake. At present, it is divided into East Dongting Lake, South Dongting Lake, West Dongting Lake, and Datong Lake (Figure 1), covering an area of about 2789 km2. With the rapid development of the national economy, population growth, siltation, lake construction, the discharge of a large number of pollutants into the lake, and other natural and human factors, Dongting Lake faces many water-related environmental problems [44,45,46]. At present, Dongting Lake is mainly mesotrophic, and eutrophic water bodies are mainly concentrated in areas with slow water flow such as the Inner Lake and the western part of East Dongting Lake [4].

2.2. Sample Collection and Measurement

In accordance with the “Guidance on sampling from lakes, natural and man-made” (ISO/TC 147/SC 6) [47], water quality sampling points were set up in Dongting Lake (Figure 1). Sunny and less cloudy weather was chosen to carry out field ground experiments. A total of 86 water samples were collected and brought back to the laboratory for the C h l - a concentration measurement using the hot ethanol method. A GF/C filter membrane was used to filter water samples. The filter membrane was placed in a refrigerator for more than 48 h, and 90% hot ethanol was used for extraction. With 90% ethanol as the reference solution, the absorbance at 665 and 750 nm was measured on the Shimadzu UV2401 spectrophotometer. One drop of 1% dilute hydrochloric acid acidified was added, and the chlorophyll a concentration was calculated. The water surface spectrum was collected by the water surface spectrum measurement method. For each sample point, the “ASD Field Spec” portable field spectrometer (350~1050 nm) was used to collect 10 water surface spectra, the abnormal values were eliminated, and then averaging processing was performed to obtain the measured spectrum value of the water surface sampling point.

2.3. Spectral Data Processing and Absorption Feature Extraction

In view of the random error in the process of spectral measurements and the weak chlorophyll spectral response signal, spectral denoising, spectral resampling, spectral smoothing, and envelope removal were used to preprocess the spectral data to enhance the characteristic band of the spectral response. In this study, the low signal-to-noise ratio bands (350–399 nm and 891–1050 nm) were removed. Adjacent hyperspectral data bands are often highly correlated, and there is information redundancy. The 491 bands between 400–890 nm collected by the spectrometer were resampled with an interval of 10 nm to reduce the correlation between the bands and improve the efficiency of data processing. The Savitzky–Golay algorithm was used to smooth the spectrum.
The envelope removal method is able to effectively highlight the characteristics of the reflectance spectrum curve and normalize the reflectance to between 0–1; the absorption characteristics of the spectrum are also normalized to a uniform spectral background. On the basis of envelope removal, some spectral absorption characteristic parameters have been developed, mainly including the absorption depth (D) and absorption valley area (A). The absorption depth is the difference between 1 and the minimum value of the envelope removal curve in the absorption valley, and the absorption area is the integrated area of the absorption valley. The ENVI software was used to establish a water sample spectrum database. The “Continuum Removed” function in ENVI was utilized to remove the water sample spectrum data envelope. In the Matlab environment, the code was written to calculate the spectral absorption characteristic parameters of each water sample.

2.4. Spectral Index Construction

The chlorophyll concentration and the envelope removal curve after 10 nm resampling were used for the correlation analysis. The maximum positive correlation band (550 nm) and the maximum negative correlation band (680 nm) were selected to construct the normalized index (NI), difference index (DI), and ratio index (RI). The formula is as follows:
NI = ( E R 550 E R 680 ) ( E R 550 + E R 680 )
DI = E R 550 E R 680
RI = E R 550 E R 680
In the formula, E R 550 and E R 680 represent the envelope removal values at 550 nm and 680 nm, respectively.

2.5. Model Construction and Accuracy Evaluation

The coefficient of determination (R2) and the root mean square error (RMSE) were selected as the criteria for judging the predictive ability of the model. Among them, R2 included the determination coefficient of prediction samples (RP2) and the determination coefficient of training samples (RT2), and the RMSE included the root mean square error of prediction samples (RMSEP) and the root mean square error of training samples (RMSET), as follows:
R 2 = 1 n ( y i y ) 2 / 1 n ( y i y ) 2
RMSE = 1 n ( y i y i ) 2 / n
where y is the measured sample value, n is the number of samples denoted by i = 1 , 2 , n , y is the mean of the measured sample, and y is the predicted value of the sample. Generally, the larger the RT2 and RP2, the smaller the RMSET and RMSEP, the higher the model accuracy, and the smaller the deviation.

3. Results

3.1. Descriptive Statistical Analysis of Chlorophyll a Concentration

Dongting Lake is divided into several lakes, and the exchange water rate in each lake is different. In water bodies with a faster water flow, the C h l - a concentration is low. In relatively closed water bodies, the C h l - a concentration is higher (the maximum value is 124.25 mg/m3), and the sample average value is 31.35 mg/m3. Moreover, the C h l - a concentration varies greatly between different sample points (with a standard deviation up to 30.00 mg/m3, and a coefficient of variation up to 0.94). According to the calculation formula of the comprehensive nutritional status index [4], the critical chlorophyll concentration value is 63.03 mg/m3 when the water body exhibits severe eutrophication. Among the 86 water samples, 13 samples exceeded the critical value, with a point exceeding rate of 15.12%.
The measured data exceed the standard at a high rate, and the standard deviation and the coefficient of variation are large, which indicates that the study area exhibits more eutrophication, that the study area is relatively varied, and that the spatial heterogeneity is more significant. In order to improve the inversion accuracy, existing studies often remove samples that severely exceed the standard as outliers. However, these outliers are often the focus of researchers. The basic idea is as follows: First, samples that exceed the standard (>63.03 mg/m3) are selected, the critical severe eutrophication value (63.03 mg/m3) is utilized to replace the concentration of the sample, and the difference between the critical value of the outlier sample and the critical severe eutrophication value is calculated. Then, the new sample concentration data and hyperspectral data are used to establish an inversion model. Finally, the model inversion value of the outlier sample plus the difference between the outlier sample and the critical severe eutrophication value is used as the predicted value of the outlier sample.

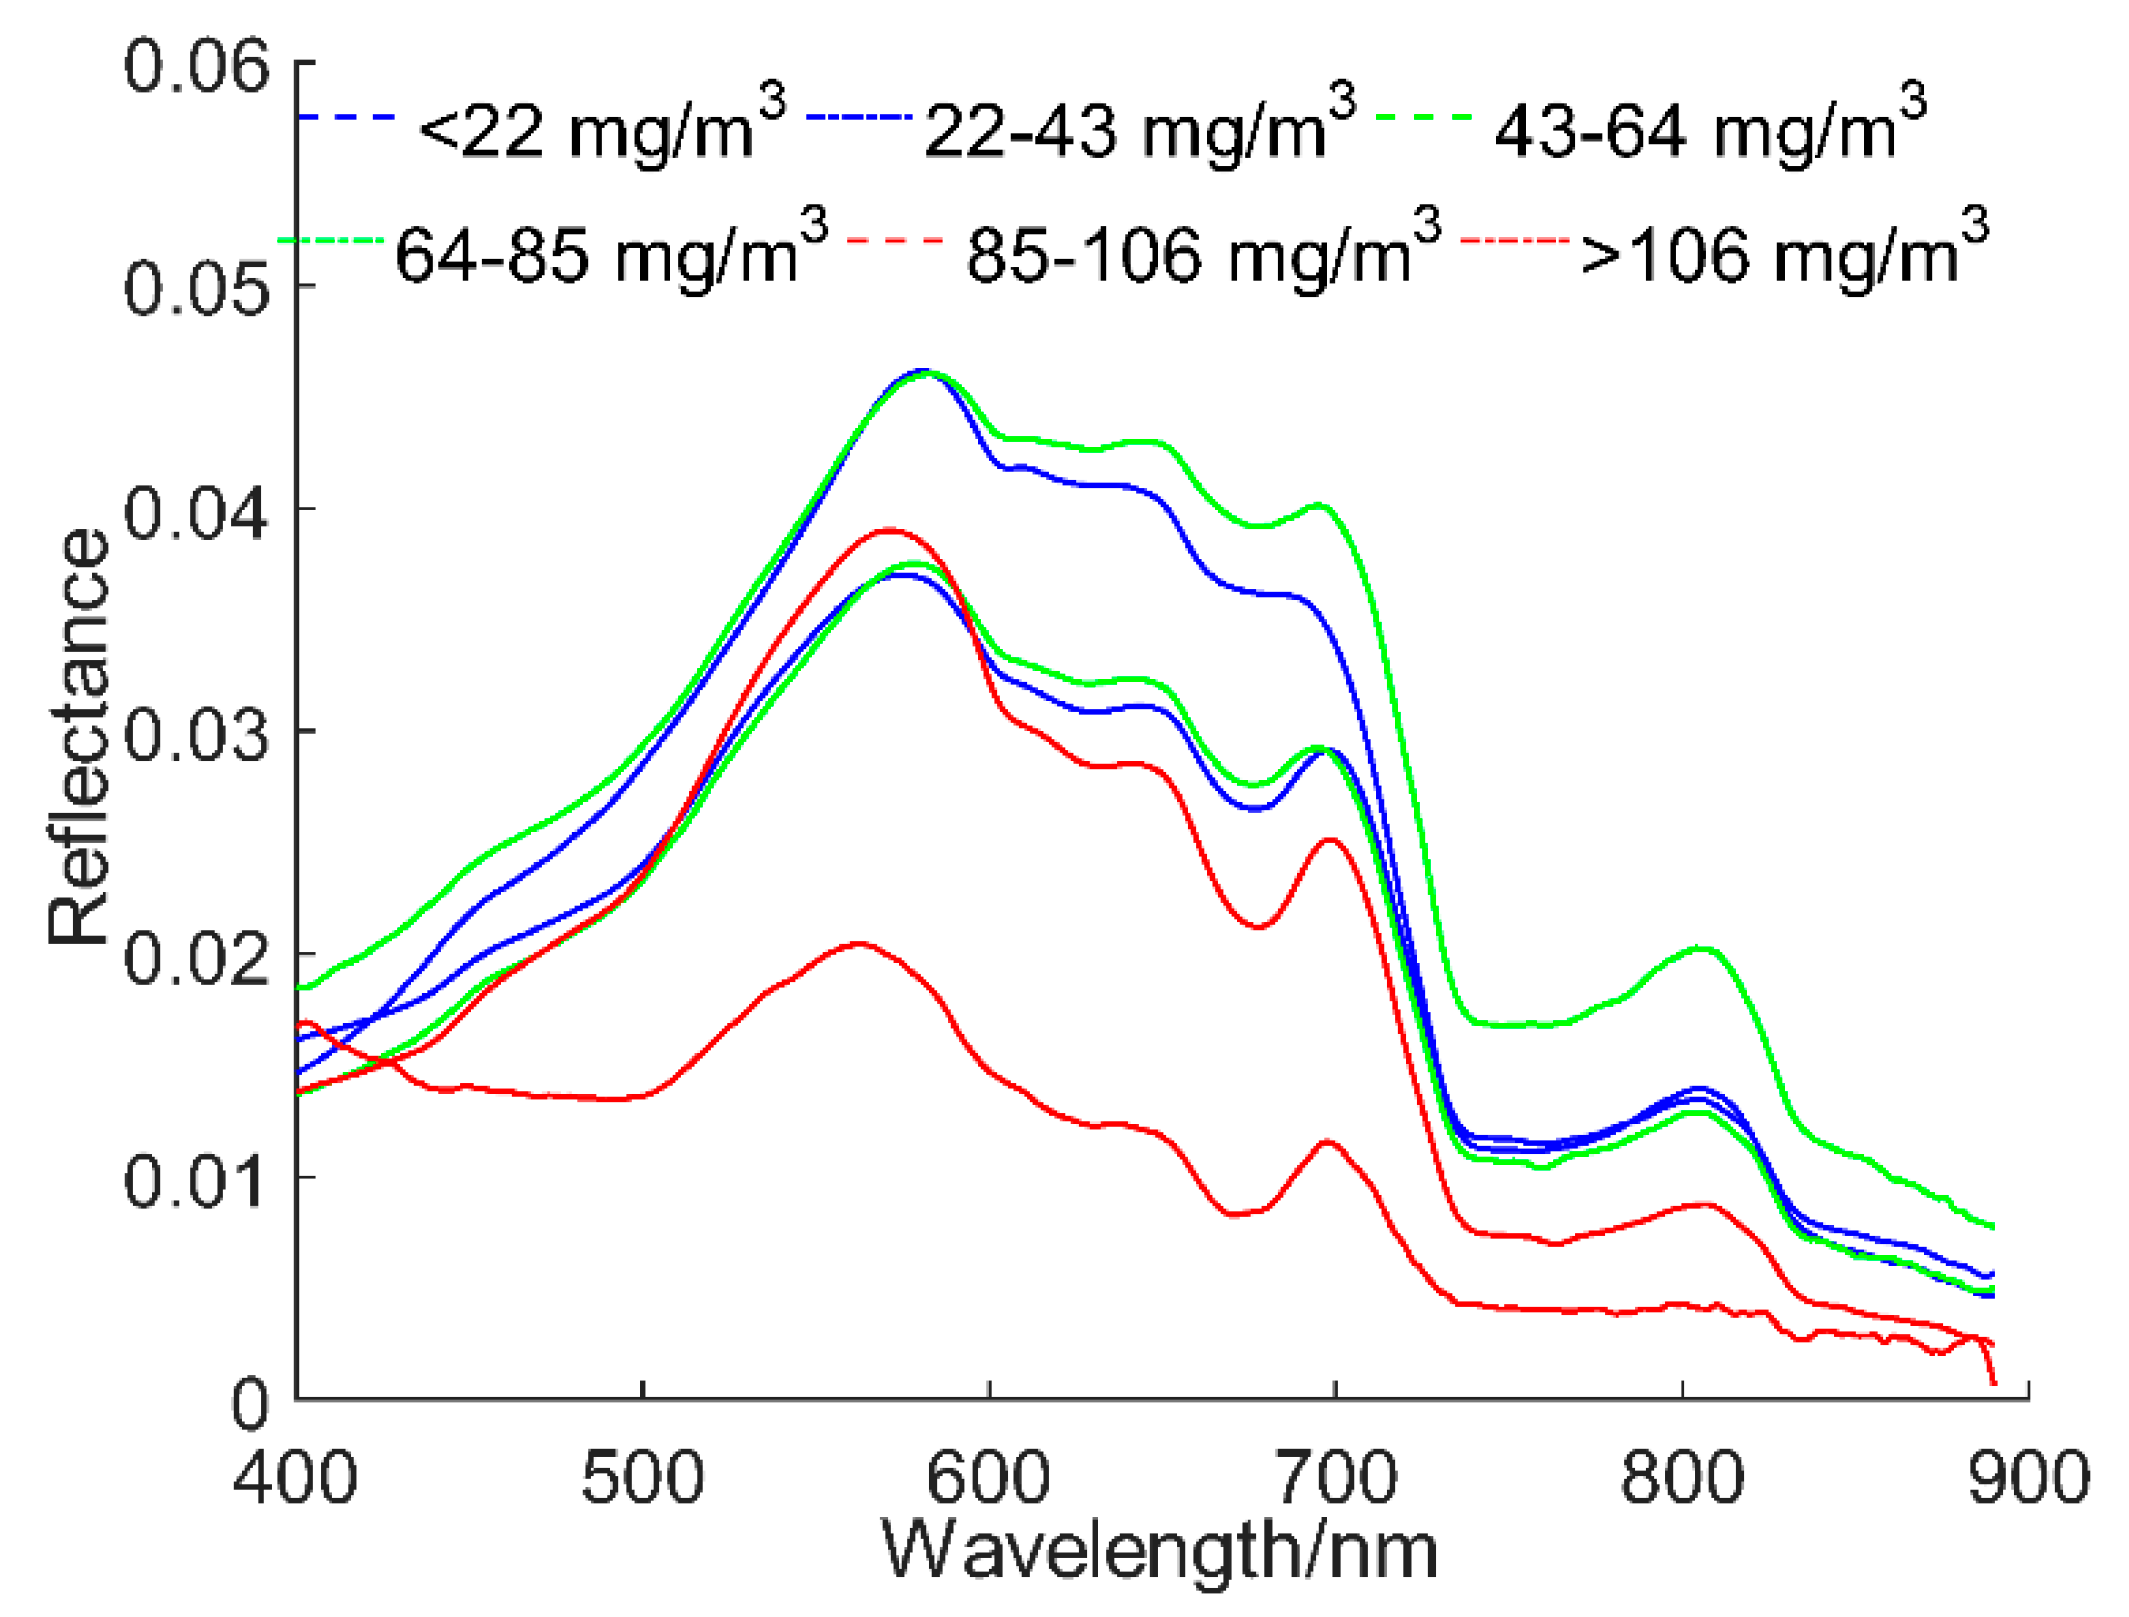
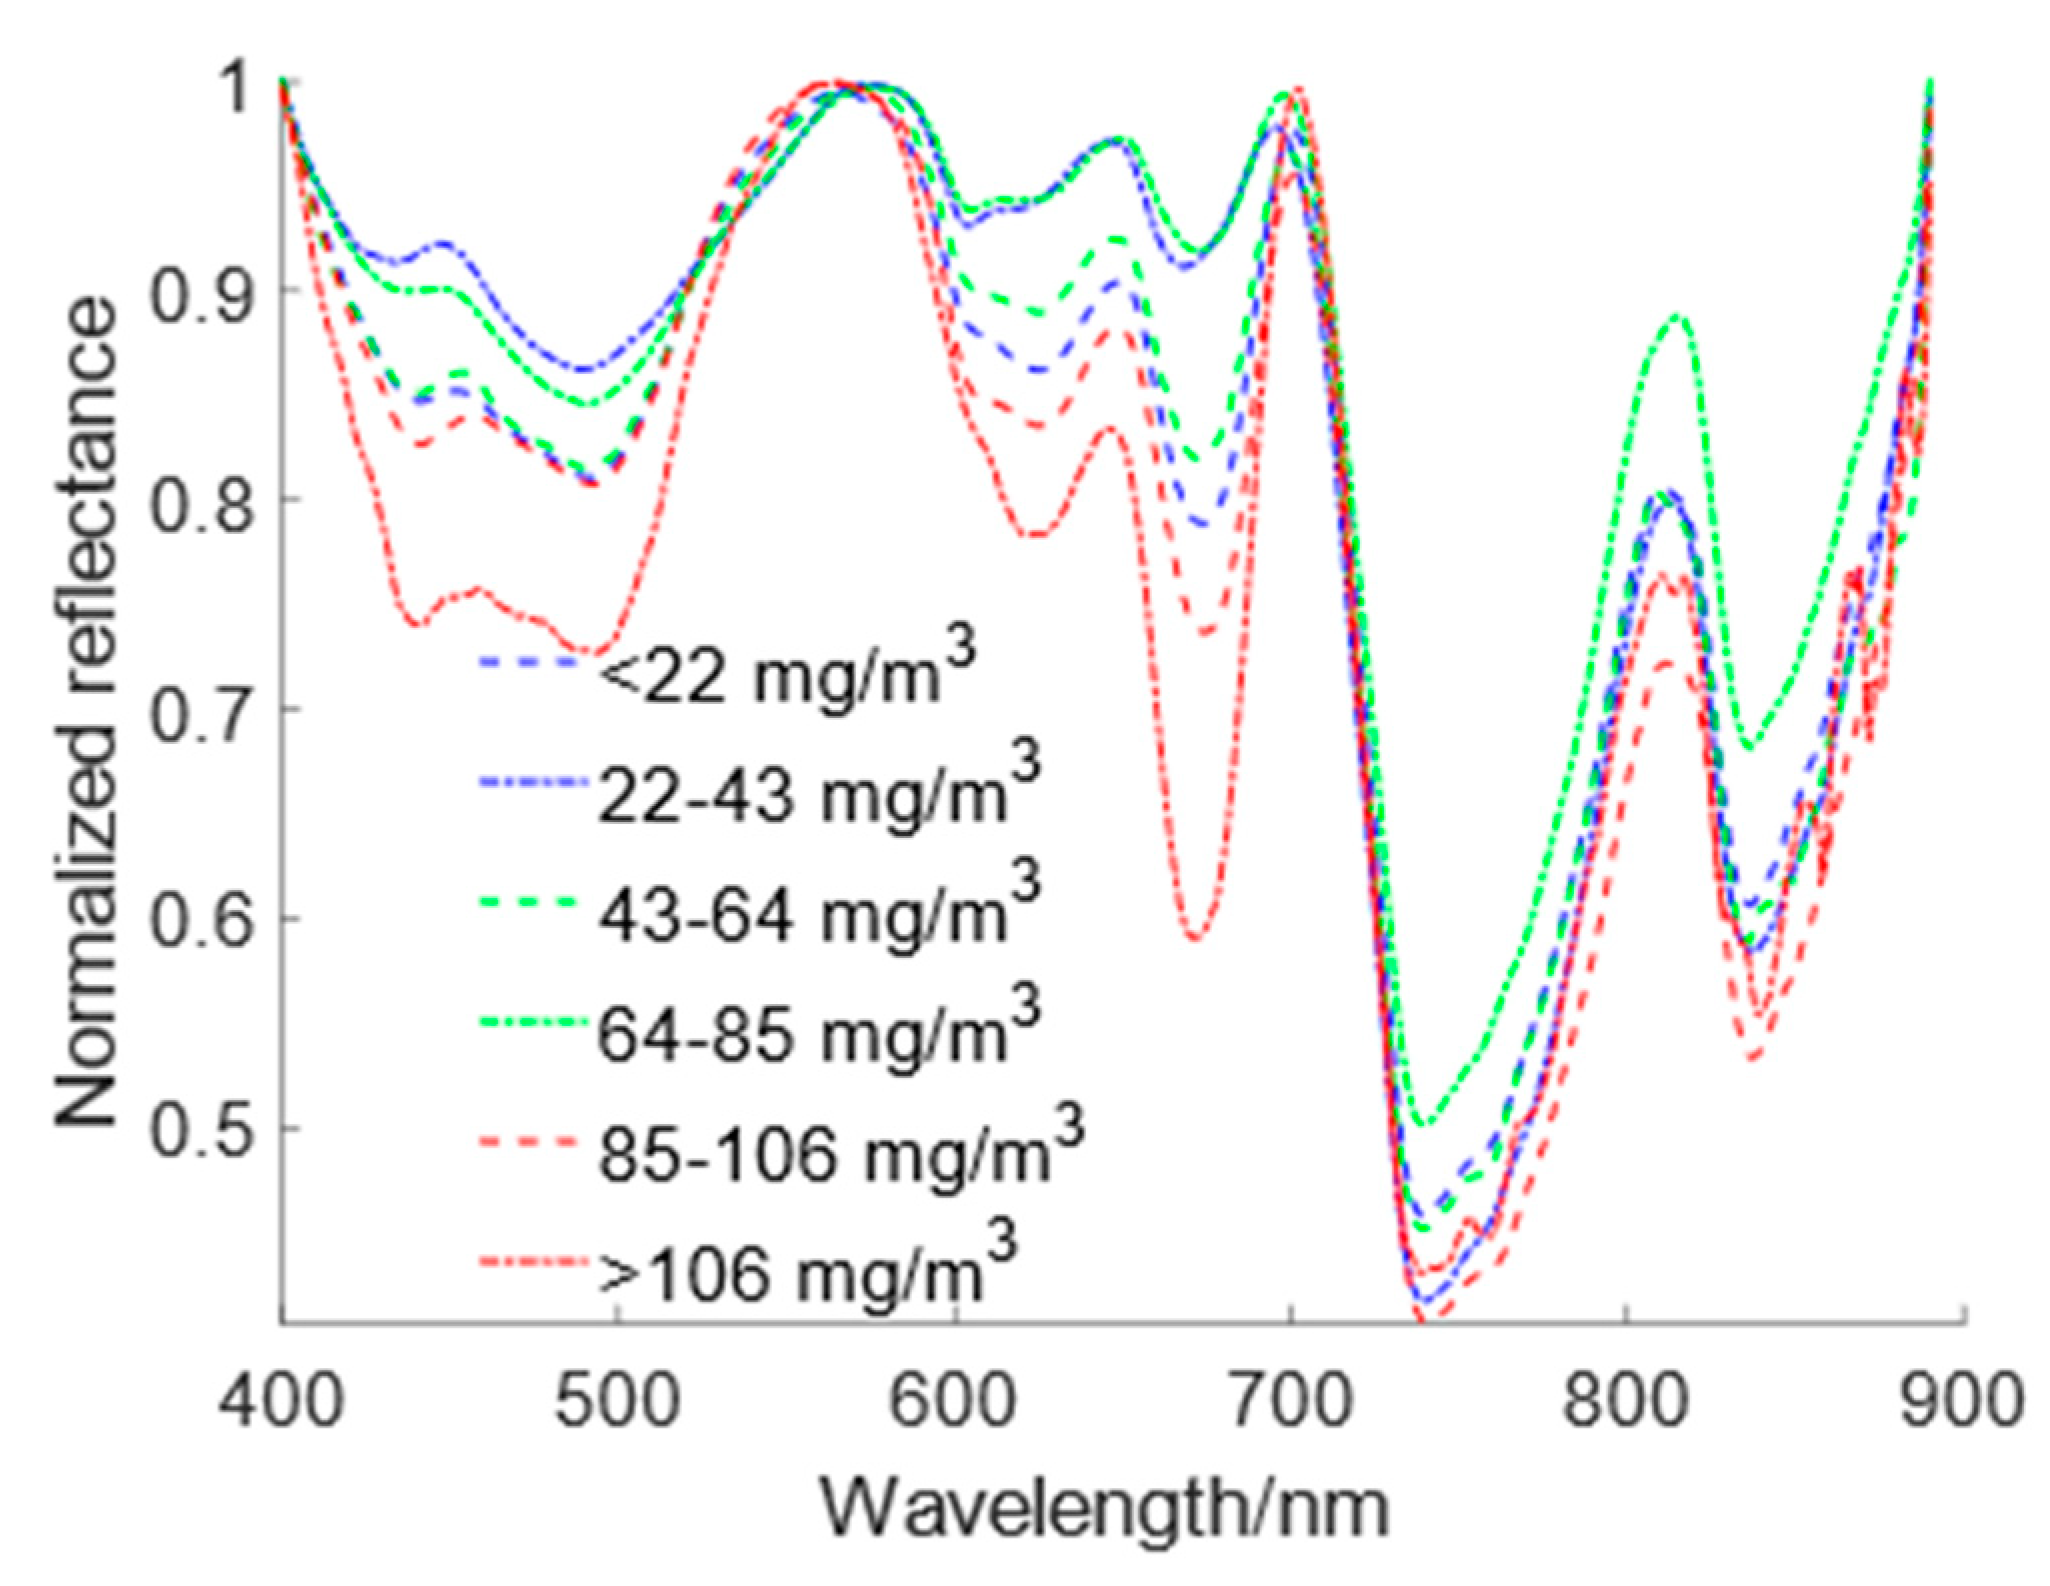
3.2. Spectral Absorption Characteristic Analysis

The 86 water body samples collected in Dongting Lake were sorted from low C h l - a concentration to high C h l - a concentration. According to the C h l - a concentration, all samples were divided into six groups at equal intervals, and the spectral reflectance of all samples in each group was averaged to obtain the grouped spectral characteristic curve (Figure 2). The averages of the envelope removal curves of all samples in each group were utilized to obtain the group envelope removal curve (Figure 3). It can be seen from Figure 2 that, due to the strong absorption of chlorophyll a and yellow substances in the blue–violet light band, the reflectivity of water bodies in the range of 400–500 nm was low. As a result of the weak absorption of chlorophyll and carotene in the range of 550–580 nm and the scattering effect of cells, the water spectrum formed a reflection peak. As a result of the absorption of phycocyanin pigment near 620 nm, absorption valleys appeared in the water spectrum Due to the strong absorption of chlorophyll near 675 nm, absorption valleys appeared in the water spectrum. There was an obvious reflection peak at 685–715 nm, which is generally considered to be the fluorescence peak of chlorophyll a, which shifts in the long-wave direction as the C h l - a concentration increases. Due to the absorption of pure water in the infrared band, the reflectivity decreased rapidly after 730 nm.
It can be seen from Figure 3 that, after the envelope removal treatment of the reflectance, the absorption characteristics were significantly enlarged. For example, the weak absorption bands at 440, 490, 620, 670, 740, and 840 nm can be clearly observed in the envelope removal curve. This is not obvious in the reflectance curve. The envelope removal curves of different C h l - a concentrations have five typical absorption characteristic bands, i.e., 400–580, 580–650, 650–710, 710–820, and 820–880 nm. Among them, at 400–580, 580–650, and 650–710 nm, the C h l - a concentration of high-concentration samples were positively correlated with the absorption depth and absorption area, while low-concentration samples exhibited no obvious regularity.

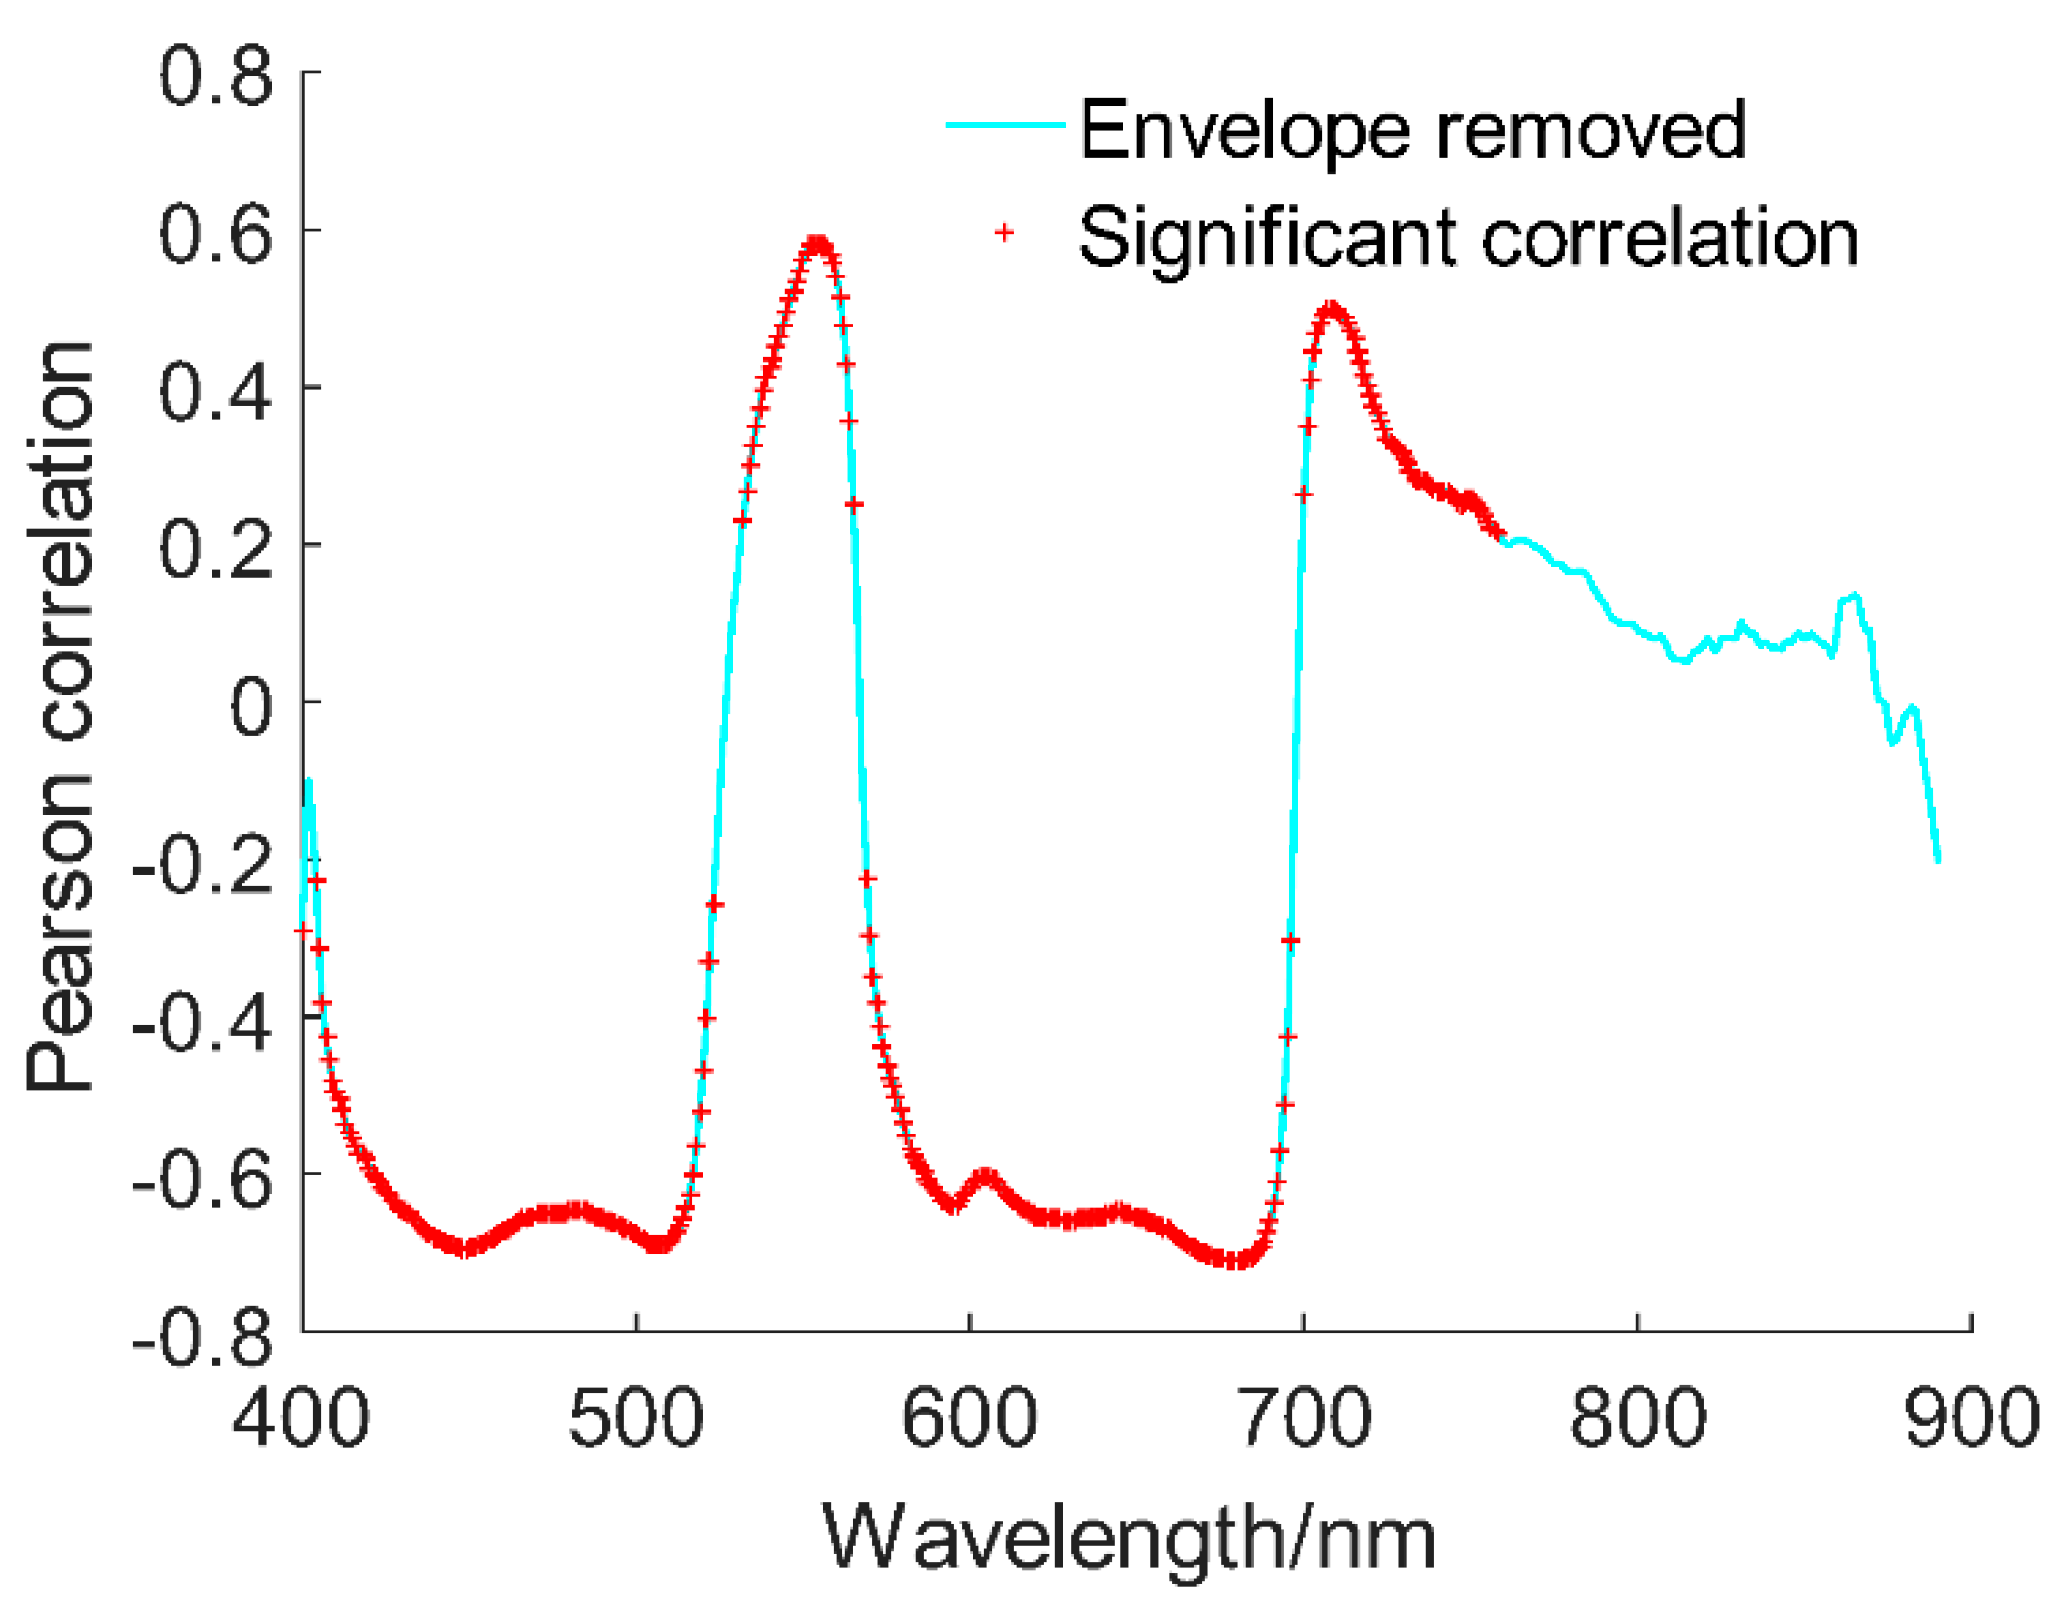
3.3. Correlation Analysis of Chlorophyll a Concentration and Absorption Characteristic Parameters

Figure 4 shows the correlation curve between C h l - a concentration and envelope removal. It can be seen from Figure 4 that the water chlorophyll concentration and the envelope removal data were significantly negatively correlated at 421–517 nm, of which the maximum negative correlation was at 450 nm, reaching −0.69. There was a significant positive correlation at 540–562 nm, and the maximum positive correlation was at 553 nm, reaching 0.58. There was a significant negative correlation at 587–692 nm, and the largest negative correlation was at 681 nm, reaching −0.71. There was a significant positive correlation at 702–758 nm, but the correlation coefficient was small. The bands that were significantly related to the chlorophyll concentration and had a large correlation coefficient were mainly located in the three absorption valleys (400–580, 580–650, and 650–710 nm) of the envelope removal curve.
Table 1 shows the correlation analysis results of the chlorophyll concentration and the spectral absorption characteristic parameters extracted by the envelope removal method. It can be seen from Table 1 that the correlation between the six spectral absorption characteristic parameters and the chlorophyll concentration all passed the extremely significant test level, i.e., at the 0.01 level. Among them, A650–710 nm had the largest correlation coefficient, reaching 0.76, followed by D650–710 nm, which also had a correlation coefficient of 0.73. The correlation between the C h l - a concentration and the spectral absorption characteristic parameters at 650–710 nm was better than that of 400–580 nm and 580–650 nm. In brief, the correlation analysis between the C h l - a concentration and the spectral absorption characteristic parameters shows that the spectral absorption characteristic parameters had the potential to quantitatively evaluate the C h l - a concentration.

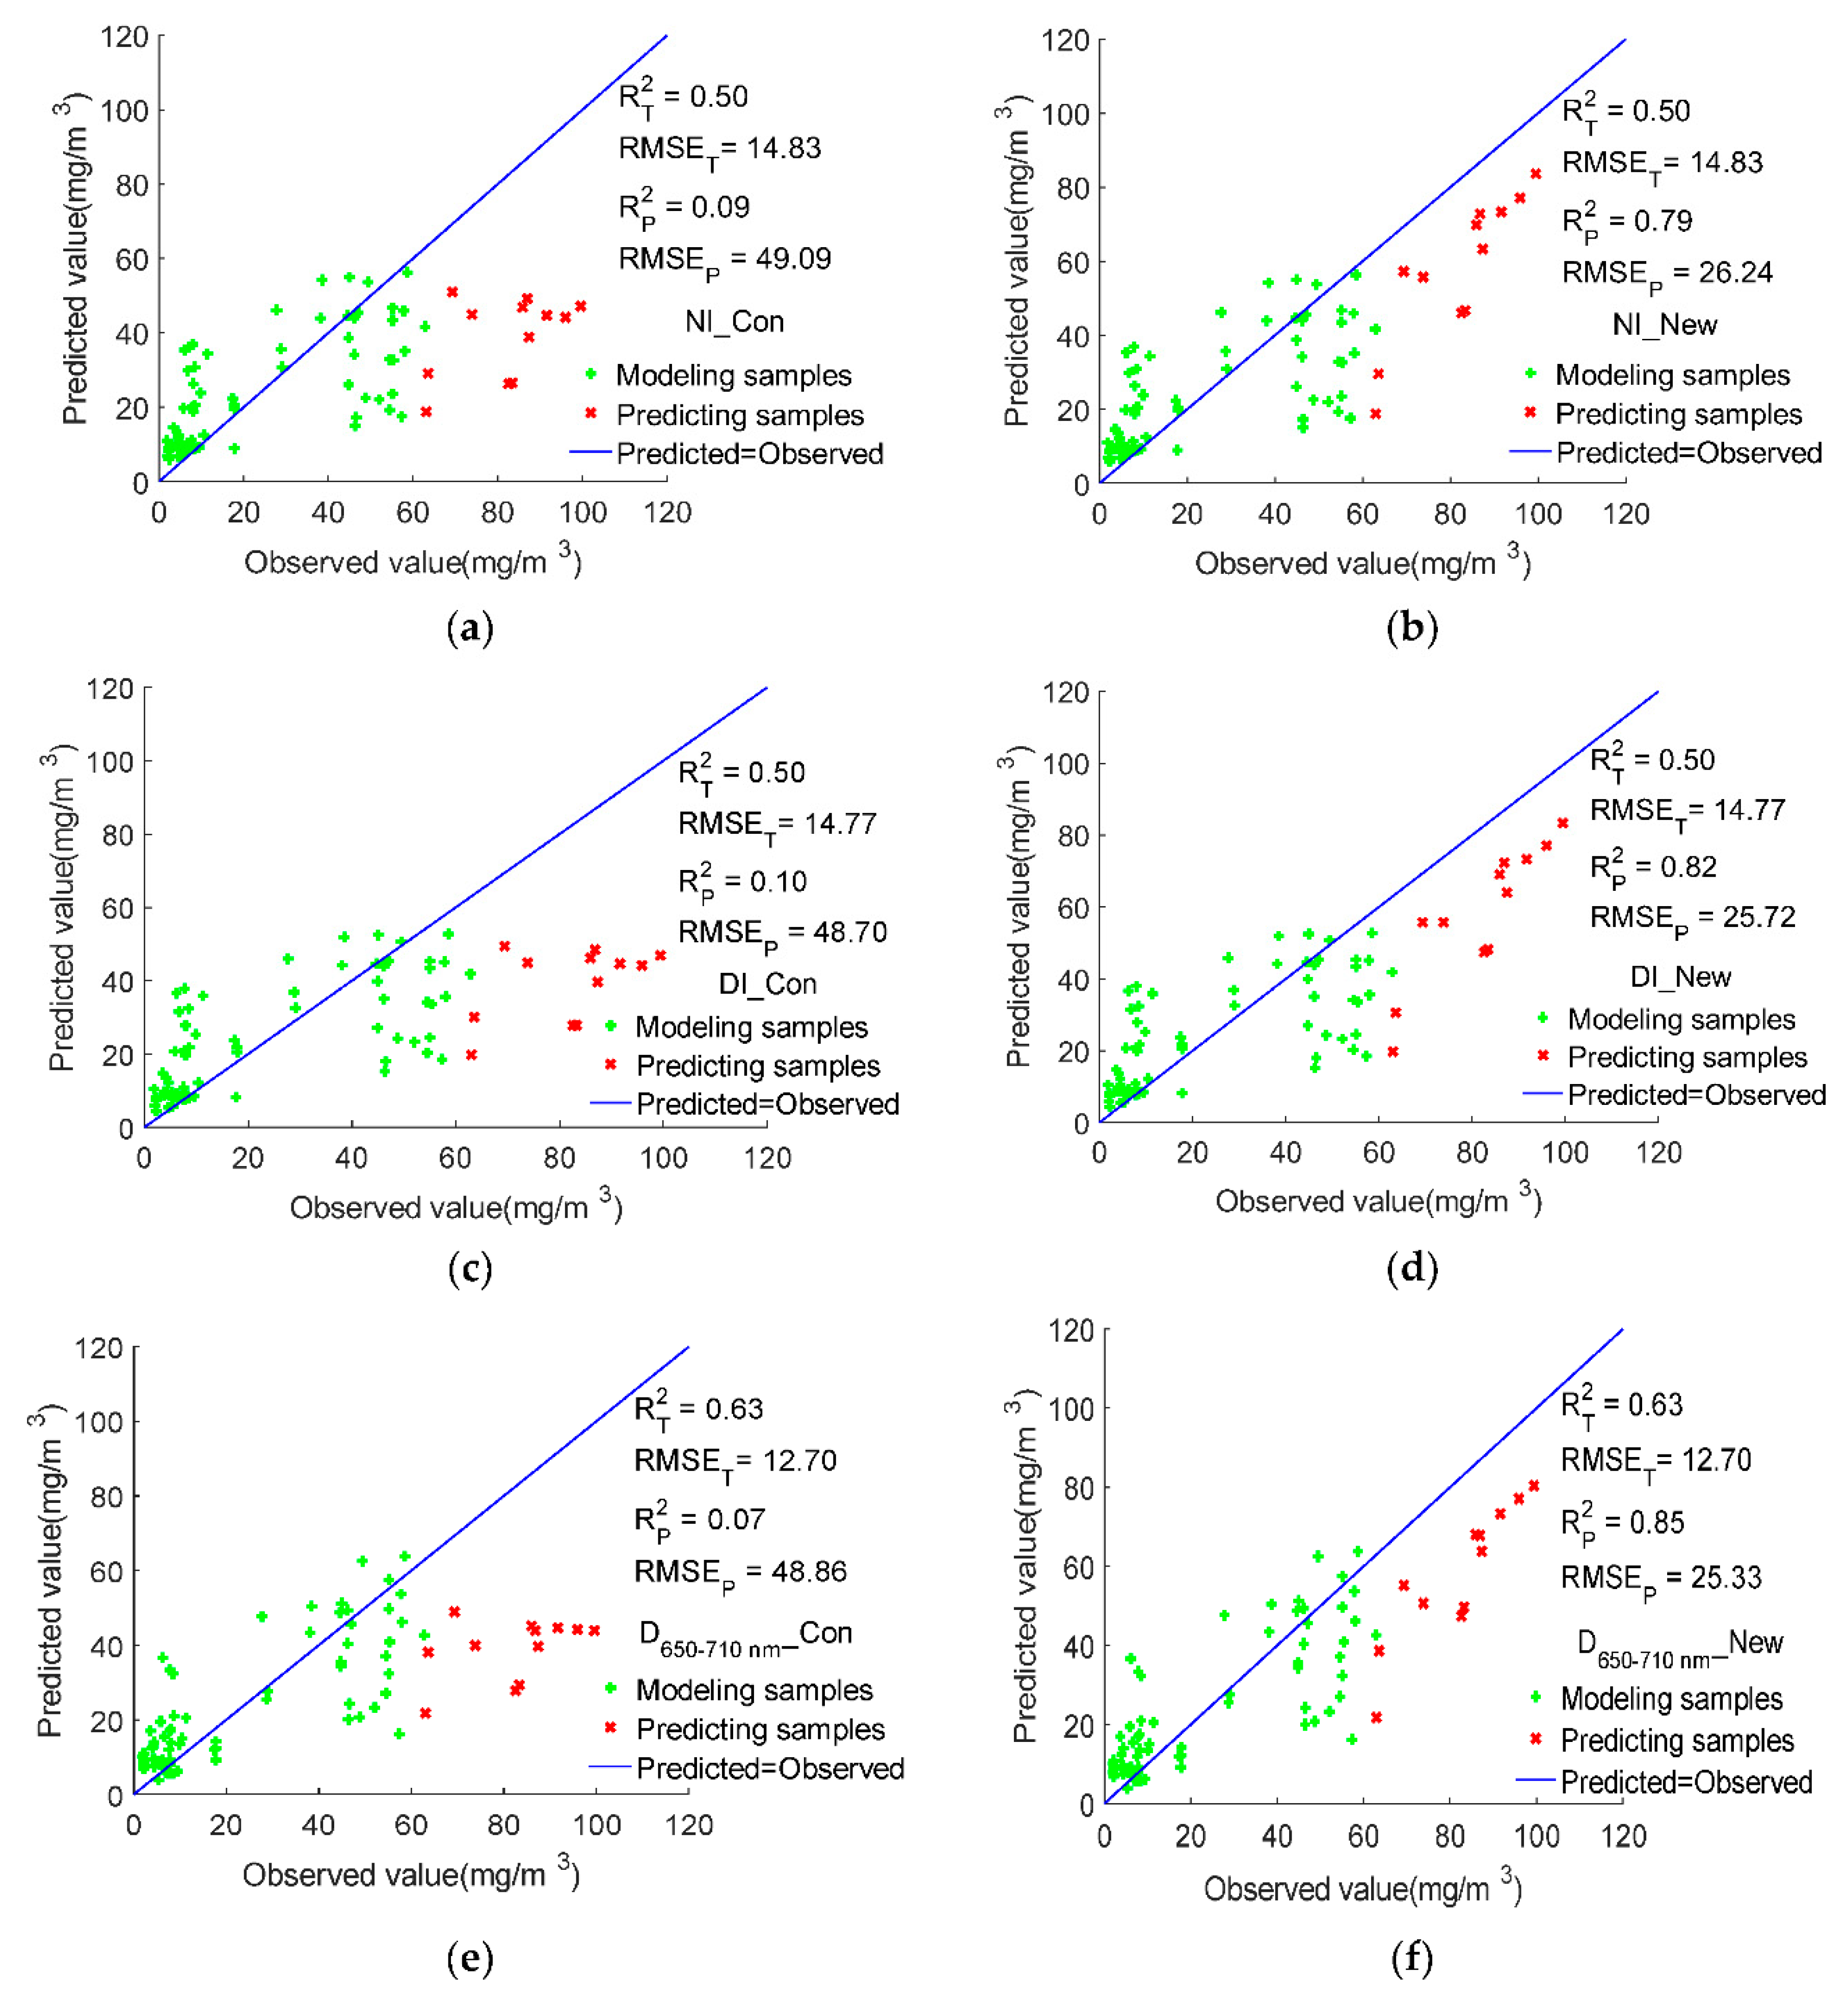
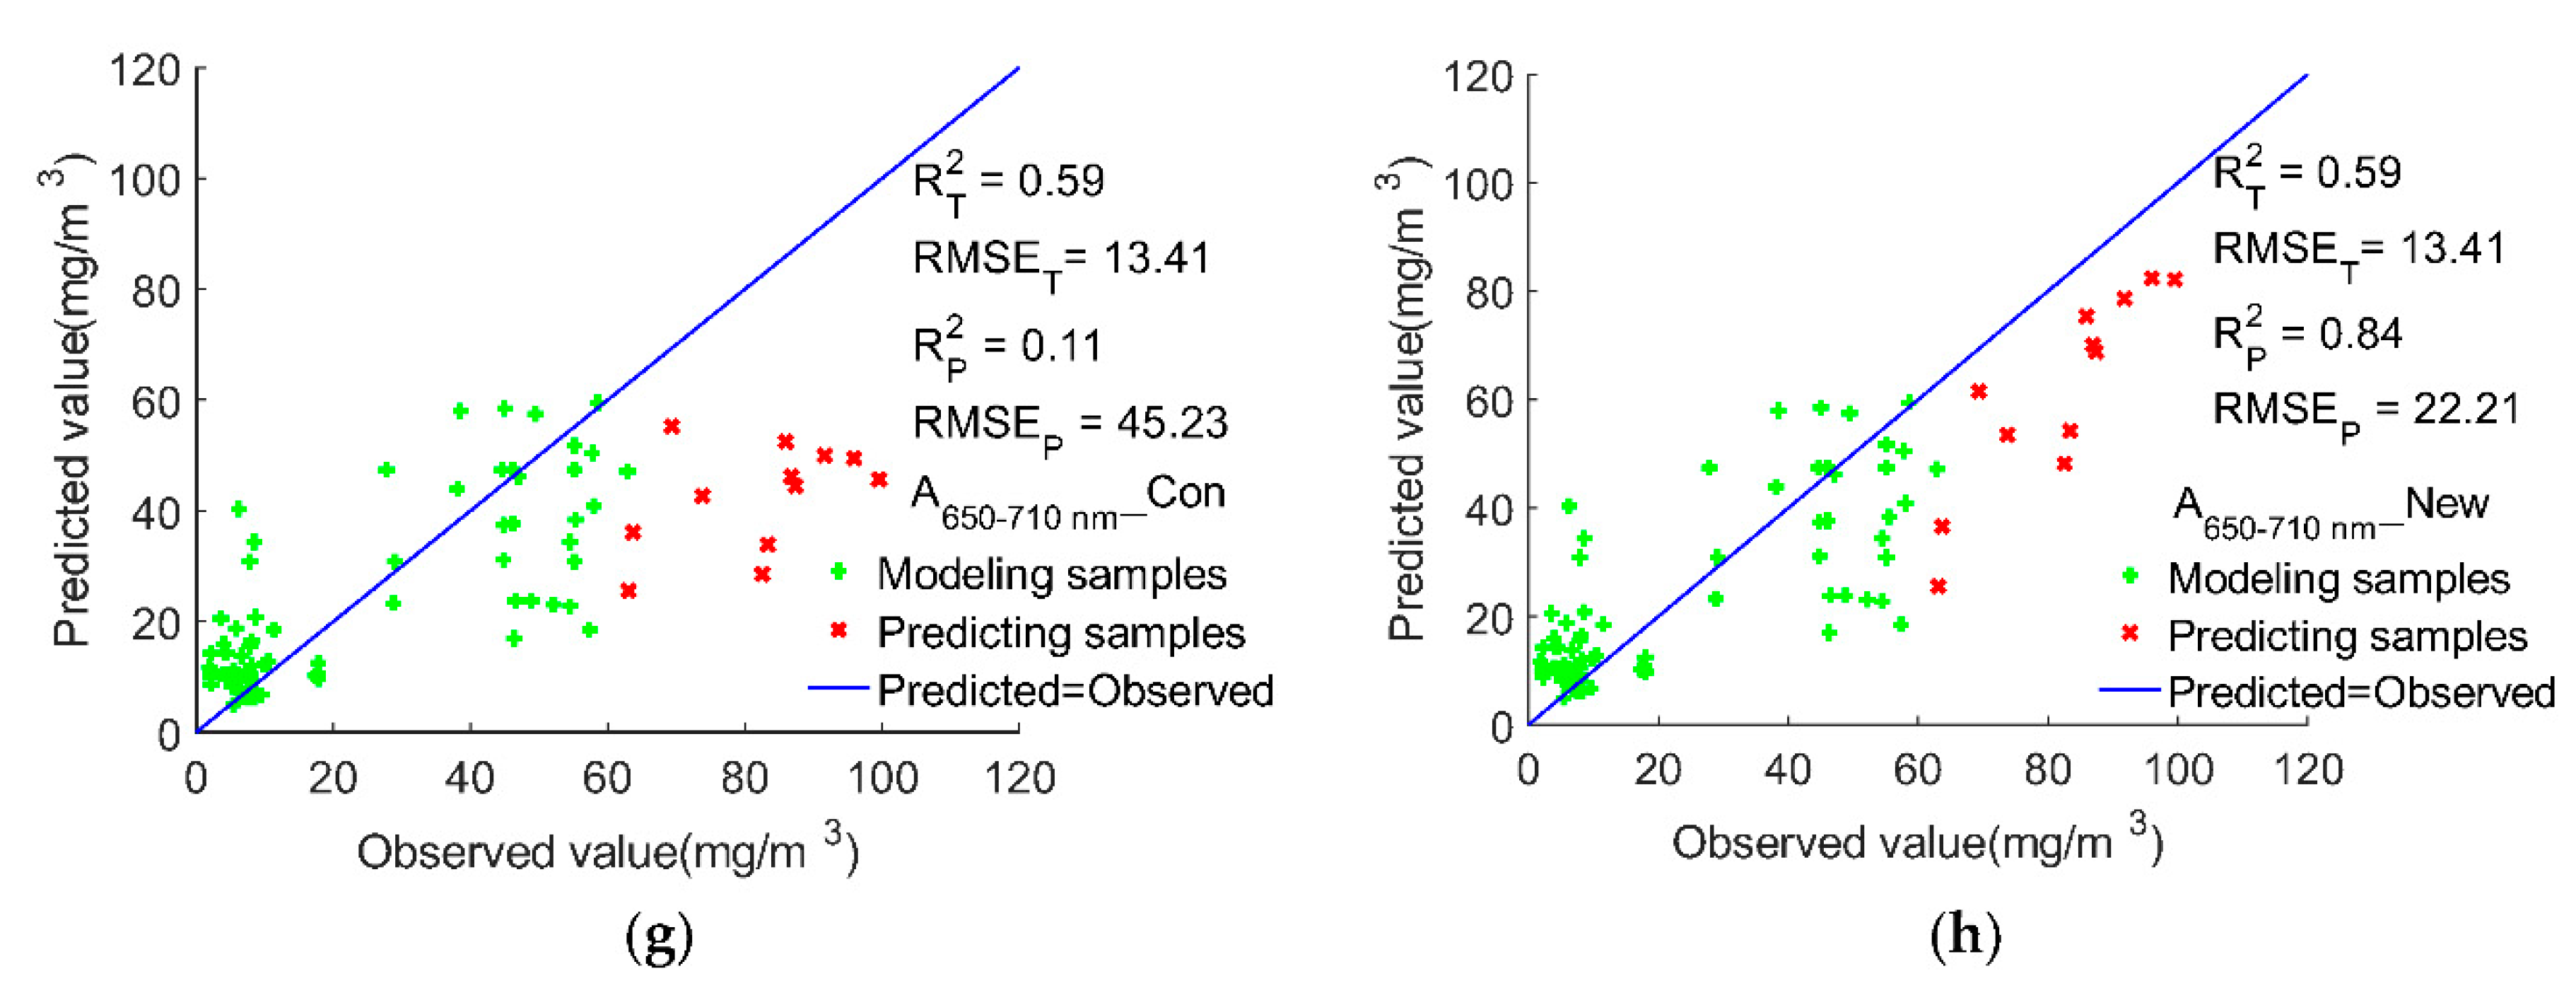
3.4. Model Performance Analysis under Different Processing Methods

In order to study the effect of the chlorophyll a model in inverting high-concentration samples under different pretreatment methods, the samples exceeding the critical value of severe eutrophication (63.03 mg/m3) were used as prediction samples, and the other samples were used as training samples. N1, DI, D650–710 nm, and A 650–710 nm are four spectral parameters that exhibited a good correlation with the chlorophyll concentration. Taking these four spectral parameters as input independent variables and the chlorophyll concentration under different preprocessing methods as the dependent variable, using linear regression method, eight chlorophyll a concentration inversion models were constructed. The inversion model included four conventional inversion models (N1_Con, DI_Con, D650–710 nm_Con, and A650–710 nm_Con) and four uncapped inversion models (N1_New, DI_New, D650–710 nm_New, and A650–710 nm_New). The performance of these models is shown in Table 2 and Figure 5.
As far as the RP2 is concerned, the values of the eight inversion models from large to small are as follows: D650–710 nm_New > A650–710 nm_ New > DI_New> N1_New > A650–710 nm_Con > DI_Con > N1_Con > D650–710 nm_Con. Among them, the average value of the inversion models of four uncapped methods was 0.83, and the average value of the inversion models of four conventional methods was 0.09. In terms of the RMSEP, the values of the eight inversion models from small to large are as follows: A650–710 nm_New < D650–710 nm_New < DI_New < N1_New < A650–710 nm_Con <DI_Con < D650–710 nm_Con < N1_Con. Among them, the average value of the four inversion models with the uncapped method was 24.88, and the average value of the four inversion models with the conventional method was 47.97. In summary, the inversion model of the uncapped method had a higher RP2, and a lower RMSEP than the conventional inversion model. This indicates that the performance of the uncapped inversion model was better than that of the conventional inversion model. In addition, it can be seen from Figure 5 that, in the conventional inversion model, the predicted value of high-concentration samples was much lower than the 1:1 line, indicating that the inversion model significantly underestimated the high-concentration samples. In the uncapped inversion model, the predicted value of high-concentration samples was close to the 1:1 line, indicating that, as compared with the conventional inversion model, the uncapped inversion model exhibited a greatly improved inversion performance for high-concentration samples.

3.5. Model Performance Analysis Taking into Account High-Concentration Samples and Spectral Absorption Characteristics

Herein, 70% of the samples were randomly selected as training samples and 30% of the samples were selected as prediction samples. In the decap mode, considering the spectral absorption characteristics, the chlorophyll concentration inversion models were established. The performance of each model is shown in Table 3. In order to study the performance of the envelope removal method in terms of retrieving the C h l - a concentration, this study used the envelope removal value and the original reflectance value as the inversion factors, and established stepwise regression models (ER_New and R_New) to retrieve the C h l - a concentration. It can be seen from Table 3 that, although the modeling effect of the R_New model (RT2 = 0.80, RMSET = 13.90) was slightly better than that of the ER_New model (RT2 = 0.78, RMSET = 14.89), the predictive capabilities of the ER_New model (RP2 = 0.79, RMSEP = 13.12) were much better than those of the R_New model (RP2 = 0.66, RMSEP = 16.61).
According to the correlation analysis result, the band with the largest positive correlation and the largest negative correlation was selected to establish the spectral index of the envelope removal value. Spectral indices (NI, DI, and RI) were used as independent variables, and linear regression models (NI_New, DI_New, and RI_New) were constructed to invert the C h l - a concentration. The predictive capabilities of the three models (NI_New(RP2 = 0.78, RMSEP = 17.20), DI_New(RP2 = 0.78, RMSEP = 13.64), RI_New (RP2 = 0.77, RMSEP = 13.64)) had little effect on the prediction.
The bands that were significantly related to the chlorophyll concentration and had a large correlation coefficient were mainly located in the three absorption valleys (400–580, 580–650, and 650–710 nm) of the envelope removal curve. In order to extract the absorption characteristic information of the water samples with different C h l - a concentrations in the three absorption valleys, MATLAB software was used to calculate the absorption depth (D) and the absorption valley area (A) of the three absorption valleys. Taking the absorption depth and absorption area of the three absorption valleys as independent variables, six linear regression models were constructed to invert the C h l - a concentration. The models included D400–580 nm_New, D580–650 nm_New, D650–710 nm_New, A400–580 nm_New, A580–650 nm_New, and A 650–710 nm_New. In terms of the predictive capabilities of the model, A650–710 nm_New (RP2 = 0.88, RMSEP = 13.46) was better than the other five models, followed by D650–710 nm_New (RP2 = 0.81, RMSEP = 12.80); D580–650 nm_New (RP2 = 0.58, RMSEP = 18.46) had the worst performance. Taking the spectral parameters with the best inversion effect (A650–710 nm) and the spectral parameters with better inversion results (D650–710 nm, NI, DI) as independent variables, three linear regression models were constructed to perform the chlorophyll concentration inversion. The models included A650–710 nm&D650–710 nm_New, A650–710 nm&NI_New, and A650–710 nm&DI_New. It was found that these three models had good predictive capabilities (A650–710 nm&D650–710 nm_New(RP2 = 0.81, RMSEP = 14.05), A650–710 nm&NI_New (RP2 = 0.83, RMSEP = 17.77), A 650–710 nm&DI_New(RP2 = 0.80, RMSEP = 15.25)).

4. Discussion

The envelope removal method has the advantage of suppressing the background spectrum and enhancing the weak absorption characteristic information. However, for second-class water bodies with a relatively complex water quality, there are few studies that focus on the inversion of the C h l - a concentration while considering the spectral absorption characteristic parameters. In addition, the current research on the inversion of the C h l - a concentration was carried out with a balanced sample concentration. For areas with a highly variable C h l - a concentration, it is still challenging to establish a C h l - a concentration inversion model with strong applicability and high accuracy. This study explored the possibility of retrieving the C h l - a concentration in high-concentration samples using spectral absorption characteristics. Its novelty lies in the pretreatment of high-concentration samples with large deviations using the capping method, and the extraction of the characteristic water spectrum absorption parameters using the envelope removal method. On the basis of the correlation analysis between the C h l - a concentration and the spectral absorption characteristics, the C h l - a concentration spectral inversion was performed. It provides an optimal solution for inversion modeling of the C h l - a concentration, which uses high concentration samples and spectral absorption characteristics.
The predictive capabilities of the ER_New model were significantly better than those of the R_New model, indicating that the envelope removal method can significantly amplify the absorption characteristics of the original spectrum, which can significantly improve the performance of the prediction model. The prediction models of the two absorption characteristic parameters (A650–710 nm_New and D650–710 nm_New) and the three combined models (A650–710 nm&D650–710 nm_New, A650–710 nm&NI_New, and A650–710 nm&DI_New) also demonstrated good predictive capabilities. This shows that using the spectral absorption feature to retrieve the C h l - a concentration is a feasible solution. This is similar to reports from previous studies. Peng, J. et al., in “Research on Inversion of Soil Salt Content Based on Continuum Removal Method”, found that the original reflectance after continuum removal processing can significantly improve the prediction performance of the inversion model [48]. Peng, X. et al., in “spectral inversion of soil parameters based on envelope removal and partial least squares”, reported that, as compared with the model established using the reflectance curve, the prediction ability of the model established using the envelope removal curve improved significantly [49]. Liu, X. et al., in “retrieving the moisture content of yellow cotton soil using the envelope elimination method”, observed that the spectral absorption characteristic parameters at 1900 nm have the best correlation with the soil moisture content. The logarithmic model established by the absorption area at 1900 nm is the best predictive model for the inversion of soil moisture content [50]. However, before this, the envelope removal method was not used to extract the characteristic spectral absorption parameters and carry out research focused on the hyperspectral inversion modeling of the C h l - a concentration in water bodies.
In view of the high variability of the C h l - a concentration in Dongting Lake, in this study, we constructed four conventional inversion models and four uncapped inversion models, and carried out a comparative study of model performance under different processing methods. The results show that the performance of the uncapped inversion model is better than that of the conventional inversion model. It shows that, in the Dongting Lake area where the C h l - a concentration has a high degree of variability, the decap method can significantly improve the generalization ability of outliers, and it is an effective and feasible pretreatment method. In this study, the critical severe eutrophication value was used as the decap standard; however, the decap standard should be based on achieving the best inversion performance. How to determine the standard is a question that needs to be considered in future research. In addition, this research is an uncapped study under the condition of known outliers. However, in hyperspectral remote sensing inversion research, outliers are the target of detection and are unknown. In lake areas with a high variability in C h l - a concentration, a study of the decap method that takes into account the autocorrelation characteristics of spatial data is required for the fast and accurate inversion of outliers.
Water spectrum characteristics are complex, regional, and seasonal, etc., which means that a single algorithm can only guarantee accuracy in a certain area. Limited experimental data lead to time and space limitations in the built model. If more sample data are used, this impact can be eliminated or weakened, so that the effectiveness of C h l - a concentration inversion modeling can be further analyzed and discussed.

5. Conclusions

Taking Dongting Lake in China as an example, this study uses high-concentration samples and spectral absorption characteristics to invert the C h l - a concentration. The decap method was used to preprocess high-concentration samples with large deviations, and the envelope removal method was used to extract the spectral absorption characteristic parameters of the water body. On the basis of the correlation analysis between the water C h l - a concentration and the spectral absorption characteristics, the water C h l - a concentration was inverted. The results showed that: (1) The bands that were significantly related to the C h l - a concentration and had a large correlation coefficient were mainly located in the three absorption valleys (400–580, 580–650, and 650–710 nm) of the envelope removal curve. Moreover, the correlation between the C h l - a concentration and the absorption characteristic parameters at 650–710 nm was better than that at 400–580 nm and 580–650 nm; (2) as compared with the conventional inversion model, the uncapped inversion model exhibited a higher RP2, a lower RMSEP, and was closer to the predicted value of the 1:1 line. The performance of the uncapped inversion model was better than that of the conventional inversion model, indicating that the uncapped method is an effective preprocessing method for high-concentration samples with large deviations; (3) the prediction effect of the ER_New model was significantly better than that of the R_New model. This indicates that the envelope removal method can significantly amplify the absorption characteristics of the original spectrum, which can significantly improve the performance of the prediction model; (4) among the inversion models of absorption characteristic parameters, the prediction models of A 650–710 nm_New and D 650–710 nm_New had the best performance. The three combined models (A 650–710 nm&D650–710 nm_New, A 650–710 nm&NI_New, A 650–710 nm&DI_New) also exhibited good predictive capabilities. This indicates that using the spectral absorption feature to retrieve the chlorophyll concentration is a feasible solution.

Author Contributions

Y.X. provided funding support. Y.-M.W. provided technical guidance. Y.X. and Z.-M.D. conceived the methodology. W.Z. and F.-L.L. participated in the revision. Y.X. performed the data processing and analysis and the writing of the paper. All authors have read and agreed to the published version of the manuscript.

Funding

This project was funded by the Open Fund of the Key Laboratory of Nonferrous Metal Mineralization Prediction and Geological Environment Monitoring (Central South University) of the Ministry of Education, grant number "2020YSJS12"; the Hunan Provincial Department of Science and Technology Project, grant number “2021JJ50155, 2019TP2079, 2018TP1042”; and the Hunan Provincial Department of Education Project, grant number “18C0836”.

Institutional Review Board Statement

Not applicable.

Informed Consent Statement

Not applicable.

Data Availability Statement

Not applicable.

Acknowledgments

The authors thank the environmental remote sensing team of Nanjing Normal University for their technical guidance. We thank the reviewers for their help in improving this manuscript.

Conflicts of Interest

The authors declare no conflict of interest.

References

  1. Lin, S.; Shen, S.; Zhou, A.; Lyu, H. Assessment and management of lake eutrophication: A case study in Lake Erhai, China. Sci. Total Environ. 2021, 751, 141618. [Google Scholar] [CrossRef]
  2. Downing, J.A.; Polasky, S.; Olmstead, S.M.; Newbold, S.C. Protecting local water quality has global benefits. Nat. Commun 2021, 12, 1–6. [Google Scholar] [CrossRef]
  3. Ayele, H.S.; Atlabachew, M. Review of characterization, factors, impacts, and solutions of Lake eutrophication: Lesson for lake Tana, Ethiopia. Environ. Sci. Pollut. Res. 2021, 28, 14233–14252. [Google Scholar] [CrossRef] [PubMed]
  4. Xue, Y.; Liu, F.; Liu, J.; Sun, Y. Annual variation characteristics of eutrophication in Dongting Lake, China. Proc. Inst. Civ. Eng. Water Manag. 2020, 173, 208–216. [Google Scholar] [CrossRef]
  5. Xue, Y.; Zhu, L.; Zou, B.; Wen, Y.; Long, Y.; Zhou, S. Research on Inversion Mechanism of Chlorophyll—A Concentration in Water Bodies Using a Convolutional Neural Network Model. Water 2021, 13, 664. [Google Scholar] [CrossRef]
  6. Liu, G.; Li, L.; Song, K.; Li, Y.; Lyu, H.; Wen, Z.; Fang, C.; Bi, S.; Sun, X.; Wang, Z.; et al. An OLCI-based algorithm for semi-empirically partitioning absorption coefficient and estimating chlorophyll a concentration in various turbid case-2 waters. Remote Sens. Environ. 2020, 239, 111648. [Google Scholar] [CrossRef]
  7. Guo, Y.; Huang, C.; Zhang, Y.; Li, Y.; Chen, W. A Novel Multitemporal Image-Fusion Algorithm: Method and Application to GOCI and Himawari Images for Inland Water Remote Sensing. IEEE Trans. Geosci. Remote Sens. 2020, 58, 4018–4032. [Google Scholar] [CrossRef]
  8. Zhang, F.; Li, J.; Yan, B.; Yu, J.; Wang, C.; Wang, S.; Shen, Q.; Wu, Y.; Zhang, B. Tracking historical chlorophyll-a change in the guanting reservoir, Northern China, based on landsat series inter-sensor normalization. Int. J. Remote Sens. 2021, 42, 3918–3937. [Google Scholar] [CrossRef]
  9. Huang, C.; Guo, Y.; Yang, H.; Li, Y.; Zou, J.; Zhang, M.; Lyu, H.; Zhu, A.; Huang, T. Using Remote Sensing to Track Variation in Phosphorus and Its Interaction with Chlorophyll-a and Suspended Sediment. IEEE J. Sel. Top. Appl. Earth Obs. Remote Sens. 2015, 8, 4171–4180. [Google Scholar] [CrossRef]
  10. Huang, C.; Zou, J.; Li, Y.; Yang, H.; Shi, K.; Li, J.; Wang, Y.; Chena, X.; Zheng, F. Assessment of NIR-red algorithms for observation of chlorophyll-a in highly turbid inland waters in China. ISPRS J. Photogramm. Remote Sens. 2014, 93, 29–39. [Google Scholar] [CrossRef]
  11. Huang, C.; Li, Y.; Wang, Q.; Lv, H.; Sun, D. Suspended particle matter and chlorophyll-a universal bio-optical retrieval model. J. Infrared Millim. Waves 2013, 32, 462–467. [Google Scholar] [CrossRef]
  12. Niroumand-Jadidi, M.; Bovolo, F.; Bruzzone, L. Water Quality Retrieval from PRISMA Hyperspectral Images: First Experience in a Turbid Lake and Comparison with Sentinel-2. Remote Sens. 2020, 12, 3984. [Google Scholar] [CrossRef]
  13. Greene, S.B.D.; LeFevre, G.H.; Markfort, C.D. Improving the spatial and temporal monitoring of cyanotoxins in Iowa lakes using a multiscale and multi-modal monitoring approach. Sci. Total Environ. 2021, 760, 143327. [Google Scholar] [CrossRef] [PubMed]
  14. Liu, Y.; Xiao, C.; Li, J.; Zhang, F.; Wang, S. Secchi Disk Depth Estimation from China’s New Generation of GF-5 Hyperspectral Observations Using a Semi-Analytical Scheme. Remote Sens. 2020, 12, 1849. [Google Scholar] [CrossRef]
  15. Yim, I.; Shin, J.; Lee, H.; Park, S.; Nam, G.; Kang, T.; Cho, K.H.; Cha, Y. Deep learning-based retrieval of cyanobacteria pigment in inland water for in-situ and airborne hyperspectral data. Ecol. Indic. 2020, 110, 105879. [Google Scholar] [CrossRef]
  16. Li, W.; Dou, Z.; Cui, L.; Wang, R.; Zhao, Z.; Cui, S.; Lei, Y.; Li, J.; Zhao, X.; Zhai, X. Suitability of hyperspectral data for monitoring nitrogen and phosphorus content in constructed wetlands. Remote Sens. Lett. 2020, 11, 495–504. [Google Scholar] [CrossRef]
  17. Kim, G.; Baek, I.; Stocker, M.D.; Smith, J.E.; Van Tassell, A.L.; Qin, J.; Chan, D.E.; Pachepsky, Y.; Kim, M.S. Hyperspectral Imaging from a Multipurpose Floating Platform to Estimate Chlorophyll-aConcentrations in Irrigation Pond Water. Remote Sens. 2020, 12, 2070. [Google Scholar] [CrossRef]
  18. Pahlevan, N.; Smith, B.; Binding, C.; Gurlin, D.; Li, L.; Bresciani, M.; Giardino, C. Hyperspectral retrievals of phytoplankton absorption and chlorophyll-a in inland and nearshore coastal waters. Remote Sens. Environ. 2021, 253, 112200. [Google Scholar] [CrossRef]
  19. Gai, Y.; Yu, D.; Zhou, Y.; Yang, L.; Chen, C.; Chen, J. An Improved Model for Chlorophyll-a Concentration Retrieval in Coastal Waters Based on UAV-Borne Hyperspectral Imagery: A Case Study in Qingdao, China. Water 2020, 12, 2769. [Google Scholar] [CrossRef]
  20. Guo, J.; Zhang, J.; Xiong, S.; Zhang, Z.; Wei, Q.; Zhang, W.; Feng, W.; Ma, X. Hyperspectral assessment of leaf nitrogen accumulation for winter wheat using different regression modeling. Precis. Agric. 2021, 22, 1634–1658. [Google Scholar] [CrossRef]
  21. Zhang, T.; Tian, B.; Wang, Y.; Liu, D.; Sun, S.; Duan, Y.; Zhou, Y. Quantifying seasonal variations in microphytobenthos biomass on estuarine tidal flats using Sentinel-1/2 data. Sci. Total Environ. 2021, 777, 146051. [Google Scholar] [CrossRef]
  22. Gao, W.; Yang, K.; Chen, G.; Li, Y.; Han, Q.; Wu, B. Discrimination of heavy metal crop contamination using measurements of leaf spectra. Remote Sens. Lett. 2021, 12, 278–285. [Google Scholar] [CrossRef]
  23. Han, Y.; Liu, H.; Zhang, X.; Yu, Z.; Meng, X.; Kong, F.; Song, S.; Han, J. Prediction Model of Rice Panicles Blast Disease Degree Based on Canopy Hyperspectral Reflectance. Spectrosc. Spectr. Anal. 2021, 41, 1220–1226. [Google Scholar]
  24. Pfitzner, K.; Bartolo, R.; Whiteside, T.; Loewensteiner, D.; Esparon, A. Hyperspectral Monitoring of Non-Native Tropical Grasses over Phenological Seasons. Remote Sens. 2021, 13, 738. [Google Scholar] [CrossRef]
  25. Mao, Y.; Liu, J.; Cao, W.; Ding, R.; Fu, Y.; Zhao, Z. Research on the quantitative inversion model of heavy metals in soda saline land based on visible-near-infrared spectroscopy. Infrared Phys. Technol. 2021, 112, 103602. [Google Scholar] [CrossRef]
  26. Han, A.; Lu, X.; Qing, S.; Bao, Y.; Bao, Y.; Ma, Q.; Liu, X.; Zhang, J. Rapid Determination of Low Heavy Metal Concentrations in Grassland Soils around Mining Using Vis-NIR Spectroscopy: A Case Study of Inner Mongolia, China. Sensors 2021, 21, 3220. [Google Scholar] [CrossRef]
  27. Qi, Y.; Qie, X.; Qin, Q.; Shukla, M.K. Prediction of soil calcium carbonate with soil visible-near-infrared reflection (Vis-NIR) spectral in Shaanxi province, China: Soil groups vs. spectral groups. Int. J. Remote Sens. 2021, 42, 2502–2516. [Google Scholar] [CrossRef]
  28. Zhou, W.; Yang, H.; Xie, L.; Li, H.; Huang, L.; Zhao, Y.; Yue, T. Hyperspectral inversion of soil heavy metals in Three-River Source Region based on random forest model. Catena 2021, 202, 105222. [Google Scholar] [CrossRef]
  29. Tshabalala, T.; Abdel-Rahman, E.M.; Masemola, C.; Ncube, B.; Ndhlala, A.R.; Mutanga, O. Predicting medicinal phytochemicals of Moringa oleifera using hyperspectral reflectance of tree canopies. Int. J. Remote Sens. 2021, 42, 3955–3980. [Google Scholar] [CrossRef]
  30. Ou, D.; Tan, K.; Lai, J.; Jia, X.; Wang, X.; Chen, Y.; Li, J. Semi-supervised DNN regression on airborne hyperspectral imagery for improved spatial soil properties prediction. Geoderma 2021, 385, 114875. [Google Scholar] [CrossRef]
  31. Fu, Y.; Yang, G.; Song, X.; Li, Z.; Xu, X.; Feng, H.; Zhao, C. Improved Estimation of Winter Wheat Aboveground Biomass Using Multiscale Textures Extracted from UAV-Based Digital Images and Hyperspectral Feature Analysis. Remote Sens. 2021, 13, 581. [Google Scholar] [CrossRef]
  32. Guimarães, T.T.; Veronez, M.R.; Koste, E.C.; Gonzaga, L.; Bordin, F.; Inocencio, L.C.; Larocca, A.P.C.; de Oliveira, M.Z.; Vitti, D.C.; Mauad, F.F. An Alternative Method of Spatial Autocorrelation for Chlorophyll Detection in Water Bodies Using Remote Sensing. Sustainability 2017, 9, 416. [Google Scholar] [CrossRef] [Green Version]
  33. Na, Z.; Yao, H.; Chen, H.; Wei, Y.; Wen, K.; Huang, Y.; Liao, P. Retrieval and Evaluation of Chlorophyll-A Spatiotemporal Variability Using GF-1 Imagery: Case Study of Qinzhou Bay, China. Sustainability 2021, 13, 4649. [Google Scholar] [CrossRef]
  34. Hou, P.; Luo, Y.; Yang, K.; Shang, C.; Zhou, X. Changing Characteristics of Chlorophyll a in the Context of Internal and External Factors: A Case Study of Dianchi Lake in China. Sustainability 2019, 11, 7242. [Google Scholar] [CrossRef] [Green Version]
  35. Dou, Z.; Cui, L.; Li, J.; Zhu, Y.; Gao, C.; Pan, X.; Lei, Y.; Zhang, M.; Zhao, X.; Li, W. Hyperspectral Estimation of the Chlorophyll Content in Short-Term and Long-Term Restorations of Mangrove in Quanzhou Bay Estuary, China. Sustainability 2018, 10, 1127. [Google Scholar] [CrossRef] [Green Version]
  36. Gupana, R.S.; Odermatt, D.; Cesana, I.; Giardino, C.; Nedbal, L.; Damm, A. Remote sensing of sun-induced chlorophyll-a fluorescence in inland and coastal waters: Current state and future prospects. Remote Sens Env. 2021, 262, 112482. [Google Scholar] [CrossRef]
  37. Chen, J.; Chen, S.; Fu, R.; Wang, C.; Li, D.; Peng, Y.; Wang, L.; Jiang, H.; Zheng, Q. Remote Sensing Estimation of Chlorophyll-A in Case-II Waters of Coastal Areas: Three-Band Model Versus Genetic Algorithm-Artificial Neural Networks Model. IEEE J. Sel. Top. Appl. Earth Obs. Remote Sens. 2021, 14, 3640–3658. [Google Scholar] [CrossRef]
  38. Zhao, X.; Xu, H.; Ding, Z.; Wang, D.; Deng, Z.; Wang, Y.; Wu, T.; Li, W.; Lu, Z.; Wang, G. Comparing deep learning with several typical methods in prediction of assessing chlorophyll-a by remote sensing: A case study in Taihu Lake, China. Water Supply 2021. [Google Scholar] [CrossRef]
  39. Kupssinsku, L.S.; Guimaraes, T.T.; de Souza, E.M.; Zanotta, D.C.; Veronez, M.R.; Gonzaga, L., Jr.; Mauad, F.F. A Method for Chlorophyll-a and Suspended Solids Prediction through Remote Sensing and Machine Learning. Sensors 2020, 20, 2125. [Google Scholar] [CrossRef] [Green Version]
  40. Shin, Y.; Kim, T.; Hong, S.; Lee, S.; Lee, E.; Hong, S.; Lee, C.; Kim, T.; Park, M.S.; Park, J.; et al. Prediction of Chlorophyll-aConcentrations in the Nakdong River Using Machine Learning Methods. Water 2020, 12, 1822. [Google Scholar] [CrossRef]
  41. Mamun, M.; Kim, J.; Alam, M.A.; An, K. Prediction of Algal Chlorophyll-a and Water Clarity in Monsoon-Region Reservoir Using Machine Learning Approaches. Water 2020, 12, 30. [Google Scholar] [CrossRef] [Green Version]
  42. Saberioon, M.; Brom, J.; Nedbal, V.; Soucek, P.; Cisar, P. Chlorophyll-a and total suspended solids retrieval and mapping using Sentinel-2A and machine learning for inland waters. Ecol. Indic. 2020, 113, 106236. [Google Scholar] [CrossRef]
  43. Pahlevan, N.; Smith, B.; Schalles, J.; Binding, C.; Cao, Z.; Ma, R.; Alikas, K.; Kangro, K.; Gurlin, D.; Nguyen, H.; et al. Seamless retrievals of chlorophyll-a from Sentinel-2 (MSI) and Sentinel-3 (OLCI) in inland and coastal waters: A machine-learning approach. Remote Sens. Environ. 2020, 240, 111604. [Google Scholar] [CrossRef]
  44. Chen, F.; Lu, S.; Deng, Y.; Feng, C.; Chen, N.; Guo, H. Different forms of phosphorous transformation and release prediction with environment factor in sediments from Lake Dongting, China. Desalination Water Treat. 2021, 214, 402–412. [Google Scholar] [CrossRef]
  45. Shang, W.; Jin, S.; He, Y.; Zhang, Y.; Li, J. Spatial-Temporal Variations of Total Nitrogen and Phosphorus in Poyang, Dongting and Taihu Lakes from Landsat-8 Data. Water 2021, 13, 1704. [Google Scholar] [CrossRef]
  46. Zhao, S.; Zhang, B.; Zhou, N. Effects of Redox Potential on the Environmental Behavior of Nitrogen in Riparian Zones of West Dongting Lake Wetlands, China. Wetlands 2020, 40, 1307–1316. [Google Scholar] [CrossRef]
  47. ISO International Organization for Standardization ISO/TC 147/SC 6. Guidance on Sampling from Lakes, Natural and Man-Made; International Organization for Standardization: Geneva, Switzerland, 2016. [Google Scholar]
  48. Peng, J.; Chi, C.; Xiang, H.; Teng, H.; Shi, Z. Research on Inversion of Soil Salt Content Based on Continuum Removal Method. Acta Pedol. Sin. 2014, 51, 459–469. [Google Scholar]
  49. Peng, X.; Gao, W.; Wang, J. Spectral inversion of soil parameters based on envelope removal and partial least squares. J. Wuhan Univ. Inf. Sci. Ed. 2014, 39, 862–866. [Google Scholar]
  50. Liu, X.; Wang, L.; Chang, Q.; Song, R. Inversion of Water Content in Loessial Soil Using Envelope Elimination Method. J. Wuhan Univ. Inf. Sci. Ed. 2017, 42, 661–668. [Google Scholar]
Figure 1. Location of sampling points in Dongting Lake.
Sustainability 13 12144 g001
Figure 2. Reflectance curve of water samples with different C h l - a concentrations.
Sustainability 13 12144 g002
Figure 3. Envelope removal curve of water samples with different C h l - a concentrations.
Sustainability 13 12144 g003
Figure 4. The correlation curve between C h l - a concentration and envelope removal. Note: The red “+” indicates a significant correlation at the 0.05 level (bilateral).
Sustainability 13 12144 g004
Figure 5. Comparison of inversion results under different processing methods: (a) NI_ Con; (b) NI_ New; (c) DI_ Con; (d) DI_ New; (e) D650–710 nm_Con; (f) D650–710 nm_ New; (g) A650–710 nm_Con; (h) A650–710 nm_ New.
Sustainability 13 12144 g005aSustainability 13 12144 g005b
Table 1. Correlation between C h l - a concentration and absorption characteristic parameters.
Absorption Characteristic ParametersD400–580 nmD580–650 nmD650–710 nmA400–580 nmA580–650 nmA650–710 nm
C h l - a concentration0.63 **0.60 **0.73 **0.59 **0.62 **0.76 **
Note: D400–580 nm represents the depth of the absorption valley (400–580 nm), A400–580 nm represents the area of the absorption valley (400–580 nm), the others are similar. “**” denotes a significant correlation at the 0.01 level (two-sided).
Table 2. The performance of each model under different processing methods.
Spectral ParametersPretreatment MethodModel AliasRT2RMSETRP2RMSEP
N1ConventionN1_Con0.5014.830.0949.09
N1NewNI_New0.5014.830.7926.24
DIConventionDI_Con0.5014.770.1048.70
DINewDI_New0.5014.770.8225.72
D650–710 nmConventionD650–710 nm_Con0.6312.700.0748.86
D650–710 nmNewD650–710 nm_New0.6312.700.8525.33
A650–710 nmConventionA650–710 nm_Con0.5913.410.1145.23
A650–710 nmNewA650–710 nm_New0.5913.410.8422.21
Table 3. The inversion results of each model in uncapped mode.
Spectral ParametersModel AliasRT2RMSETRP2RMSEP
RR_New0.8013.900.6616.61
ERER_New0.7814.890.7913.12
NINI_New0.6616.350.7817.20
DIDI_New0.6917.400.7813.64
RIRI_New0.6618.340.7713.64
D400–580 nmD400–580 nm_New0.6617.790.7016.97
D580–650 nmD580–650 nm_New0.6618.590.5818.46
D650–710 nmD650–710 nm_New0.7615.390.8112.80
A400–580 nmA400–580 nm_New0.6817.840.6219.42
A580–650 nmA580–650 nm_New0.6219.430.7315.47
A650–710 nmA 650–710 nm_New0.7115.130.8813.46
D650–710 nm, A650–710 nmA650–710 nm&D650–710 nm_New0.7614.750.8114.05
NI, A650–710 nmA650–710 nm&NI_New0.7713.330.8317.77
DI, A650–710 nmA650–710 nm&DI_New0.7614.250.8015.25
Publisher’s Note: MDPI stays neutral with regard to jurisdictional claims in published maps and institutional affiliations.

