Article

Sustainability & CSR: The Relationship with Hofstede Cultural Dimensions

1
Gabelli School of Business, Roger Williams University, Bristol, RI 02809, USA
2
Finance & Information Management, Augsburg University, 86159 Augsburg, Germany
3
School of Health Administration, Texas State University, San Marcos, TX 78666, USA
4
School of Business, Western New England University, Springfield, MA 01119, USA
*
Author to whom correspondence should be addressed.
Sustainability 2021, 13(21), 12052; https://doi.org/10.3390/su132112052
Submission received: 2 October 2021 / Revised: 25 October 2021 / Accepted: 25 October 2021 / Published: 1 November 2021

Abstract

:
This research explores the relationship between Hofstede’s femininity cultural dimension of quality of life and the masculinity cultural dimension of drive for success manifested by materialistic wealth by investigating the market value of the publicly traded firms appearing on the Dow Jones Sustainability Indices (DJSIs). The firms added to the DJSIs between the years 2010–2019 in countries with the femininity cultural dimension indicated by scores of ≤42, were selected for the first part of this study. In addition, France, with a masculinity score of 43 and Japan, with the highest masculinity score of 92, were chosen for comparison with the results from the countries with the femininity cultural dimension. The findings of this study indicate that companies in developed and emerging countries with the femininity cultural dimension show significant positive impact on their market values when added to the DJSIs. The publicly traded firms in France show a significant negative impact on their market values when added to the DJSIs. On the other hand, Japanese companies on the addition lists of DJSIs show a significant positive impact on their market values, despite Japan having the highest Hofstede masculinity score, a potential sign of cultural change in Japan.

1. Introduction

Numerous studies have utilized Hofstede’s cultural dimensions [1,2] to examine different nations [3,4,5,6,7]. These studies have investigated different aspects of Hofstede’s cultural dimensions, such as the individualistic versus collectivist dimensions [4,7], and uncertainty avoidance [8]. Meanwhile, other studies [9] have researched the relationship between culture, corporate social responsibility (CSR), and impact on a firm’s performance.
Investigating the relationship between the impact on the market values of the firms that adopt sustainability strategies to achieve a net-zero carbon emission economy and enhancing the health and the welfare of communities has been the focus of several studies [10,11,12,13,14,15]. The Dow Jones sustainability indices (DJSIs) that report the engagement of corporations in sustainability practices along the social, economic, and environmental dimensions started more than twenty years ago. These indices have been used in different studies to explore the extent of engagement in socially responsible sustainability practices [16,17,18,19]. Our research is novel in this area by utilizing Hofstede’s femininity and masculinity cultural dimensions to explore the relationship between the market values of the publicly traded firms when adopting socially responsible sustainability strategies manifested by appearance on the Dow Jones Sustainability Indices.

2. Literature Review and Research Goals

2.1. Studies on Hofstede Cultural Dimensions

Different studies have examined the relationship between culture and CSR [9] or the relationship between CSR among different groups of investors [18] and their impact on a firm’s performance. According to Shi and Veenstra [9], there is a strong relationship between the cultural aspects of a country (e.g., individualism), CSR, and performance of the firms in that country [9]. The findings of their study indicate that in countries with Hofstede’s collectivist cultural dimension, the shareholders value the engagement of the firms in socially responsible strategies indicated by positive impact on the financial performance of such companies. However, such an impact was not found in the countries that indicated Hofstede’s individualistic cultural dimension [9].
Meanwhile, Lee et al. [18] studied different groups of investors and their reactions when the firms appeared on the DJSI in South Korea. The findings of their study indicate that governmental campaigns regarding CSR and appearance on the DSJI did not increase the market value of the firms [18].
This research explores the relationship between appearance of the firms on the DJSIs, the impact of the market value of the firms, and Hofstede’s femininity and masculinity cultural dimensions. Based on Hofstede’s cultural theories, countries with low masculinity scores of ≤42 are considered cultures associated with attention to the quality of life [20]. The adoption of sustainability strategies by different companies can enhance the health and the welfare and subsequently the quality of life in the communities around them. As a result, firms that adopt socially responsible strategies and contribute to enhancing the quality of life, as demonstrated by appearing on the Dow Jones Sustainability Indices, should be rewarded by increased stock prices upon the release of such news in the countries with the femininity cultural dimension.
On the other hand, in the countries with masculinity scores of 43 and above, materialistic wealth is appreciated [20]. According to research exploring the relationship between the appearance of the firms on the DJSIs and the market value of such firms, investors may perceive the implementation of sustainability strategies to be costly to these companies [14,21]. Consequently, companies in countries with the masculinity cultural dimension and appreciation for materialistic wealth [22] should experience negative impacts on their market value when added to the DJSIs due to the stockholders’ assumption that such strategies would be costly to the firm.

2.2. Research Goals

To investigate the relationship between the appearance of firms on the DJSIs and market value, this research selected companies that were added to the DJSIs between the years 2010 to 2019 in countries with Hofstede’s masculinity scores of ≤42, indicative of the femininity cultural dimension. The first proposal to be examined is delineated below:
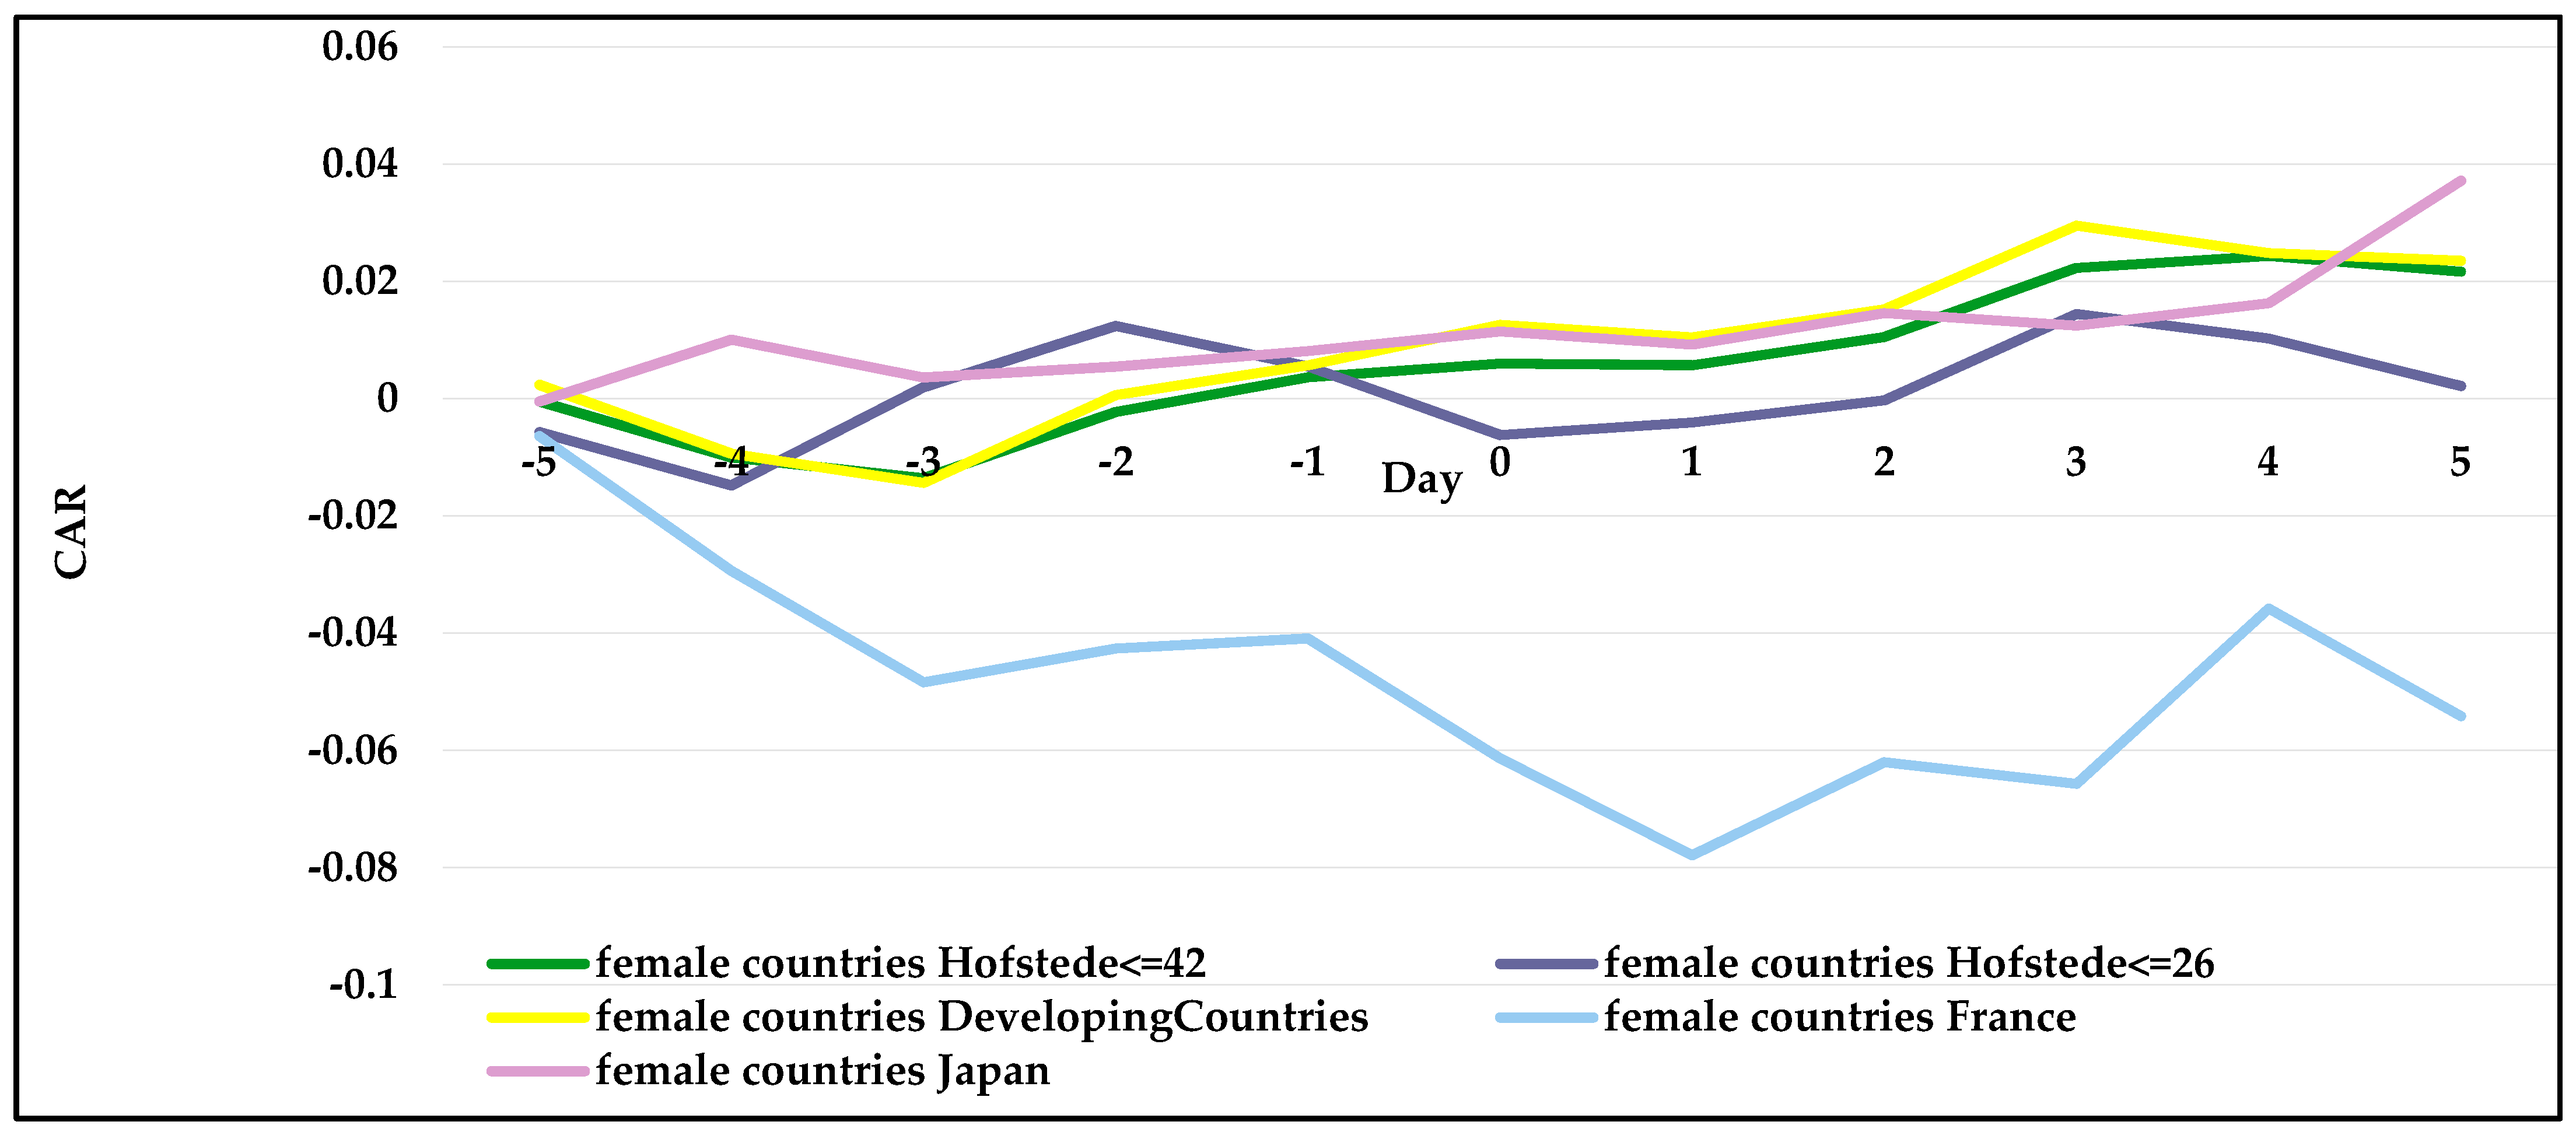
  • There is a significant positive relationship between the market value of publicly traded companies and appearance on the DJSIs in countries characterized with the femininity cultural dimension (Hofstede’s masculinity score of ≤42).
This study investigated this proposal by examining the list of countries with the femininity cultural dimension whose companies have been added to the Dow Jones Sustainability Indices between the years 2010–2019 include European and also emerging countries.
The second proposal of this research considers the strict sustainability rules and regulations delineated by Paris Accord [23] and the European Union’s net-zero carbon emission goals [24]. As a result, the second proposal compares the addition of the European publicly traded firms to the DJSIs and the impact on their market values versus other listed companies from emerging countries. This proposal is presented below:
2.
Publicly traded companies added to the DJSIs between the years 2010–2019 from the corresponding European countries with the femininity cultural dimension are expected to see a higher significant positive impact on their market value compared to listed companies from the corresponding emerging countries.
To further explore the differences between countries with the femininity cultural dimension and the countries with the masculinity cultural dimension, firms in two more countries were added to this research, France and Japan. France, with a masculinity score of 43, is considered halfway between the masculinity and femininity cultural dimensions. Japan, with the highest masculinity score of 92 is assumed to have the highest appreciation for material wealth. The proposals to be explored in this part of the research include:
3.
There is a mixed significant negative or positive relationship between the market value of publicly traded French companies and their appearance on the DJSIs in France, a country with a Hofstede’s masculinity score of 43, halfway between the femininity and masculinity cultural dimensions.
4.
There is a significant negative relationship between the market value of publicly traded Japanese companies and appearance on the DJSIs in Japan, a country with the highest Hofstede’s masculinity score of 92.

3. Methodology

3.1. Selected Countries

Hofstede Insights web site [25] was used to identify countries with a masculinity score of 42 and below, which comprise the countries with the femininity cultural dimension. During the years 2010–2019, the Dow Jones Sustainability Indices for the World, Europe, Asia Pacific, Korea, Emerging Markets, and MILA (Mercado Integrado Latinamericano) Pacific Alliance, were used to identify the companies that appeared on these lists in countries with the masculinity score of ≤42. As a result, we identified ten countries. Table 1 presents the list of these countries.
As indicated in Table 1, there are ten countries on the DJSIs that fit the definition of countries with the femininity cultural dimension. Seven of these countries are located in Europe, with the northern European countries indicating the lowest masculinity scores (5–26). Portugal (31) and Spain (42) are the other European countries on the list. All the European countries on the above list have signed the Paris Accord and, with the exception of Norway, all of them are members of the European Union. The rest of the countries on this list are from Latin America and Asia and are considered emerging countries. They include Chile (28), South Korea (39), and Thailand (34).
Table 2 presents the companies in the European countries on Table 1 that appeared on the DJSI World and DJSI Europe during the years 2010–2019.
Table 3 presents the list of the companies from the emerging countries with the femininity cultural dimension (scores of ≤42) on the Dow Jones Sustainability addition lists during the years 2010–2019. The indices included DJSI World, DJSI Korea, DJSI Asia Pacific, DJSI MILA Pacific Alliance, and DJSI Emerging Markets.
Table 4 presents the French companies on the Dow Jones Sustainability addition lists collected from DJSI Europe and DJSI World during the years 2010–2019.
Table 5 presents the Japanese companies on the Dow Jones Sustainability lists, DJSI World, and DJSI Asia Pacific, during the years 2010–2019.

3.2. Statistical Analyses

Studies on the information released in the capital markets and the impacts on the stock prices of the companies have often utilized event study methods [26,27,28,29]. According to these studies, a firm’s value can be examined based on the new available information in the capital markets. Utilizing event study, one can investigate the impact on a firms’ stock price of the release of such information within short windows of time [29]. As a result, event study can indicate the positive impact on the abnormal rate of returns (ARRs) when the released information is considered beneficial, or it can show negative abnormal rate of returns when the market assumes that the released information is harmful [30]. The market model is often utilized to estimate ARRs [31,32]. The market model allows for the calculation of the correlation between stock price and expected or normal return on or around a window of time when specific information (the event) is released to capital markets [31,32]. The market model uses a short window before the event and assesses the abnormal returns (AR) on the stock. In addition, a short window is used after the event to allow for the calculation of the abnormal rate of returns (ARRs), which is the return due to the new information about the company (i.e., event), the cumulative abnormal returns (CAR), and cumulative average abnormal returns (CAARs) [31,32].
This research utilizes event study to explore the impact of addition to the Dow Jones Sustainability Indices on the companies’ stock prices in the European countries presented in Table 2 and in the emerging countries presented in Table 3. Since France is halfway between the femininity and masculinity cultural dimensions with a score of 43, the French companies presented in Table 4 are also examined. Furthermore, the Japanese companies that were added to the DJSIs during the years 2010–2019 (Table 5) are also examined, and the results are compared with the companies in the countries with the femininity cultural dimension (Table 2 and Table 3).
All stock prices of the companies under the study were taken from the corresponding country’s stock market exchanges and currency within the years 2010–2019. The stock market exchanges for collecting the European stock prices included DJSI World and DJSI Europe. The currencies for the European countries included Norwegian Krone, Danish Krone, Swedish Krona, and for the rest, Euro. For South Korea, the currency used for the statistical analyses was the Won, and for Chile, the Chilean Peso. This information was collected from the corresponding stock market exchanges: DJSI Korea, DJSI Asia Pacific, DJSI MILA Pacific Alliance, DJSI World, and DJSI Emerging Markets. For Thailand, we had to use the Singapore dollar for one company (Thai Beverage), but the rest of the Thai companies’ stock prices were evaluated with Thai Baht. For France, DJSI World and DJSI Europe with Euro as the currency comprised the data. For Japan, DJSI World and DJSI Asia Pacific were used to collect the data with Japanese Yen as the currency.

4. Results

In order to investigate the impact of the addition to the DJSI lists for the countries with the femininity cultural dimensions, event study was utilized. Stock prices, within windows starting at most 10 days before and ending at most 10 days after the event, were investigated to evaluate the cumulative abnormal returns (CARs) for firms in the countries with Hofstede masculinity score of ≤42. Table 6 and Figure 1 present the results of this part of the study.
As presented in Table 6 and Figure 1, the event study using a symmetric 10-day event window [−10, 10] shows that addition to the DJSIs result in a positive impact on the cumulative abnormal returns (CARs) after the announcement for the companies in countries with the femininity cultural dimension. As indicated in Table 6 and Figure 1, this impact is more pronounced from 1–7 days after the announcement date.
In the event study, CAARs were compared to the expected market model and then evaluated for statistically significant indicators. Simple t-tests were conducted to evaluate the significance of the findings. Table 7 is the event study analysis for four different windows: [−10, 10], [−2, 2], [−5, 5], and [−1, 1].
As indicated in Table 7, the announcement of the addition to the DJSIs has a significant positive impact on the cumulative average abnormal returns (CAARs) of the companies in countries with femininity cultural dimension for [−2, 2] and [−5, 5] windows.
The results of this part of the research indicate support for Proposal 1 of this study. There was a significant positive relationship between the market values of the publicly traded companies and their appearance on the Dow Jones Sustainability Indices in the countries characterized with the femininity cultural dimension by having the masculinity score of ≤42. Based on these results, there was a significant increase in the stock prices of the companies when they were added to the Dow Jones Sustainability Indices in the countries with femininity cultural dimension. These results provide further support for Hofstede’s concept that the countries with low masculinity scores value quality of life that is manifested in this study by rewarding the companies that adopt socially responsible strategies with the potential of enhancing the health and the welfare of the communities.
In the following event study analysis, the impact of the addition of the companies to the DJSIs on the cumulative abnormal returns (CARs) for the developed countries (The Netherlands, Spain, Sweden, Norway, Denmark, Finland) were compared with those in emerging countries (South Korea, Chile, Thailand). Table 8 and Table 9 and Figure 2 and Figure 3 present the results of this part of the study. There was only one company from Portugal during the years 2010–2019 that was added to the DJSI, but the company was privately held and thus excluded from further analysis.
As presented in Table 8 and Table 9 and Figure 2 and Figure 3, the event study using a symmetric 10-day event window [−10, 10] shows that addition to the DJSIs for the companies in developed countries with the femininity cultural dimension results in a positive impact on cumulative abnormal returns on day 1 after the announcement date. However, for companies added to the DJSIs in emerging countries with the femininity cultural dimension, this impact was more pronounced on day 2 after the announcement date. In both instances, the positive impact continued through day 7 after the announcement date.
To provide support for the results of the event study presented in Table 8 and Table 9, a market model analysis was conducted. The results are presented in Table 10 and Table 11.
As indicated in Table 10, the results of the model market study for companies added to the DJSIs in the developed countries support the event study results shown in Table 8. The announcement of addition to the DJSIs has a significant positive impact on the cumulative abnormal returns of companies (CAARs) in the developed countries with masculinity score of ≤42 for the windows [−2, 2] and [−5, 5] as indicated by (**) in Table 10. However, as presented in Table 11, the results of the market model analysis for the companies added to the DJSIs in emerging countries indicate that addition to the DJSIs creates a significant positive impact on the cumulative average abnormal return for a shorter period of time of up to 2 days after the announcement date as indicated by (**). Proposal 2 of this study investigated if the studied firms in European countries with the femininity cultural dimension would show a higher significant positive impact on their market values than the listed companies from corresponding emerging countries. The results of this part of the study indicate that the companies on the Dow Jones Sustainability Indices from the listed developed countries show a significant positive impact on their market values when they appear on the DJSIs. The companies on the DJSIs from the listed emerging countries also show a significant positive impact on their market values, but for a shorter period of time. Again, these results provide support for Hofstede’s concept regarding countries with the femininity cultural dimension appreciating quality of life. Based on the above results, stockholders in such countries appear to reward the adoption of socially responsible practices by their home companies that have the potential of enhancing quality of life, as indicated by higher stock prices when added to the DJSIs.
The next part of the study concentrates on Proposal 3 to investigate if there is a mixed significant negative or positive relationship between the market value of publicly traded French companies and appearance on the DJSIs in France. France, with its Hofstede’s masculinity score of 43, is considered halfway between the femininity and masculinity cultural dimensions. Table 12 and Figure 4 present the daily cumulative abnormal returns (CARs) for French companies that were added to the Dow Jones Sustainability Indices during the years 2010–2019.
As indicated in Table 12 and Figure 4, the daily cumulative abnormal returns (CARs) indicate that the French companies that are added to the Dow Jones Sustainability Indices experience negative impacts on their stock prices. In order to strengthen the above findings, market model analysis was also conducted on these data. Table 13 indicates the results of this part of the research.
As presented in Table 13, the results of the model market analysis for the French companies that were added to the Dow Jones Sustainability Indices during the years 2010–2019 show a prolonged significant negative impact on their market value within the [−1, 1] to [−10, 10] windows indicated by (*, ***).
Proposal 3 of this study was to explore the notion that France, being half-way between the femininity and masculinity cultural dimensions with a score of 43, shows a mixed reaction to companies that adopt the sustainability practices. However, the results of the statistical analyses do not support this proposal. The appearance of the French companies on the Dow Jones Sustainability Indices shows a significant negative and prolonged impact on the market value of such firms. These results are interesting, considering that France is a member of the European Union and it is where the Paris Accord was signed.
The following part of the study concentrated on the Japanese companies and Proposal 4 of this research. This proposal investigated whether there was a significant negative relationship between the market value of the publicly traded Japanese companies and appearance on the DJSIs in Japan, with the highest Hofstede’s masculinity score of 92. Table 14 shows the results of the event study for the daily cumulative abnormal returns (CARs) for the Japanese companies that were added to the Dow Jones Sustainability Indices from 2010 through 2019.
As indicated in Table 14 and Figure 5, Japanese companies show positive impacts on their market value when added to the Dow Jones Sustainability Indices. To further investigate these results, a market model analysis was again conducted. The results are presented in Table 15.
The results presented in Table 15 support the findings indicated in Table 14 and Figure 5. Japanese companies indicate higher and longer significant positive impacts on their market value when they are added to the Dow Jones Sustainability Indices, as indicated by (*, **, ***). The results of the above statistical analyses do not support Proposal 4 of this study. Japan, with the highest masculinity score of 92 should show a significant negative relationship between the market value of the publicly traded companies and appearance on the DJSIs. However, the results do not support such relationship. It is interesting to note that there are more Japanese companies (49) on the DJSI lists during the years 2010–2019 than any country with the femininity cultural dimension. In addition, the impact on the market value of the Japanese companies is significantly positive and more prolonged than in the other studied companies on the DJSI lists in the countries with the femininity cultural dimension.
To create a visualization of the findings of this study, we plotted the calculated CARs. These calculated CARs depict companies in the sample data in the European, emerging countries, France, and Japan. Figure 6 shows the results.
Figure 6 provides a visual representation of the calculated CARs in this study. French CARs, represented by the blue line, show a negative impact on their market value when appearing on the DJSIs. The green line indicates calculated CARs for the companies in countries with the femininity cultural dimension (masculinity score of ≤42). The green line shows that these companies experience positive impacts on their market value within the [−5, 5] announcement window. The purple line represents the calculated CARs for companies in the northern European countries with a very low masculinity score (≤26). The purple line shows a positive impact on their market value when added to the DJSIs within the [−5, 5] announcement window. As discussed before, companies in emerging markets with the femininity cultural dimension also show positive impact on their market value when added to the DJSIs, as represented by the yellow line, similar to the Northern European countries. The results of this study for the Northern European countries are supported by other studies [33] that Scandinavian countries and their companies are at forefront in CSR and sustainability practices.
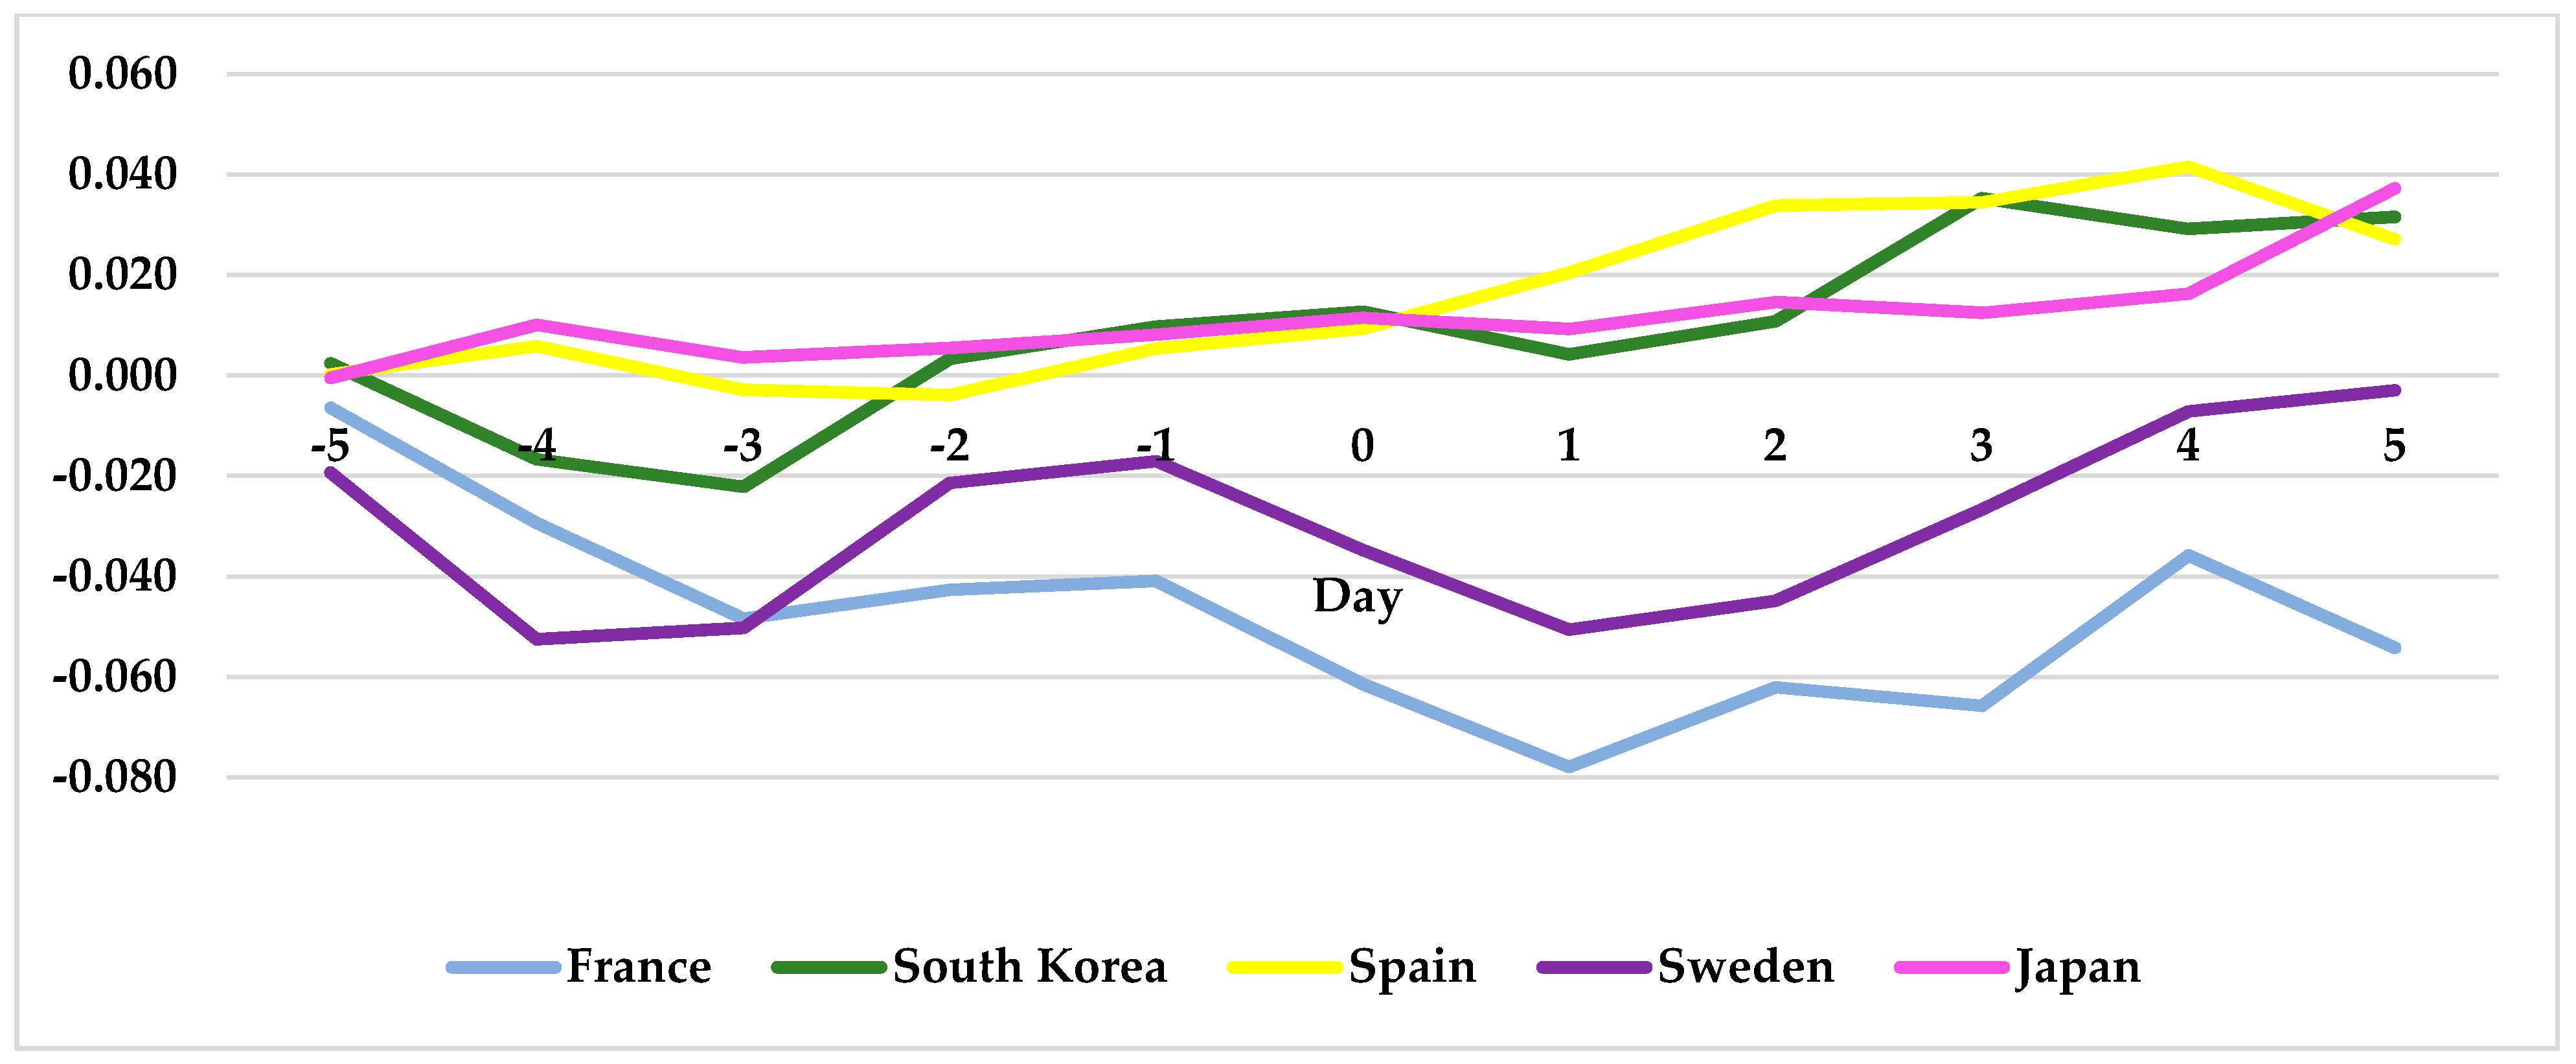
  • To further investigate the results indicated in Figure 6, France was compared with countries having Hofstede’s masculinity scores close to 43, but within the femininity cultural dimension, Spain (42) and South Korea (39). In addition, Sweden, with the lowest masculinity score (5), and Japan, with highest masculinity score (92), were included. Figure 7 shows a visualization of this comparison.
In Figure 7, the blue line, representing French companies’ CARs, shows a negative impact on market value when appearing on the DJSIs, while companies in Spain (yellow line) and South Korea (green line) show a positive impact on their market value when added to the DJSIs. The same is true for Swedish companies, with Sweden having the lowest masculinity score. Meanwhile, Japanese companies, with Japan having the highest masculinity score, indicate a positive impact on their market value when added to the DJSIs. Figure 7 supports the visualization presented in Figure 6.
  • As mentioned before, the interesting finding of the study is that Japanese companies, as indicated by the pinkish line in Figure 6 and Figure 7, show a positive impact on their market value when added to the DJSIs. This is an indication that the Japanese cultural dimension has shifted. Based on research [34], investors need to be more involved and engaged in interactive relationships with firms in order to value and understand their CSR and sustainability strategies.

5. Conclusions

The global attention to the sustainability practices is evident by UNESCO’s sustainability goals [35] and also the Paris Accord, which has been signed by 197 countries to date [23]. These goals emphasize enhancing the health and the welfare of living species, the physical environment, reduction of greenhouse gases (GHG), and the implementation of socially responsible and sustainability strategies across the activity cost chain of companies. As a result, getting the involvement of the companies in implementation of CSR and sustainability strategies is essential to enhancing the quality of life across the globe.
In this study, we selected Hofstede’s femininity cultural dimension and explored the notion that countries with a low masculinity cultural dimension care for quality of life more than materialistic wealth. The results of the statistical analyses of this research indicate that countries with the femininity cultural dimension do reward the companies that invest in socially responsible strategies that can enhance the quality of life. These findings support of Hofstede’s concept regarding a positive relationship between countries with the femininity cultural dimension and respect for quality of life.
An interesting finding is the impact on the market value of the French companies when they appear on the Dow Jones Sustainability Indices. France, with a Hofstede masculinity score of 43, is considered to be halfway between the masculinity and femininity cultural dimensions. However, based on our findings, when French companies are added to the DJSIs, their market value is significantly and negatively affected, indicative of a fully masculine cultural dimension. As a result, the concern for materialistic wealth associated with Hofstede’s masculinity cultural dimension manifests itself strongly in France. Considering that France is a member of the European Union and that the net-zero carbon emission economy goal is to be achieved by the year 2050 [24], it is interesting that, based on these findings, stockholders do not appreciate the adoption of sustainability strategies by the French companies.
Another interesting finding of this study is the attitude of stockholders of Japanese companies that appear on the DJSI lists. Based on Hofstede’s masculinity score, Japan, with the highest masculinity score, should demonstrate more preference for materialistic wealth than quality of life. However, it appears that Japanese stockholders appreciate the adoption of socially responsible strategies by Japanese companies as manifested by the most significant, positive, and prolonged impact on their stock prices among all the studied companies and countries in this research.
Future research in this area can include exploring the cultural changes in different countries, the impact of global agreements on appreciation of CSR and enhancing quality of life, and education of stakeholders and the populations of different countries concerning corporate social responsibility and the implementation of sustainability practices by different companies. In addition, we included the highest masculinity cultural dimension country, Japan, in our research and the results of the study indicated cultural change. Future research should include other countries with masculinity cultural dimension to examine any changes in the cultural aspects of such countries.

Author Contributions

Conceptualization: M.T.; methodology: M.T., A.R., L.F., B.S.; software and formal analysis: A.R., M.T., B.S.; investigation: M.T.; resources: M.T., A.R., L.F., B.S.; writing—original draft preparation: M.T.; writing—review and editing: M.T., A.R., L.F., B.S.; visualization: M.T., A.R.; supervision & project administration: M.T., A.R., L.F. All authors have read and agreed to the published version of the manuscript.

Funding

This research received no external funding.

Institutional Review Board Statement

Not applicable.

Informed Consent Statement

Not applicable.

Data Availability Statement

Not applicable.

Conflicts of Interest

The authors declare no conflict of interest.

References

  1. Hofstede, G. Motivation, leadership, and organization: Do American theories apply abroad? Organ. Dyn. 1980, 9, 42–63. [Google Scholar] [CrossRef]
  2. Hofstede, G. What did GLOBE really measure? Researchers’ minds versus respondents’ minds. J. Int. Bus. Stud. 2006, 37, 882–896. [Google Scholar] [CrossRef] [Green Version]
  3. Beugelsdijk, S.; Kostova, T.; Roth, K. An overview of Hofstede-inspired country-level culture research in international business since 2006. J. Int. Bus. Stud. 2017, 48, 30–47. [Google Scholar] [CrossRef] [Green Version]
  4. Kim, K.I.; Park, H.-J.; Suzuki, N. Reward allocations in the United States, Japan, and Korea: A comparison of individualistic and collectivistic cultures. Acad. Manag. J. 1990, 33, 188–198. [Google Scholar]
  5. Nelson, M.R.; Brunel, F.F.; Supphellen, M.; Manchanda, R.V. Effects of Culture, Gender, and Moral Obligations on Responses to Charity Advertising Across Masculine and Feminine Cultures. J. Consum. Psychol. 2006, 16, 45–56. [Google Scholar] [CrossRef]
  6. Sørnes, J.-O.; Stephens, K.K.; Sætre, A.S.; Browning, L.D. The reflexivity between ICTs and business culture: Applying Hofstede’s theory to compare Norway and the United States. Inf. Sci. J. 2004, 7, 1–30. [Google Scholar]
  7. Venaik, S.; Brewer, P. Avoiding uncertainty in Hofstede and GLOBE. J. Int. Bus. Stud. 2010, 41, 1294–1315. [Google Scholar] [CrossRef]
  8. Brewer, P.; Venaik, S. Individualism–Collectivism in Hofstede and GLOBE. J. Int. Bus. Stud. 2011, 42, 436–445. [Google Scholar] [CrossRef]
  9. Shi, W.; Veenstra, K. The Moderating Effect of Cultural Values on the Relationship between Corporate Social Performance and Firm Performance. J. Bus. Ethics 2021, 174, 89–107. [Google Scholar] [CrossRef]
  10. Ates, S. Membership of sustainability index in an emerging market: Implications for sustainability. J. Clean. Prod. 2020, 250, 119465. [Google Scholar] [CrossRef]
  11. Durand, R.; Paugam, L.; Stolowy, H. Do investors actually value sustainability indices? Replication, development, and new evidence on CSR visibility. Strat. Manag. J. 2019, 40, 1471–1490. [Google Scholar] [CrossRef]
  12. Hawn, O.; Chatterji, A.K.; Mitchell, W. Do investors actually value sustainability? New evidence from investor reactions to the Dow Jones Sustainability Index (DJSI). Strat. Manag. J. 2018, 39, 949–976. [Google Scholar] [CrossRef]
  13. De Santis, P.; Albuquerque, A.; Lizarelli, F. Do sustainable companies have a better financial performance? A study on Brazilian public companies. J. Clean. Prod. 2016, 133, 735–745. [Google Scholar] [CrossRef]
  14. Schmutz, B.; Tehrani, M.; Fulton, L.; Rathgeber, A. Dow Jones Sustainability Indices, Do They Make a Difference? The U.S. and the European Union Companies. Sustainability 2020, 12, 6785. [Google Scholar] [CrossRef]
  15. Zhao, X.; Murrell, A.J. Revisiting the corporate social performance-financial performance link: A replication of Waddock and Graves. Strat. Manag. J. 2016, 37, 2378–2388. [Google Scholar] [CrossRef]
  16. Cheung, A.W.K. Do Stock Investors Value Corporate Sustainability? Evidence from an Event Study. J. Bus. Ethics 2010, 99, 145–165. [Google Scholar] [CrossRef]
  17. Cheung, A.; Wai, K.; Roca, E. The effect on price, liquidity and risk when stocks are added to and deleted from a sustainability index: Evidence from the Asia Pacific context. J. Asian Econ. 2013, 24, 51–65. [Google Scholar] [CrossRef] [Green Version]
  18. Lee, S.; Kim, I.; Hong, C.-H. Who Values Corporate Social Responsibility in the Korean Stock Market? Sustainability 2019, 11, 5924. [Google Scholar] [CrossRef] [Green Version]
  19. Searcy, C.; Elkhawas, D. Corporate sustainability ratings: An investigation into how corporations use the Dow Jones Sustainability Index. J. Clean. Prod. 2012, 35, 79–92. [Google Scholar] [CrossRef]
  20. Hofstede, G. Cultural differences in teaching and learning. Int. J. Intercult. Relat. 1986, 10, 301–320. [Google Scholar] [CrossRef]
  21. Yilmaz, M.K.; Aksoy, M.; Tatoglu, E. Does the Stock Market Value Inclusion in a Sustainability Index? Evidence from Borsa Istanbul. Sustainability 2020, 12, 483. [Google Scholar] [CrossRef] [Green Version]
  22. Hofstede, G.; Bond, M.H. Hofstede’s culture dimensions: An independent validation using Rokeach’s value survey. J. Cross-Cult. Psychol. 1984, 15, 417–433. [Google Scholar] [CrossRef]
  23. Climate Focus. The Paris Agreement Summary 2015. 2015. Available online: https://climatefocus.com/sites/default/files/20151228%20COP%2021%20briefing%20FIN.pdf (accessed on 1 September 2021).
  24. 2050 Long-Term Strategy 2020. 2020. Available online: https://ec.europa.eu/clima/policies/strategies/2050_en (accessed on 1 September 2021).
  25. Hostede Insights 2021. 2021. Available online: https://www.hofstede-insights.com/product/virtual-certification-in-organisational-culture-2021-1/ (accessed on 1 September 2021).
  26. Brown, S.J.; Warner, J.B. Using daily stock returns: The case of event studies. J. Financ. Econ. 1985, 14, 3–31. [Google Scholar] [CrossRef]
  27. Kothari, S.; Warner, J.B. Econometrics of Event Studies**We thank Espen Eckbo, Jon Lewellen, Adam Kolasinski, and Jay Ritter for insightful comments, and Irfan Safdar and Alan Wancier for research assistance. In Handbook of Empirical Corporate Finance; Elsevier BV: Amsterdam, The Netherlands, 2007; pp. 3–36. [Google Scholar]
  28. Kothari, S.P.; Warner, J.B. The Econometrics of Event Studies. 2006. Available online: https://www.bu.edu/econ/files/2011/01/KothariWarner2.pdf (accessed on 1 September 2021).
  29. MacKinlay, A.C. Event studies in economics and finance. J. Econ. Lit. 1997, 35, 13–39. [Google Scholar]
  30. Chan, W.S. Stock price reaction to news and no-news: Drift and reversal after headlines. J. Financ. Econ. 2003, 70, 223–260. [Google Scholar] [CrossRef]
  31. Brown, S.; Warner, J.B. Measuring security price performance. J. Financ. Econ. 1980, 8, 205–258. [Google Scholar] [CrossRef]
  32. Campbell, J.Y.; Lo, A.W.; MacKinlay, A.C. Event-Study Analysis, The Econometrics of Financial Markets; Princeton University Press: Princeton, NJ, USA, 1997. [Google Scholar]
  33. Strand, R.; Freeman, R.E.; Hockerts, K. Corporate social responsibility and sustainability in Scandinavia: An overview. J. Bus. Ethics 2015, 127, 1–15. [Google Scholar] [CrossRef] [Green Version]
  34. Hockerts, K.; Moir, K. Communicating corporate responsibility to investors: The changing role of the investor relations function. J. Bus. Ethics 2004, 52, 85–98. [Google Scholar] [CrossRef]
  35. UNESCO. UNESCO and Sustainable Development Goals 2019. 2019. Available online: https://en.unesco.org/sustainabledevelopmentgoals (accessed on 1 September 2021).
Figure 1. Daily cumulative abnormal returns (CARs) around the announcement date [−10, 10] for the companies added to the DJSIs for countries with Hofstede masculinity scores of ≤42.
Sustainability 13 12052 g001
Figure 2. Daily cumulative abnormal returns (CARs) around the announcement date [−10, 10] for the companies added to the DJSI in the developed countries with Hofstede’s masculinity score of ≤42, 2010–2019.
Sustainability 13 12052 g002
Figure 3. Daily cumulative abnormal returns (CARs) around the announcement date [−10, 10] for companies added to the DJSIs in the emerging countries with Hofstede’s masculinity score of ≤42, 2010–2019.
Sustainability 13 12052 g003
Figure 4. Results of the daily abnormal returns around the announcement date [−10, 10] for the French companies added to the Dow Jones Sustainability Indices, 2010–2019.
Sustainability 13 12052 g004
Figure 5. Results of the daily abnormal returns around the announcement date [−10, 10] for Japanese companies added to the Dow Jones Sustainability Indices, 2010–2019.
Sustainability 13 12052 g005
Figure 6. CARs representing the companies on the DJSIs in the sample data [−1, 1] to [−5, 5], 2010–2019.
Sustainability 13 12052 g006
Figure 7. CARs representing the French, Swedish, South Korean, and Japanese companies on the DJSIs in the sample data [−1, 1] to [−5, 5], 2010–2019.
Sustainability 13 12052 g007
Table 1. Countries with masculinity score of ≤42, indicating femininity cultural dimension, 2010–2019.
CountryMasculinity Cultural Score
Sweden5
Norway8
The Netherlands14
Denmark16
Finland26
Chile28
Portugal 31
Thailand34
South Korea39
Spain42
Table 2. List of the companies on the Dow Jones Sustainability addition lists and their corresponding European countries with the femininity cultural dimension (scores of ≤42), 2010–2019.
eIndexCompanyCountry
2010DJSI WorldAegon N.V.The Netherlands
2010DJSI EuropeAegon N.V.The Netherlands
2010DJSI EuropeRoyal KPN N.V.The Netherlands
2010DJSI EuropePortugal Telecom SGPS S/APortugal
2010DJSI WorldGamesa Corporacion Tecnologica S.A.Spain
2010DJSI WorldRed Electrica Corp. S.ASpain
2011DJSI EuropeOrkla ASA Norway
2011DJSI EuropeAtlas Copco ABSweden
2011DJSI EuropeSvenska Cellulosa AB Sweden
2012DJSI EuropeUPM-Kymmene OYJFinland
2012DJSI EuropeAegon NVThe Netherlands
2012DJSI EuropeKoninklijke Ahold NVThe Netherlands
2012DJSI EuropeTelenor ASANorway
2012DJSI EuropeAmadeus IT Holding SASpain
2012DJSI WorldHennes & Mauritz ABSweden
2013DJSI WorldING Groep NVThe Netherlands
2013DJSI EuropeASML Holding NVThe Netherlands
2013DJSI EuropeING Groep NVThe Netherlands
2013DJSI WorldTelefonica SASpain
2014DJSI WorldTelefonica SASpain
2015DJSI WorldTelefonica SASpain
2016DJSI EuropeNovo Nordisk A/SDenmark
2016DJSI EuropeIberdrola SA Spain
2017DJSI WorldASML Holding NVThe Netherlands
2018DJSI WorldBanco Bilbao Vizcaya Argentaria SASpain
2018DJSI EuropeBanco Bilbao Vizcaya Argentaria SASpain
2018DJSI EuropeEssity ABSweden
2019DJSI EuropeTelfonaktiebolaget LM EricssonSweden
Table 3. The list of the companies on the Dow Jones Sustainability addition lists and their associated emerging countries with the femininity cultural dimension (scores of ≤42), 2010–2019.
YearIndexCompanyCountry
2010DJSI WorldKT&G Corp.S. Korea
2011DJSI WorldHyundai Mobis Co. Ltd. S. Korea
2011DJSI KoreaHynix Semiconductor Inc. S. Korea
2011DJSI KoreaSamsung Engineering Co. Ltd. S. Korea
2011DJSI KoreaSamsung Heavy Industries Co. Ltd. S. Korea
2012DJSI KoreaHanjin Shipping Co Ltd.S. Korea
2012DJSI KoreaKCC Corp.S. Korea
2012DJSI KoreaSamsung Life Insurance Co Ltd.S. Korea
2012DJSI Asia PacificSamsung Life Insurance Co Ltd.S. Korea
2013DJSI WorldShinhan Financial Group Co Ltd.S. Korea
2013DJSI KoreaHanwha Chemical Corp.S. Korea
2013DJSI KoreaLG Household & Health Care Ltd.S. Korea
2013DJSI KoreaSamsung C&T Corp.S. Korea
2013DJSI Asia PacificSamsung Fire & marine Insurance Co Ltd.S. Korea
2015DJSI Emerging MarketsSACI FalabellaChile
2015DJSI Emerging MarketsAdvanced Info Service PCLThailand
2016DJSI Emerging MarketsKasikornbank PCL Thailand
2016DJSI Emerging MarketsThai Beverage PCL Thailand
2017DJSI WorldSamsung Electronics Co Ltd.S. Korea
2017DJSI Asia PacificSamsung Electronics Co Ltd.S. Korea
2017DJSI Emerging MarketsCP ALL PCLThailand
2018DJSI MILA Pacific Alliance Enel Americas SAChile
2018DJSI MILA Pacific Alliance Enel Chile SAChile
2018DJSI MILA Pacific Alliance Inversiones La Construccion SAChile
2018DJSI Emerging MarketsEnel Americas SAChile
Table 4. French companies on the Dow Jones Sustainability addition lists, 2010–2019.
Year.IndexCompanyCountry
2010DJSI EuropeKlepierre S.A.France
2011DJSI WorldSchneider Electric S.A France
2011DJSI WorldSociete Generale S.A France
2011DJSI EuropeAlcatel-Lucent France
2011DJSI EuropeAlstom S.A France
2011DJSI EuropeSociete Generale S.A. France
2013DJSI EuropeKeringFrance
2013DJSI EuropeLVMH-Moët Hennessy Louis Vuitton SAFrance
2013DJSI EuropeSociete Generale SAFrance
2015DJSI WorldGDF SuezFrance
2015DJSI WorldSociete Generale SAFrance
2015DJSI WorldVinci SAFrance
2015DJSI EuropeBNP Paribas SAFrance
2015DJSI EuropeSanofiFrance
2015DJSI EuropeSociete Generale SAFrance
2016DJSI WorldEssilor International SA France
2016DJSI EuropeEssilor International SAFrance
2016DJSI EuropeTOTAL SAFrance
2017DJSI EuropeCapgeminiSA France
2019DJSI EuropeBNP Paribas SAFrance
2019DJSI EuropeSanofiFrance
Table 5. Japanese companies on the Dow Jones Sustainability addition lists, 2010–2019.
YearIndexCompanyCountry
2010DJSI WorldNippon Yusen K.KJapan
2010DJSI Asia PacificSeiko Epson Corp.Japan
2010DJSI Asia PacificYokogawa Electric Corp.Japan
2011DJSI Asia PacificAsahi Glass Co. Ltd.Japan
2011DJSI Asia PacificAstellas Pharma Inc.Japan
2011DJSI Asia PacificItochu Corp.Japan
2011DJSI Asia PacificMitsubishi Corp.Japan
2011DJSI Asia PacificMitsubishi Estate Co. Ltd.Japan
2011DJSI Asia PacificMitsubishi UFJ Financial Group Inc.Japan
2011DJSI Asia PacificNTT DoCoMo Inc.Japan
2011DJSI Asia PacificSumitomo Mitsui Trust Holdings Inc.Japan
2012DJSI Asia PacificJSR Corp.Japan
2012DJSI Asia PacificKirin Holdings Co Ltd.Japan
2012DJSI Asia PacificNitto Denko Corp.Japan
2012DJSI Asia PacificSysmex Corp.Japan
2012DJSI Asia PacificTokyu Land Corp.Japan
2013DJSI WorldITOCHU Corp.Japan
2013DJSI Asia/PacificDaiwa House Industry Co Ltd.Japan
2013DJSI Asia/PacificEisai Co Ltd.Japan
2013DJSI Asia/PacificInpex Corp.Japan
2013DJSI Asia/PacificITOCHU Corp.Japan
2013DJSI Asia/PacificSumitomo Electric Industries Ltd.Japan
2015DJSI WorldMitsubishi Corp.Japan
2015DJSI WorldNomura Holdings Inc.Japan
2015DJSI Asia PacificHonda Motor Co Ltd.Japan
2015DJSI Asia PacificMizuho Financial GroupJapan
2015DJSI Asia PacificTerumo Corp.Japan
2016DJSI WorldBridgestone Corp.Japan
2016DJSI WorldNissan Motor Co Ltd.Japan
2016DJSI Asia PacificFast Retailing Co Ltd.Japan
2016DJSI Asia PacificMitsui & Co Ltd.Japan
2016DJSI Asia PacificMS&AD Insurance Group Japan Holdings Inc.Japan
2016DJSI Asia PacificNTT DOCOMO Inc.Japan
2016DJSI Asia PacificTokyo Electron Ltd.Japan
2017DJSI WorldHonda Motor Co Ltd.Japan
2017DJSI WorldNTT Docomo Inc.Japan
2017DJSI Asia PacificKubota Corp.Japan
2017DJSI Asia PacificMitsubishi Heavy Industries Ltd.Japan
2017DJSI Asia PacificSekisui House Ltd.Japan
2018DJSI WorldNippon Telegraph & Telephone Corp.Japan
2018DJSI Asia PacificChugai Pharmaceutical Co Ltd.Japan
2018DJSI Asia PacificRicoh Co Ltd.Japan
2018DJSI Asia PacificTokio Marine Holdings Inc.Japan
2019DJSI WorldTakeda Pharmaceutical Co Ltd.Japan
2019DJSI Asia PacificEisai Co Ltd.Japan
2019DJSI Asia PacificMeiji Holdings Co Ltd.Japan
2019DJSI Asia PacificOlympus Corp.Japan
2019DJSI Asia PacificRecruit Holdings Co Ltd.Japan
Table 6. Daily cumulative abnormal returns (CARs) around the announcement dates for companies added to the DJSI in countries with Hofstede masculinity scores of ≤42, 2010–2019.
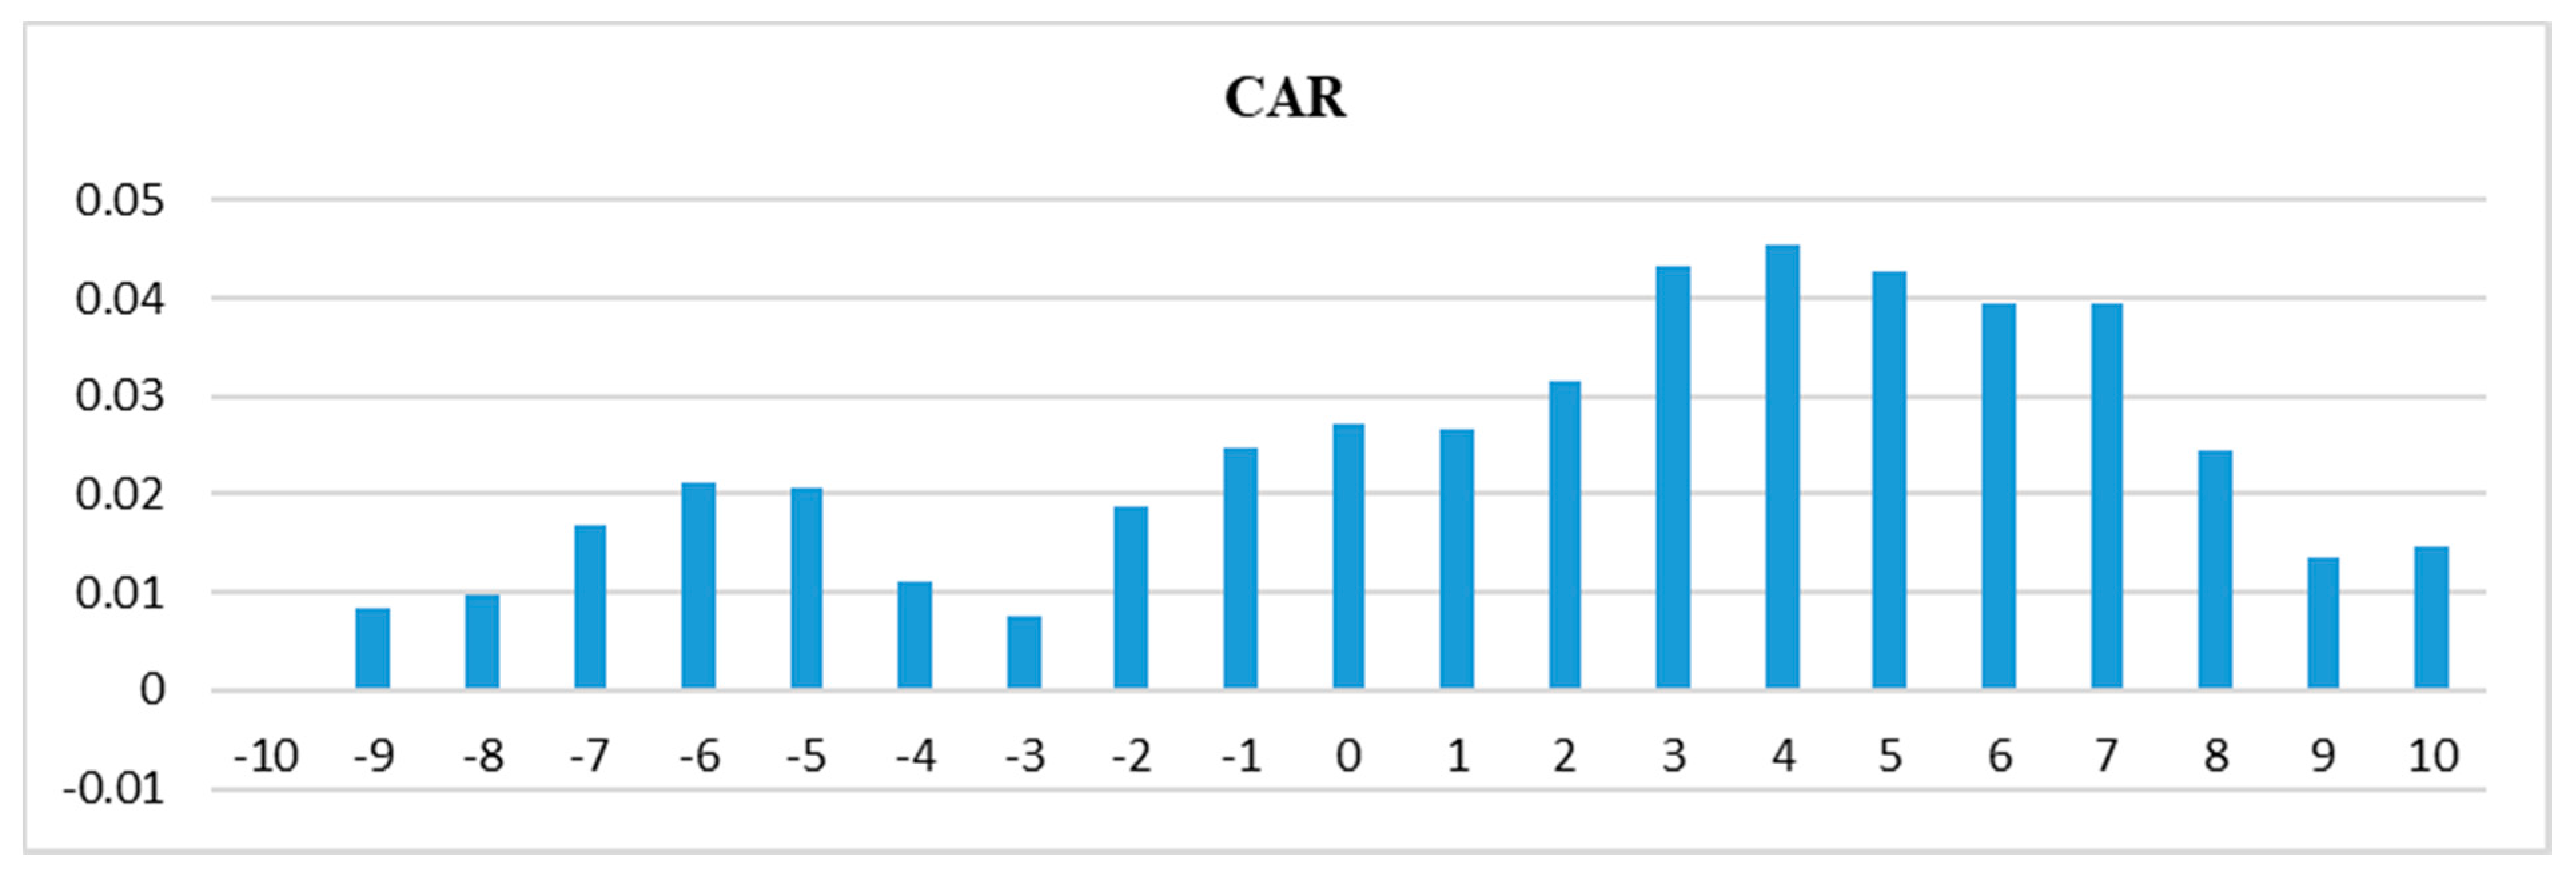
Additions to the DJSIs 2010–2019
N = 49
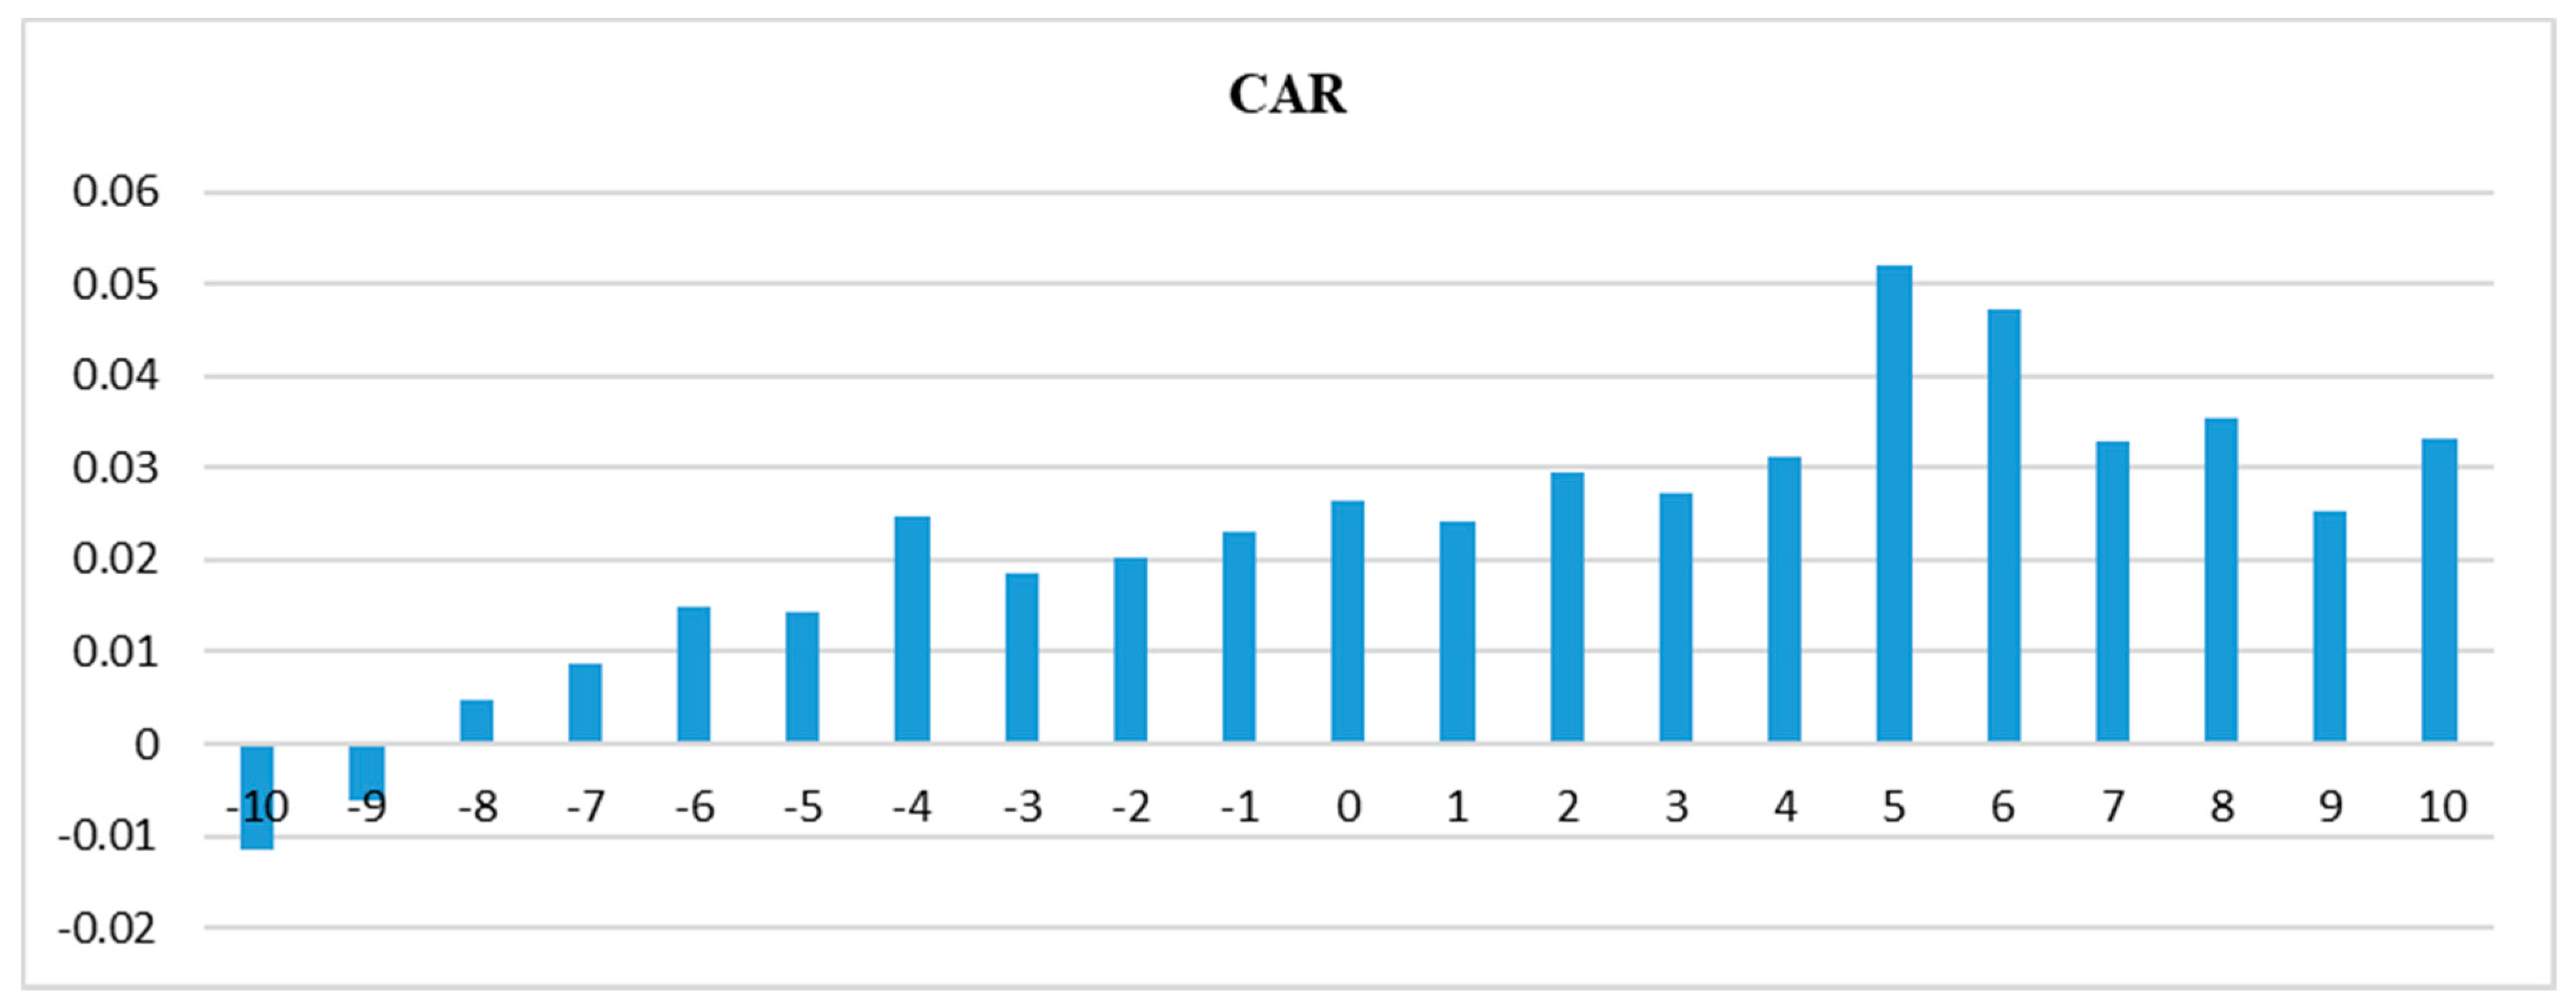
DayCARDayCAR
−10−0.000310.0268
−90.008320.0316
−80.009830.0434
−70.017040.0455
−60.021150.0428
−50.020660.0394
−40.011170.0394
−30.007680.0246
−20.018890.0137
−10.0248100.0148
00.0271
Table 7. Cumulative average abnormal returns (CAARs) around the announcement date [−10, 10] for the companies added (N = 49) to the DJSIs in the countries with femininity cultural dimension, Hofstede’s score of ≤42, 2010–2019.
DaysCAARt-Test
p-Value
[−10, 10]1.480%0.1974
[−2, 2]2.404% ***0.0031
[−5, 5]2.166% **0.0445
[−1, 1]0.799%0.1129
Note: Significant differences have been bolded. **, p < 0.01, ***, p < 0.001.
Table 8. Daily cumulative abnormal returns (CARs) around the announcement date [−10, 10] for the companies added to the DJSIs in the developed countries with Hofstede’s masculinity score of ≤42, 2010–2019.
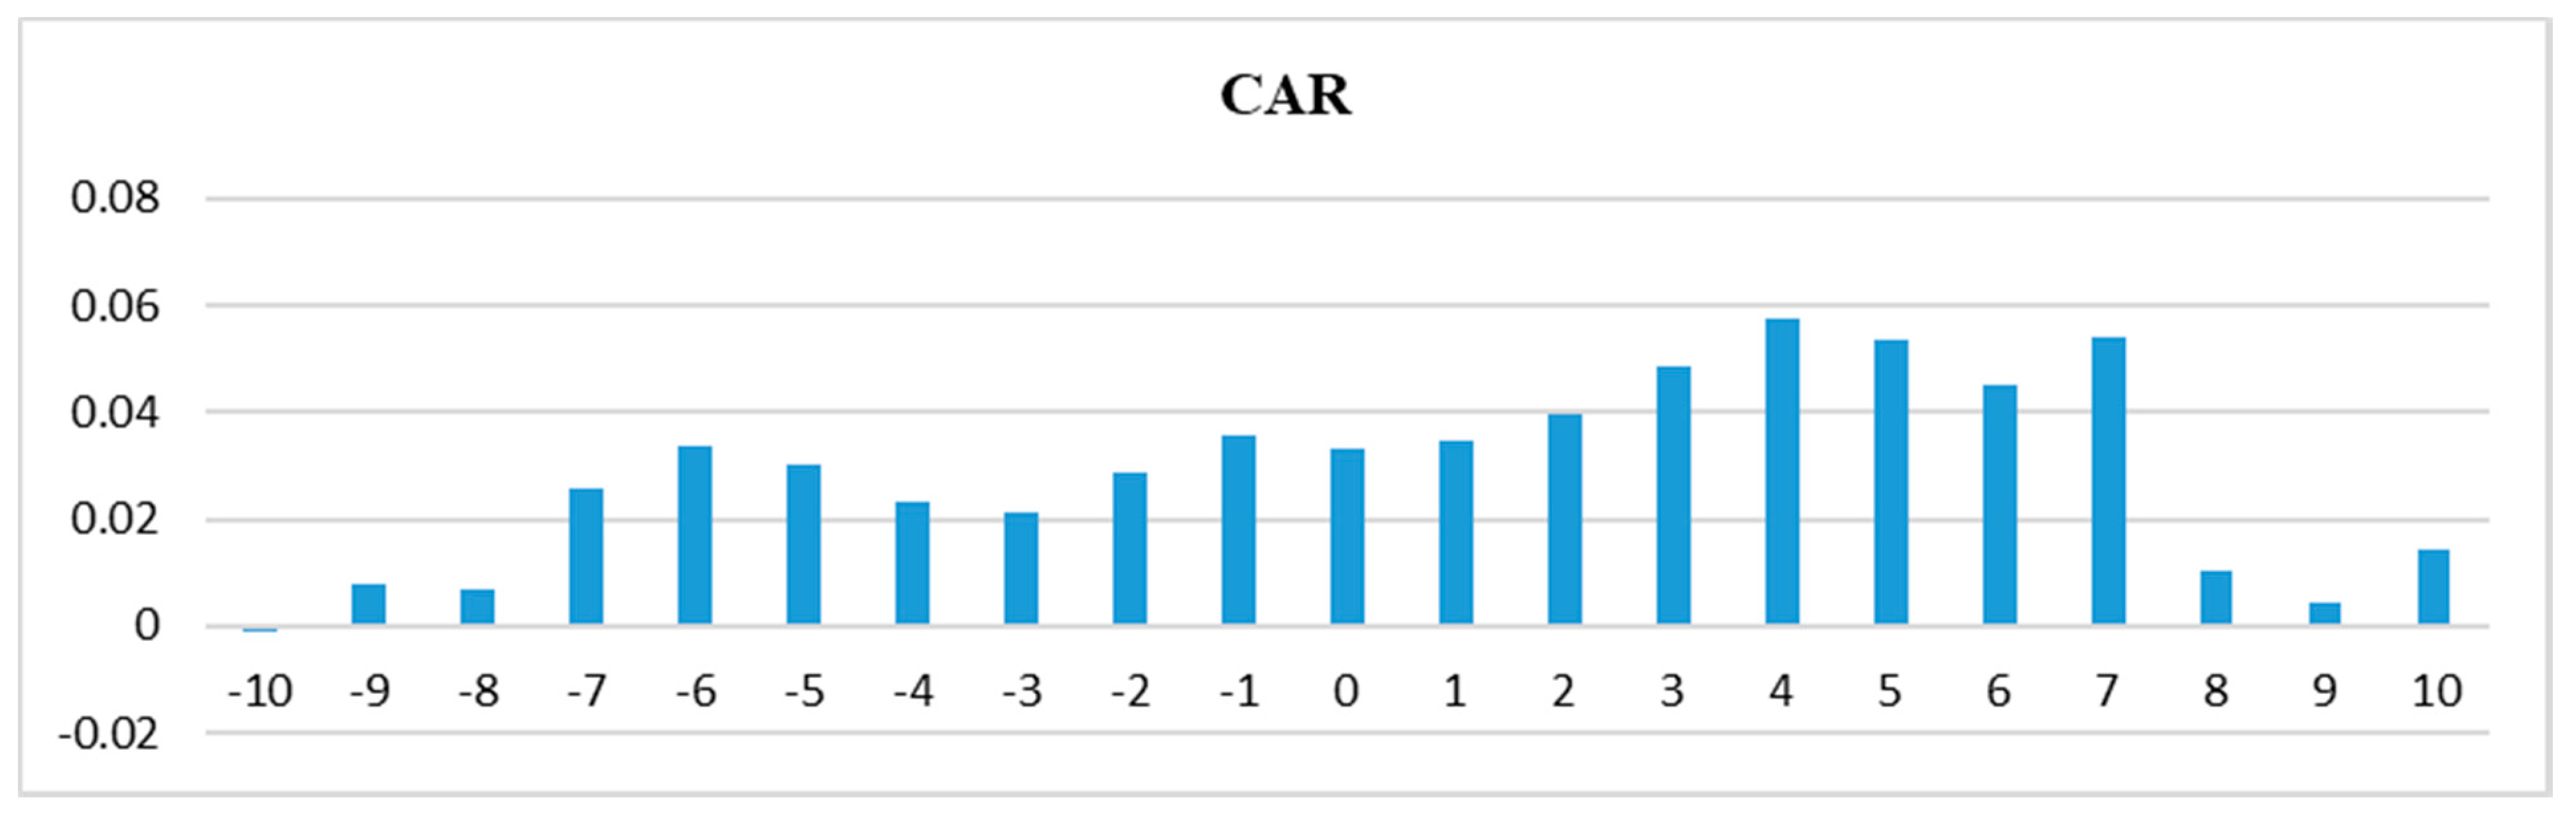
Additions to the DJSIs, 2010–2019—Developed Countries
N = 24
DayCARDayCAR
−10−0.001210.0347
−90.008120.0395
−80.007030.0487
−70.025640.0578
−60.033950.0537
−50.030460.0453
−40.023370.0539
−30.021280.0106
−20.028690.0044
−10.0355100.0143
00.0331
Table 9. Daily cumulative abnormal returns (CARs) around the announcement date [−10, 10] for companies added to the DJSIs in the emerging countries with Hofstede’s masculinity score of ≤42, 2010–2019.
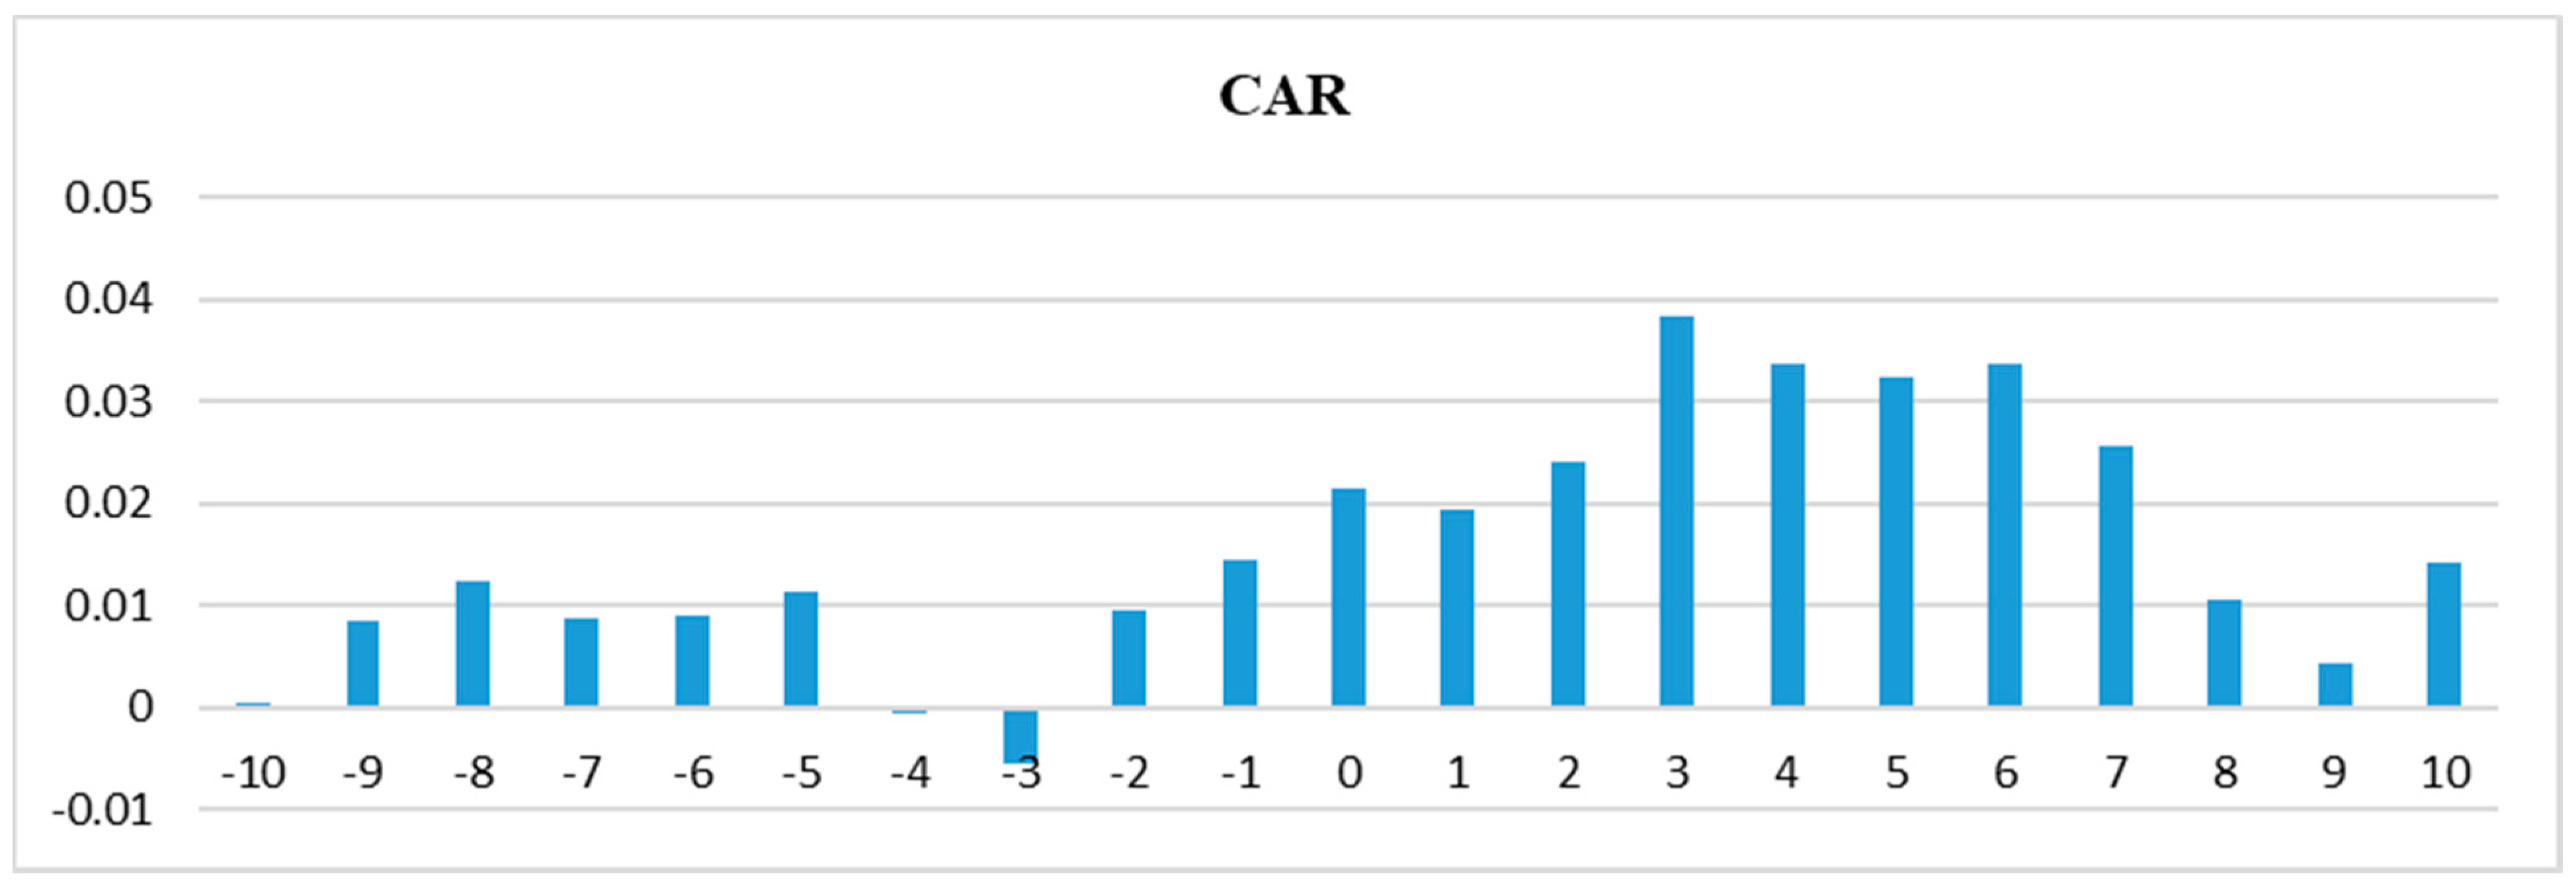
Additions to the DJSIs, 2010–2019—Emerging Countries
N = 25
DayCARDayCAR
−100.000510.0193
−90.008520.0241
−80.012430.0384
−70.008740.0337
−60.008950.0323
−50.011260.0337
−4−0.000670.0255
−3−0.005580.0106
−20.009590.0044
−10.0145100.0143
00.0214
Table 10. Cumulative average abnormal returns (CAARs) around the announcement date [−10, 10] for companies added (N = 24) to the DJSIs in developed countries with Hofstede masculinity score of ≤42, 2010–2019.
Event WindowCAARt-Test
p-Value
[−10, 10]1.534%0.1214
[−2, 2]1.826% **0.0038
[−5, 5]1.978% **0.0217
[−1, 1]0.611%0.1095
Note: Significant differences have been bolded. **, p < 0.01.
Table 11. Cumulative average abnormal returns (CAARs) around the announcement date [−10, 10] for companies added (N = 25) to the DJSIs in emerging countries with Hofstede masculinity scores of ≤42, 2010–2019.
Event WindowCAARt-Test
p-Value
[−10, 10]1.429%0.3270
[−2, 2]2.959% **0.0330
[−5, 5]2.346%0.1567
[−1, 1]0.980%0.2091
Note: Significant differences have been bolded. **, p < 0.01.
Table 12. Results of the daily abnormal returns around the announcement date [−10, 10] for the French companies added to the Dow Jones Sustainability Indices, 2010–2019.
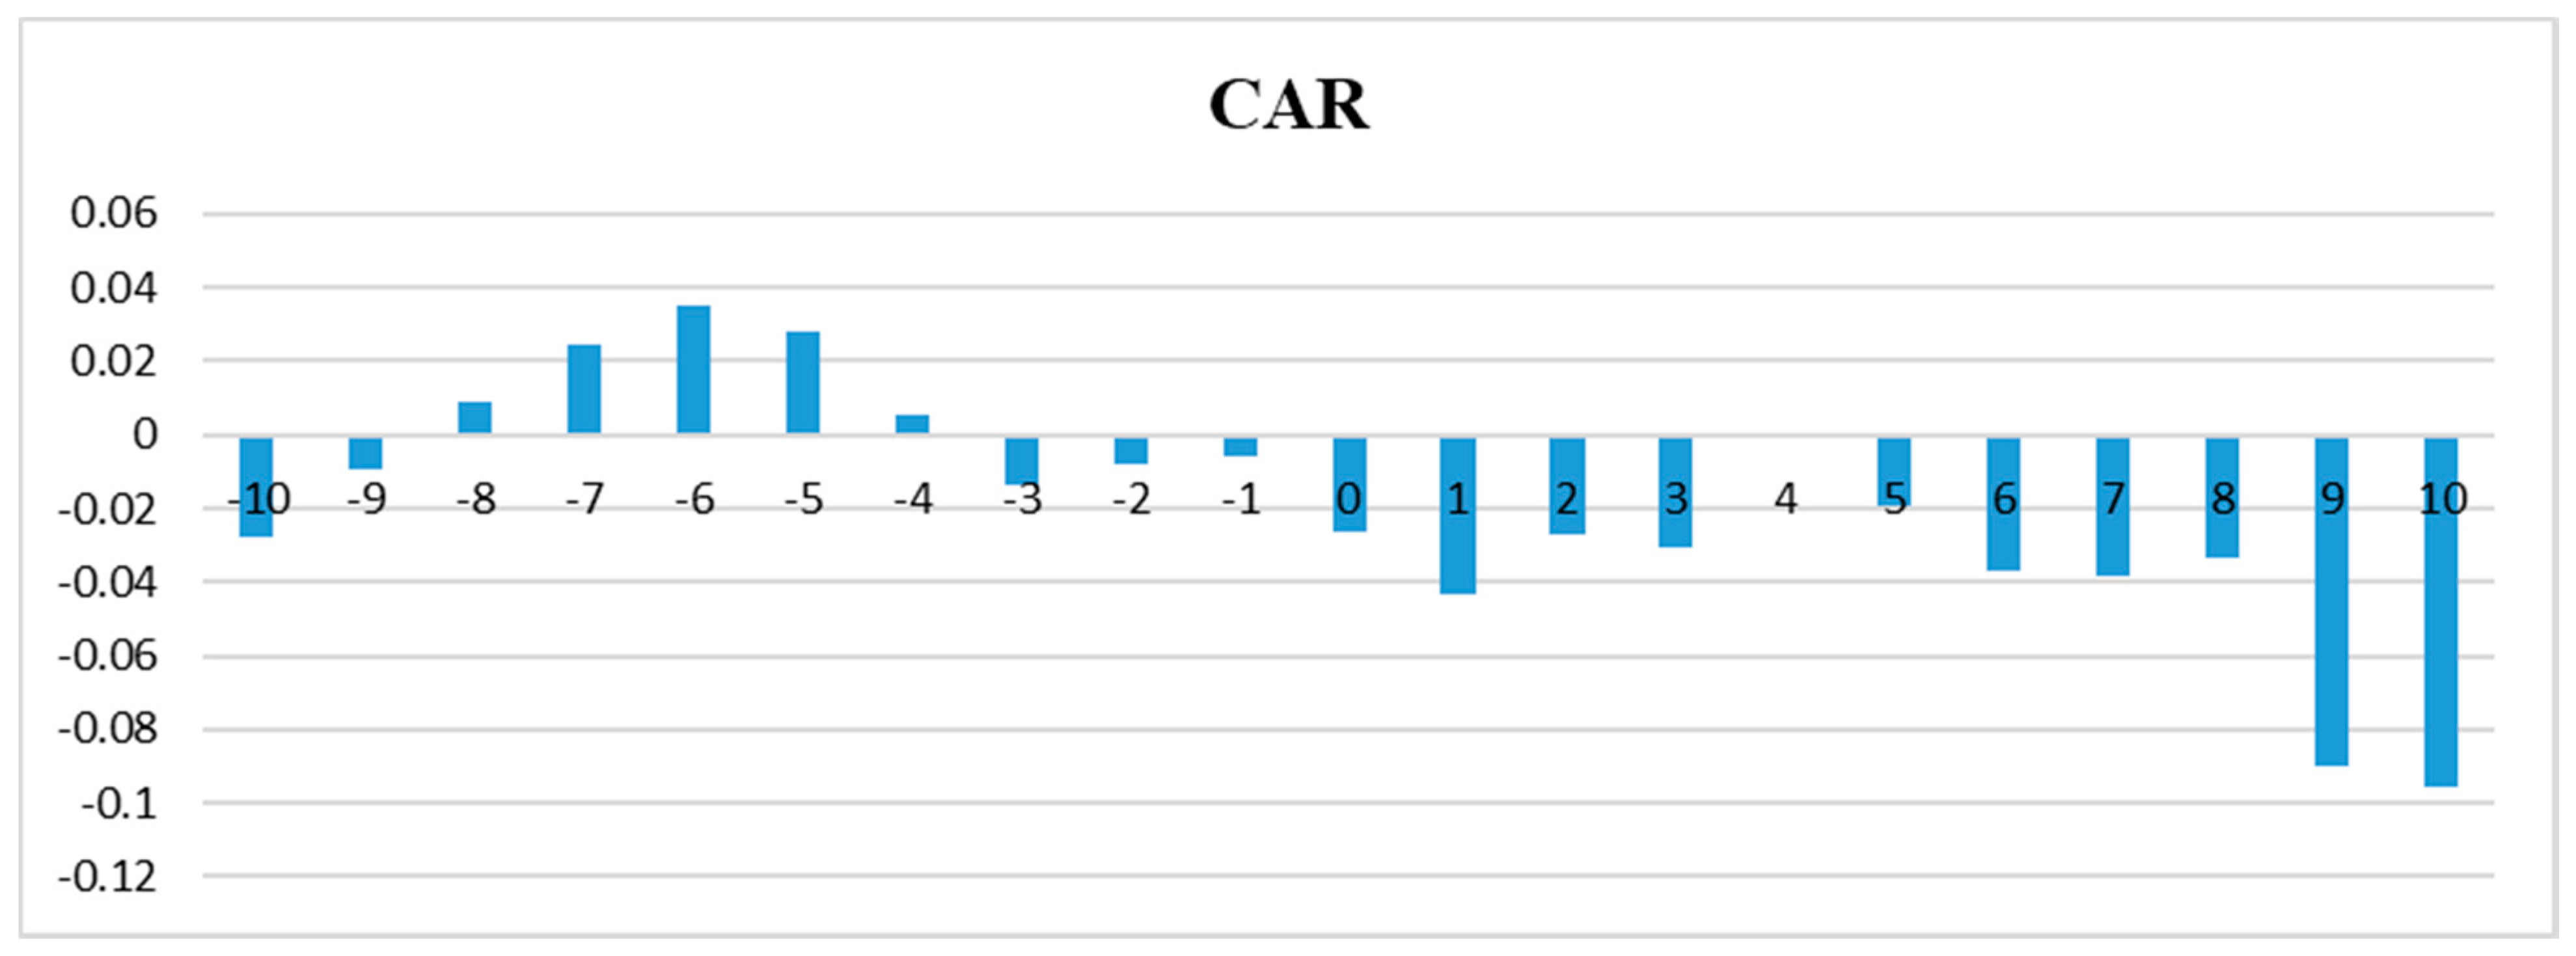
Additions to the DJSIs, 2010–2019—French Companies
N = 14
DayCARDayCAR
−10−0.02811−0.0430
−9−0.00942−0.0272
−80.00893−0.0309
−70.02484−0.0010
−60.03485−0.0193
−50.02846−0.0372
−40.00547−0.0385
−3−0.01358−0.0337
−2−0.00789−0.0900
−1−0.006110−0.0959
0−0.0265
Table 13. Cumulative average abnormal returns (CAARs) around the announcement date [−10, 10] for the French companies added (N = 14) to the DJSIs, 2010–2019.
Event WindowCAARt-Test
p-Value
[−10, 10]−9.589% ***0.0001
[−2, 2]−1.367% *0.0818
[−5, 5]−5.419% ***0.0008
[−1, 1]−3.524% ***0.0001
Note: Significant differences have been bolded. *, p < 0.05, ***, p < 0.001.
Table 14. Results of the daily abnormal returns around the announcement date [−10, 10] for Japanese companies added to the Dow Jones Sustainability Indices, 2010–2019.
Additions to the DJSIs, 2010–2019—Japanese Companies
N = 49
DayCARDayCAR
−10−0.011610.0241
−9−0.006320.0295
−80.004930.0273
−70.008740.0312
−60.014950.0521
−50.014460.0474
−40.024970.0329
−30.018580.0356
−20.020390.0252
−10.0230100.0332
00.0264
Table 15. Cumulative average abnormal returns (CAARs) around the announcement date [−10, 10] for Japanese companies added (N = 49) to the DJSIs, 2010–2019.
Event WindowCAARt-Test
p-Value
[−10, 10]3.322% ***0.0015
[−2, 2]1.100% **0.0198
[−5, 5]3.716% ***0.0000
[−1, 1]0.376%0.1778
Note: Significant differences have been bolded. **, p < 0.01, ***, p < 0.001.
Publisher’s Note: MDPI stays neutral with regard to jurisdictional claims in published maps and institutional affiliations.

