Abstract
Due to the unique geographical location and rapid development in the agricultural industry, heavy metals’ risk of soil contamination in the Qaidam Basin is gradually increasing. The following study was conducted to determine the soil heavy metal contents under different types of land use, contamination levels, and the physicochemical properties of soil. Soil samples were collected from facility lands, orchards, farmlands, and grasslands at 0–10 and 10–20 cm soil layers. Heavy metals including copper (Cu), chromium (Cr), nickel (Ni), zinc (Zn), lead (Pb), cadmium (Cd), arsenic (As), and mercury (Hg) were analyzed using inductively coupled plasma mass spectrometry and the soil was evaluated with different methods. Overall, the average Cu (25.07 mg/kg), Cr (45.67 mg/kg), Ni (25.56 mg/kg), Zn (71.24 mg/kg), Pb (14.19 mg/kg), Cd (0.17 mg/kg), As (12.54 mg/kg), and Hg (0.05 mg/kg) were lower than the environmental quality standard. However, the Cu, Cr, Ni, and As were highest in farmland, and Zn and Hg were highest in the facility land. The Pb content was highest in orchards, and the Cd content was the same in facility land, orchards, and farmland. Among the different land-use types, the soil heavy metal concentrations decreased in the order of facility land > farmland > grassland > orchards. The pH was alkaline, the content of SOC (soil organic carbon) 15.76 g/kg in grassland, TN (total nitrogen) 1.43 g/kg, and TP (total phosphorus) 0.97 g/kg in facility land showed the highest result. The soil BD (bulk density) had a significant positive correlation with Cu, Cr, Ni, Zn, Pb, Cd, and the TP positively correlated with Cu, Zn, Cd, and Hg. The soil evaluation results of the comprehensive pollution index indicated that the soil was in a clean condition. The index of potential environmental risk indicates that heavy metals are slightly harmful to the soil.
1. Introduction
As a significant part of the earth, the soil is an essential sink for nutrients and pollutants [1,2]. Soil pollution by heavy metals is a global problem that has recently received a great deal of attention [3,4]. Globally, more than 10 million soil sites are polluted, and more than 50% of these soil sites are contaminated with heavy metals [5]. Heavy metal pollution in soils may result from multiple sources, such as atmospheric deposition, waste disposal, waste incineration, urban effluents, traffic emission, fertilizer application, and the long-term application of wastewater in agriculture [6,7].
Half of the Earth’s surface is occupied by agricultural lands, such as cultivated lands, managed pastures, and permanent crops. The land-use type affects the migration and accumulation of heavy metals in the soil [8,9]. Heavy metals are not naturally degradable and therefore tend to accumulate and turn into more toxic metal compounds that severely affect crop yields and quality [10,11,12,13]. Among the heavy metals, Cd and Pb are notable for their high persistence and toxicity, which are the most significant concerns [14]. In addition, crops such as wheat and corn can contribute to the migration and transformation of heavy metals in the soil due to their enrichment capacity [15,16]. As for grasslands, orchards, enriching plants such as tall fescue, alfalfa, and camphor tree significantly reduce the concentration of Mn, Zn, and Cu in the soil [15]. Thus, land use can directly modify the types of heavy metals and their concentrations in the soil through waste rock or fertilizers containing different elements of heavy metals [17]. Land use has a significant impact on both the chemical and physical properties of soils. By causing physical and chemical changes in soil properties, changes in land use can indirectly make the soil environment more or less favorable for certain types of accumulation and migration. Therefore, if soils are contaminated with heavy metals, it is necessary to find out the relationship between the distribution of heavy metals in soils and different types of land use and to decide the physicochemical properties of soil to mitigate the effects of heavy metal pollution [18,19,20].
The Qaidam Basin is one of the four significant basins in China, located in the northeastern part of Qinghai–Tibetan Plateau, is the highest geographical unit in the world [21]. The Qaidam Basin is also famous for the Chinese wolfberry, called the “goji berry” because the nutrient content of the goji berry in the Qaidam region is higher than that of other regions [22]. Goji berry is a new product (since 2015) that is developing very quickly, has a very high reputation in the industry, and is popular in the international market [23]. The wolfberry production in Qaidam is extensive; with the constant expansion of cultivated areas and the development of science and technology, the brand recognition of the goji berry in Qaidam is moving towards industrialization, integrating seedling breeding, cultivation, harvesting, and sale. However, with the gradual progress of industrialization and human activities, the risk of land-use pollution is constantly expanding, leading to excessive concentrations of heavy metals. The content of heavy metals in soil under different types of land use in the Qaidam Basin has not yet been studied. Analyzing and evaluating the quality of the soil environment of land use types in this province is an urgent problem that needs to be solved now.
Therefore, the objectives of this study were (1) to determine the soil heavy metal contents and assess soil contamination levels in the Qaidam Basin; (2) to clarify the distribution of heavy metals in soil under different types of land use; (3) to study the effect of soil physicochemical properties on heavy metal concentrations.
2. Materials and Methods
2.1. Study Area
The central part of the Qaidam Basin is located in the Qinghai province, in the Tibetan autonomous prefecture of Haixi, which is in relatively low terrain and surrounded by mountains. The basin covers about 120,000 km2, one-fourth of which are salt lakes and playas [21]. The altitude is about 3000 m above sea level, and the average annual temperature is 2–4 °C. Average annual precipitation gradually decreases from southeast to northwest and is generally less than 300 mm [24]. The cities of Delingha, Golmud, and Dulan are the main centers of the agricultural industry in the Qaidam Basin. According to statistics (2017), arable land in these three cities contributed 85.87% of the total arable land area of Haixi prefecture [25]. The Qaidam Basin is a typical arid and semi-arid area with the primary vegetation as grassland [26]. The main soil type of the basin is saline soil, and most areas have a saline phenomenon, making it only suitable for growing shrubs and grasses with high drought tolerance. The soil samples were collected from the facility land, orchard, farmland, and grassland. The facility land is a greenhouse plot with soil samples of various vegetables and berries such as tomatoes, cabbage, strawberries, watermelon, etc. The orchard includes the goji berry (Lycium herbarium L.), a shrub up to 3 m high with pink berries, capable of withstanding large temperature variations. Farmland is used for agriculture with vegetation of green barley, rapeseed, buckwheat, etc. Furthermore, grasslands cover most of the basin area with drought-tolerant meadow vegetation: mostly grasses, sometimes trees and shrubs.
2.2. Soil Sampling and Analysis
Soil collection was conducted in July 2019. Seventy-two soil samples were collected from the three counties of Delingha, Golmud, and Doolan in the Qaidam Basin, three replications each in two soil layers (0–10 and 10–20 cm) under four land use types (facility land, orchards, farmland, and grassland). Soil samples collection adopts the “five-point method”, wherein each plot, ground litter and fine roots were removed, and then soils sampled at the five points were mixed according to soil layers to form one soil sample. The small aluminum cans (31.4 cm3) and a cutting ring were used to collect undisturbed soil to find water content (WC) of the soil and bulk density (BD). Soil drilling was used to take soil samples for soil organic carbon (SOC), total nitrogen (TN) and total phosphorus (TP). The soil sample was put in a plastic bag to determine the content of heavy metals. After that, the fresh soil samples were sent to the laboratory, air-dried at room temperature, and prepared for analysis.
Soil pH was determined by a pH electrode. Soil WC was measured by a drying method [27]. The BD was determined by the cutting ring method [28]. SOC was determined by potassium dichromate volumetric method-external heating method [29]. TN was digested with sulfuric acid-mixed catalyst Kjeldahl [30]. TP was calorimetrically determined by molybdenum blue calorimetry after HClO4-H2SO4 digestion determination [31].
The heavy metal contents including copper (Cu), chromium (Cr), nickel (Ni), zinc (Zn), lead (Pb), cadmium (Cd), arsenic (As), and mercury (Hg) in the soil were analyzed using inductively coupled plasma mass spectrometry (ICP-MS). Cu, Cr, Ni, Zn, and Pb were determined by flame atomic absorption spectrophotometry (HJ 491-2019); the detection limits were 1, 4, 3, 1, and 10 mg/kg, respectively. The cadmium was determined by the graphite furnace atomic absorption spectrophotometry method (GB/T 17141-1997), the detection limits were 0.01 mg/kg. The arsenic and mercury were determined with Atomic Fluorescence Photometer (GB/T 22105-2008); the detection limits for As and Hg were 0.01 and 0.002 mg/kg, respectively.
2.3. Pollution Index Methods
In this study, the Single Pollution Index method and the Nemero Comprehensive Pollution Index methods were used to evaluate the level of soil contamination with heavy metals [32]. The “Quality of the soil environment Standard for Monitoring the Risk of Soil Contamination for Agricultural Land” (GB15618-2018) was used as the assessment standard [33].
The Single Pollution Index method evaluates a particular element of heavy metal in the soil. Calculation method:
where Pi is the single heavy metal pollution index; Ci is the measured value of heavy metal content, in mg/kg; Si is the soil environmental quality standard. Based on the criteria of the Single Pollution Index method, the pollution level was classified into five levels: Pi ≤ 1 (clean), 1 < Pi ≤ 2 (relatively clean), 2 < Pi ≤ 3 (lightly polluted), 3 < Pi ≤ 4 (moderately polluted), Pi > 5 (heavily polluted).
The Nemero Comprehensive Pollution Index method is a widely used method for assessing the quality of the soil environment and is calculated as follows:
where PN is the comprehensive pollution index; Pmean is the mean value of the single pollution index, and Pmax is the maximum value of single pollution indicators. Based on the criteria of the Nemero Comprehensive Pollution Index method, the pollution level was classified into five levels: I—safe PN ≤ 0.7 (clean); II—warning line 0.7 < PN ≤ 1.0 (relatively clean); III—lightly polluted 1.0 < PN ≤ 2.0 (pollution exceeds the standard); IV—moderate pollution 2.0 < PN ≤ 3.0 (soil and crops are polluted); V—heavy pollution PN > 3.0 (soil and crops are seriously polluted) [34].
2.4. Potential Ecological Risk Index
The Potential Ecological Index Method is a method created by Swedish scientist Hakanson to evaluate heavy metals and their ecological risk [35,36]. This method is a relatively comprehensive synthesis of the content of heavy metals in soil, ecological effects, is also linked to the knowledge related to toxicology, and is able to accurately express the state of the ecological environment contaminated by heavy metals. The calculation formula is as follows:
where Ei is the potential risk factor of a certain heavy metal; Ti is the toxicity factor, generally Zn = 1, Cr = 2, Ni = Pb = Cu = 5, As = 10, Cd = 30, Hg = 40 [34]; Co—standard value for evaluation.
where RI is the combined potential ecological risk index of each heavy metal. The potential risk Ei factor of a specific heavy metal was classified into five pollution levels: E < 40 (slight), 40 ≤ E < 80 (medium), 80 ≤ E < 160 (strong), 160 ≤ E < 320 (very strong), and E ≥ 320 (extremely strong). The potential ecological risk index (RI) of each heavy metal was classified into four pollution levels: RI < 150 (slight), 150 ≤ E < 300 (medium), 300 ≤ E < 600 (strong), E ≥ 600 (very strong) [34].
2.5. Statistical Analysis
The results were calculated using Excel and SPSS version 25.0, and Origin 9.0 was used for their analysis. Statistical analysis was performed using SPSS (IBM SPSS Statistics 25.0). Analysis of variance (ANOVA) was performed to determine the effect of treatments on physical and chemical properties at different land use types and soil depths. It was used to evaluate the interaction between heavy metal content in different land-use types and depths. Statistical analysis was performed using Origin 9.0 graphical plotting at different soil depths. Correlation analysis between heavy metal concentrations and physicochemical properties was performed using Origin Pro 2021.
3. Results
3.1. The Characteristics of Soil Heavy Metal Concentrations in the Qaidam Basin
The characteristics of soil heavy metal concentrations in the Qaidam Basin are described in Table 1. The coefficient of variation (CV) shows the degree of relative variability of heavy metal concentrations in all soil samples. If the CV is 0–20%, it indicates low variability; CV 20–50% is considered moderate variability; CV 50–100% is observed as high variability; a CV above 100% is considered exceptionally high variability [37]. The Hg (61%) had a high CV value, which indicated a high variability of the mercury content between all sampling sites in the Qaidam Basin. The degree of variability of the remaining elements Cu, Cr, Ni, Zn, Pb, Cd, As the CV value showed less than 20%, which means low variability. The average concentrations of all heavy metals in the Qaidam Basin were less than the national environmental quality standards for agricultural soils (see: GB15618-2018 of China) [33].

Table 1.
Characteristics of soil heavy metal contents in the Qaidam Basin.
3.2. Heavy Metal Concentrations of Soil under Different Land-Use Types
The heavy metal concentrations of soil under facility land, orchard, farmland, and grassland at depths 0–10 and 10–20 cm soil layers are shown in Figure 1. For different land-use types, the mean concentrations ranged for Cu 21.89–24.89 and 23.67–28.78, for Cr 41.56–56.11 and 37.89–49.33, for Ni 22.89–28.56 and 23.11–28.11, for Zn 60.67–76.22 and 60.44–75.44, for Pb 12.78–15.56 and 12.67–15.22, for Cd 0.15–0.19 and 0.14–0.18, for As 11.06–13.29 and 12.03–13.61, for Hg 0.03–0.09 and 0.02–0.09 mg/kg in two soil layers 0–10 and 10–20 cm, respectively. The average content of many heavy metals has no significant differences between the different types of land use in the two soil layers, with a low level of soil contamination with heavy metals in general. However, the concentration of Hg in facility land was significantly higher than in the other three types of land use by almost two to three times. Among the contents of other heavy metals, Cu, Zn, and Cd concentrations were slightly higher in the facility land compared to the other three types of land use in the 0–10 cm soil layer. The content of Cr and Ni showed slightly higher results, and As in farmland and the content of Pb in the orchard in the soil layer of 0–10 cm. The concentrations of Cu, Cr, Ni, and As were slightly higher in farmland than in the other three types of land use in the lower soil layer of 10–20 cm. A slightly higher result was shown by the content of Zn and Hg in the facility land and the content of Pb in the orchard in the 10–20 cm soil layer. The lowest concentrations of all heavy metals are observed in grassland in two soil layers, 0–10 and 10–20 cm. In general, among the four land-use types, the content of heavy metals is ordered farmland > facility land > orchard > grassland. The concentration of many heavy metals in the top layer of 0–10 cm is higher than in the soil layer of 10–20 cm.
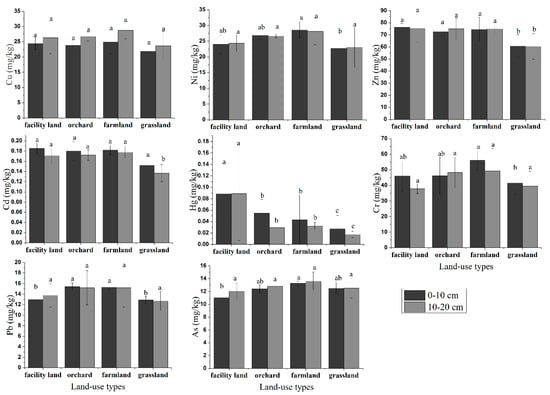
Figure 1.
The heavy metal concentrations in soil samples of the different land-use types. Lowercase letters (a–c) indicate significant differences between land-use types at 0–10 and 10–20 cm soil layers.
3.3. The Physicochemical Properties of Soils in Different Land-Use Types
Soil physicochemical properties including BD, WC, pH, SOC content, TN, and TP in different land-use types are shown in Table 2. According to Table 1, the BD of the grassland was lower than that of other land-use types at two soil layers of 0–10 and 10–20 cm. Furthermore, the BD of the farmland was the highest at the 10–20 cm soil layer, but there are no significant differences between land-use types at the 0–10 cm soil layers. Soil WC with a mean of 0.2, among the four types of land uses at 0–10 and 10–20 cm soil layers had no significant difference. The pH in all four land-use types was alkaline, with a mean of eight and standard deviation with a mean of 0.32.
Table 2.
The soil physicochemical properties in different land-use types.
According to Table 2, the SOC in the facility land, orchard, farmland, and grassland with a mean content of 11.65, 8.16, 9.38, and 14.18, respectively. Therefore, the SOC in land use decreased in grassland > facility land > farmland > orchard at 0–10 and 10–20 cm soil layers. The TN content of grassland and facility land was higher than the orchard and farmland at two layers. Moreover, TP with a mean content of land use ordered of facility land > farmland and orchard > grassland. As the soil depth increases, the SOC, TN, and TP contents gradually decrease.
3.4. Assessment of Soil Heavy Metals under Different Land-Use Types
The results of the evaluation of the soil Single Pollution Index are shown in Table 3. The maximum value of the Single Pollution Index was 0.502 for arsenic, and the minimum was 0.015 for mercury; hence the values of all eight heavy metals were less than one. The soil samples did not exceed the standard based on the national standard, so the soil in the Qaidam Basin under the four land uses was clean. The results of the assessment of the Comprehensive Pollution Index Nemero are shown in Table 3. Based on the national standard for soil, the value of the Comprehensive Pollution Index is 0.385, which is less than 0.7. Thus, the results show that the soil is at the level of clean condition.
Table 3.
Evaluation of Pollution Indexes and Potential Ecological Risk Index.
Evaluation of potential ecological risk index results is shown in Table 3. Based on the national standard, the potential ecological risk coefficients Ei of the eight heavy metals are far less than 40, and the potential ecological risk index values RI are far less than 150, indicating that the heavy metals are slightly harmful to the soil.
3.5. Correlation Analysis between Heavy Metal Concentrations and Physicochemical Properties under Different Land-Use Types
To describe the relationship between the concentrations of soil heavy metals and physicochemical properties, the Pearson correlation coefficients were analyzed (Figure 2). According to Figure 2, the various indicators of physicochemical properties, BD had a significantly strong positive correlation with Cd (p < 0.05), Zn (p < 0.01), and TP with Zn (p < 0.05). However, the soil WC with Zn (p < 0.05), Cd (p < 0.05), and TN with Pb (p < 0.05) had a negative correlation. Among the heavy metals, the strong correlation was Zn–Cd (p < 0.01), Cr–Ni (p < 0.05) and Ni–Pb (p < 0.05). Overall, many heavy metals were positively correlated with each other, with the exception of Hg–As.
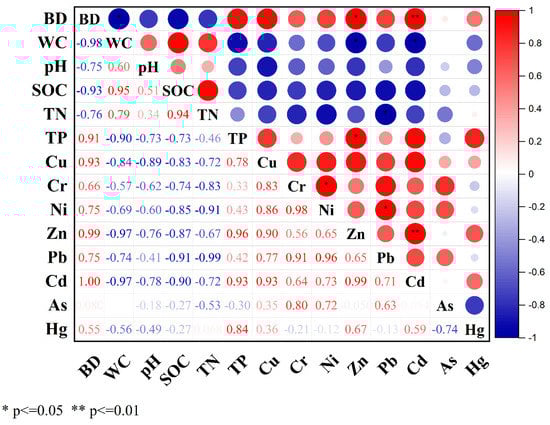
Figure 2.
Correlation plot of the soil heavy metal contents with physicochemical properties. * Correlation is significant at the 0.05 level, ** correlation is significant at the 0.01 level. BD—bulk density, WC—water content, SOC—soil organic carbon, TN—total nitrogen, TP—total phosphorus.
4. Discussion
4.1. Heavy Metal Concentrations and Soil Contamination in the Qaidam Basin
The concentrations of Cu, Cr, Ni, Zn, Pb, Cd, As, and Hg in soil under different land uses were measured for Qaidam Basin. All eight elements did not exceed the environmental quality standard (see: GB15618-2018 of China) [33]. The content of Cd and As was higher than the other five elements compared to the environmental quality standard. The reason for this is that heavy metal levels can be influenced by fertilizers and pesticides. The widely used pesticides chlorpyrifos, pyridaben, amitraz, hexaconazole, acetamiprid, imidacloprid, and ciromazole contain Cd and As, which can cause excessive levels of these elements. The prevention of excessive Cd and As is the primary concern to ensure the safety of soil environmental quality. In general, the soil environment in the Qaidam Basin is not greatly influenced by humans, and the soil quality is still healthy and safe.
The sources of heavy metal contamination would be different in different land-use types. According to the results of ANOVA of heavy metal concentrations in soil under different land uses, significant differences in Hg, Ni, Cr, and As were observed between different land uses, and there were no significant differences in Cu, Zn, Cd, and Pb. Previous studies have shown that the element content of Cu, Cd, and Zn results from long-term fertilizer and pesticide use [38], which is observed in all land uses in the Qaidam Basin. The Cd enters the environment through uncontrolled burning of coal and garbage and the food chain directly or indirectly from plants or animals [39]. Fertilizer and pesticide use, biological contaminants (sewage sludge), and industrial waste disposal, and atmospheric pollutant depositions increase Cd in the environment. In the research of Jiang Yu, it was shown that long-term use of fertilizers and pesticides can increase the content of heavy metals in agricultural land [38]. Pollution of Zn happens naturally in the soil because it occurs in the atmosphere in a free and joint state and the air, water, and all food products, but anthropogenic additives increase concentrations. These include industrial activities such as mining, coal burning, waste incineration, steel recycling, and the use of liquid manure, composted materials, fertilizers, and pesticides in agriculture [40]. Additionally, mining and metallurgical processes lead to an increase in Pb [41]. Elements that have different contents between land uses are observed. Hg content is the highest in facility land and Ni, Cr, and As content in farmland. The other land use, such as the orchard, grassland is generally less influenced by human inputs, and its heavy metal concentration is relatively low [42]. The reason for this may be the acceleration of people’s demand for heavy metals. The acceleration of industrial behavior harms the cultivation of crops and seriously affects the quality and safety of agricultural products. Although low doses of heavy metals are not a severe threat, crop yields will decrease once the maximum stable dose is exceeded, seriously affecting economic efficiency. Therefore, assessing the quality of the soil environment of land use is an urgent problem that needs to be solved at present.
4.2. Distribution of Heavy Metal Concentrations in Different Land-Use Types
Heavy metal concentrations under facility land, orchard, farmland, and grassland were determined for the Qaidam Basin area. They can have different effects on heavy metal content, so it is extremely important to study the effects of different land use types on heavy metal contamination of soils [17].
According to the study results, the Cu, Cr, Ni, and As concentrations in farmland and the Zn and Hg concentrations in the facility land were the highest. The Pb content was highest in orchards, and the Cd content was the same in facility land, orchards, and farmland. Among the different land-use types, the concentration of heavy metals increased in order: farmland > facility land > orchard > grassland. Anthropogenic disturbances most frequently cause the highest content of heavy metals on facility land and farmlands; also, the use of fertilizers and pesticides is possible in plant growth. Furthermore, in the grasslands, the ecological environment is less exposed to anthropogenic disturbances, which may be an actual reason for the low content of elements of heavy metals. Therefore, changes in land use have a significant effect on the distribution of heavy metals in soils [43].
4.3. Relationship between the Soil Heavy Metal Concentrations and Physicochemical Properties
The correlation of physicochemical properties with each other and with heavy metals is shown in Figure 2. The results of the study indicate that there is a strong relationship between the physicochemical properties and heavy metals. Among soil physicochemical properties, the soil BD is positively correlated with Cd and Zn, meaning they both have the same source of contamination. Zn was also positively correlated with TP, indicating that it was probably derived from phosphate fertilizers. At the same time, Zn and Cd also have strong positive correlation with each other, indicating a similar source, while the soil WC with Zn and Cd has negative correlation. The reason for this may be that climate change with increased temperature and extreme weather events will exacerbate the environmental risk of heavy metals entering soil water due to the enhanced leaching effect [44]. Visser et al. (2012) reported that decreased precipitation and increased temperature caused by climate change will result in reduced leaching of the heavy metals Cd and Zn [45].
Soil pH plays an important role for heavy metals, which is recognized as a key factor regulating the behavior of heavy metals in soil [46]. Harter [47] and many other scientists have reported that soil pH is the main cause affecting heavy metals in soil [48,49,50,51]. Soil pH controls metal availability and affects toxicity, cation mobility, and regulates the solubility of heavy metals in soil [52]. The solubility of metal complexes increases with decreasing soil pH, which shows a negative correlation between Cu, Pb, Cd, and Ni with pH [53]. In the present study, soil pH was negatively correlated with most of the heavy metals studied (Figure 2). This result may be largely due to the fact that the pH value of the soils studied varies within a relatively narrow range 7.99–8.55, similar results are shown by Ganpat L. et al. (2020) [54].
Heavy metal content is also affected by soil nutrients in the soil [53]. Soil nutrients interact with heavy metals through plants and tree roots. For example, relatively high soil nutrient content can contribute to the bioavailability of heavy metals [53]. Therefore, while pH has a significant effect on the adsorption and solubility of heavy metals in soils [55], SOC has a significant effect on the sorption and migration of heavy metals in soils [56]. This suggests that pH and SOC have a relationship and significant negative correlation with heavy metals. Previous studies have also shown that soil properties such as pH, SOC and TN, TP are correlated with heavy metal concentrations in soil [57].
Many of the heavy metals analyzed showed significantly positive correlations with each other, such as Cu–Cr, Ni, Zn, Pb, Cd; Cr–Ni, Pb, As, and Ni–Pb, Zn–Cd, Pb–Cd [58]. The positive correlation between many of the metals indicated that there was a relationship or interaction between these metals in the study area with each other and, on the other hand, they may have similar input sources. In contrast, the negative correlation between Hg and As could be the occurrence of a different causal factor, or a different source of the soil contamination [59].
4.4. Soil Enzymology and Methods to Reduce Heavy Metals in Soil
Soil contamination by heavy metals not only has adverse effects on various parameters related to soil quality and crop yield, but also causes changes in the activity of the microbial community [60], an important role in the vital activity of microorganisms and stabilization of soil structure and quality, organic matter formation and nutrient cycling play enzymes [61]. Soil enzymology is based on the group of enzymes that are contained in the soil [62]. Heavy metals affect the enzymatic activity of the soil and have a toxic effect on the soil biota, changing the microbial community, and reducing the number and activity of soil microorganisms [63]. Enzyme activity can be determined by soil type, structure, amount of organic matter, pH, as well as with the types of crops grown [64].
Thus, based on the results of a study and Pearson correlation analysis, we have identified possible sources of heavy metals. Fertilizer application, especially in agriculture application of phosphorus fertilizers, accompanying nitrogen fertilizers, and pesticides are the main sources, as well as various factors such as climate change, soil erosion, as well as the influence of anthropogenic factors. To reduce the concentration of heavy metals in soil, we can use the following methods: (1) reduce the use of chemical fertilizers by using bio-fertilizers and manure; (2) use biological methods of pest control to reduce the use of pesticides and minimize soil pollution; (3) reduce waste pollution by recycling and reusing materials such as glass, plastic, paper, and cloth; (4) monitor climate factors, plan ahead for environmental risk in the face of future climate change; (5) apply measures to prevent soil and water erosion. In this way, we can reduce the waste and thereby reduce soil contamination with heavy metals.
5. Conclusions
Due to the determination of the Cu, Cr, Ni, Zn, Pb, Cd, As, and Hg content in soils under the different types of land use shown, it was found that the content of heavy metals does not exceed the environmental quality standard for crops. The results of assessing soil contamination by heavy metals and potential environmental risk based on national standards showed that soils in the Qaidam Basin are in a clean condition and heavy metals cause little harm to the soil. According to the study, we argue that more attention should be paid to heavy metal pollution of agricultural land in the Qaidam Basin. The content of Cd, Hg, and As should be monitored to prevent an increase in these elements, especially in facility land and farmland.
Author Contributions
B.N.: conceptualization, investigation, data curation, software, writing—original draft, editing; P.W.: resources, experiment preparation; X.D.: experiment preparation; Y.H.: conceptualization, validation, visualization; S.A.: supervision, funding acquisition, writing—review and editing. All authors have read and agreed to the published version of the manuscript.
Funding
This research was funded by the Second Tibetan Plateau Scientific Expedition and Research Program (STEP), Grant No. 2019QZKK0603.
Institutional Review Board Statement
Not applicable.
Informed Consent Statement
Not applicable.
Data Availability Statement
Not applicable.
Conflicts of Interest
The authors declare no conflict of interest.
References
- Adriano, D.C. Biogeochemistry of Trace Metals; CRC-Press Taylor and Fransic Group: Boca Raton, FL, USA, 1992; p. 96. [Google Scholar]
- Luo, W.; Lu, Y.; Giesy, J.P.; Wang, T.; Shi, Y.; Wang, G.; Xing, Y. Effects of land use on concentrations of metals in surface soils and ecological risk around Guanting Reservoir, China. Environ. Geochem. Health 2007, 29, 459–471. [Google Scholar] [CrossRef]
- Jiang, Y.; Chao, S.; Liu, J.; Yang, Y.; Chen, Y.; Zhang, A.; Cao, H. Source apportionment and health risk assessment of heavy metals in soil for a township in Jiangsu Province, China. Chemosphere 2017, 168, 1658–1668. [Google Scholar] [CrossRef] [PubMed]
- Peng, X.; Shi, G.S.; Liu, G.; Xu, J.; Tian, Y.; Zhang, Y.; Feng, Y.; Russell, A.G. Source apportionment and heavy metal health risk (HMHR) quantification from sources in a southern city in China, using an ME2-HMHR model. Environ. Pollut. 2017, 221, 335–342. [Google Scholar] [CrossRef] [PubMed]
- He, Z.; Shentu, J.; Yang, X.; Baligar, V.C.; Zhang, T.; Stoffella, P.J. Heavy Metal Contamination of Soils: Sources, Indicators, and Assessment. J. Environ. Indic. 2015, 9, 17–18. [Google Scholar]
- Cachada, A.; Pereira, M.E.; Da Silva, E.F.; Duarte, A.C. Sources of potentially toxic elements and organic pollutants in an urban area subjected to an industrial impact. Environ. Monit. Assess. 2012, 184, 15–32. [Google Scholar] [CrossRef]
- Lv, J.; Liu, Y.; Zhang, Z.; Zhou, R.; Zhu, Y. Distinguishing anthropogenic and natural sources of trace elements in soils undergoing recent 10-year rapid urbanization: A case of Donggang, Eastern China. Environ. Sci. Pollut. Res. Int. 2015, 22, 10539–10550. [Google Scholar] [CrossRef] [PubMed]
- Jin, Z.; Shi, W.; Gao, Y.; Mao, L.; Cao, J.; Zhang, J.; Zhou, P. Distribution of heavy metals and changes of soil biological activity under different land use patterns. J. Soil Water Conserv. 2009, 23, 74–77. (In Chinese) [Google Scholar] [CrossRef]
- Sun, Y.; Qian, H.; Duan, L.; Sheng-ke, Y. Effects of land use patterns on soil heavy metal contents. Agric. Sci. Technol. 2010, 11, 159–162. (In Chinese) [Google Scholar] [CrossRef]
- Adimalla, N. Heavy metals pollution assessment and its associated human health risk evaluation of urban soils from Indian cities: A review. Environ. Geochem. Health 2020, 42, 173–190. [Google Scholar] [CrossRef]
- Lwin, C.S.; Seo, B.-H.; Kim, H.-U.; Owens, G.; Kim, K.-R. Application of soil amendments to contaminated soils for heavy metal immobilization and improved soil quality—A critical review. Soil Sci. Plant Nutr. 2018, 64, 156–167. [Google Scholar] [CrossRef]
- Nagajyoti, P.C.; Lee, K.D.; Sreekanth, T.V.M. Heavy metals, occurrence and toxicity for plants: A review. Environ. Chem. Lett. 2010, 8, 199–216. [Google Scholar] [CrossRef]
- Huang, Y.; Chen, Q.; Deng, M.; Japenga, J.; Li, T.; Yang, X.; He, Z. Heavy metal pollution and health risk assessment of agricultural soils in a typical peri-urban area in southeast China. J. Environ. Manag. 2018, 207, 159–168. [Google Scholar] [CrossRef] [PubMed]
- Kelepertzis, E. Accumulation of heavy metals in agricultural soils of Mediterranean: Insights from Argolida basin, Peloponnese, Greece. Geoderma 2014, 221–222, 82–90. [Google Scholar] [CrossRef]
- Fang, A.; Dong, J.; An, Y. Distribution Characteristics and Pollution Assessment of Soil Heavy Metals under Different Land-Use Types in Xuzhou City, China. Sustainability 2019, 11, 1823. [Google Scholar] [CrossRef]
- Hamid, Y.; Tang, L.; Yaseen, M.; Hussain, B.; Zehra, A.; Aziz, M.Z.; He, Z.L.; Yang, X. Comparative efficacy of organic and inorganic amendments for cadmium and lead immobilization in contaminated soil under rice-wheat cropping system. Chemosphere 2019, 214, 259–268. [Google Scholar] [CrossRef]
- Wang, Z.; Xiao, J.; Wang, L.; Liang, T.; Guo, Q.; Guan, Y.; Rinklebe, J. Elucidating the differentiation of soil heavy metals under different land uses with geographically weighted regression and self-organizing map. Environ. Pollut. 2020, 260, 114065. [Google Scholar] [CrossRef]
- Bastami, K.D.; Neyestani, M.R.; Shemirani, F.; Soltani, F.; Haghparast, S.; Akbari, A. Heavy metal pollution assessment in relation to sediment properties in the coastal sediments of the southern Caspian Sea. Mar. Pollut. Bull. 2015, 92, 237–243. [Google Scholar] [CrossRef] [PubMed]
- Huang, Y.; Li, T.; Wu, C.; He, Z.; Japenga, J.; Deng, M.; Yang, X. An integrated approach to assess heavy metal source apportionment in peri-urban agricultural soils. J. Hazard. Mater. 2015, 299, 540–549. [Google Scholar] [CrossRef]
- Steffan, J.J.; Brevik, E.C.; Burgess, L.C.; Cerda, A. The effect of soil on human health: An overview. Eur. J. Soil Sci. 2018, 69, 159–171. [Google Scholar] [CrossRef] [PubMed]
- Liu, Y. Rational Utilization of Water Resources and Ecological Environment Protection of Qaidam Basin. Beijing Sci. Press 2000, 1–20. (In Chinese) [Google Scholar]
- Ye, Y.; Suo, Y.; Li-juan, H.; Hu, N. Analysis of the Research Status and Prospects of Lycium barbarum from Qaidam Basin. Food Ind. J. 2014, 35, 210–213. (In Chinese) [Google Scholar]
- Chen, J.J. A brief analysis on the development of wolfberry industry in Qinghai Qaidam region. Inner Mong. For. Surv. Des. 2017, 40, 88–89. (In Chinese) [Google Scholar]
- Zhu, W.; Lv, A.; Jia, S. Spatial distribution of vegetation and the influencing factors in Qaidam Basin based on NDVI. J. Arid Land 2011, 3, 85–93. [Google Scholar] [CrossRef]
- Guo, Q.; Huang, Y.; Jia, P.; Li, H. Evaluation of water quality status in the main oasis agricultural areas of the Qaidam Basin, China. J. Agro-Environ. Sci. 2021, 40, 650–658. (In Chinese) [Google Scholar] [CrossRef]
- Yu, H.; Zhang, Z.; Zhang, P. RS and GIS based evaluation and dynamic monitoring of land desertification in Qinghai Province. Arid Zone Res. 2007, 24, 153–158. (In Chinese) [Google Scholar] [CrossRef]
- Sumner, M.E.; Miller, W.P. Cation exchange capacity and exchange coefficients. In Methods of Soil Analysis; Parts 3: Chemical Methods, No. 5; Sparks, D.L., Ed.; ASA and SSSA: Madison, WI, USA, 1996; pp. 1201–1229. [Google Scholar]
- Huang, Y.-M.; Liu, D.; An, S.-S. Effects of slope aspect on soil nitrogen and microbial properties in the Chinese Loess region. Catena 2015, 125, 135–145. [Google Scholar] [CrossRef]
- Nelson, D.W.; Sommers, L.E. Total carbon, organic carbon, and organic matter. In Methods of Soil Analysis; Parts 3: Chemical Methods, No. 5; Sparks, D.L., Ed.; ASA and SSSA: Madison, WI, USA, 1996; pp. 961–1010. [Google Scholar]
- Bremner, J.M. Nitrogen-total. In Methods of Soil Analysis; Parts 3: Chemical Methods, No. 5; Sparks, D.L., Ed.; ASA and SSSA: Madison, WI, USA, 1996; pp. 1085–1121. [Google Scholar]
- Jackson, M.L. Soil Chemical Analysis. In Advanced Course, 2nd ed.; University of Wisconsin: Madison, WI, USA, 1979; pp. 33–35. [Google Scholar]
- Liu, W.; Man, X. Evaluation and Content of HeavyMetal Pollution in Mine Areas Wasteland of Jixi. J. Soil Water Conserv. 2007, 21, 70–74. (In Chinese) [Google Scholar]
- SAMR, M. Risk Control Standard for Soil Contamination of Agricultural Land; Standards Press of China Beijing: Beijing, China, 2018. [Google Scholar]
- Wang, N. Ecological risk assessment of heavy metals in soils around mining area: Comparison of different assessment methods. IOP Conf. Ser. Earth Environ. Sci. 2020, 525, 012074. [Google Scholar] [CrossRef]
- Zhao, J.; Luo, Z.; Zhao, Y.; Ran, F.; Jiang, C. Spatial distribution and pollution evaluation of heavy metals in farmland soil around Poyang Lake. J. Environ. Sci. 2018, 38, 2475–2485. (In Chinese) [Google Scholar] [CrossRef]
- Hakanson, L. An ecological risk index for aquatic pollution control.a sedimentological approach. Water Res. 1980, 14, 975–1001. [Google Scholar] [CrossRef]
- Karimi, N.; Mohammad, T.; Tabatabaii, S.M.; Gholami, A. Geochemical assessment of steel smelter-impacted urban soils, Ahvaz, Iran. J. Geochem. Explor. 2015, 152, 91–109. [Google Scholar] [CrossRef]
- Jiang, Y.; Guo, X. Multivariate and geostatistical analyses of heavy metal pollution from different sources among farmlands in the Poyang Lake region, China. J. Soils Sediments 2019, 19, 2472–2484. [Google Scholar] [CrossRef]
- Lion, G.N.; Olowoyo, J.O. Population health risk due to dietary intake of toxic heavy metals from Spinacia oleracea harvested from soils collected in and around Tshwane, South Africa. S. Afr. J. Bot. 2013, 88, 178–182. [Google Scholar] [CrossRef]
- Bhagure, G.R.; Mirgane, S.R. Heavy metal concentrations in groundwaters and soils of Thane Region of Maharashtra, India. Environ. Monit. Assess. 2011, 173, 643–652. [Google Scholar] [CrossRef]
- Ettler, V. Soil contamination near non-ferrous metal smelters: A review. Appl. Geochem. 2016, 64, 56–74. [Google Scholar] [CrossRef]
- Liu, S.; Pan, G.; Zhang, Y.; Xu, J.; Ma, R.; Shen, Z.; Dong, S. Risk assessment of soil heavy metals associated with land use variations in the riparian zones of a typical urban river gradient. Ecotoxicol. Environ. Saf. 2019, 181, 435–444. [Google Scholar] [CrossRef]
- Deng, A.; Wang, L.; Chen, F.; Li, Z.; Liu, W.; Liu, Y. Soil aggregate-associated heavy metals subjected to different types of land use in subtropical China. Glob. Ecol. Conserv. 2018, 16, e00465. [Google Scholar] [CrossRef]
- Wu, Q.; Qi, J.; Xia, X. Long-term variations in sediment heavy metals of a reservoir with changing trophic states: Implications for the impact of climate change. Sci. Total Environ. 2017, 609, 242–250. [Google Scholar] [CrossRef] [PubMed]
- Visser, A.; Kroes, J.; van Vliet, M.T.; Blenkinsop, S.; Fowler, H.J.; Broers, H.P. Climate change impacts on the leaching of a heavy metal contamination in a small lowland catchment. J. Contam. Hydrol. 2012, 127, 47–64. [Google Scholar] [CrossRef] [PubMed]
- Xu, L.; Cui, H.; Zheng, X.; Zhou, J.; Zhang, W.; Liang, J.; Zhou, J. Changes in the heavy metal distributions in whole soil and aggregates affected by the application of alkaline materials and phytoremediation. RSC Adv. 2017, 7, 41033–41042. [Google Scholar] [CrossRef]
- Harter, R.D. Effect of Soil pH on Adsorption of Lead, Copper, Zinc, and Nickel. Soil Sci. Soc. Am. J. 1983, 47, 47–51. [Google Scholar] [CrossRef]
- Levi, M.R.; Shaw, J.N.; Wood, C.W.; Hermann, S.M.; Carter, E.A.; Feng, Y. Land Management Effects on Near-Surface Soil Properties of Southeastern U.S. Coastal Plain Kandiudults. Soil Sci. Soc. Am. J. 2010, 74, 258–271. [Google Scholar] [CrossRef]
- Korkanc, S.Y.; Ozyuvac, N.; Hizal, A. Impacts of land use conversion on soil properties and soil erodibility. J. Environ. Biol. 2008, 29, 363–370. [Google Scholar] [PubMed]
- Bostic, E.M.; White, J.R. Soil Phosphorus and Vegetation Influence on Wetland Phosphorus Release after Simulated Drought. Soil Sci. Soc. Am. J. 2007, 71, 238–244. [Google Scholar] [CrossRef]
- Schipper, L.A.; Sparling, G.P. Performance of soil condition indicators across taxonomic groups and land uses. Soil Sci. Soc. Am. J. 2000, 64, 300–311. [Google Scholar] [CrossRef]
- Rodriguez, J.A.; Nanos, N.; Grau, J.M.; Gil, L.; Lopez-Arias, M. Multiscale analysis of heavy metal contents in Spanish agricultural topsoils. Chemosphere 2008, 70, 1085–1096. [Google Scholar] [CrossRef]
- Xiao, R.; Zhang, M.; Yao, X.; Ma, Z.; Yu, F.; Bai, J. Heavy metal distribution in different soil aggregate size classes from restored brackish marsh, oil exploitation zone, and tidal mud flat of the Yellow River Delta. J. Soils Sediments 2015, 16, 821–830. [Google Scholar] [CrossRef]
- Ganpat, L.; Rajpaul, Y.; Atul, B.P.; Ravindra, K.R.; Anil, K.V.; Dinesh, K.Y. Heavy metals distribution and their correlation with physico-chemical properties of different soil series of northwestern India. Indian J. Agric. Sci. 2020, 90, 1742–1746. [Google Scholar]
- Khan, S.; Cao, Q.; Zheng, Y.M.; Huang, Y.Z.; Zhu, Y.G. Health risks of heavy metals in contaminated soils and food crops irrigated with wastewater in Beijing, China. Environ. Pollut. 2008, 152, 686–692. [Google Scholar] [CrossRef] [PubMed]
- Pontoni, L.; van Hullebusch, E.; Pechaud, Y.; Fabbricino, M.; Esposito, G.; Pirozzi, F. Colloidal Mobilization and Fate of Trace Heavy Metals in Semi-Saturated Artificial Soil (OECD) Irrigated with Treated Wastewater. Sustainability 2016, 8, 1257. [Google Scholar] [CrossRef]
- Martin, H.W.; Kaplan, D.I. Temporal changes in cadmium, thallium, and vanadium mobility in soil and phytoavailability under field conditions. Water Air Soil Pollut. 1998, 101, 399–410. [Google Scholar] [CrossRef]
- Lv, J.; Liu, Y.; Zhang, Z.; Dai, J.; Dai, B.; Zhu, Y. Identifying the origins and spatial distributions of heavy metals in soils of Ju country (Eastern China) using multivariate and geostatistical approach. J. Soils Sediments 2014, 15, 163–178. [Google Scholar] [CrossRef]
- Miller, J.N.; Miller, J.C. Statistics and Chemometrics for Analytical Chemistry, 4th ed.; Pearson Education Limited: Essex, UK, 2000; p. 271. [Google Scholar]
- Singh, J.; Kalamdhad, A.S. Effects of Heavy Metals on Soil, Plants, Human Health and Aquatic Life. Int. J. Res. Chem. Environ. 2011, 1, 15–21. [Google Scholar]
- Bungau, S.; Behl, T.; Aleya, L.; Bourgeade, P.; Aloui-Sosse, B.; Purza, A.L.; Abid, A.; Samuel, A.D. Expatiating the impact of anthropogenic aspects and climatic factors on long-term soil monitoring and management. Environ. Sci. Pollut. Res. Int. 2021, 28, 30528–30550. [Google Scholar] [CrossRef]
- Samuel, A.D.; Brejea, R.; Domuta, C.; Bungau, S.G.; Cenusa, N.; Tit, D.M. Enzymatic Indicators of Soil Quality. J. Environ. Prot. Ecol. 2017, 18, 871–878. [Google Scholar]
- Huang, S.; Peng, B.; Yang, Z.; Chai, L.; Zhou, L. Chromium accumulation, microorganism population and enzyme activities in soils around chromium-containing slag heap of steel alloy factory. Trans. Nonferrous Metals Soc. China 2009, 19, 241–248. [Google Scholar] [CrossRef]
- Samuel, A.D.; Tit, D.M.; Melinte, C.E.; Iovan, C.; Purza, L.; Gitea, M.; Bungau, S. Enzymological and physicochemical evaluation of the effects of soil management practices. Rev. Chim. 2017, 68, 2243–2247. [Google Scholar] [CrossRef]


Publisher’s Note: MDPI stays neutral with regard to jurisdictional claims in published maps and institutional affiliations. |
© 2021 by the authors. Licensee MDPI, Basel, Switzerland. This article is an open access article distributed under the terms and conditions of the Creative Commons Attribution (CC BY) license (https://creativecommons.org/licenses/by/4.0/).