Article

Environmental Footprint and Economics of a Full-Scale 3D-Printed House

1
Department of Civil Engineering, American University of Sharjah, Sharjah P.O. Box 26666, United Arab Emirates
2
Department of Civil and Environmental Engineering, University of Sharjah, Sharjah P.O. Box 27272, United Arab Emirates
*
Author to whom correspondence should be addressed.
Sustainability 2021, 13(21), 11978; https://doi.org/10.3390/su132111978
Submission received: 22 September 2021 / Revised: 22 October 2021 / Accepted: 26 October 2021 / Published: 29 October 2021

Abstract

:
3D printing, is a newly adopted technique in the construction sector with the aim to improve the economics and alleviate environmental impacts. This study assesses the eco-efficiency of 3D printing compared to conventional construction methods in large-scale structural fabrication. A single-storey 3D-printed house was selected in the United Arab Emirates to conduct the comparative assessment against traditional concrete construction. The life cycle assessment (LCA) framework is utilized to quantify the environmental loads of raw materials extraction and manufacturing, as well as energy consumption during construction and operation phases. The economics of the selected structural systems were investigated through life cycle costing analysis (LCCA), that included mainly the construction costs and energy savings. An eco-efficiency analysis was employed to aggregate the results of the LCA and LCCA into a single framework to aid in decision making by selecting the optimum and most eco-efficient alternative. The findings revealed that houses built using additive manufacturing and 3D printed materials were more environmentally favourable. The conventional construction method had higher impacts when compared to the 3D printing method with global warming potential of 1154.20 and 608.55 kg CO2 eq, non-carcinogenic toxicity 675.10 and 11.9 kg 1,4-DCB, and water consumption 233.35 and 183.95 m3, respectively. The 3D printed house was also found to be an economically viable option, with 78% reduction in the overall capital costs when compared to conventional construction methods. The combined environmental and economic results revealed that the overall process of the 3D-printed house had higher eco efficiency compared to concrete-based construction. The main results of the sensitivity analysis revealed that up to 90% of the environmental impacts in 3D printing mortars can be mitigated with decreasing cement ratios.

1. Introduction

The construction sector is responsible for significant environmental stresses, consuming 48% of global supplied energy on an annual basis and depleting the natural resources [1]. In addition to exploitation of materials, manufacturing of construction materials and operational works are responsible for 38% of worldwide greenhouse gas emissions [2]. The sustainable development goals demand continuous monitoring of emissions and potential health risks of the implemented system. Understanding the environmental impacts of infrastructure and construction practices aids in developing efficient energy techniques. Moreover, low fatalities and injuries are common in the construction industry which encourages the automation of construction-related techniques. Furthermore, automation of construction activities is preferred to account for low productivity rates. More specifically, labour productivity, which is defined as construction workload expressed in units per man hour, plays a key role in the capital investment of the project as well as meeting the global housing demand [3]. Current rates of productivity combined with an increase in urbanization has been a concern in sustaining the increasing housing demand which is estimated to reach 230 billion m2 in the next 40 years [4]. As a result, additive manufacturing has been proposed as an alternative to conventional construction. Additive manufacturing or 3D printing is being assessed as a potential solution to current methods of construction for energy reduction, automation of construction methods, mitigation of environmental impacts, and cost savings [2].
In addition to the consideration of materials, the construction industries face a continuous challenge of having to complete construction of the structures within the shortest time, while still having to maintain safety and work quality. Innovations in the construction industry have explored different techniques to account for the technical drawbacks and environmental impacts associated with conventional construction techniques. Automation of activities in the construction site have been proposed, particularly additive manufacturing or 3D printing technology, to improve construction practices [5]. The additive manufacturing process operates by continuously adding a layer-by-layer extrusion paste. It is also defined as a method of digitally fabricating materials via printers [6]. Each 3D printed layer is a 2D representation from the computer aided design (CAD) or building information modelling (BIM) model that is deposited to the printer [7]. Digital fabrication enables customization and assembly of complex designs. Attempts have been made to utilize 3D printing techniques in the construction industry and evaluate the sustainability and implications on the economic, environmental and social aspects [5]. A case study in China demonstrated the potential of large-scale 3D printing, whereby several houses approximately 200 m2 have been built using high quality cement alongside glass fiber to enhance strength [8]. Another application represented the functionality of 3D printing by prefabricating the components of a 5 storey building and later assembled on site [9]. Wu et al. [7] asserted the importance of selecting appropriate material to attain the desired level of detailing and withstand the loading on the structure. A Complex design of a 12 m × 12 m × 12 m house with complex details has been successfully implemented using 3D printing [7]. The house was printed with glass reinforced plastic extrusion paste which was able to resist corrosion, aging and water seepage.
Digital fabrication foresees the potential of mitigating the environmental constraints and reducing the materials used in building sector [4]. Moreover, utilization of 3D printing technology in the construction industry can potentially lead to a reduction of energy supply and overall emissions up to 5% by 2025 in large scale projects (i.e., large filament size) [4]. The environmental performance of implementing additive manufacturing methods in the construction sector has been explored. Several studies investigated the environmental impacts of additive manufacturing in the construction industry using life cycle assessment (LCA) systematic framework. Sinka et al. [10] explored the environmental impacts of different 3D printing cement and gypsum binders. The results revealed that gypsum-based mixes had an overall reduction in GWP of 84% as a result of lower energy use. Other studies investigated the performance of different construction elements. Mrazović et al. [11] compared the environmental performance of conventional and 3D-printing of different metal building elements (such as steel frame and steel brackets). Additive manufacturing proved to be compatible for construction which achieved 40% lower environmental impact (compared to conventional manufacturing methods) [11]. Agustí-Juan et al. [12] utilized LCA to identify the viability of constructing walls with varying complexities using 3D printing compared to conventional construction techniques. The results revealed that complexity of structures did not increase the overall costs and the design of the structure was not responsible for environmental constraints as opposed to conventional building techniques. Moreover, the literature has been focused on studying the environmental impacts particularly, climate change potential and energy consumption as they have been reported to have the greatest effects [13]. The climate change impact of conventional walls was 75%, whereas the 3D-printed wall had negligible impact (2%). Climate change was reported to have significant environmental impacts as a result of the GHGs emissions during the material production, manufacturing, transport and construction phases [12]. Another case study assessed the environmental impacts from the materials production and operation of 3D-printed wall and roof structures [14]. Results highlighted the minimal impacts of operation of fabrication robots, while the mainstream energy consumption originates from material production. Mohammad et al. [15] also investigated the environmental performance of 3D printed walls compared to conventional reinforced concrete ones. The 3D concrete printing (3DCP) scenarios yielded lower emissions in terms of global warming potential and acidification potential. The study further combined conventional reinforcement with 3DCP, and the environmental impacts were still lower than conventional construction techniques.
All of the above mentioned studies only assessed the environmental impacts of different structural elements, on the other hand, Han et al. [16] developed a 3D model simulating a 3D-printed house. The emissions were calculated using equations from the literature. The findings of the study revealed that construction using 3D printing technology resulted in higher emissions when compared to cast in-situ conventional concrete. Moreover, the study attributed the high emissions to cement production processes. Another study compared the environmental impacts of 3D printing and conventionally built house [17]. The study utilized concrete and cob (a sustainable material) to run the analysis. The 3D printing technology acquired lower impacts compared to conventional concrete construction. In terms of materials, cob attained lower impacts, nevertheless, 3DCP binder consumed less energy. In terms of economic viability, a case study in the United Kingdom investigated the financial feasibility of 3D printed residential structures using life cycle costing analysis (LCCA). The findings of the study revealed savings up to 35% when compared to conventional houses due to lower material consumption and eliminated labour cost [18].
Conventional construction is responsible for significant environmental and safety risks which compels introduction of new efficient and feasible alternatives. Digital technologies, particularly 3D printing, have been successfully implemented in the field of construction. Evaluation of the systems encompasses quantification of environmental impacts using the standard LCA tool and economic value of building structures using conventional manufacturing methods versus 3D printed methods. The capital and energy costs incurred over the life cycle of the examined structural systems are estimated using life cycle costing analysis. An eco-efficiency analysis is used to combine the results of the LCA and LCC into a single framework to assist decision makers with the choice of the optimum construction method taking account the environmental and economic perspectives. A search of recent publications (Table 1) in this field showed that most of the studies focus primarily on developing the 3D printing mortar and utilizing sustainable materials. The literature lacks comprehensive and integrated environmental and economic assessment of large-scale 3D printed buildings. Since this technology is under development, more studies are needed to optimize the materials and methods used from both environmental and economic perspectives. This study aims to enrich the literature with comprehensive assessment of such a knowledge base which is essential to drive the shift towards digital fabrication construction. This study provides a comparative assessment of a 3D-printed structure compared to conventional concrete construction. The comparative assessment is applied on an actual single-storey house located in Dubai, United Arab Emirates (UAE).

2. Methodology

In this section, the structural system components and configurations were discussed, followed by a description of the 3D printing technology utilized to construct the house understudy. Moreover, the standard methods of the environmental and financial life cycle analyses were presented.

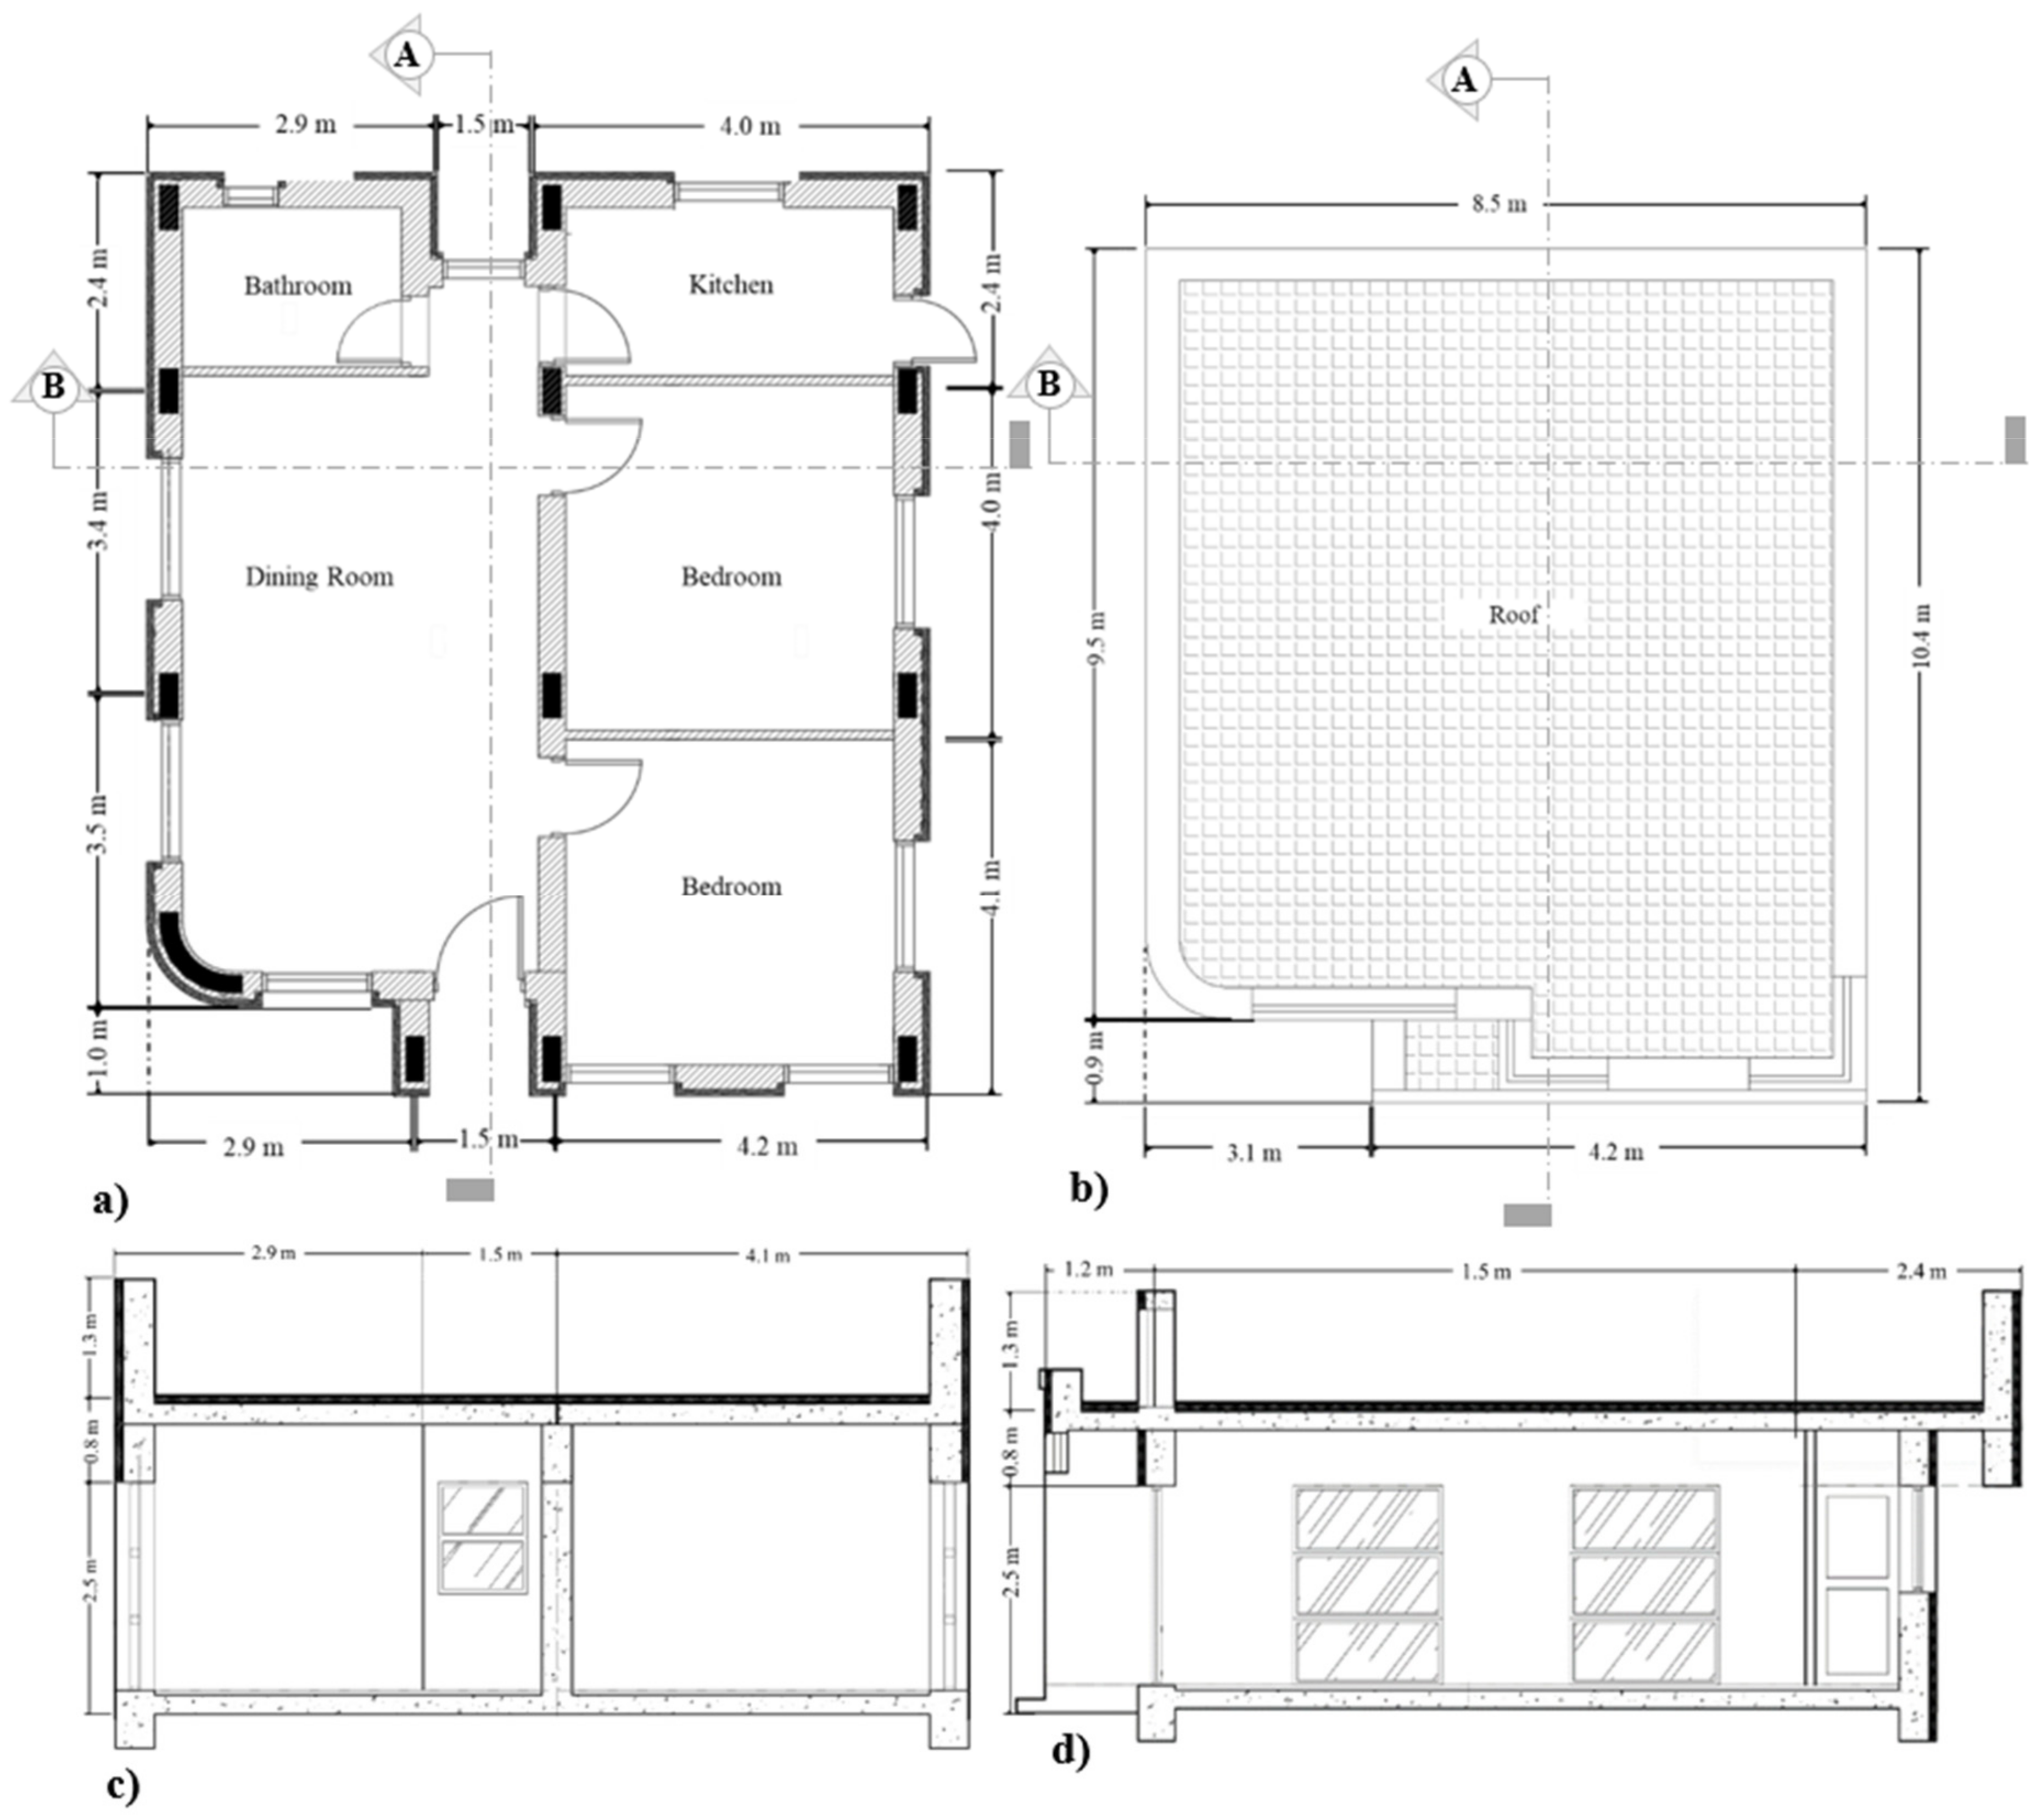
2.1. Structural Systems

A single-storey detached house located in the UAE was selected as a case study. Figure 1 shows the plan and elevation layouts of the selected house with a net floor area of 90 m2 and total height of 4.5 m. The proposed structural systems include (1) conventional construction method using cast in place concrete walls and flat slab with beams and columns, and (2) additive manufacturing using self-reinforced printable mortar. It should be noted that the construction time frame of the 3D printed house was approximately 2 weeks, whereas the conventionally built house was 4 months based on local engineering contractors. The timeframe excludes the HVAC, plumbing, and finishes works as they are similar in both houses.
Table 2 shows the details of the structural elements utilized for conventional concrete construction. The columns and beams have a cross-sectional area of 800 and 1600 cm2, respectively, whereas the slab has a total area of 376 m2. Wood formwork was utilized in construction of the columns, beams, and slabs of 3.8 m2, 47 m2, and 400 m2, respectively. There are 0.03, 0.04, and 0.245 m3 of columns, beams, and slabs per m2. The design of the steel reinforcement, confinement steel, and stirrups were conducted according to American Concrete Institute (ACI) standards [19]. Moreover, the considered primary loads in this study were the typical dead and live loads defined by American Society of Civil Engineers (ASCE) 7–10 [20].
The specifications and properties of the cementitious mortar used for conventional concrete and 3D printing mixtures are summarized in Table 3. The conventional concrete mix has cement, sand, and aggregates ratio of 1 to 1.5 to 1.3, respectively, while the cementitious 3D printing mortar consists of 70% sand and 30% binder (cement and additives) [21]. Moreover, the mix of the 3D printing mortar is characterized by low sulphate and chloride content which was designed for structural and non-structural elements.

2.2. Additive Manufacturing Technology

The application of a large-scale 3D printed structure entails using an extrusion method, in which the structure was built by adding layers of the prepared mortar through a nozzle. The digital STL (STsereo Lithography) formatted file was converted into several 2D layers by means of CyBe CHYSEL software [21]. Moreover, Table 4 summarizes the input parameters required for the operation of the mobile 3D printer. Furthermore, the printing process was regulated through a control unit which operates the mixing system to pump the mortar through a hose into the robotic arm. The mortar was added layer by layer at the specified coordinates via a 40 mm nozzle. The 3D printing filaments were characterized by a zigzag pattern and the printed walls were hollow (39 cm).

2.3. Life Cycle Analysis

The environmental impacts and burdens on the ecosystem of production, construction, operation, and disposal stages over the life cycle of a system was quantified using the LCA systematic framework. The international organization for standardization (ISO) developed ISO 14044 and ISO14045 to unify the approach of evaluating the load on the environment, address the resulting ecological impacts and identify potential performance enhancement over the lifecycle of the systems [22,23]. Two LCA approaches are commonly investigated in the construction industry, namely, cradle to grave and cradle to site. The first method includes all materials and processes in a comprehensive assessment, while the second approach focuses on certain aspects of the construction project such as the materials [17]. In this study, a cradle to site approach was selected and the LCA was performed in four stages including, goal and scope, life cycle inventory (LCI), and life cycle impact assessment (LCIA) analysis, and results interpretation. Stage one of the LCA involves defining goal and scope as well as the system boundaries and functional unit. The LCI phase includes collection of data, while the third sage (LCIA) examines the contribution of these data to selected impact categories. Stage 4 involves assessment of the results and identifying study limitations. SimaPro 9.0 developed by PRé Sustainability was utilized to implement the LCA framework using Ecoinvent 3.0 [24].

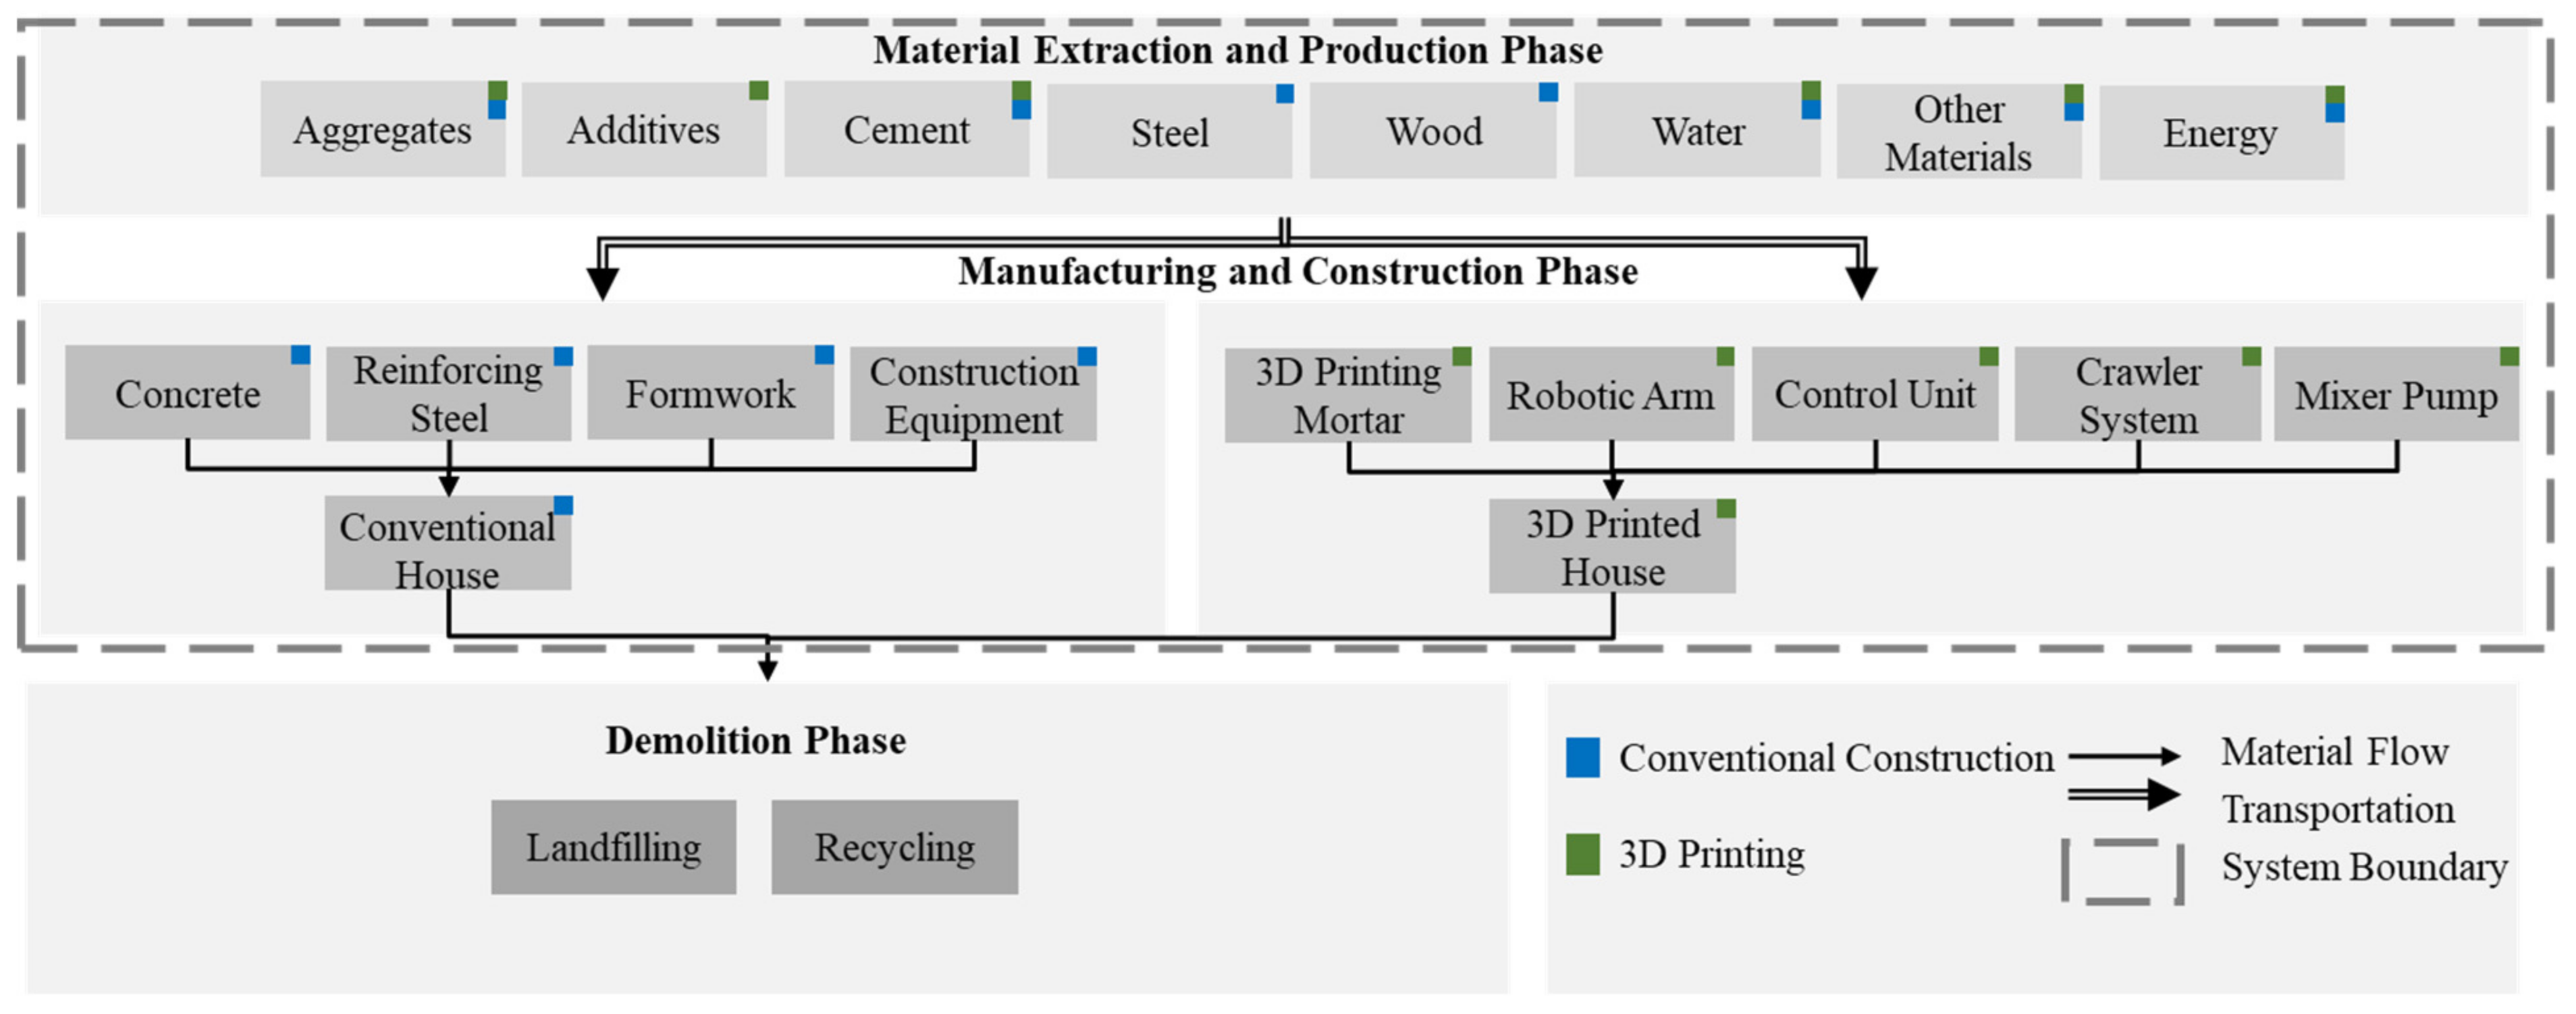
2.3.1. Goal and Scope Definition

The goal of this study is to evaluate the environmental performance of a 3D printed house compared to conventional construction techniques. Measuring the functionality of both construction techniques output was achieved by selecting a reference or a functional unit; 1 m2 of the single-storey house surface area was selected for simplification of inventory data calculations. Figure 2 shows the boundaries of the examined systems including, production and manufacturing of materials, construction, operation, maintenance, and end of life phase. However, the LCA assessment was limited to material extraction, construction, energy consumption, and transportation during the operation phase. Similar components in both structural systems were excluded i.e., earthworks, HVAC systems and finishes. The labour and end of life phase were excluded from the study as they were found negligible [17]. Moreover, all of the reviewed literature (Table 1) excluded the end of life or demolition phase as a result of lack of available data.

2.3.2. Life Cycle Inventory

The input data related to 3D printing and conventional construction were gathered from local suppliers, Ecoinvent database and the literature. Such technical data include foreground components such as quantity of materials, transportation, and energy consumption. Moreover, background data of the environmental burdens were assigned to the foreground processes and components. Table 5 lists the inventory data of the examined structural systems, in which energy consumption of the equipment utilized on-site can be measured from the power demand and operation time of such machinery.

2.3.3. Energy Consumption

The energy consumption rates in the construction sector reach up to 40% of the total energy demand [28]. The primary electricity consuming sources are the cooling systems as a result of the harsh climate of the UAE with temperatures reaching up to 48 °C, hence the construction sector is constantly exploring efficient heat insulating materials to prevent overheating and humidity increase. The European commission has reported that buildings are responsible for at least 40% of the total energy consumption Particularly, air conditioning is a major energy consuming element in a building, hence reduction of cooling load demand by thermal insulation through construction materials inducing low heat transfer can save up to 50% of the building energy demand [29]. The energy savings for the 3D-printed and conventional concrete house were calculated based on the difference between the microclimate and the air temperature surrounding the structure as well as the thickness of the structural elements (external walls and roof). The ISO standard (EN ISO 6946:2008) reported the key factor to indicate the thermal properties of the building is heat transfer (U) in which lower U-value indicates higher energy savings [30]. The U-value [31] and the energy transfer or heat flow (Q) [32] were calculated using Equations (1) and (2) [33,34]:
U = k × A l
Q = Δ T × U × A
where U is the thermal transmittance (W/m2·K), k is the thermal conductivity of a material (W/m·K), A is the plane area of (m2), l is the thickness of material (m), Q is heat flow (W), and ∆T is the temperature difference between external and internal structural element surface (°C). The heat transfer through individual rooms of the house, the windows, and doors was calculated. The design temperature outside and inside the house was specified by local guidelines as 46 °C and 24 °C, respectively. Moreover, the U-value of the floor and roof slabs were obtained from local standards and they were compared to ASHRAE (American society of heating, refrigerating and air-conditioning engineers) specifications based on perimeter to area ratio and thermal resistance values [33,34].

2.3.4. Life Cycle Impact Assessment

The environmental impacts of the digitally fabricated and conventionally built house were estimated using ReCiPe 2016 V1.03 midpoint (H) indicators [35]. The method represents the impacts of a global representative and addresses 18 different categories. The impact mechanisms include climate change or global warming potential (kg CO2 eq) ozone layer depletion (kg CFC-11), terrestrial acidification potential (kg SO2), marine eutrophication (kg N), freshwater eutrophication (kg P), human toxicity (kg 1,4dichlorobenzeen), particulate matter formation (kg PM2.5), ionizing radiation (kBq Cobalt-60), photochemical oxidant formation (kg NMVOC), terrestrial, freshwater, and marine ecotoxicity (kg 1,4dichlorobenzeen), agricultural and urban land occupation (m2), freshwater depletion (m3 water consumed), mineral resource depletion (kg Copper (Cu)), and fossil fuel scarcity (kg oil) [35]. The impact categories represent the effect on the environment and are based on weighted and normalised factors [36].

2.4. Life Cycle Costing Analysis

The financial viability of 3D printing and conventional construction techniques was investigated by calculating the construction and energy use costs. The capital cost of the examined projects included procurement and manufacturing of construction materials e.g., cement, steel, wood, aggregates, and admixtures, as well as construction activities. The present value (PV) of the electricity costs of the systems was estimated for a period of 50 years, which was carried out via LCCA framework to estimate the present worth of the energy consumed in the 3D printed and conventionally constructed house. Moreover, the time value of the cashflow was considered in this study using a local-based discount rate of 3% [37]. Equation (3) is used to calculate the present value [38]:
PV = t = 1 T C o , t 1 + r t
where Co is the cash outflow (USD) of year t, r is the discount rate (%), and T is the lifespan of the project.

2.5. Eco-Efficiency Analysis

Selection of an optimum alternative and identification system trade-offs can be accomplished through an eco-efficiency analysis. Such analytical framework functions by agglomerating LCC and LCCA results, which are plotted into a single portfolio [23]. The ratio method is the most commonly used approach to determine the eco-efficiency of a system or a product [39,40,41]. In this study, the ratio method was employed which is defined as the ratio of economic indicator to environmental performance of the examined system as shown in Equation (4) [41].
Eco efficiency   =   Environmental   Performance Economic   Value
The Environmental indicator in this research study was retrieved from the LCA SimaPro software represented by a normalized and weighted single value aggregating all the midpoint categories. Moreover, the present value was utilized which corresponds to the economic indicator of each assessed system. An eco-efficiency portfolio combining environmental and economic scores was plotted for the selection of the most eco-efficient system and assessing the trade-off among the studied alternatives.

3. Results and Discussion

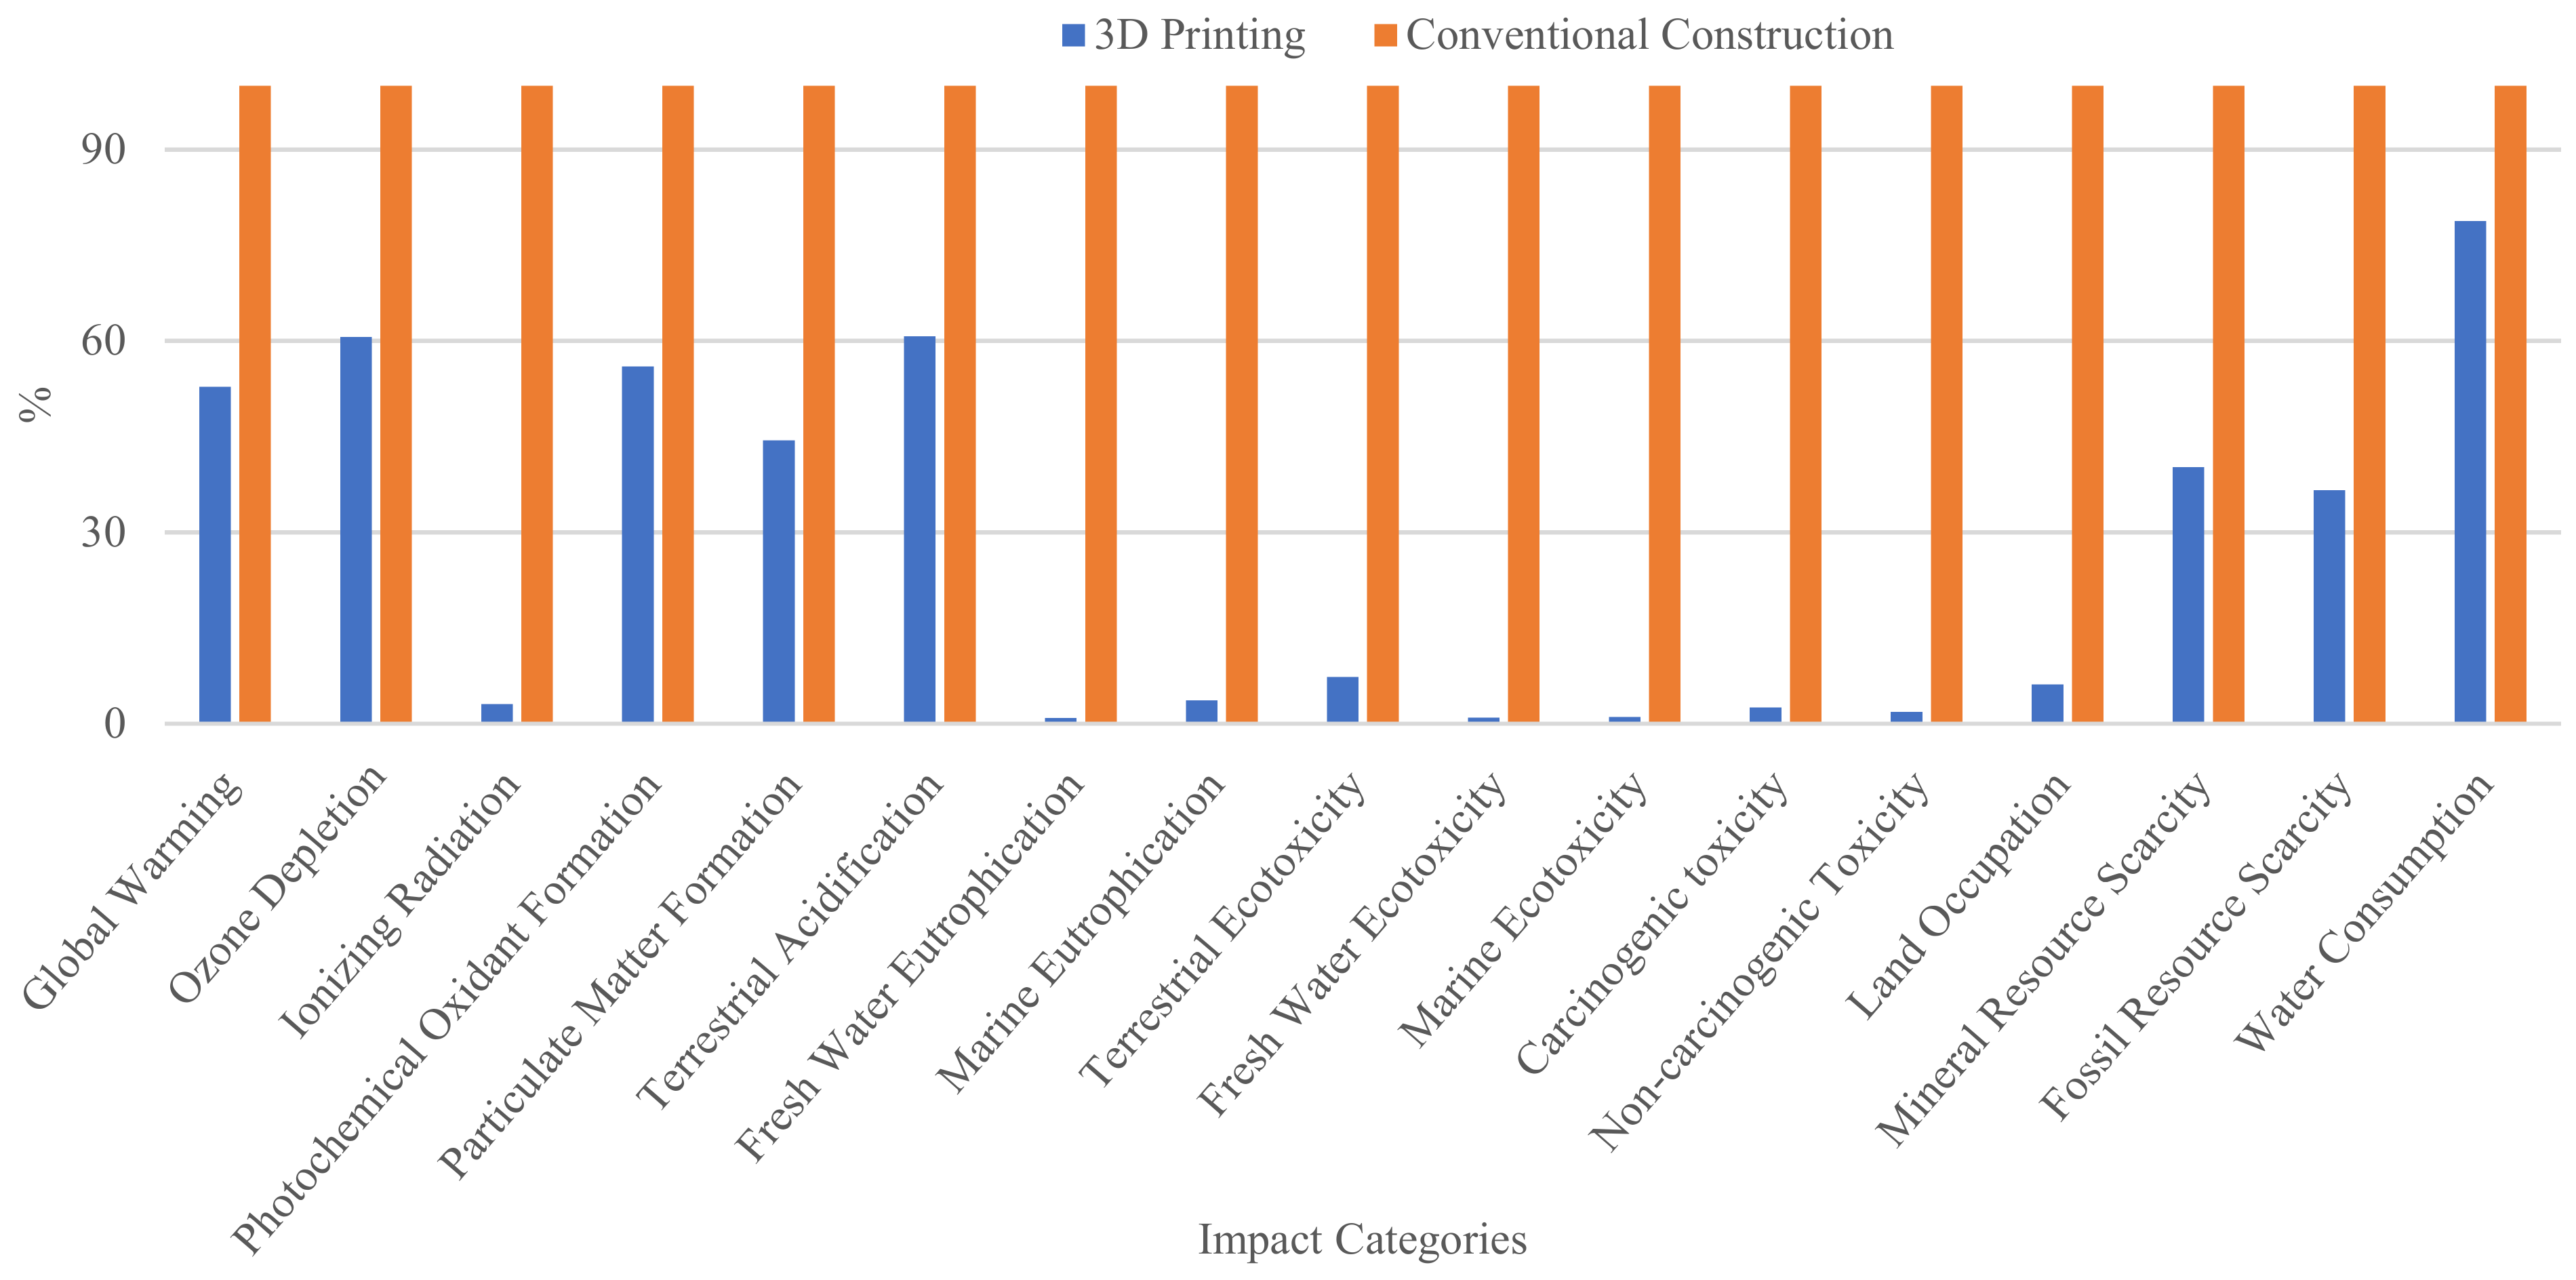
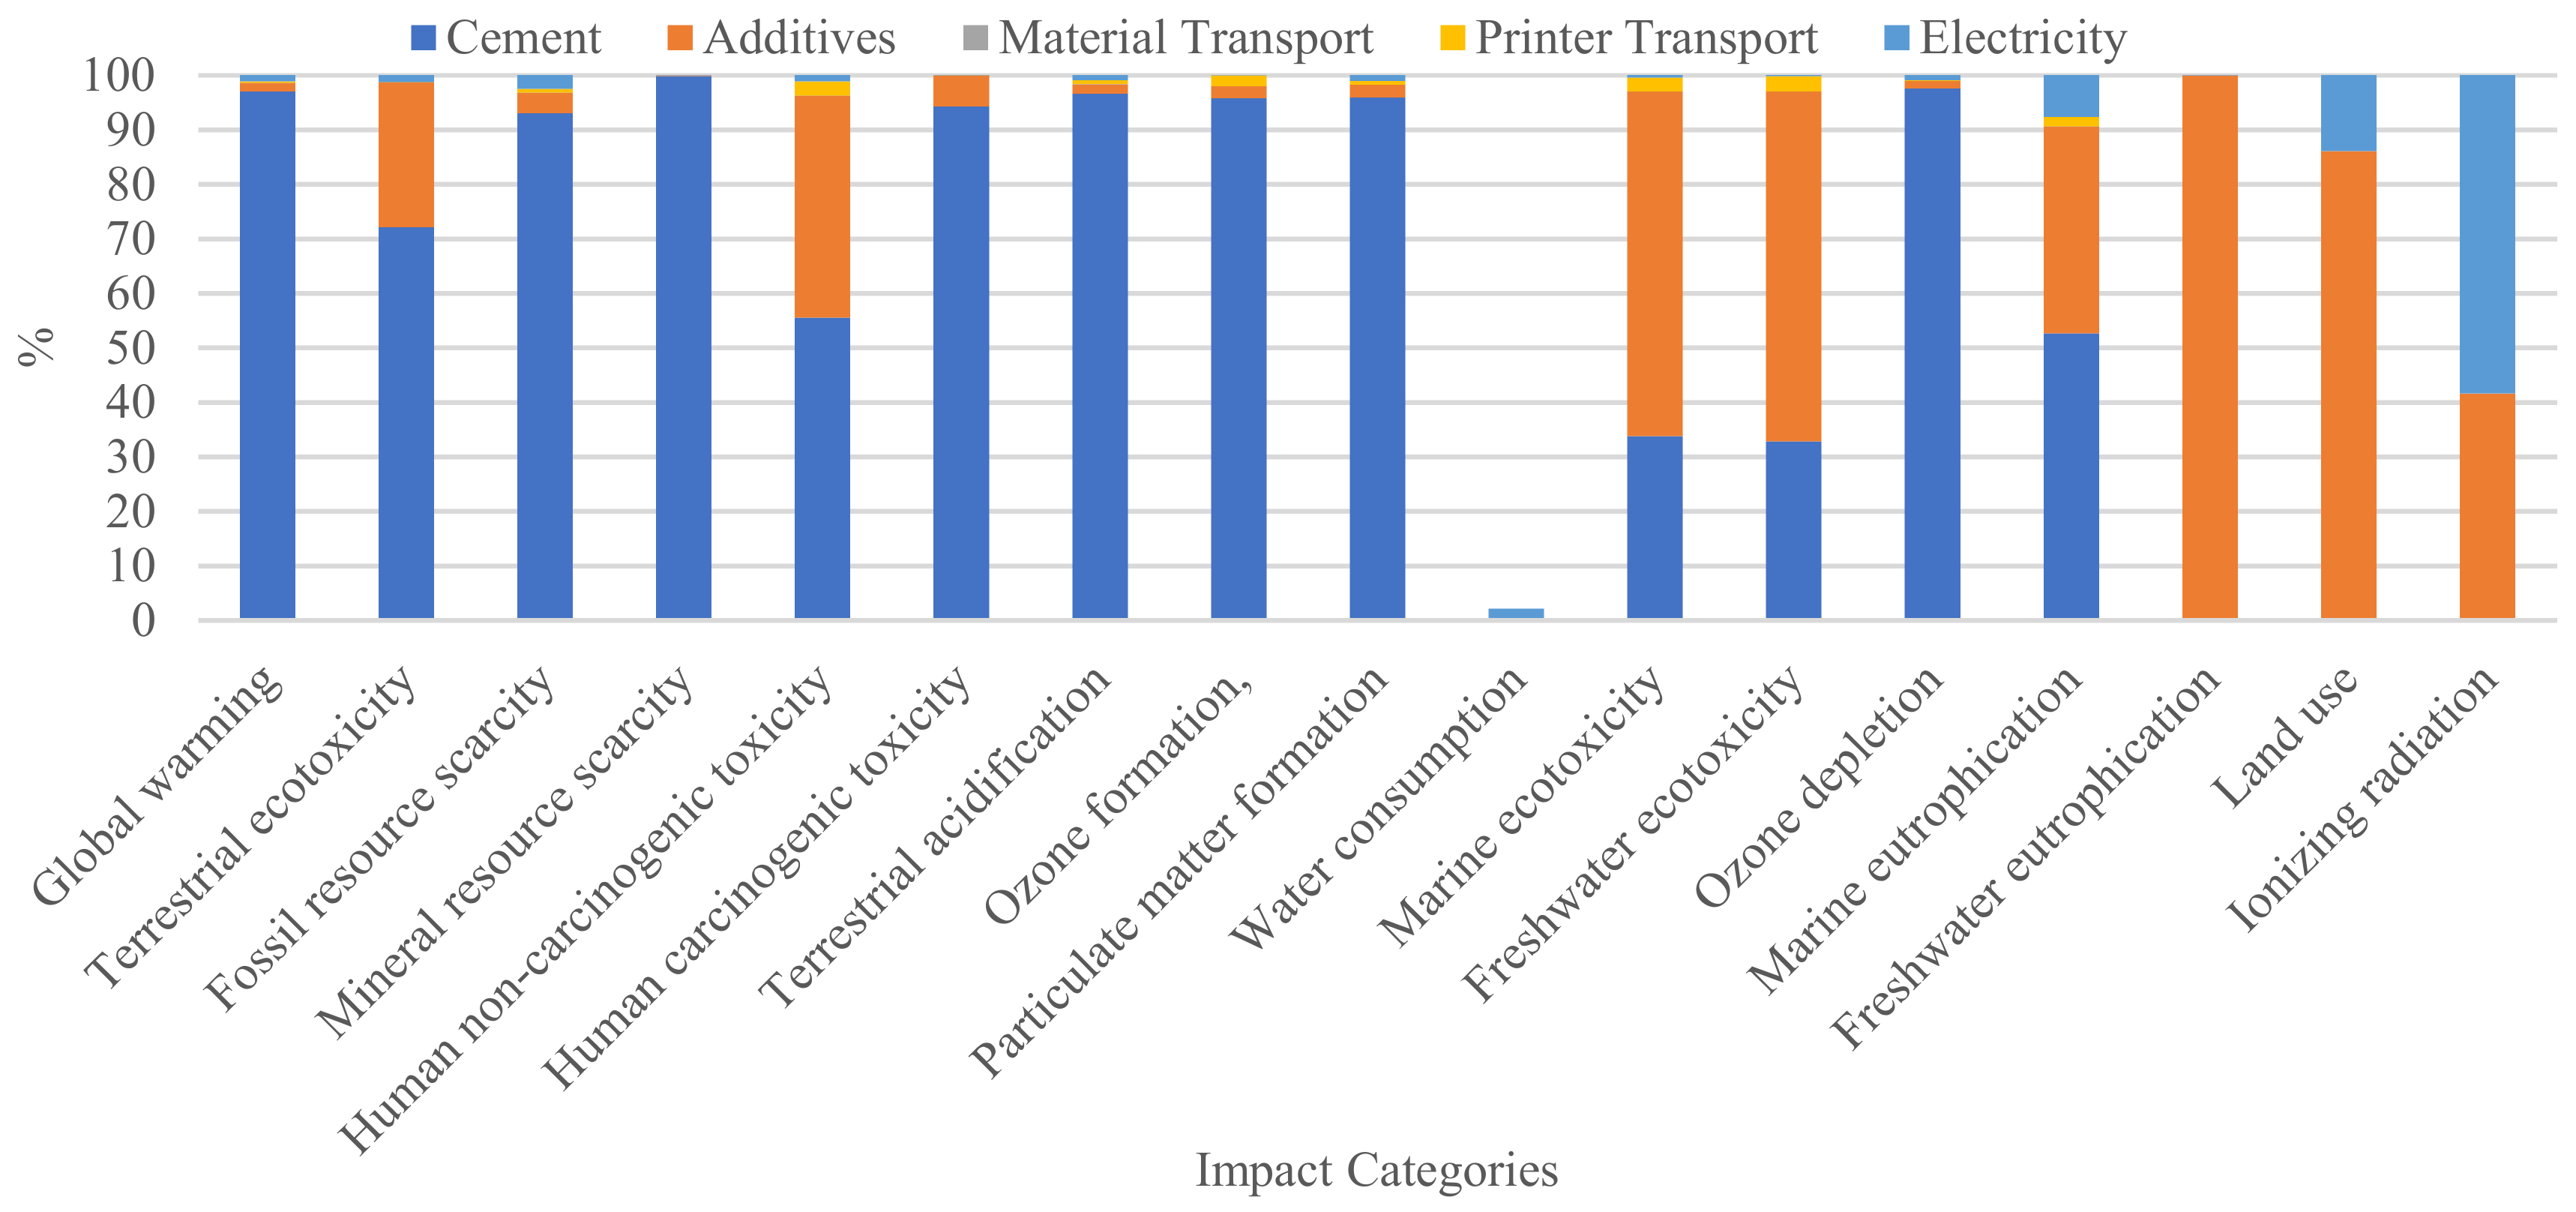
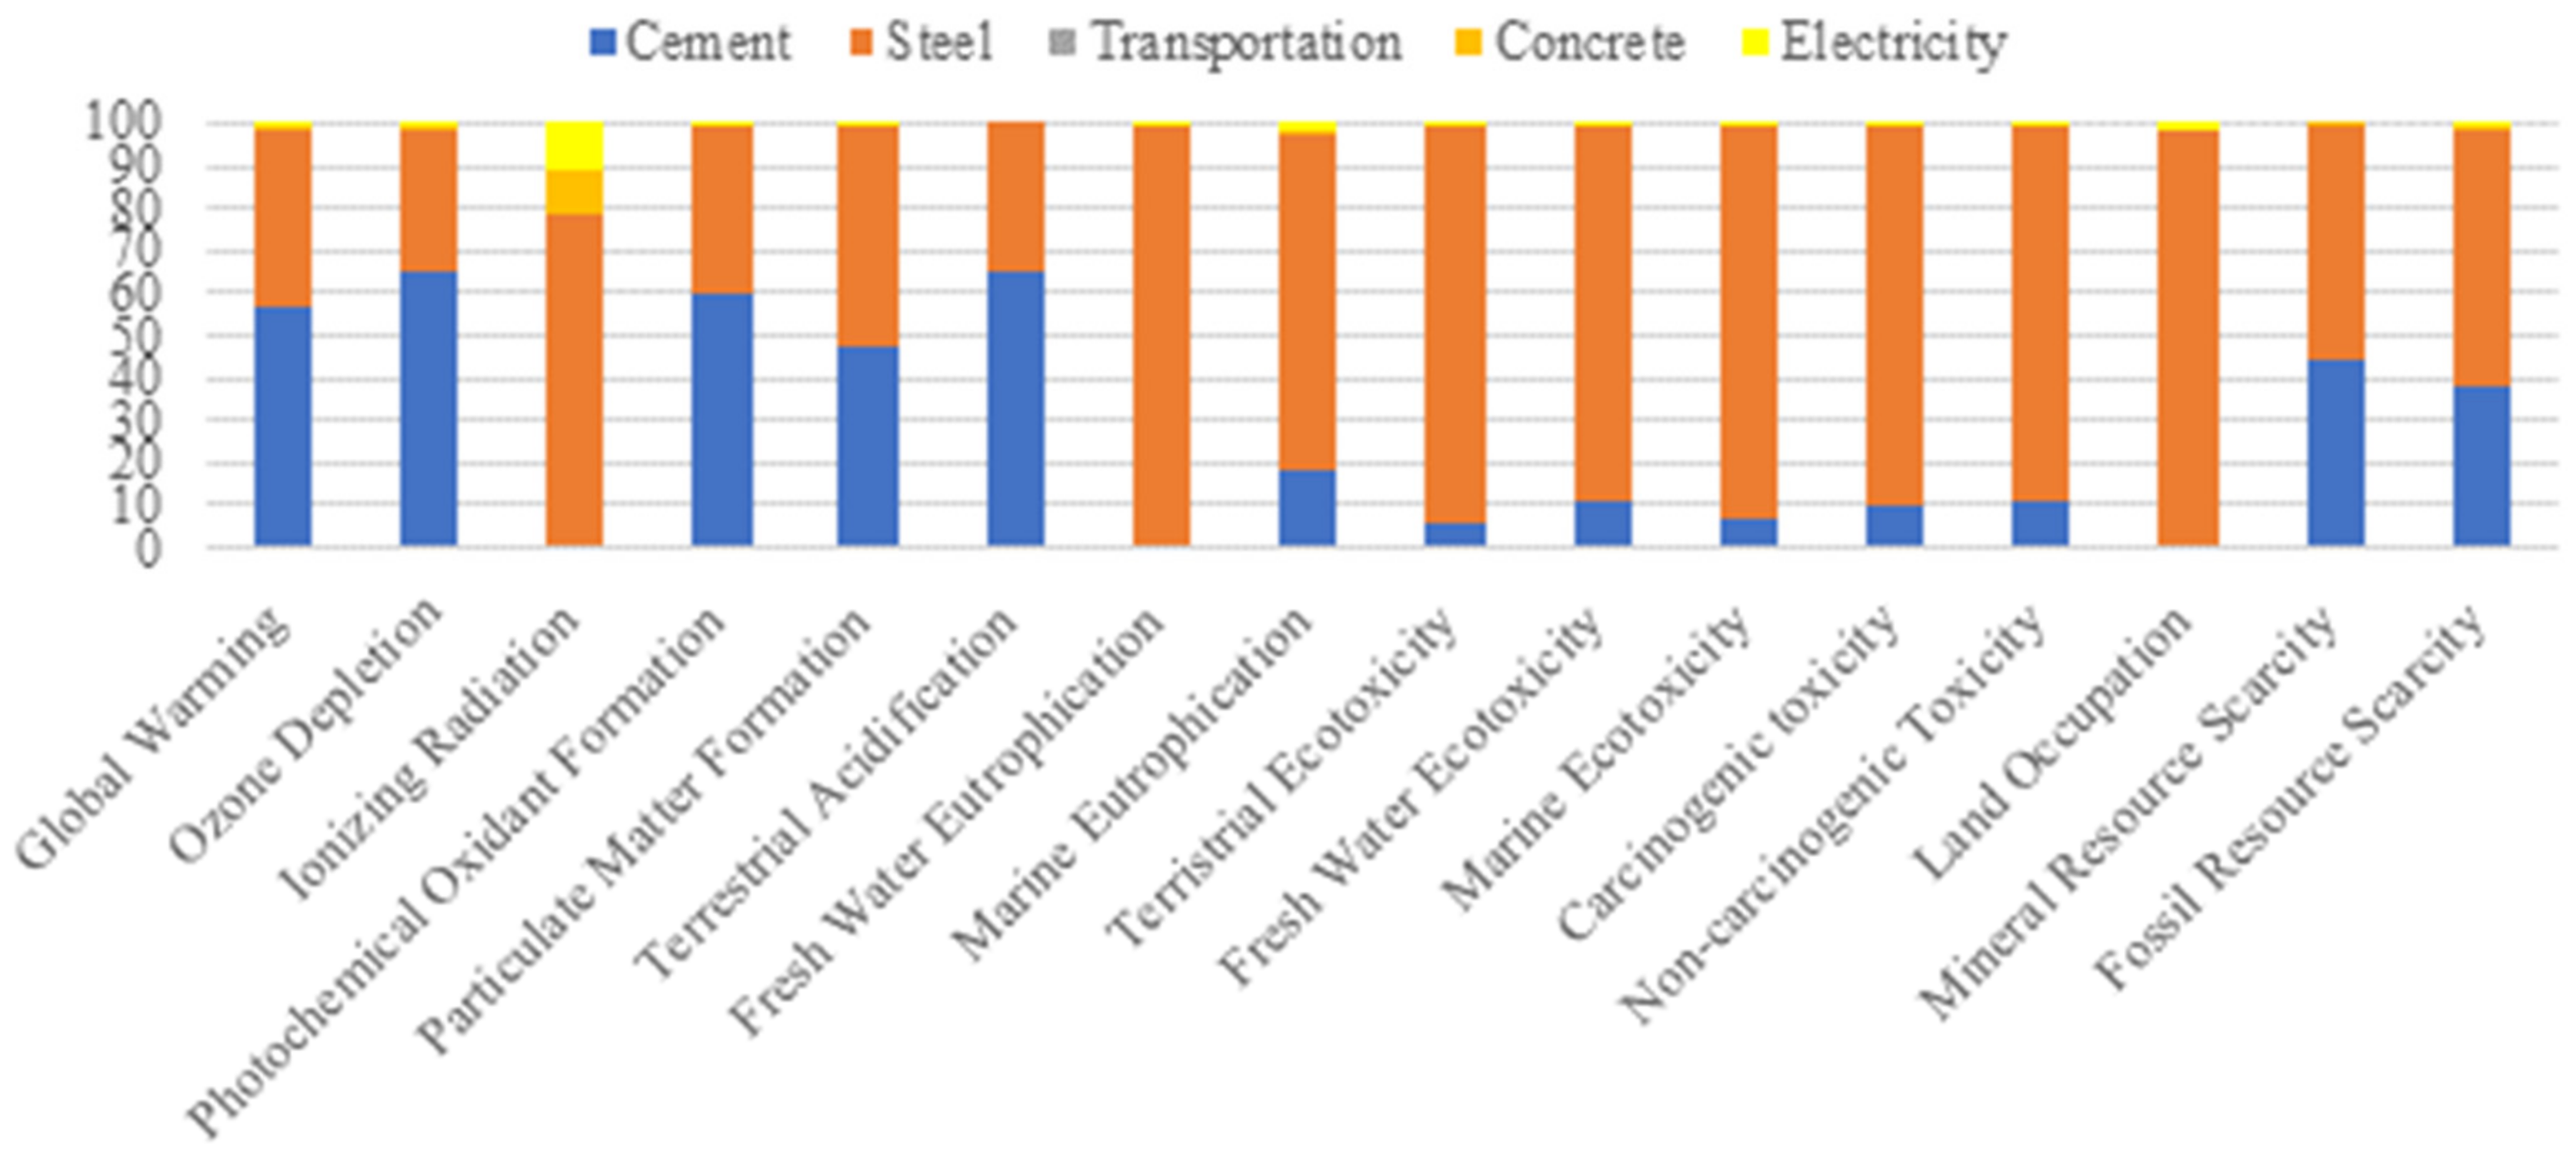
3.1. Environmental Analysis

The LCA results analysed in this section represent a comparison of additive manufacturing and conventional construction techniques in terms of the environmental impacts. The environmental impacts of the studied scenarios were calculated via SimaPro in 4 stages—characterization, damage assessment, normalization, and weighing [24]. During the first stage (characterization), the materials were multiplied by a factor that represents the relative contribution. The damage assessment facilitates the use of endpoint categories, where impacts with the same units can be added. Normalization stage enables comparison among scenarios in which the impacts are divided by a reference. The weighing phase is typically performed by multiplying the impact categories with a factor and adding them to result in a single score. This score is an indication of the total impacts. Table 6 provides detailed environmental performance scores for each impact category of the 3D-printed and concrete-based house. Most impact categories had significantly higher values for the conventional construction method. Among the highest scored impacts in the conventionally built house were global warming, non-carcinogenic toxicity, water consumption, carcinogenic toxicity, and fossil resource scarcity. Cement production contribution to global warming potential (1154.2 kg CO2 eq) was approximated to be 70%. Moreover, reinforcing steel production and manufacturing comprised 98 and 97% of the total emissions of non-carcinogenic and carcinogenic toxicity with relative impact of 675 and 169 kg 1,4-DCB, respectively. Furthermore, fossil scarcity (150 kg oil eq) was attributed to the manufacturing of steel (60%) and cement (38%), and the high-water consumption was mainly due to addition of water during concrete manufacturing. The Global warming potential and water consumption had relatively high impacts for the 3D-printed house. As for the concrete constructed house, global warming potential (609 kg CO2 eq) was high due to production and manufacturing contributing 97% and water consumption with a volume of 184 m3 per functional unit was attributed to water demand during 3D mortar preparation. The endpoint indicators were represented by a single score that combines all the inventory results in one factor. For the 3D-printed and the conventional house, the human health category had substantially higher impacts compared to effect on ecosystem and natural resources indicators. Human health category caused 93 and 88% of overall emissions of the conventional construction and 3D printing scenarios, respectively.
The obtained results from SimaPro were normalized and weighted to provide holistic assessment. Normalization enables for a coherent interpretation of the characterized environmental impact categories through referring to a reference scheme, followed by weighting which emphasizes the relative significance of the impact indicators. Figure 3 shows the relative environmental impacts of the examined systems analysed based on different impact categories. It is evident that 3D printing has an overall lower impact across all categories. The 3D printing scenario performed more than 50% better for the majority of the categories which may be attributed to the material efficiency compared to the conventional scenario. Typically, conventional building requires formworks and reinforcing steel, which are absent in the 3D printing scenario. Therefore, all emissions related to the production, manufacturing, transportation, and fabrication of materials are reduced. The damage to the ecosystem was minimal where the midpoint categories pertaining to freshwater marine, and terrestrial species had relatively low percentage (0–7%). Though all categories of 3D printing had lower impacts, the water consumption category was only 20% better for the 3D printed house due to high water use during cement production processes and electricity generation, which is common to both construction methods.
In the digitally fabricated house, cement production phase contributed (more than 95%) to most of the impact categories i.e., global warming, ozone depletion, terrestrial acidification and ecotoxicity, human carcinogenic impacts, and fossil and mineral resource scarcity as shown in Figure 4. Moreover, material extraction and production of the utilized admixtures was a major contributing process to land occupation, freshwater eutrophication, ionizing radiation, marine and freshwater ecotoxicity, and non-cariogenic human effects, with 99, 98, 97, 61, and 40%, respectively. Electricity and transportation obtained the lowest ratio in all environmental impact categories with impacts ranging between 0 to 2%.
The contribution of the different impacts i.e., production of cement and steel, manufacturing of concrete, transportation, as well as electricity production are shown in Figure 5. The cement production shows the highest contribution in all impact categories due to significant consumption of raw materials and energy, the greenhouse gas emissions during manufacturing phase, and the release of bulk amounts of waste. Moreover, the environmental analysis revealed that reinforcing steel production and manufacturing processes had a primary impact on freshwater eutrophication (99%), land occupation (98%), terrestrial and marine ecotoxicity (93%), carcinogenic, non-carcinogenic and freshwater ecotoxicity (89%), fossil resource scarcity (60%), and global warming (41%). Similar to the conventional house results, the electricity scored the lowest in all categories except ionizing radiation (11%). Overall, the exploitation of materials, energy use, and transportation during manufacturing of concrete components poses the highest environmental risks as can be deduced from Figure 5.
The results of this study agree with the outcomes of [2,12,17], which reveals that 3D printing structures outperform the conventional construction methods in terms of overall environmental impacts. The main difference in this study was conducting the analysis for the entire house, whereas [2,12] studied the impacts on individual elements (wall, roof, and a concrete slab) with varying design complexities and included the operation phase for the self-shading wall element. Moreover, the 3D printing mortar ratios and components in this study was tested for an implemented project in the UAE, while Agustí-Juan and Habert [2] adopted a fiber reinforced concrete from the literature and Alhumayani et al. 16 tested out three different mixes also compiled from the literature and compared the results. Furthermore, Agustí-Juan et al. [12] designed a high performance 3D printing concrete which was found to increase the GHG emissions when compared to conventional concrete mix.

3.2. Operational Energy

The cooling energy demand for the 3D-printed and conventionally constructed house was calculated considering the thermal transmittance of the construction mortars. Table 7 summarizes the cooling systems calculation results for the 3D-printed and conventionally constructed house. Overall, the total heat transfer (gain) of the conventional building system was 5% more than the 3D printed house. The 3D printed house acquired less heat gain due to higher material thickness and thermal transmittance (K). In other words, the lower thermal conductivity and thickness of materials the lower heat transmission. Another contributor to low heat conduction is U-value, where the slabs of a 3D-printed house had lower U-values compared to the conventional concrete house. On the other hand, the insulating properties of the 3D-printed wall including an air cavity had a much higher U-value (3.75 W/m2·K) which is in close proximity to the concrete wall (3.6 W/m2·K).

3.3. Economic Assessment

The economic analysis findings of the selected structural systems are summarized in Table 8. The results comprise capital costs of materials (local-based) including civil works and operational expenditures of cooling systems. The conducted present value over a 50-year design period indicates that conventional construction technique was the most expensive alternative (USD81,064) which was double the cost of the 3D printing. This can be attributed to the cost of concrete, and formworks which comprise 51 and 24%, respectively. The capital expenditures of concrete are associated with the purchase and manufacturing of various sub-components, mainly aggregates (USD10,795). Although the steel cost rate (USD500/ton) was the highest, it had the least contribution to the overall cost. On the other hand, the 3D printing technology was found to be 49% cheaper than the conventional construction scenario. The 3D printing excludes multiple aspects including construction components, e.g., concrete and formworks, as well as labor cost, thus reducing the overall capital costs. These results are in line with [18], where the 3D printing of houses contributed to 35% savings compared to conventional construction.

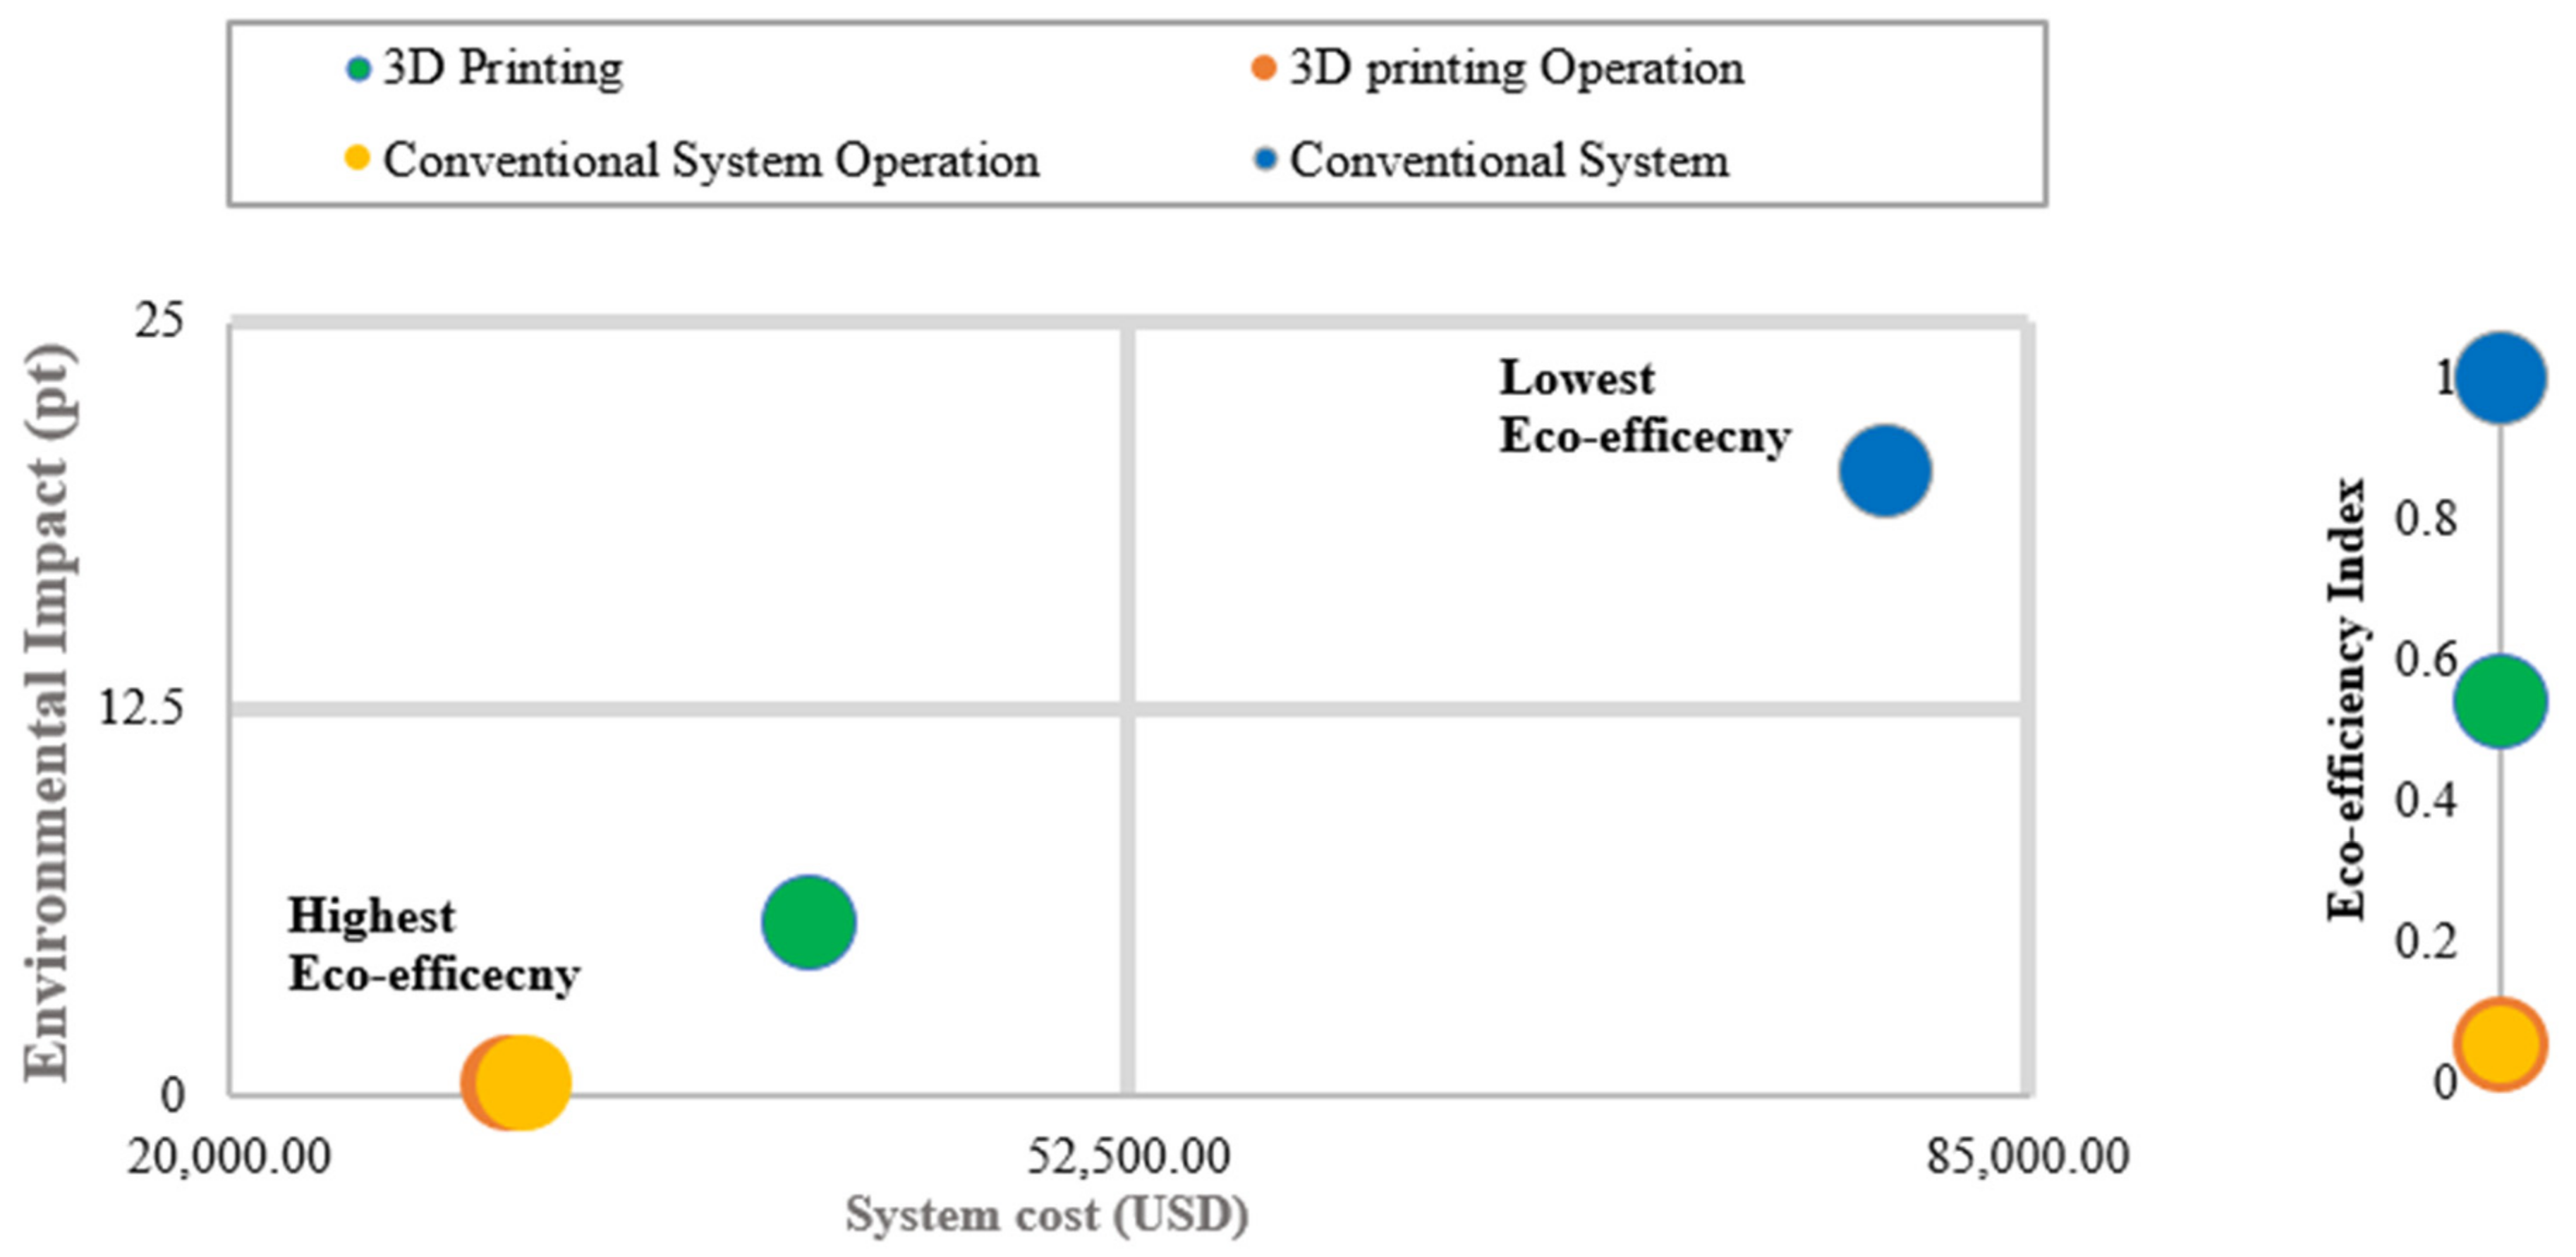
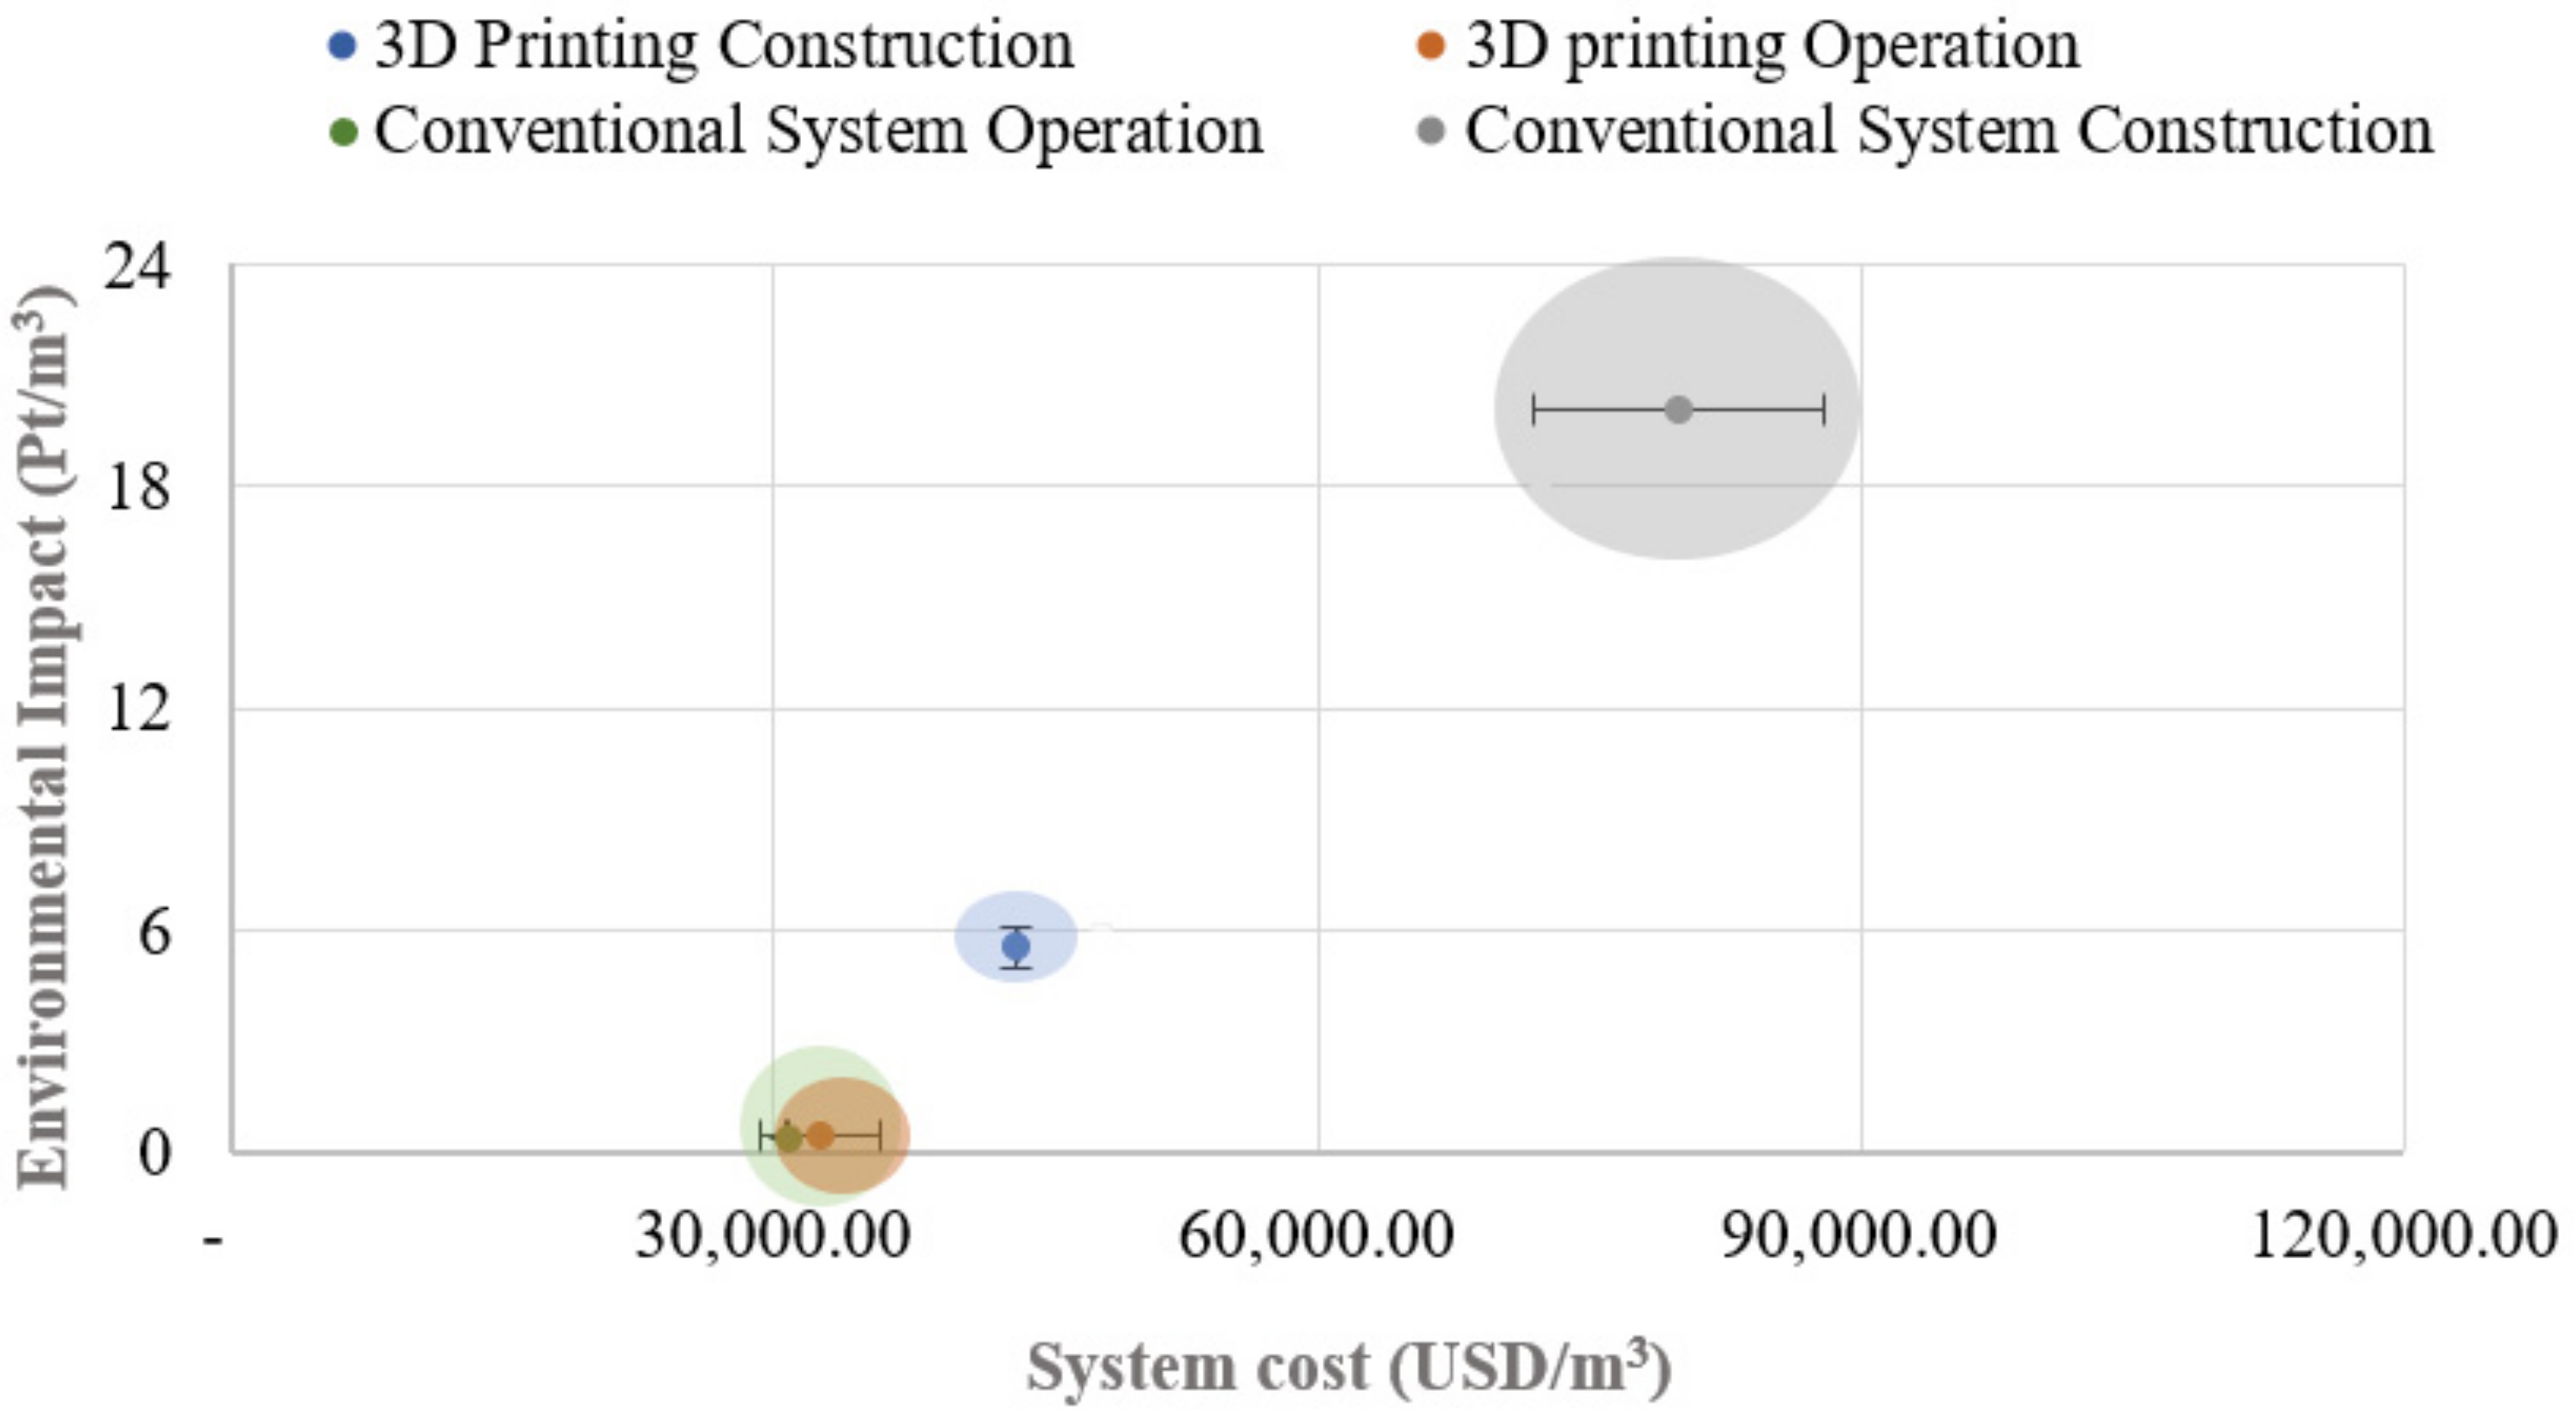
4. Eco-Efficiency Analysis

The depicted results of economic and environmental performance ratios were plotted in an eco-efficiency portfolio as illustrated in Figure 6. The top-right corner distinguishes the low eco-efficiency alternative, while the bottom left corner of the plot area identifies the high eco-efficiency option. The conventional construction house had significantly lower eco-efficiency compared to 3D-printing. Upon comparing the operation phases of both houses, the results reveal similar eco-efficiency scores, which coincides with the LCC and LCA analyses. Moreover, the eco-efficiency index diagram orders the alternatives from the highest (bottom) to lowest (top) eco-efficiency. The 3D printing method was found to be the highest and conventional construction acquired the lowest eco-efficiency. The findings of eco-efficiency analysis showed that operation phase alone was negligible in the selection process of the optimum alternative, nevertheless the combined construction and operation phase revealed 3D-printing as the most eco-efficient option.

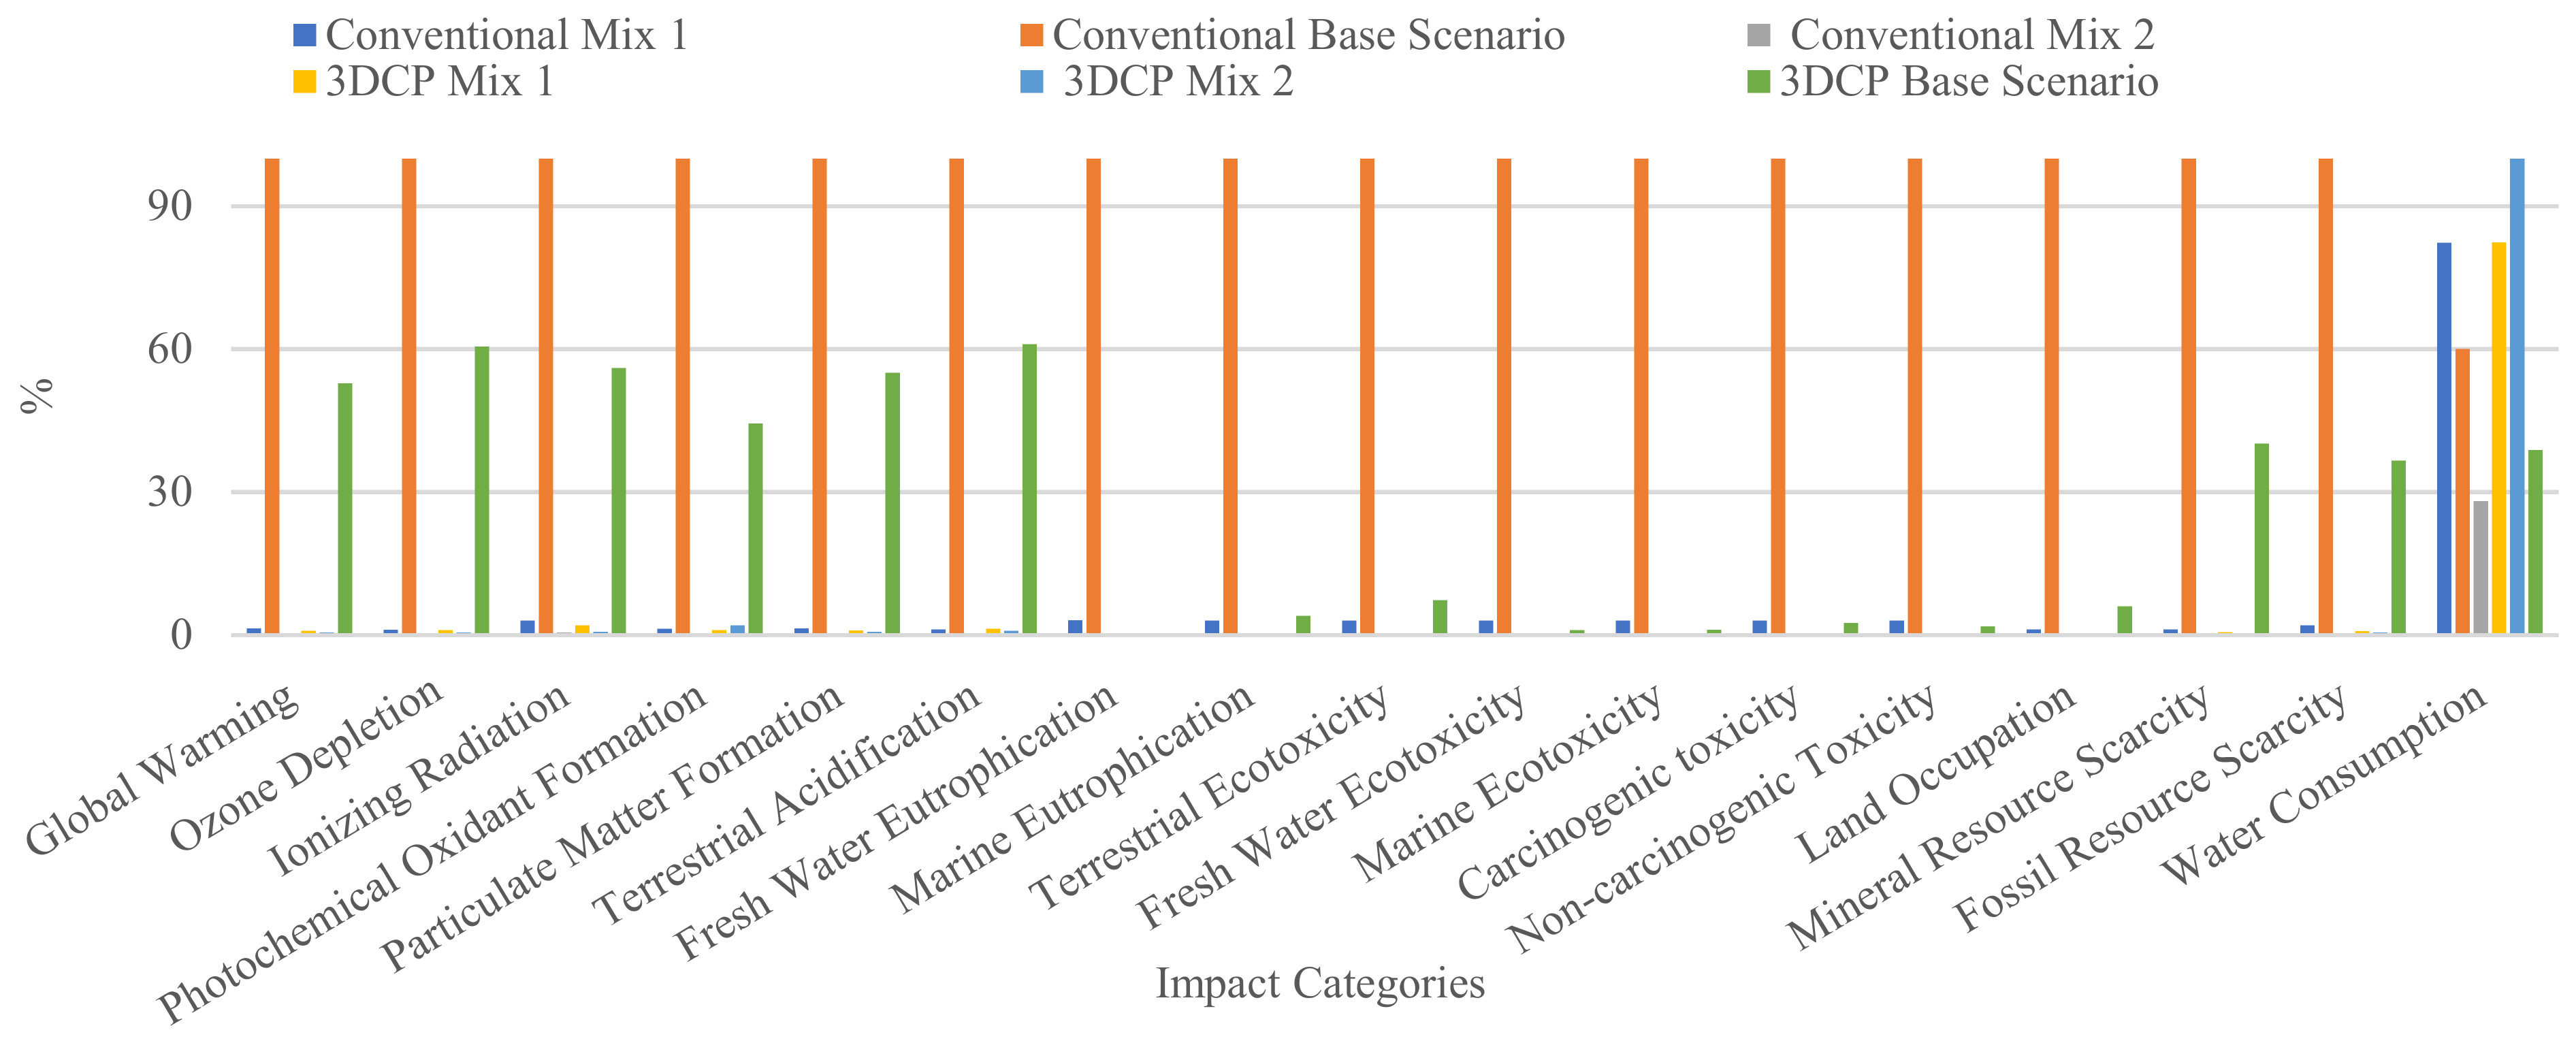
5. Sensitivity Analysis

Several factors such as system boundaries, assumptions, and accuracy of inventory data affect the certainty of LCA and LCC results. Moreover, the 3D printing technology is still in the exploration and development stage and the data were compiled from the literature. A sensitivity analysis was conducted to account for the uncertainties in this study where the selected parameters are listed in Table 9. Different 3D printing binder mixtures were evaluated in the analysis to investigate the environmental impact of cement and coarse aggregates as they acquired the highest scores in the LCA results. The conventional concrete mix was also evaluated to investigate the effect of varying concrete and steel quantities [2,42].
The concrete, steel, and cement production accounted for the highest environmental scores in the performed LCA. Figure 7 illustrates the results of the sensitivity analyses for the different 3DCP and Conventional mixtures. The results are presented relative to the conventional base scenario which obtained the highest impacts in all categories. The analysed mixtures had relatively small impacts contributing to 0–3% in all categories. Nevertheless, the 3DCP mix 1 and 2 contributed to the highest water consumption (474 and 391 m3, respectively), followed by conventional mix 1 (390 m3), conventional base scenario (233 m3), the 3DCP base scenario (184 m3), and the least water consumption was attained by conventional mix 2 (110 m3). These results led to the conclusion that reducing cement quantities in 3DCP binder can reduce the overall environmental impacts by 90%. In conventional construction techniques replacing some concrete elements with bricks (such as conventional mix 2) can also reduce the environmental deterioration.
The LCC results of the different mixtures reveal significant differences from the original scenarios (Table 10). The 3DCP mix 1 and 2 showed almost similar results with a decrease of 20% from the original mix. This decrease can be attributed to the reduction of cement in mix 1 and mix 2. Conventional concrete mixtures 1 and 2 obtained a total cost of USD 33,073 and 31,451, respectively which is almost 60% less than the base scenario. Moreover, the cost of the 3D printer was added to the 3D printed house scenario while keeping all the other parameters constant. The present value was found to be USD 225,391 (82% increase in expenditures). Since the technology is still in the exploration stage, a renting cost is yet to be accounted for in future 3D construction projects. Different electricity tariffs ranging between 0.07 to 0.1 were investigated. For low electricity tariffs, the costs of the 3D printing scenario decreased by 5% and increased up to 25% for higher ranges. Similarly, the costs of the conventional scenario decreased by 7% and increased up to 7% for higher ranges.
Data uncertainty and limited availability typically affects the life cycle assessment results. Figure 8 shows a +10% variation of the LCC and LCA parameters studied in the current research. The figure revealed a correlation of operation of both 3D printed and conventional scenarios. Nevertheless, the construction of conventional system had the greatest environmental impact and greatest cost with the variation.

6. Study Limitations

Based on the conducted structural, environmental, and economic assessments, 3D printing is a viable alternative to conventional construction techniques. However, the findings of this comparative study were limited due to the unavailability of some important data, such as, (1) characteristics of the mortar used in 3D printing process, (2) varying ratios of conventional concrete ingredients, (3) limited number of investigated structural elements, (4) exclusion of sub-structure system and end of life phase, and (5) the common processes and components among the examined alternatives were not included, thus only relative environmental impacts were quantified, (6) inadequacy in 3D printing speicifc processing and (7) data inventory was calculated from diverse sources as a result of lack of data.

7. Conclusions

The evaluation of digital fabrication technologies, particularly 3D printing, has been adopted to enhance environmental performance and economics. This study compared (1) additive manufacturing by means of extrusion method and (2) conventional construction using cast in-situ concrete. The comparative analysis was performed on a single-storey house in the UAE from environmental and economic perspectives. The analysis utilized LCA using midpoint impact methodology ReCiPe 2016 to measure the relative environmental burdens. The LCCA analytical framework was conducted to determine the financial feasibility of the examined scenarios. The results of the LCA and LCCA analyses were combined using a ratio method to determine the system with the higher eco-efficiency. LCA analysis revealed better environmental performance of the 3D printing method due to the absence of several components, such as formworks, steel reinforcement and the lower use of materials, compared to conventional construction alternatives. From an economic perspective, the LCCA indicated that 3D printing is 78% more profitable than its conventional counterpart. The eco-efficiency analysis revealed that 3D printing was the optimum choice. The sensitivity analysis revealed that decreasing cement ratios in 3D printing mortars can significantly decrease the environmental impacts. In this study the 3D printing construction technology showed a better overall eco-efficiency. However, it is acknowledged that the number found in this study may differ for different comparative analysis conditions.

Author Contributions

The contribution of each author can be described as follows: Conceptualization, K.P.F., M.A., A.K.T.; Methodology, H.A., M.A.; Software, H.A., M.A.; Visualization, H.A., M.A., A.K.T.; Validation, H.A., K.P.F., M.A., A.K.T.; Writing-Original Draft Preparation, H.A., K.P.F.; Writing—Review & Editing, H.A., K.P.F., M.A., A.K.T.; Supervision, K.P.F., M.A., A.K.T.; Project Administration, K.P.F., M.A. All authors have read and agreed to the published version of the manuscript.

Funding

The work in this paper was supported, in part, by the Open Access Program and FRG20-M-E44 grant from the American University of Sharjah. This paper represents the opinions of the authors and does not mean to represent the position or opinions of the American University of Sharjah.

Conflicts of Interest

The authors declare no conflict of interest.

Abbreviations

3DCP3-D Concrete Printing
ACIAmerican Concrete Institute
ASCEAmerican Society of Civil Engineers
ASHRAEAmerican Society of Heating, Refrigerating and Air-Conditioning Engineers
BIMBuilding information modelling
CADComputer aided design
GWPGlobal warming potential
EIEco-efficiency index
GHGGreenhouse gas
HVACHeating, ventilation, and air conditioning
ISOInternational organization for standardization
LCALife cycle assessment
LCCLife cycle costing analysis
LCILife cycle inventory
LCIALife cycle impact analysis
PVPresent value
STLSTsereo Lithography
UAEUnited Arab Emirates

References

  1. Dixit, M.K. 3-D Printing in Building Construction: A Literature Review of Opportunities and Challenges of Reducing Life Cycle Energy and Carbon of Buildings. IOP Conf. Ser. Earth Environ. Sci. 2019, 290, 012012. [Google Scholar] [CrossRef]
  2. Agustí-Juan, I.; Habert, G. Environmental Design Guidelines for Digital Fabrication. J. Clean. Prod. 2017, 142, 2780–2791. [Google Scholar] [CrossRef] [Green Version]
  3. Shehata, M.E.; El-Gohary, K.M. Towards Improving Construction Labor Productivity and Projects’ Performance. Alex. Eng. J. 2011, 50, 321–330. [Google Scholar] [CrossRef] [Green Version]
  4. Kuzmenko, K.; Gaudilliere, N.; Dirrenberger, J.; Baverel, O. Impact: Design With All Senses; Springer: Cham, Switzerland, 2020. [Google Scholar] [CrossRef]
  5. Gebler, M.; Schoot Uiterkamp, A.J.M.; Visser, C. A Global Sustainability Perspective on 3D Printing Technologies. Energy Policy 2014, 74, 158–167. [Google Scholar] [CrossRef]
  6. Saade, M.R.M.; Yahia, A.; Amor, B. How Has LCA Been Applied to 3D Printing? A Systematic Literature Review and Recommendations for Future Studies. J. Clean. Prod. 2020, 244, 118803. [Google Scholar] [CrossRef]
  7. Wu, P.; Wang, J.; Wang, X. A Critical Review of the Use of 3-D Printing in the Construction Industry. Autom. Constr. 2016, 68, 21–31. [Google Scholar] [CrossRef] [Green Version]
  8. Kietzmann, J.; Pitt, L.; Berthon, P. Disruptions, Decisions, and Destinations: Enter the Age of 3-D Printing and Additive Manufacturing. Bus. Horiz. 2015, 58, 209–215. [Google Scholar] [CrossRef]
  9. Feng, L.; Yuhong, L. Study on the Status Quo and Problems of 3D Printed Buildings in China. Glob. J. Hum.-Soc. Sci. 2014, 14, 1–4. [Google Scholar]
  10. Sinka, M.; Zorica, J.; Bajare, D.; Sahmenko, G.; Korjakins, A. Fast Setting Binders for Application in 3d Printing of Bio-Based Building Materials. Sustainability 2020, 12, 8838. [Google Scholar] [CrossRef]
  11. Mrazovic, N.; Mocibob, D.; Lepech, M.; Fischer, M. Assessment of Additiveand Conventional Manufacturing: Case Studies Fromthe AEC Industry. In Proceedings of the ISEC 2017-9th International Structural Engineering and Construction Conference, Valencia, Spain, 24–29 July 2017. [Google Scholar] [CrossRef]
  12. Agustí-Juan, I.; Müller, F.; Hack, N.; Wangler, T.; Habert, G. Potential Benefits of Digital Fabrication for Complex Structures: Environmental Assessment of a Robotically Fabricated Concrete Wall. J. Clean. Prod. 2017, 154, 330–340. [Google Scholar] [CrossRef] [Green Version]
  13. Van den Heede, P.; De Belie, N. Environmental impact and life cycle assessment (LCA) of traditional and ‘green’ concretes: Literature review and theoretical calculations. Cem. Concr. Compos. 2012, 34, 431–442. [Google Scholar] [CrossRef]
  14. Agustí-Juan, I.; Habert, G. An Environmental Perspective on Digital Fabrication in Architecture and Construction. In Proceedings of the 21st International Conference on Computer-Aided Architectural Design Research in Asia, Melbourne, Australia, 1 April 2016. [Google Scholar]
  15. Mohammad, M.; Masad, E.; Al-Ghamdi, S.G. 3D Concrete Printing Sustainability : A Comparative Life Cycle Assessment of Four Construction Method Scenarios. Buildings 2020, 10, 245. [Google Scholar] [CrossRef]
  16. Han, Y.; Yang, Z.; Ding, T.; Xiao, J. Environmental and Economic Assessment on 3D Printed Buildings with Recycled Concrete. J. Clean. Prod. 2021, 278, 123884. [Google Scholar] [CrossRef]
  17. Alhumayani, H.; Gomaa, M.; Soebarto, V.; Jabi, W. Environmental Assessment of Large-Scale 3D Printing in Construction: A Comparative Study between Cob and Concrete. J. Clean. Prod. 2020, 270, 122463. [Google Scholar] [CrossRef]
  18. Tobi, A.L.M.; Omar, S.A.; Yehia, Z.; Al-Ojaili, S.; Hashim, A.; Orhan, O. Cost Viability of 3D Printed House in UK. IOP Conf. Ser. Mater. Sci. Eng. 2018, 319, 012061. [Google Scholar] [CrossRef]
  19. ACI Committee 318-14. Building Code Requirements for Structural Concrete; American Concrete Institute: Detroit, MI, USA, 2014. [Google Scholar]
  20. ASCE. ASCE STANDARD Loads for Buildings, Series 7-1; American Society of Civil Engineers: Reston, VA, USA, 2016. [Google Scholar]
  21. CyBe Construction. (16 December 2020). Meet House. CyBe Construction. Available online: https://cybe.eu/cases/meet-house/ (accessed on 18 June 2020).
  22. ISO14044. Environmental Management—Life Cycle Assessment—Requirements and Guidelines. Int. J. Life Cycle Assess. 2006, 2006, 652–668. [Google Scholar] [CrossRef]
  23. ISO 14045. Environmental Management—Ecoefficiency Assessment of Product Systems—Principles, Requirements and Guidelines. 2012. Available online: https://asq.org/quality-press/display-item?item=T921E (accessed on 18 June 2020).
  24. Pré. Simapro Database Manual. 2020. Available online: https://simapro.com/wp-content/uploads/2020/10/DatabaseManualMethods.pdf (accessed on 18 June 2020).
  25. Nerella, V.N.; Mechtcherine, V. Studying the Printability of Fresh Concrete for Formwork-Free Concrete Onsite 3D Printing Technology (CONPrint3D). Chapter 16. 3D Concr. Print. Technol. 2019, 333–347. [Google Scholar] [CrossRef]
  26. Cuéllar-Franca, R.M.; Azapagic, A. Environmental Impacts of the UK Residential Sector: Life Cycle Assessment of Houses. Build. Environ. 2012, 54, 86–99. [Google Scholar] [CrossRef]
  27. Guardigli, L.; Monari, F.; Bragadin, M.A. Assessing Environmental Impact of Green Buildings through LCA Methods:Acomparison between Reinforced Concrete and Wood Structures in the European Context. Procedia Eng. 2011, 21, 1199–1206. [Google Scholar] [CrossRef] [Green Version]
  28. Official Journal of the European Union. Directive 2008/98/EC of the european parliament and of the council of 19 November 2008 on Waste and Repealing Certain Directives. Off. J. Eur. Union 2018, 9, 1–59. [Google Scholar]
  29. Aktacir, M.A.; Büyükalaca, O.; Yilmaz, T. A Case Study for Influence of Building Thermal Insulation on Cooling Load and Air-Conditioning System in the Hot and Humid Regions. Appl. Energy 2010, 87, 599–607. [Google Scholar] [CrossRef]
  30. Kaszynka, M.; Olczyk, N.; Techman, M.; Skibicki, S.; Zielinski, A.; Filipowicz, K.; Wroblewski, T.; Hoffmann, M. Thermal-Humidity Parameters of 3D Printed Wall. IOP Conf. Ser. Mater. Sci. Eng. 2019, 471, 082018. [Google Scholar] [CrossRef]
  31. ASTM C168-19. Standard Terminology Relating to Thermal Insulation; ASTM International: West Conshohocken, PA, USA, 2019. [Google Scholar] [CrossRef]
  32. Yarbrough, D.W. Thermal Insulation for Energy Conservation. In Handbook of Climate Change Mitigation; Springer: New York, NY, USA, 2012; Volume 4, pp. 649–668. [Google Scholar] [CrossRef]
  33. Ha, J.; Cho, S.; Kim, H.; Song, Y. Energies Annual Energy Consumption Cut-O Ff with Cooling System Design Parameter Changes in Large. Energies 2020, 13, 1–16. [Google Scholar] [CrossRef] [Green Version]
  34. ASHRAE. Standard Method of Test for the Evaluation of Building Energy Analysis Computer Programs; American Society of Heating, Refrigerating and Air-Conditioning Engineers, Inc.: Atlanta, GA, USA, 2010; Volume 4723, pp. 1–77. [Google Scholar]
  35. Huijbregts, M.A.J.; Steinmann, Z.J.N.; Elshout, P.M.F.; Stam, G.; Verones, F.; Vieira, M.D.M.; Hollander, A.; Zijp, M.; van Zelm, R. ReCiPe 2016 v1.1. A Harmonized Life Cycle Impact Assessment Method at Midtpoint and Endpoint Level; National Institute for Public Health and the Environment: Bilthoven, The Netherlands, 2017.
  36. Schultz, T.; Suresh, A. SCS Global Services Report Life Cycle Impact Assessment Methodology for Environmental Paper Network Paper Calculator v4.0. In SCS Global Services Report; Scientific Certification Systems, Inc.: Emeryville, CA, USA, 2018. [Google Scholar]
  37. Government of Dubai. Dubai Economic Report 2018. Dubai Econ. 2018, 181–184. [Google Scholar]
  38. Abdallah, M.; Shanableh, A.; Shabib, A.; Adghim, M. Financial Feasibility of Waste to Energy Strategies in the United Arab Emirates. Waste Manag. 2018, 82, 207–219. [Google Scholar] [CrossRef] [PubMed]
  39. Saling, P.; Kicherer, A.; Dittrich-Krämer, B.; Wittlinger, R.; Zombik, W.; Schmidt, I.; Schrott, W.; Schmidt, S. Eco-Efficiency Analysis by BASF: The Method. Int. J. Life Cycle Assess. 2002, 7, 203–218. [Google Scholar] [CrossRef]
  40. Huguet Ferran, P.; Heijungs, R.; Vogtländer, J.G. Critical Analysis of Methods for Integrating Economic and Environmental Indicators. Ecol. Econ. 2018, 146, 549–559. [Google Scholar] [CrossRef]
  41. Koskela, M.; Vehmas, J. Defining Eco-Efficiency: A Case Study on the Finnish Forest Industry. Bus. Strategy Environ. 2012, 21, 546–566. [Google Scholar] [CrossRef]
  42. Huang, L.; Liu, Y.; Krigsvoll, G.; Johansen, F. Life Cycle Assessment and Life Cycle Cost of University Dormitories in the Southeast China: Case Study of the University Town of Fuzhou. J. Clean. Prod. 2018, 173, 151–159. [Google Scholar] [CrossRef]
Figure 1. The technical drawings for (a) ground floor, (b) Site plan, (c) section A, and (d) section B.
Sustainability 13 11978 g001
Figure 2. System boundaries of 3D printing and conventional construction of the examined house.
Sustainability 13 11978 g002
Figure 3. Relative environmental impacts of 3D printed and conventional constructed houses.
Sustainability 13 11978 g003
Figure 4. Contribution of 3D printing processes to the overall environmental impact.
Sustainability 13 11978 g004
Figure 5. Relative contribution of conventionally constructed house processes to the environmental impact.
Sustainability 13 11978 g005
Figure 6. Eco-efficiency portfolio of 3D-printed and concrete-based house construction and operation phases.
Sustainability 13 11978 g006
Figure 7. Sensitivity analysis results of different conventional and 3D concrete printing (3DCP) mixtures.
Sustainability 13 11978 g007
Figure 8. Uncertainty analysis of with +10% variation of 3D printing and conventional construction scenarios.
Sustainability 13 11978 g008
Table 1. Summary of life cycle assessment-based studies in the construction sector.
ReferencesBoundary3D-Printed UnitStagesImpact Assessment MethodSoftwareDatabaseFunctional UnitEvaluated Impacts
[6]-Hypothetical house modelMaterial acquisition; construction PhaseBuilding Life-cycle
Sustainability Impact Assessment Standard
-Local data; Literature review1 m2 wall; 1 m2 roofGlobal warming potential; Acidification; Photochemical Pollution; Eutrophication
[10]Cradle to gateCube SamplesProductionIPCC 2013 GWP100aSimaPro 8Ecoinvent 3; Previous studies1 m3 binderGlobal warming potential
[15]Cradle to gateWall structureProduction; ConstructionTRACIGaBi 9.2.1.68GaBi 20201 m2 external load-bearing wallGlobal warming potential; Acidification potential; Eutrophication potential; Smog formation potential; Fossil fuel
depletion
[17]Cradle to SiteOne-storey
house
Raw materials; Transportation; ConstructionReCiPe
Midpoint (H) v1.03
SimaPro 9.0.0.35Ecoinvent v3.1; Literature; Local data1 m2 load-bearing wallglobal warming; Stratospheric
ozone depletion; Fine particulate matter formation; Marine eutrophication; Land use; Mineral resource scarcity; Water use
[11]-Metallic building componentsRaw material processing; Manufacturing; Transportation-SimaProLocal data1 steel bracketEnergy consumption; Human health; Water source depletion; Abiotic depletion of fossil fuels
[12]Cradle to gateWall StructureRaw material extraction; Transport; Materials production; Robotic fabricationRecipe Midpoint (H) v1.12SimaPro 8Ecoinvent v3.11 m2 of wallClimate change; Ozone depletion; Human toxicity; Terrestrial acidification;
Freshwater eutrophication; Terrestrial ecotoxicity; Freshwater ecotoxicity; Water depletion; Metal depletion; Fossil depletion
[2]Cradle to grave; Cradle to gateWall and roof structuresMaterials production; Operation energyRecipe Midpoint (H) V1.06SimaPro 8Ecoinvent v2.21 m2 of wall and roof structuresClimate change; Ozone depletion; Human toxicity; Water depletion; Metal depletion; Fossil depletion
Table 2. Dimensions and reinforcement of structural elements.
ElementComponentValue
External WallSpecifications Length (m) × Height (m)37.8 × 2.95
Required concrete (m3)6.19
Total concrete bricks15,478
ColumnSpecificationsLength (cm) × Width (cm) × Height (cm)40 × 20 × 295
Total number13
ReinforcementRebar size10
Spacing (cm)25
Total cross-sectional area (cm2)20.5
BeamSpecifications Length (cm) × Width (cm)40 × 40
ReinforcementRebar size22
Number of rebars6
Total cross-sectional area (cm2)23.22
SlabSpecifications Slab depth (cm)0.25
Reinforcement *Rebar size10
Spacing (cm)20
Total number of main reinforcements78
Total number of secondary reinforcements95
* The design details include main and secondary reinforcing rebars.
Table 3. Properties of 3D printing and conventional construction materials *.
System Components *Specifications
Conventional Concrete **Ultimate Compressive Strength (MPa)35
Water/cement Ratio0.5
Maximum Aggregate Size (mm)20
Slump (mm)20–80
Mixing Water (kg/m3)200
Density Concrete (kg/m3)Vt2355
3D Printing Mortar *Grain Size (mm)3
Initial Set (min)3
Final Set (min)5
Layer Thickness (mm)40
Ultimate Compressive Strength (MPa)40
Tensile Strength (N/mm2)4
Flexural Strength (N/mm2)6
Specific Heat Capacity (J/g·K)1.1
Air Void Content (%)5.3
* Compiled from [21] and ** [22].
Table 4. Operating parameters of the 3D printer used.
ParameterValue
Print Speed (mm/s)50–600
Travel speed (km/h)3
Precision (mm)1:1:1
Layer resolution (mm)10–50
Table 5. Life cycle inventory data of the examined systems per functional unit.
Data3D Printing *Conventional Construction **
Steel (kg) ***-200
Fly Ash (kg)170-
Micro silica (kg)180-
Superplasticizer (kg)10-
Viscosity modifying admixture98,103-
Cement (kg)430300
Coarse Aggregate (kg)-4680
Fine Aggregate (kg)6454680
Water (kg)180190
Concrete (kg)-340
Wood (m2)-5
Energy Consumption (kWh)2168 ***
Material Transportation Distance (km)100100
Printer Transportation Distance6500-
* [25] ** [2,26] *** [27]..
Table 6. Environmental inventory results of the examined structural systems.
Impact Category3D PrintingConventional Construction
Midpoint IndicatorCarcinogenic Toxicity (kg 1,4-DCB)4.30168.60
Fossil Resource Scarcity (kg oil eq)2.90150.00
Fresh Water Ecotoxicity (kg 1,4-DCB)0.2323.90
Fresh Water Eutrophication (kg P eq)0.0020.20
Global Warming (kg CO2 eq)608.551154.20
Ionizing Radiation (kBq Co-60 eq)2.5816.50
Land Occupation (m2a crop eq)0.406.80
Marine Ecotoxicity (kg 1,4-DCB)0.3433.60
Mineral Resource Scarcity (kg Cu eq)0.0830.80
Non-carcinogenic Toxicity (kg 1,4-DCB) 11.9675.10
Ozone Depletion (kg CFC11 eq)1.90 × 10−43.20 × 10−4
Particulate Matter Formation (kg PM2.5 eq)0.021.70
Photochemical Oxidant Formation (kg NOx eq)0.062.84
Terrestrial Acidification (kg SO2 eq)2.504.10
Water Consumption (m3)183.95233.35
Endpoint IndicatorHuman Health (Pt)5.3018.63
Ecosystems (Pt)0.641.30
Resources (Pt)0.050.20
Table 7. Insulation parameters and cooling demand results.
Parameter3D PrintingConventional System
WallFloorRoofWallFloorRoof
K (W/m·K)0.920.55
R (m2·K/W)0.080.330.160.090.460.45
Thickness (m)0.080.30.150.050.250.25
U (W/m2·K)3.75 *0.270.103.6 *0.440.44
Q (W)W1W2W3W4201519W1W2W3W4858858
21893424312327832157337430773742
Σ Q ** (BTU/h)49,26952,098
* The wall U-value includes air cavity with thickness 0.04 m and R of 0.12. ** The total heat gain includes heat from doors and windows.
Table 8. Capital costs of construction components and operational expenses.
ComponentRate (USD/ton)3D PrintingConventional
Cement 154544
Additive2208-
Aggregate1510,79510,795
Steel500-1308
Concrete60/m3-25,147
Formwork27/m2-11,933
Present Value (USD)-−40,955−81,064
Note: Positive present values signify revenues, whereas negative values represent costs.
Table 9. Parameters utilized in the sensitivity analysis for 3DCP and Conventional scenarios.
ParameterReference ValueSensitivity Analysis Options
3D PrintingConventional3D Printing *Conventional
Mix 1Mix 2Mix 1 **Mix 2 ***
Life Cycle AnalysisSteel (kg) ***-200--56061
Fly Ash (kg)170-165165--
Micro silica (kg)180-8383--
Superplasticizer (kg)10-8.38.3--
Viscosity modifying admixture98,103-98,10398,103--
Cement (kg)4303005803005310
Coarse Aggregate (kg)-468012416411351280
Fine Aggregate (kg)6454680---2
Water (kg)180190232190231822
Concrete (kg)-340--7140
Brick (kg) 197-
Wood (m2)-5--7725
Energy Consumption (kWh) ****21682.262.261118
Life Cycle Costing3D Printer (USD)183,000----
Electricity Tariff (USD/kWh)0.0810.07–0.101
* Adapted from [15] ** [2], and *** [42], **** The energy consumed by machinery.
Table 10. Life Cycle Costing of the different sensitivity analysis alternatives.
Sensitivity Analysis OptionsPresent Value (USD)
3DCP Mix 1−32,664
3DCP Mix 2−32,588
Conventional Mix 1−33,073
Conventional Mix 2−31,451
3D Printer−225,391
Electricity Tariff3DCP−38,972 to −51,427
Conventional−75,741 to −87,483
Publisher’s Note: MDPI stays neutral with regard to jurisdictional claims in published maps and institutional affiliations.

