Article

A Practice in Valuation of Ecosystem Services for Local Policymakers: Inclusion of Local-Specific and Demand-Side Factors

1
Policy Research Institute, Ministry of Agriculture, Forestry and Fisheries, Tokyo 100-0013, Japan
2
Graduate School of Human Development and Environment, Kobe University, Kobe 657-8501, Japan
*
Author to whom correspondence should be addressed.
Sustainability 2021, 13(21), 11894; https://doi.org/10.3390/su132111894
Submission received: 17 September 2021 / Revised: 21 October 2021 / Accepted: 24 October 2021 / Published: 27 October 2021
(This article belongs to the Section Sustainable Water Management)

Abstract

:
Although researchers expect the valuation of ecosystems and their services to be used in various decision-making processes, some studies have insisted that the valuation results cannot be fully used in the real world. The so-called “information gap” was highlighted, and some reasons for the gap were raised by researchers. One of them is the lack of local-specific and demand-side information, such as who receives the benefits and to what extent. This study proposes a valuation that includes demand-side information for it to be practically useful for policy decision making, especially for local policymakers. We focus on the headwater conservation service of the forest ecosystem by referring to the case of constructing solar power plants in the Satetsu-gawa river basin in Ichinoseki, Japan. We estimate the size of the area and the number of households affected by deforestation caused by the construction of the plants. Furthermore, the lost value of ecosystem services is assessed in monetary terms to reflect information on the demand side. Based on the results, we present multiple indicators for assessing the impact of constructing the plants and discuss how the valuation can be used by local policymakers as well as how it can close the information gap.

1. Introduction

To achieve the 2030 SDGs agenda and the conservation of ecosystems, it is important to visualize the economic value of ecosystem services (ES) [1,2]. Thus, some initiatives such as the Millennium Ecosystem Assessment (MA), the Intergovernmental Panel on Biodiversity and Ecosystem Services (IPBES), The Economics of Ecosystem and Biodiversity (TEEB), the Ecosystem Services Partnership (ESP), and the Wealth Accounting and the Valuation of Ecosystem Services (WAVES) have been launched to assess the value of ES and develop appropriate measures. In the academic field, there are ongoing studies worldwide to evaluate ES [3,4], and it is expected that the results would be used to influence business and policy decision making [5]. However, some studies have pointed out that the valuation results are not fully utilized in decision making [5,6,7], which raises the so-called “information gap” issue [8,9]. An information gap refers to the absence of the basis for concrete operational decision making [10]. Previous studies have raised many reasons for this gap, such as researchers are not interested in the use of the valuation [11,12,13], a degree of accuracy does not meet users’ demand [14], the explanation of constraints in the valuation is not sufficient [15], the contribution of valuation studies for policy decision making is limited [16], and local information is not reflected in the valuation [17,18,19]. Pandeya et al. [17] examined local versus regional approaches and insisted that “most existing frameworks are focused at regional scales and there is a limited focus at local scale valuation.” Olander et al. [19] raised a concern about local-specific factors, which have not been fully captured in valuations yet. This means that national/regional statistics are mainly used for some of the valuations, and local on-site information, such as geographical conditions and information/data on residents, is not fully considered in these valuations. This makes it difficult for local stakeholders to use the results. Villa et al. [14] pointed out that most ES valuations assess potential value instead of actual value that beneficiaries currently receive from the ecosystem, and they include the location of beneficiaries in the valuation.
In addition, the demand-side analysis of ES is still ongoing. For instance, Watson et al. [20] insisted that when ES supply is used as a proxy for benefit, it causes conservation projects to concentrate on places where demand is low or absent, thus capturing benefits inefficiently. Wolff et al. [21] also highlighted that most ES assessments focused on the supply side. As residents in a community are one of the main stakeholders of local ES conservation policies, understanding both the demand- and supply-side factors of ES is essential for local policy decision-making.
In this study, we focus on beneficiaries as a local-specific and demand-side factor. Some studies have already considered beneficiaries of ES in valuations [22,23,24,25]. However, ES valuations and tools that identify the beneficiaries of a given ES in a spatially explicit way are few [6]. The above studies, except that of Schirpke et al. [22], do not use actual estimates but use the number of beneficiaries of specific ES. Even Schirpke et al. [22] simply estimated the number of beneficiaries and did not link it with economic valuation. Valuation is regarded as a prerequisite for better decision making [5,26], and some valuation results are already incorporated into various decision-making processes [27,28]. To enhance the usefulness of ES valuation, a valuation that considers the number of beneficiaries of ES is crucial, especially for ecosystem conservation policy and management practices in a specific area. Additionally, when local-specific information is used, because the number of beneficiaries is included in the valuation, the gap between valuation studies and decision making about ecosystem conservation practices can be closed.
The purpose of this study is to obtain a valuation that includes local-specific and demand-side factors so that it can be practically useful for policy decision makers, especially local policymakers. In this study, we define practical valuation as a valuation that can close the information gap, and we consider information on ES demand (i.e., beneficiaries) in the valuation. More specifically, we focus on the headwater conservation service (HCS) of the forest ecosystem as a valuation object and use the Satetsu-gawa river basin in Ichinoseki, Japan as a case study. Through geographical analysis, we estimate the number of households that benefit from the upstream forest ecosystem and the deforested area due to the construction of six solar power plants (SPPs) in the Satetu-gawa river basin. The value of the lost ES in monetary terms is estimated to capture information on beneficiaries. Finally, from the valuation results, we present multiple indicators for assessing the impact of constructing the plants and discuss how the valuation can be used by local policymakers and how it can close the information gap.
It should be noted that IPBES proposed the concept of Nature’s contributions to people (NCP), which is closely related to ES [29,30]. However, in this study, we apply the ES concept as our research project began in 2016 and, at that time, the ES and NCP concepts were still considered controversial [31,32]. As the NCP concept was unpopular in Japan, we conducted our research based only on the ES concept. Another reason for applying the ES concept is that in our analysis, we do not consider the factors that are specific to NCP such as indigenous local knowledge.

2. Materials and Methods

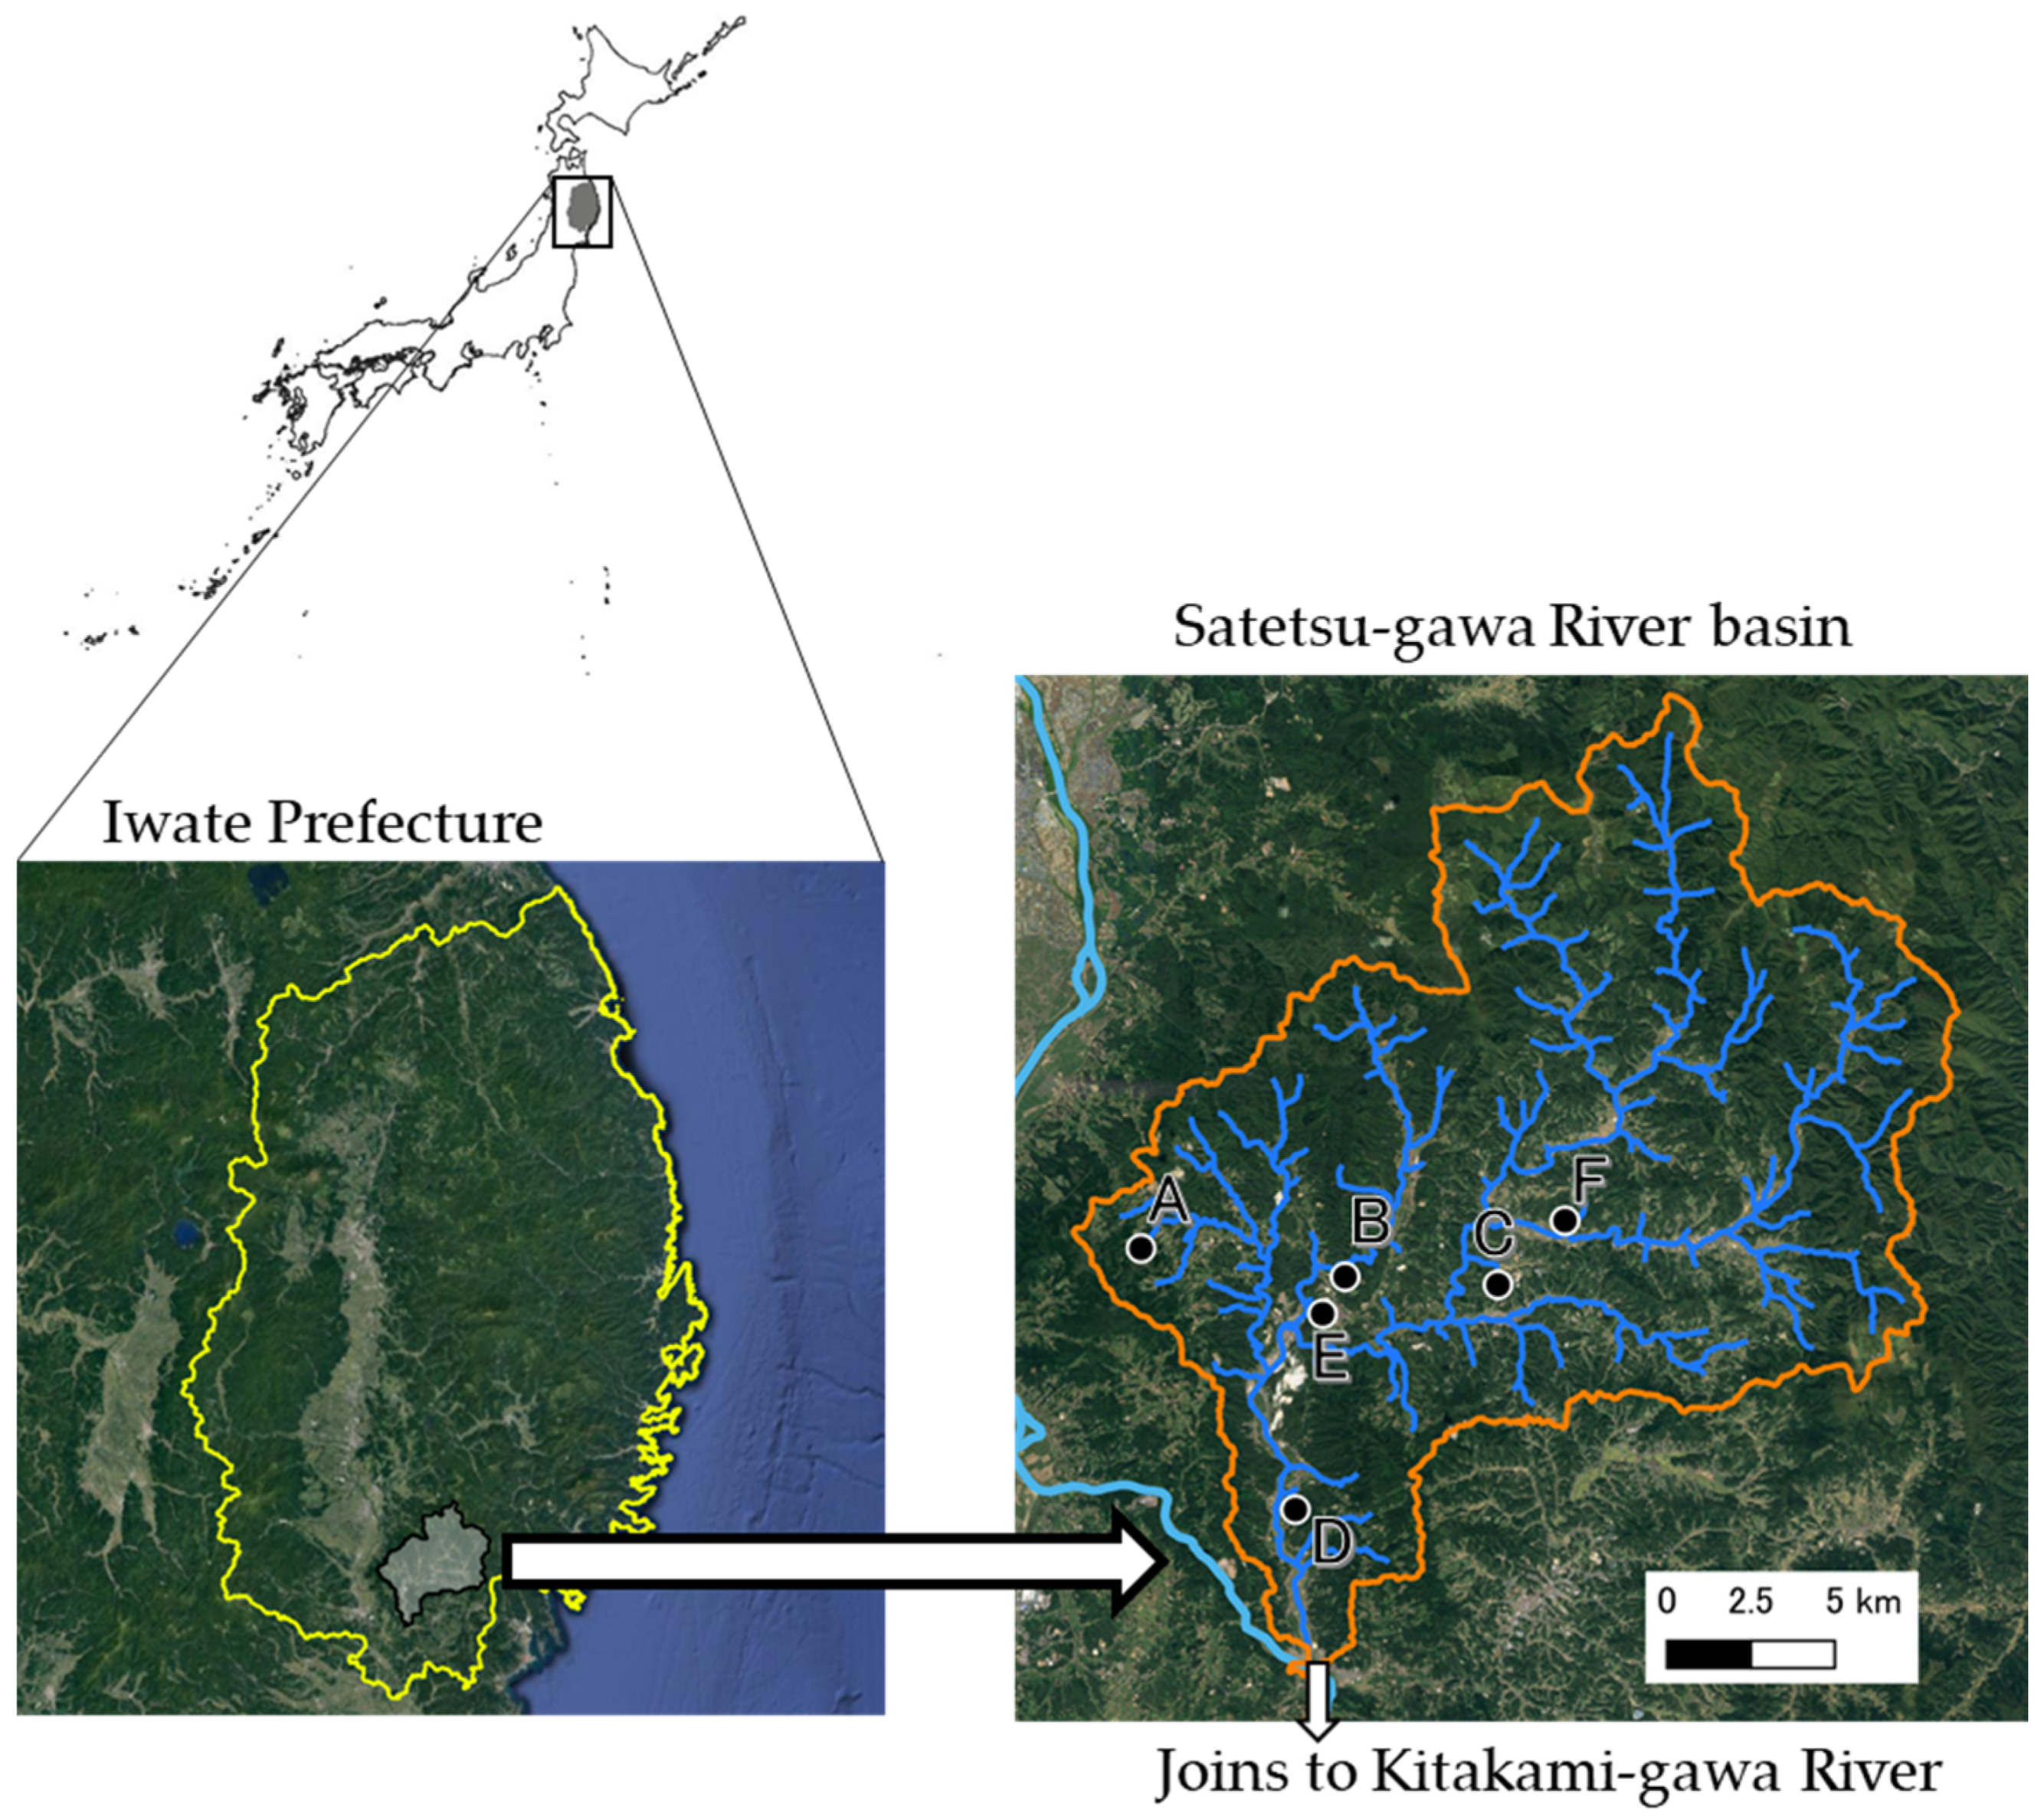
2.1. Overview of Study Site

Ichinoseki, which is our study site, is a middle-class city in Iwate prefecture and is located 450 km from north Tokyo. As of 2015, it had a population of about 121,000 and 43,000 households, and its area is 1256 km2. In 2020, the average temperature in Ichinoseki was 12.4 degrees Celsius with a maximum of 37.8 and a minimum of −7.6 degrees Celsius. The annual average precipitation is 1306 mm and snowfall is 17 cm. Kitakami-gawa river, which is one of the main rivers in Northern Japan, flows into the city, and our study site, Satetsu-gawa river, is a tributary of Kitakami-gawa river (Figure 1). Satetsu-gawa river is located in the southern part of Iwate prefecture, and the length of the river is about 44.6 km and joins Kitakami-gawa River, which is indicated by a light blue line in Figure 1, at the southern part of the basin. In Figure 1, the area surrounded by the orange line is the river basin, and the dark blue lines are river channels. In July 2002, a typhoon raged and greatly damaged the Satetsu-gawa river basin with 743 above-floor and 222 under-floor inundations and 529 hectares of inundation area. Since then, flooding is one of the major concerns in this area.
In 2012, the Feed-in Tariff scheme of renewable electric power was introduced in Japan, and since then, the number of SPPs has rapidly increased nationwide. The construction of some of the plants led to deforestation, which the Satetsu-gawa river basin is part of. In the basin, additional flood prevention measures are required; six SPPs have been installed so far, and the construction of all of them caused deforestation. There is a trade-off between the introduction of renewable energy and flood prevention; thus, policymakers should decide between climate change and ES conservation. Therefore, we chose the Satetsu-gawa river basin as a study site. In addition, from an analytical perspective, the reasons for selecting Satetsu-gawa river are (1) there are multiple SPPs and they are located remotely in the river basin, (2) the whole river basin is in Ichinoseki, which makes it easy to link statistical and geographical data, and (3) we already have forest registration data on Iwate prefecture and have conducted analysis on the forest in the prefecture, including Ichinoseki.

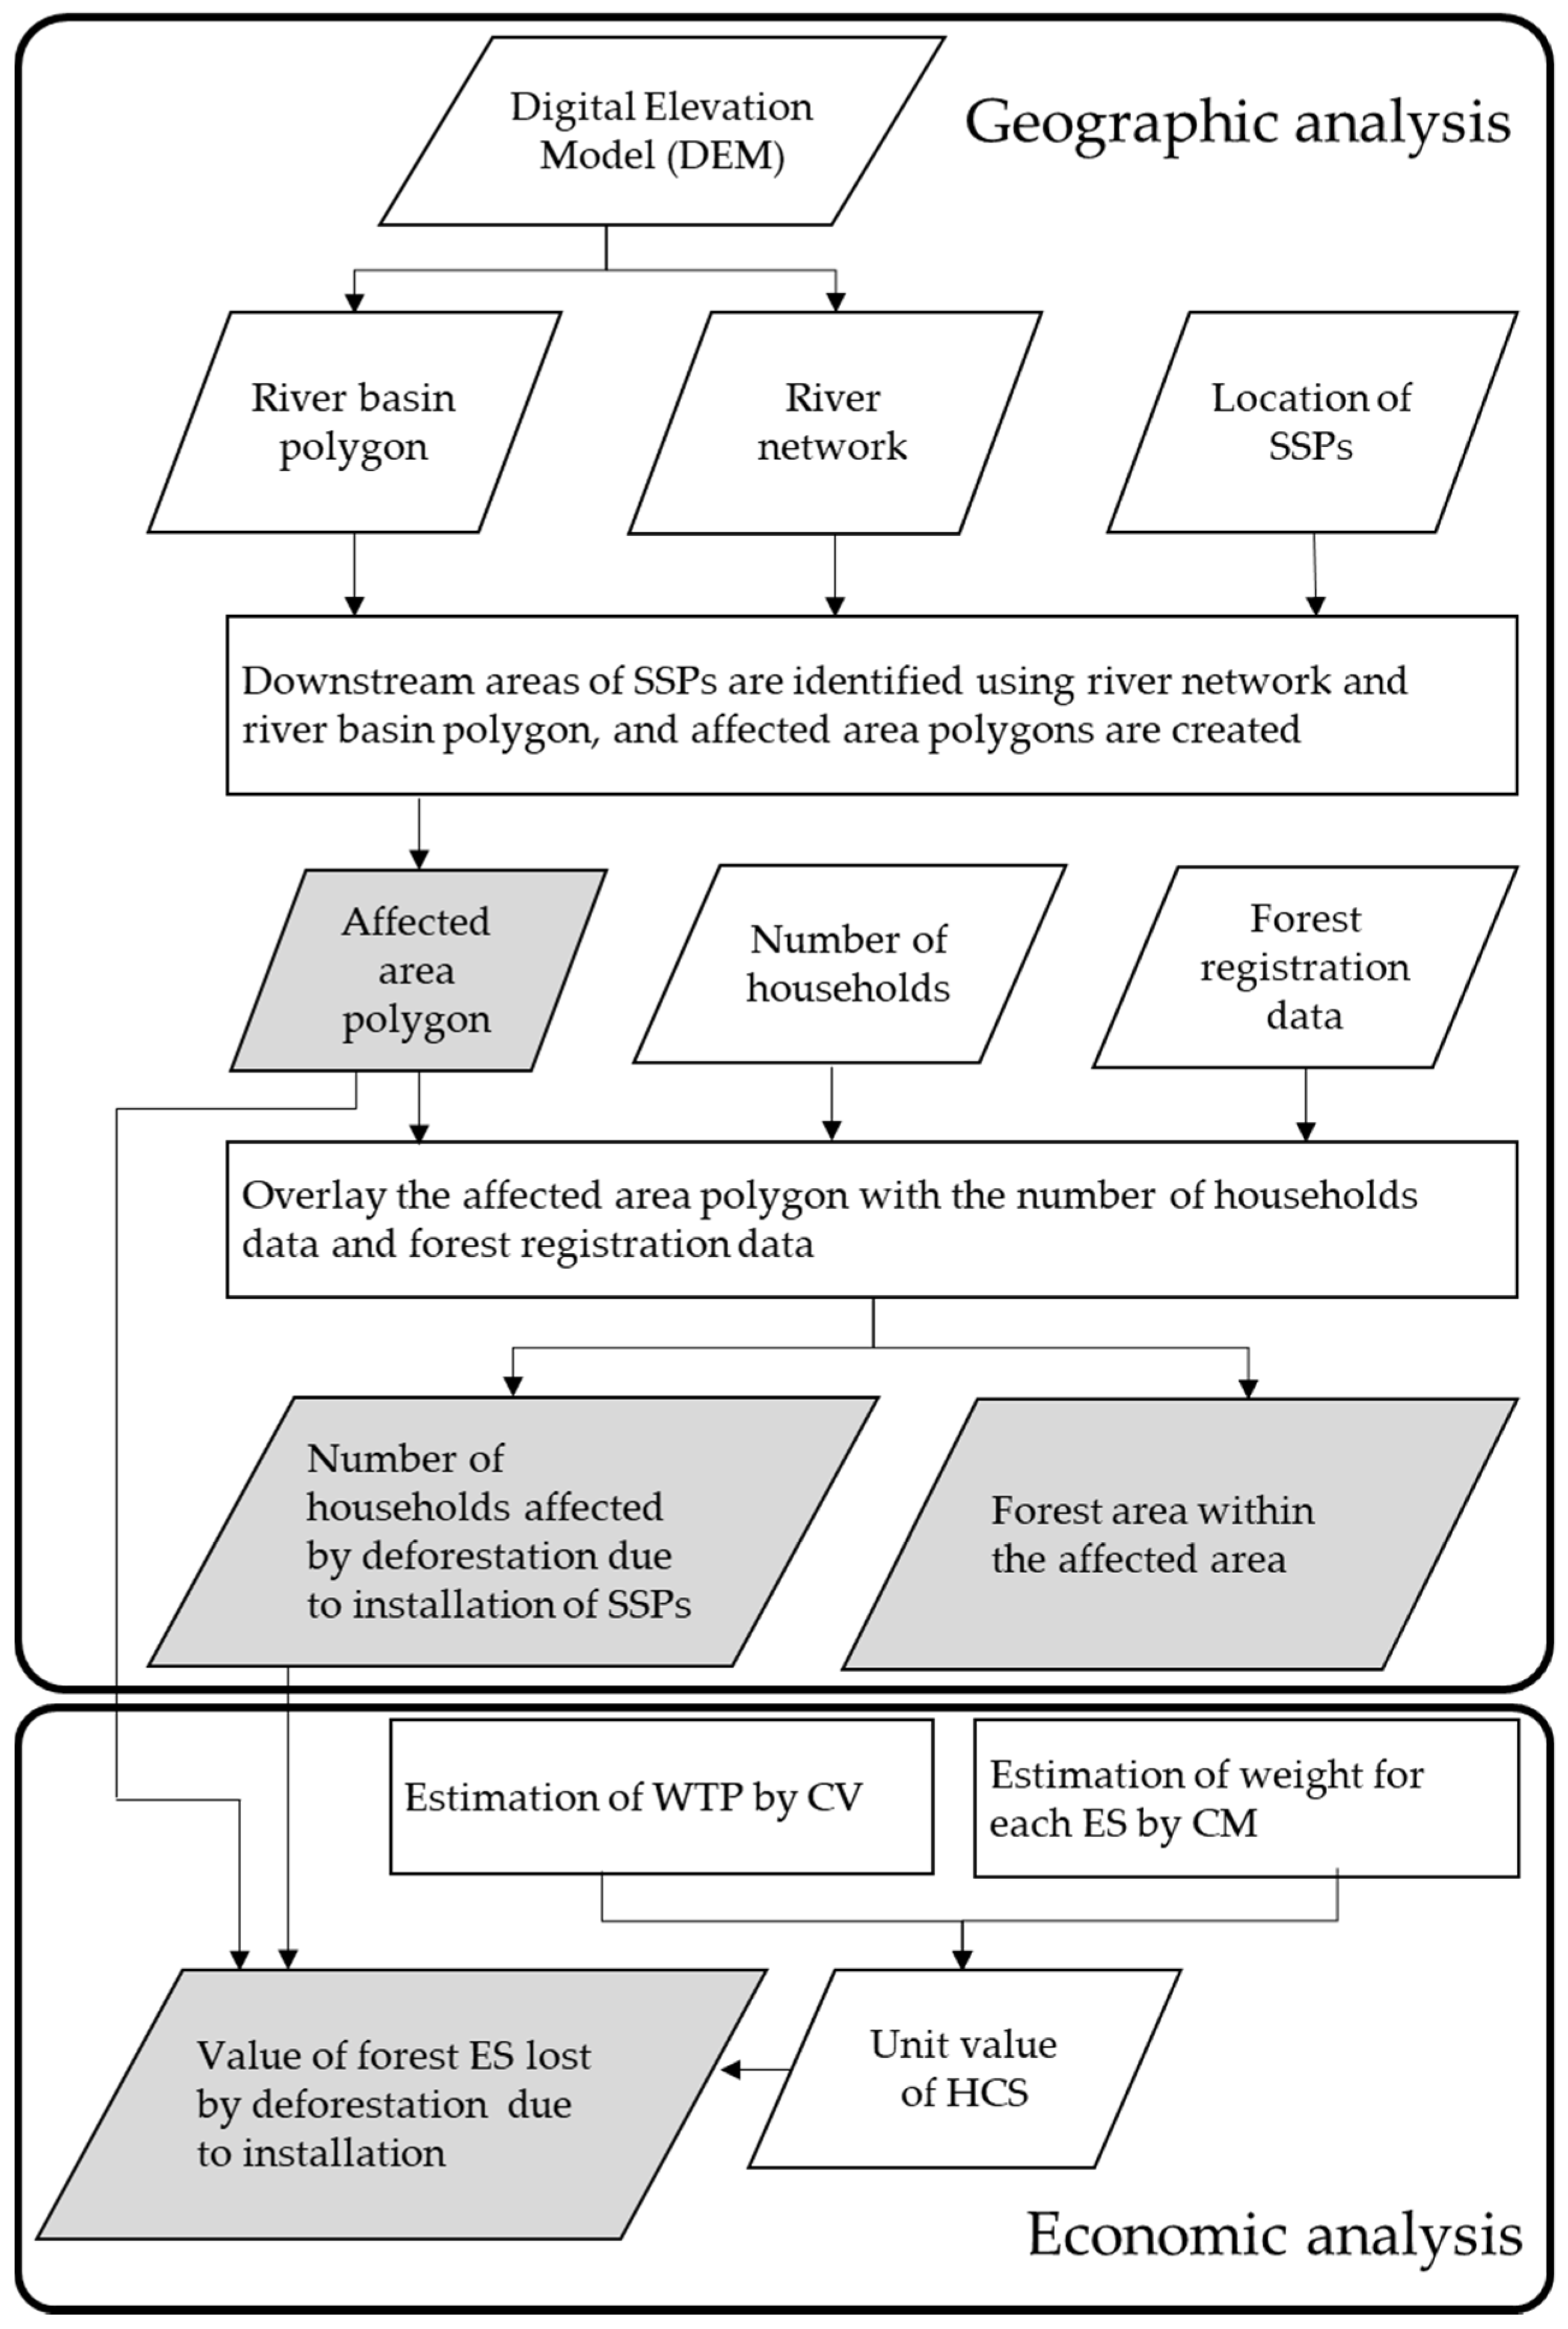
2.2. Geographical Analysis

HCS of the forest ecosystem is defined as a process in which soil in the forest stores precipitation, thereby stabilizing the amount of water flowing into rivers [33]. Obviously, water flows from upper to lower, and the effect of a change in water flow appears in the downstream area. This means that the HCS of the forest ecosystem is felt downstream. Therefore, we assume that forests provide HCS only to the area that is of a lower elevation than the forests in the river basin and to the residents who live in the area. Residents in the area can be seen as the beneficiaries of forest HCS. To assess the impact of change in service caused by the construction of SPPs, we identify the lower and downstream areas of the forests that are deforested (hereafter, we call it affected area). Then, we estimate the area and calculate the number of households in the area by each sub-river basin, which is a sub-compartment of the whole river basin.
To identify the affected area, it is also important to determine whether the SPPs constructed caused deforestation. In this study, we define deforestation as the complete removal of tree cover canopy in a specific area, as detected in aerial photographs based on a study conducted by Hansen et al. [34]. However, determining whether the deforestation was made to install a SPP is quite difficult in the following two situations: (1) whether deforestation is made to construct a plant and (2) when the forest was deforested. There are no objective and rational criteria for determining whether deforestation is conducted to construct an SPP. Of course, if the forest was cleared just before the construction of the plant, it can be regarded as deforestation for the construction, but even in this case, the next issue is how far we should go back to the past to assess deforestation. For instance, although our analysis applies 2012 forest registration data, forests that had been cleared by 2012 may have been cleared to install an SPP. It is quite difficult to set clear criteria for distinguishing deforestation to construct an SPP. Therefore, in this study, we assume that if a construction site has forest registration data, the site is deforested. Forest registration data are created only for lands that were previously managed as forests. Thus, it is rational to regard the existence of the forest registration data on the site as a modification of land in the forest. As a result, all the six SPPs in the Satetsu-gawa river basin meet the conditions, so in this study, these six SPPs, which are indicated A to F in Figure 1, are considered.
As shown in Table 1, in this study, we use elevation data in Digital Elevation Model (DEM), forest registration data, mesh data on land use, and zoned area for land use. We also use mesh data on the number of households, which are originally from the Japanese Population Census, to estimate the number of beneficiaries. The flow of the geographic and economic analysis is illustrated in Figure 2. First, the area of the whole Satetsu-gawa river basin is estimated, and the river network of the basin is identified. Specifically, DEM is used to calculate the inclination degree and the direction of surface water flow and to estimate the elevation level. The river network is line data, which include information on the direction of surface water flow. Second, we identify catchment areas of the river network and create river basin polygons (RBPs). The RBP is a polygon that indicates the area that surface water flows into the river network. The RBP is subdivided into small river basins, and these sub-polygons are the basic units of our analysis. We calculate the elevation level and area of each sub-polygon. Third, the sub-polygons are combined with river network data and plant location, and a point on the river, which is closest to an SPP and a sub-polygon that includes the point (hereafter, plant sub-polygon (PSP)), is identified through visual inspection. Fourth, we regard the affected area as sub-polygons that overlap the flow path of the river and are lower than PSP. Finally, the total affected area, that is, the number of households, (people) influenced by the deforestation caused by the construction of SPPs, is calculated. These people are regarded as former beneficiaries of lost forest ESs.

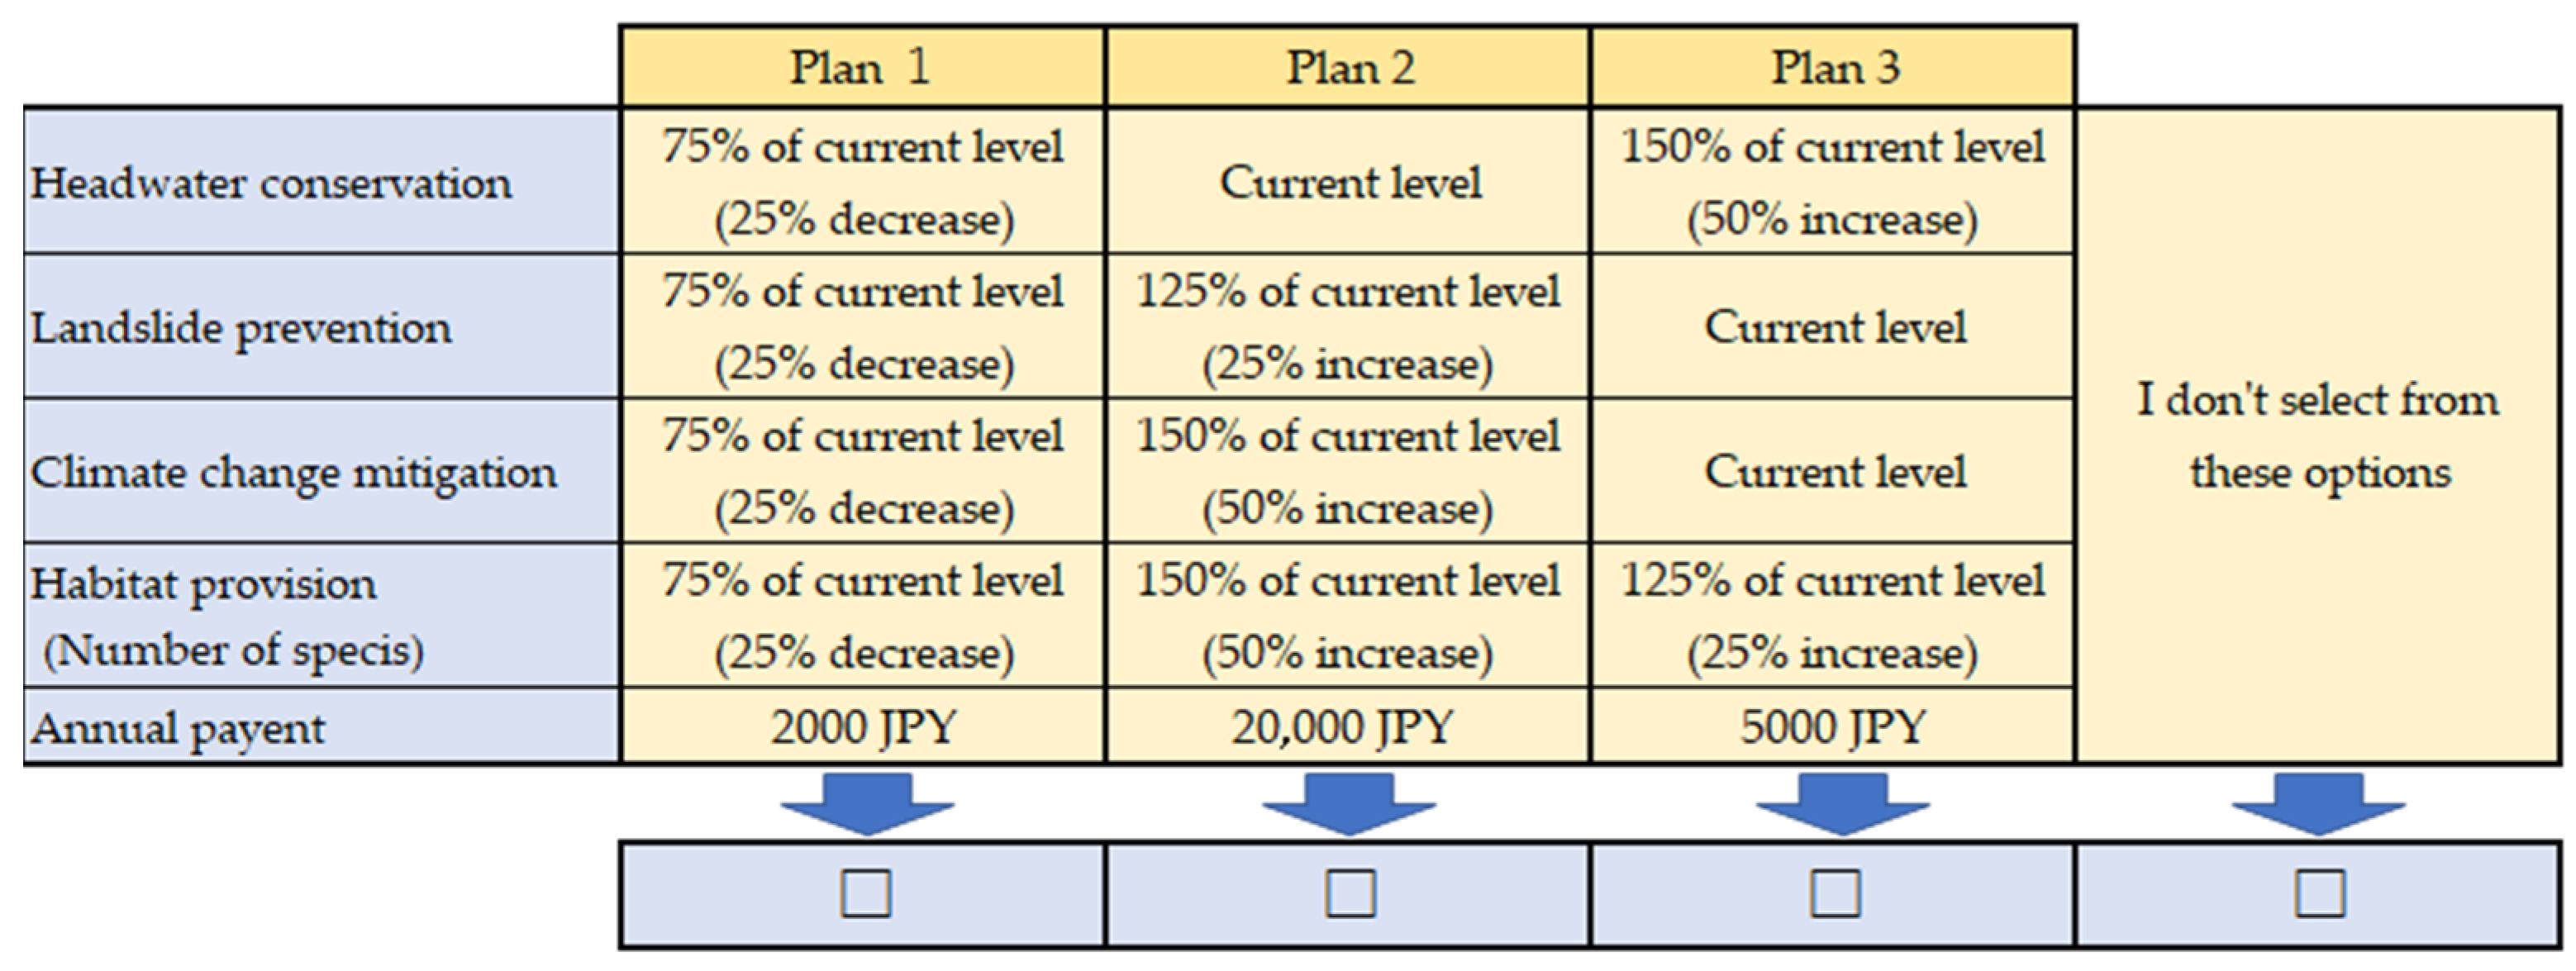
2.3. Economic Valuation

Using the results of the geographical analysis, we also estimate the values of HCS of the forest ecosystem that are lost due to the construction of SPPs in the Satetsu-gawa river basin. The unit value of HCS is based on our previous study (Sato et al., 2019 [35]), which proposed an equation to estimate a unit value of forest ES.
In the study, we first assessed the total value of the forest ecosystem in Japan using contingent valuation (CV) and estimated the unit value of forest HCS. For CV, the payment card type of CV was adopted. Payment card type is a classic method to elicit information regarding the demand for nonmarket goods [36], and it is considered as a potential tool for determining the value of nonmarket goods and services [37]. We prepared the payment card format with a sufficiently high maximum bid (JPY 20,000), as a previous study highlighted that making the upperend bid sufficiently high may reduce the errors introduced by range bias [38].
A nationwide Internet questionnaire survey about CV was conducted in November 2015. The respondents of the survey were monitor panels owned by Nikkei Research Co. Ltd., who were randomly selected from the monitor panels so that the population and age ratios of respondents will match with that of the residents in each prefecture. On average, approximately 0.3% of the population of each prefecture is covered. However, the bias due to the extraction from the monitor panel is unavoidable.
In the payment card format, the evaluation object was defined as an increase in forest area in the respondents’ prefecture by a hectare, and the unit of payment was JPY per hectare of forest per household per year. Respondents were asked to state their willingness to pay (WTP) for 1 hectare of forest preservation in the prefecture in which they lived. The actual description used in the questionnaire is as follows: “Suppose that the local government is planning to preserve one additional hectare of forest by controlling development and promoting planting. This project requires additional public funding. How much would your household be willing to contribute to the increased costs of the project? Note that the charge will be collected by the local government and used as only to fund the project.” In the questionnaire, to promote the re-recognition of the forest ecosystem, we asked questions about the importance of forests in the context of ecosystems after the payment card type questions on CV.
After dropping nonresponses or protest responses to the CV survey and other insufficient answers, 192,704 observations from all 47 prefectures in Japan were left. The obtained WTP is regarded as the value of expanding a hectare of forests in the respondents’ prefecture. Based on these observations from the questionnaire survey, a regression equation for WTP is obtained. The equation is as follows:
WTP = 2610.18 + 0.00015 × INC − 354.57 × WOR − 19.79 × RA − 457.73 × NFR + 788.72 × BRR − 5.75 × FA + ε.
The definitions of the variables are as follows:
  • INC: income of the respondent;
  • WOR: the rate of women in the municipality where the forest is located;
  • RA: age of respondent;
  • NFR: natural forest rate;
  • BRR: broadleaf rate of the forest;
  • FA: average forest age.
We insert variables about Ichinoseki, in which the Satetsu-gawa river basin, is located into the equation to estimate the unit value of the forest ecosystem in the river basin. The result shows that the unit value of the forest ecosystem in Ichinoseki is JPY 2658 per hectare per household per year.
Second, because the above unit value includes all types of forest ES, the value of HCS should be extracted. To do this, we conducted a choice experiment (CE) to estimate the weights of each ES. The following six ES were used to estimate the weights: headwater conservation, soil retention, habitat provision, timber production, recreation, and climate change mitigation. We also conducted a CE questionnaire survey in December 2015 to estimate the weights of each ES. The same panel of the CV survey was used, and as in the case of the CV survey, the population and age ratios were considered for sample selection. We chose 6843 respondents from the panel through random sampling. Since each person asked the repeated partial profile selection question 8 times, the data used for the analysis were 54,744.
Previous studies on CE have revealed that as humans’ ability to process information is limited, respondents cannot give appropriate answers unless they are presented with an appropriate amount of information. In particular, although CE can evaluate multiple attributes, it has been pointed out that if too many attributes are evaluated, the cognitive load will be too much to evaluate appropriately [39,40]. Therefore, in this study, we adopt partial profile analysis and assume a total of seven attributes, which are the six main forest ESs, all of which are identified by Science Council Japan [41]: HCS, landslide prevention, habitat provision, timber provision, recreation, and climate change mitigation. Four out of seven ESs are used for each profile. The changes in the ES level used in the profile are 50%, the current level (100%), 125%, and 150%.
The annual payment is used as a monetary attribute with five options listed as follows: JPY 1000, JPY 2000, JPY 5000, JPY 10,000, and JPY 20,000 (Figure 3). Then, the observation data collected through the questionnaire survey were analyzed using the logit model.
The result shows that the weight for HCS is 0.201, which implies that 20.1% of the total value of the forest ecosystem is attributed to HCS. Therefore, the weight is multiplied by the unit value, and the value of HCS is JPY 533 per hectare per household per year. Using this unit value of HCS, we estimate the lost value of HCS due to the construction of SPPs by multiplying the unit value of the deforested area by the number of households in the affected area, which are estimated in the geographical analysis.

2.4. Indicators to Assess the Impact of SPPs

We present 11 indicators, varying from primary/basic ones, which are directly obtained from the geographic analysis, to secondary/composite ones that are estimated by other basic indicators. Indicators 1, 2, and 5 are basic, and the other indicators are composite. Among the composite indicators, Indicators 6 and 7 are related to economic valuation, and 8 to 10 are related to the power generation capacity of SPPs. Brief explanations of these indicators are as follows:

2.4.1. Indicator 1: Deforested Area (Basic)

This is the deforested area due to the construction of an SPP, which is the simplest and most popular indicator. This type of indicator is frequently used by government authorities when approving development permits.

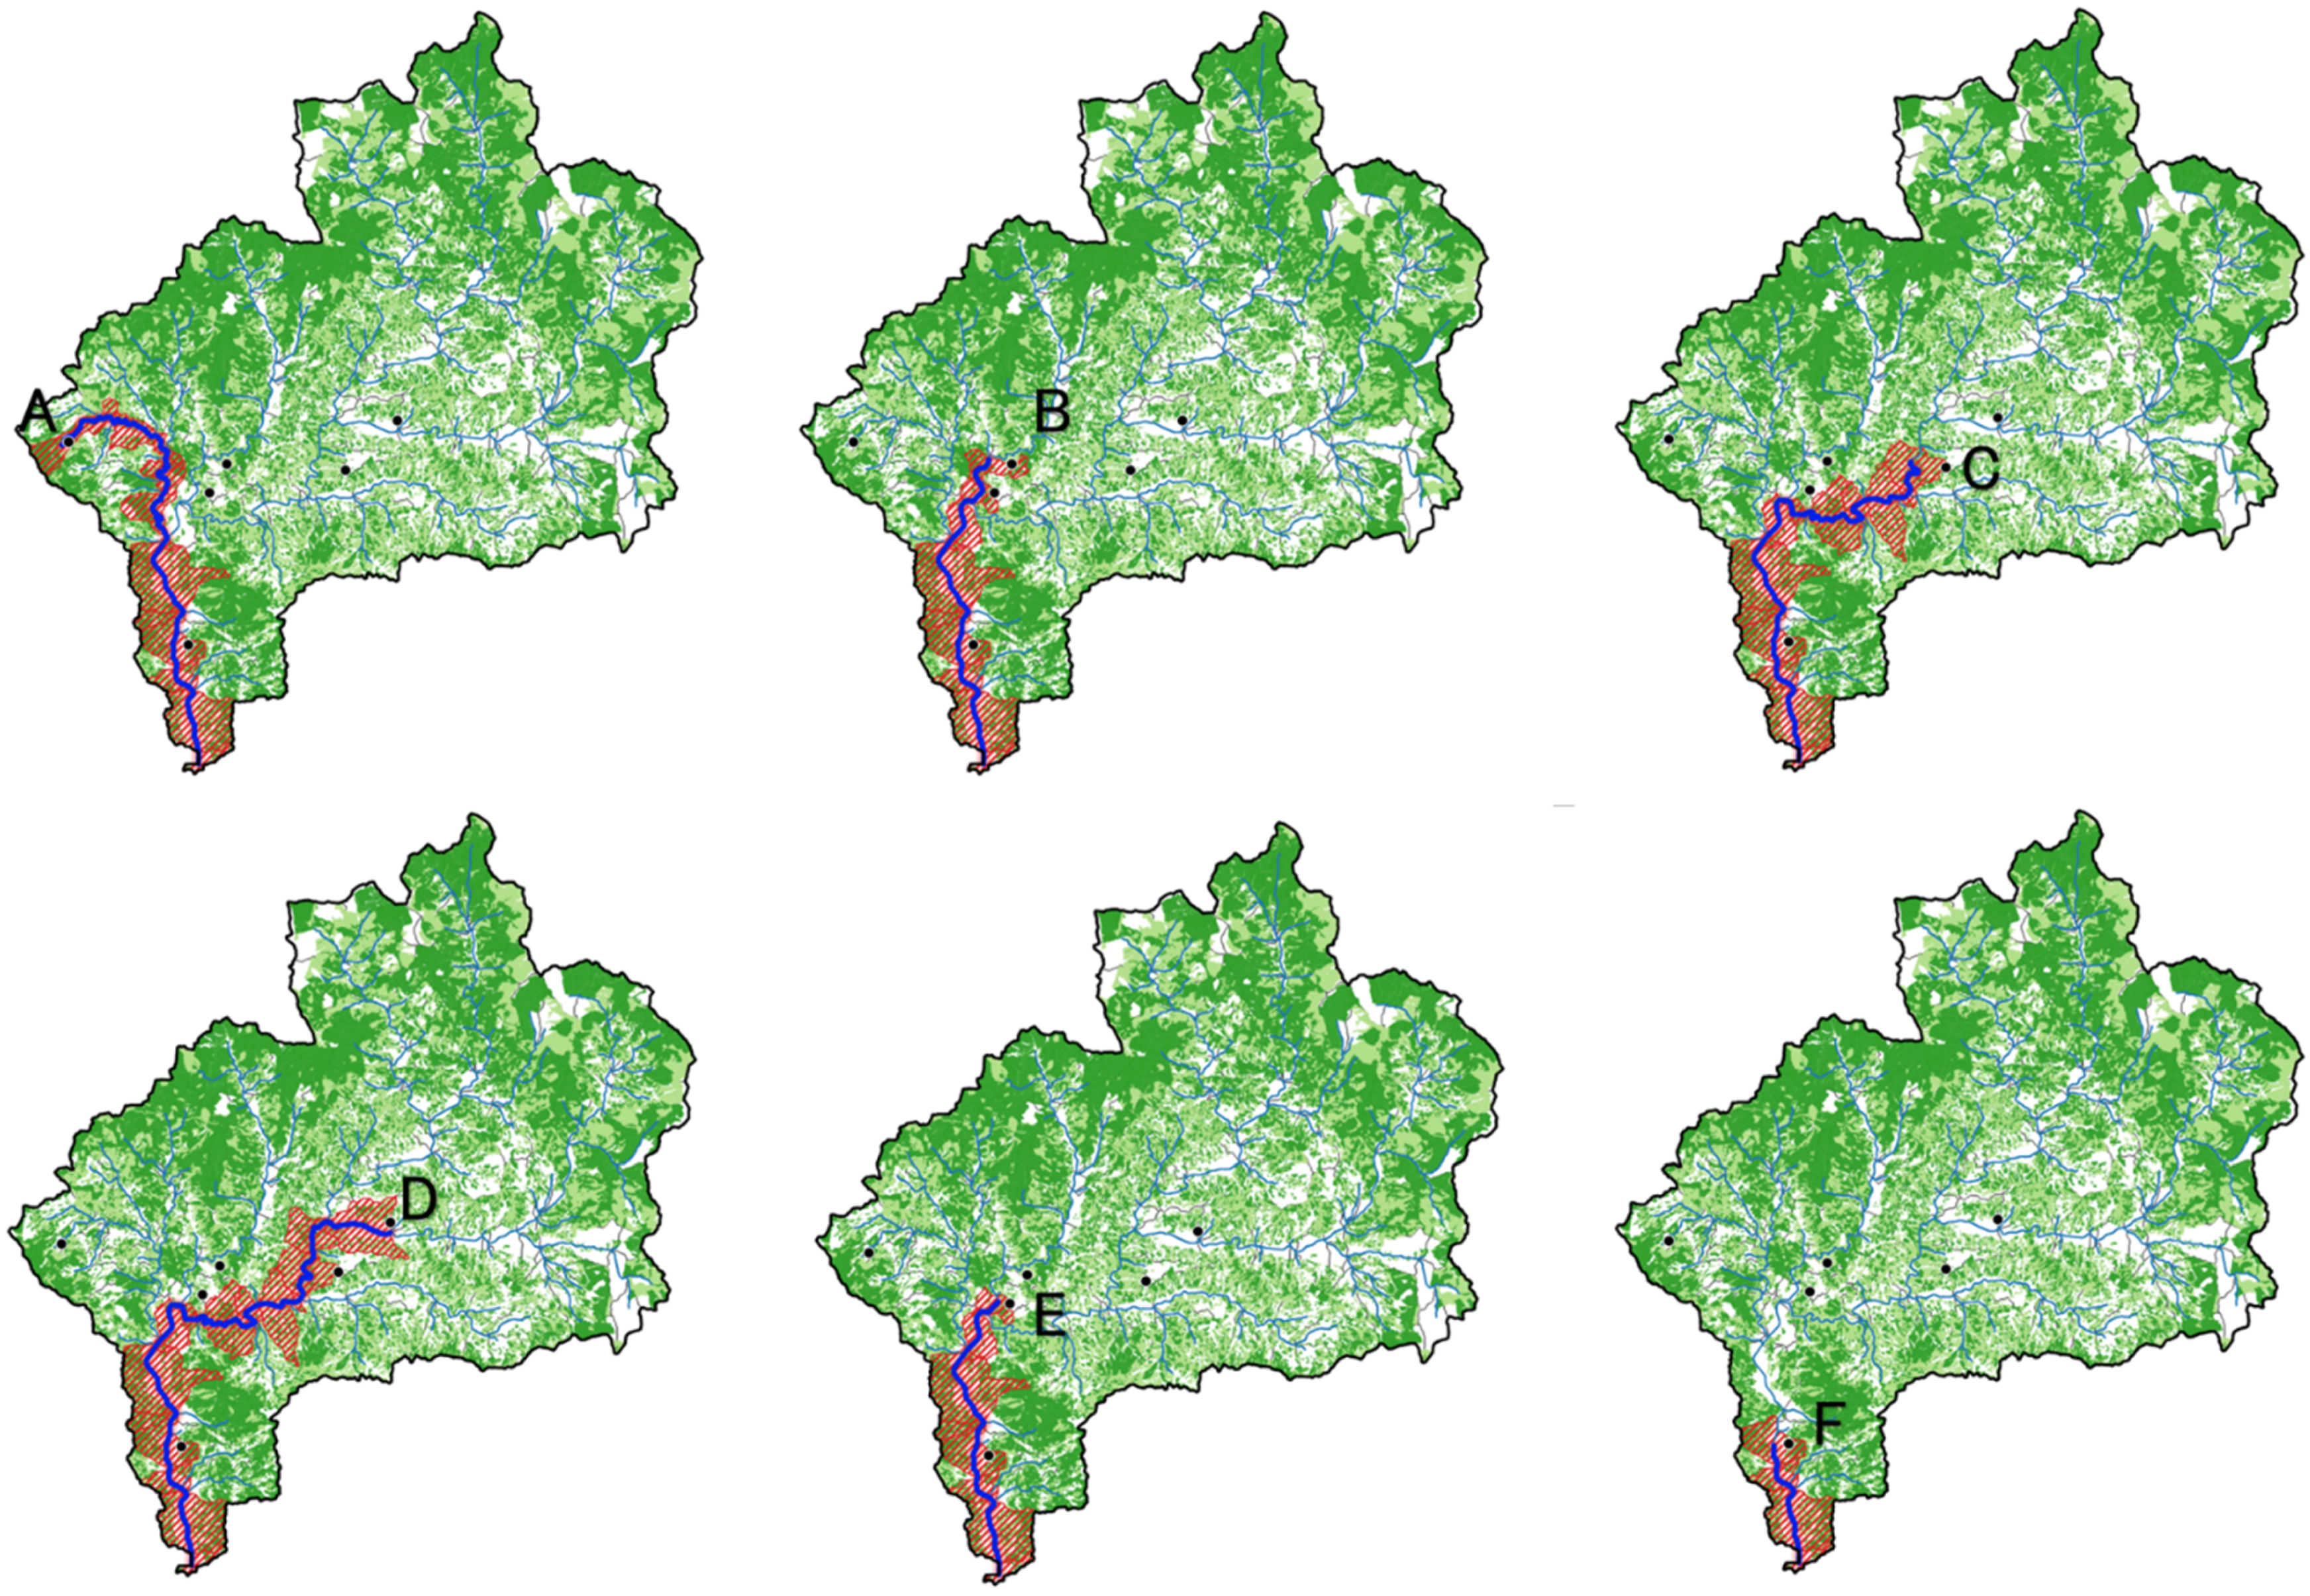
2.4.2. Indicator 2: Total Affected Area (Basic)

This represents the area affected by the installation of SPPs. Because the indicator includes the impact on land used for peoples’ daily activities and business such as arable, residential, industrial, and commercial areas, the indirect impacts on people through impact on the land they use can be evaluated.

2.4.3. Indicator 3: Share of Deforested Area in the Total Forest in the Affected Area (Composite)

This indicator is the ratio of deforested area to the total forest area in the affected area. Even if a small area is deforested, it is not desirable to develop a large part of the forests in the affected area. The indicator can assess the performance of SSPs from this perspective.

2.4.4. Indicator 4: Affected Deforested Area Ratio (Composite)

This is the ratio of the deforested area (Indicator 1) to the affected area (Indicator 2). Even if a small area is deforested, it is not preferable if the affected area is large; thus, Indicator 4 can assess this aspect and the number of the indicator should be small.

2.4.5. Indicator 5: Number of Households in the Affected Area (Basic)

This is the number of households in the affected area, i.e., the number of people that are directly affected by the deforestation. The indicator can evaluate the magnitude of the direct impact on residents, and obviously, a smaller number of affected households is desirable.

2.4.6. Indicator 6: Unit Price per Hectare of Deforested Area (Composite and Economic)

This indicator is the unit price of HCS per hectare of deforested area. The indicator is calculated by multiplying the unit value of forest HCS by the number of households in the affected area (Indicator 5). It can assess the unit value of lost forest HCS. Moreover, based on the indicator, a forest with a smaller lost unit value should be developed.

2.4.7. Indicator 7: Lost Value of HCS (Composite and Economic)

This shows the total value of HCSs lost due to the construction of SPPs. This is a composite indicator that integrates Indicators 1 and 5 and is effective for measuring monetary value when analyzing multiple factors in a complex manner. Obviously, a smaller value of loss is preferable.

2.4.8. Indicator 8: Deforested Area per MW of Power Generation (Composite)

This indicator is defined as the deforested area per MW of power generation capacity. When considering the tradeoff between HCS and the introduction of renewable energy, composite indicators that include power generation factors, such as this indicator, are necessary. Indicator 8 can be used to assess the SPP that can perform best in terms of effective power generation with a smaller area of deforestation.

2.4.9. Indicator 9: Affected Area per MW of Power Generation (Composite)

This indicator is the affected area per MW of power generation. The indicator can assess how large areas are affected by generating a unit of power. Obviously, a smaller value of this indicator is desirable.

2.4.10. Indicator 10: Number of Households Affected per MW of Power Generation (Composite)

This indicator is defined as the number of households affected by deforestation per MW of power generation capacity. The indicator can identify the SPP that can generate the maximum power with a small number of affected households.

2.4.11. Indicator 11: Lost Value per MW of Power Generation (Composite and Economic)

This indicator is defined as the lost value of HCS per MW of power generation capacity. As this indicator is estimated from Indicator 7, it contains the factors of Indicators 1 and 5. Indicator 11 can assess the overall impact of deforestation and identify the SPP that can generate power most with a small loss of the value of HCS.
Indicator 1 was seleted to measure the direct modification of ES, and Indicators 2 to 5, which were related to the affected area, were selected as proxies for the impact of forest ES modification on residents. The economic indicators (Indicators 6 and 7) were used to assess the impact from an economic viewpoint. Finally, indicators related to the power generation capacity of SPP (Indicators 8–11) were chosen to investigate the trade-off between forest ES conservation and the promotion of renewable energy as this issue is critical to the study site.

3. Results

The results of the geographic analysis are presented in Table 2, Table 3 and Table 4. Table 2 shows the results in the entire Satetsu-gawa river basin; the total area of the basin is 37,952 hectares, among which 25,239 (66.5%) is forest, and the proportion is almost the same as that of the national average. Approximately 98% of forest area is owned by private sectors, and nationally owned forest has a very minor share. The number of households in the river basin is 7244, which is 16.8% of households in Ichinoseki (43,046). Table 3 shows the estimation results of the deforested area, affected area, and lost value of HCS. The estimation results of the affected area are also illustrated in Figure 4. The deforested areas (Indicator 1) vary from 1.0 to 8.2 hectares, and the indicator relatively correlates with the generation capacity of the plant (Table 4). The total affected area (Indicator 2) ranges from 985 to 3672. Table 3 and Figure 4 show that the plant with the best performance is Plant F followed by Plants E, B, A, C, and D in descending order. This implies that plants that are located lower in the river basin perform better. The values of lost forest ES, i.e., HCS, range from JPY 0.3 to 3.3 million. As the value considers both the deforested area and the number of households in the affected area, the plants located lower in the river basin with fewer residents perform better.
Table 4 shows the results of the power generation capacity. The power generation capacities range from 0.9 to 3.0 MW, depending on the scale of SPPs. The values of the deforested area per unit of power generation (Indicator 8) fall in the range from 1.2 to 1.7 ha/MW, but Plant A generates 2.73 ha/MW, which performs much worse than the other five plants. This implies that in comparison with its power generation capacity, for Plant A, a much larger area was deforested than others. Regarding the affected area per MW (Indicator 9), the range of the results is wider, from 842 to 4080 ha/MW. It is interesting that although Plant A has a relatively large affected area, it performs best in this indicator. Plant A also performs best in the number of households affected per MW (Indicator 10). These results mainly come from the largest power generation capacity. Finally, for Indicator 11, the results of the lost value of HCS per MW of power generation mostly fall in the range of JPY 0.7 to 1.2 million/MW, but Plant A accounts for JPY 0.24 million/MW, which is much smaller than the other five plants. The indicator is composite, which comprises Indicators 1 and 5. The result may be due to a smaller deforested area and a smaller number of affected households.
Table 5 presents the order of performance of the SPPs assessed by each indicator. Plant F performs best in 5 (Indicators 2, 5, 6, 7, and 11) of the 11 indicators; these 5 indicators mainly relate to the lost value and the number of households in the affected area. This implies that, compared with other plants, Plant F has less influence on residents. Plant D performs best in three indicators (Indicators 1, 3, and 8) that relate to the deforested area. However, Plant D performs worst in six indicators—more than half of the total indicators. The performance of Plant D heavily depends on the indicators. Plant A performs best in three indicators (Indicators 4, 9, and 10), which mainly relate to the affected area, whereas it performs worst in five indicators (Indicators 1, 2, 7, 8, and 11). Moreover, Plant D has a large fluctuation in its results depending on the indicators. Conversely, Plants B, C, and E do not perform best in any of the indicators, which makes them less preferable. However, Plants B and D are positioned in second and fourth in most indicators. This implies that these two plants are moderate in terms of the assessment results. Plant C varies wider than Plants B and D.
From the perspective of the indicator type, Plant F performs best in all the three economic indicators, and Plant A also performs better in the composite indicators. Particularly, Indicator 7 reflects two basic indicators—Indicators 1 and 5—and can reveal a more complex influence on the community. A good performance in economic indicators reflects the assessments from a more comprehensive perspective, and Plant F performs better when all the indicators are considered collectively.

4. Discussion

4.1. Information from the Indicators and Prioritization of Indicators

Fisher et al. [42] classified ES into three groups—in situ, omnidirectional, and directional. The directional group is sub-classified into two types—vertical and horizontal. HCS falls into the vertical-directional type, which relates to elevation level. The nature of this type of ES is a remote location of service production and benefit areas. In such a case, it is difficult to show the relationship between ES supply and benefit explicitly and whether the beneficiaries recognize the ES benefit.
In the case of the Satetu-gawa river basin, the trade-off between the promotion of renewable energy and forest ES conservation is a critical issue. Therefore, the relationship between forest ES conservation and the introduction of renewable energy and the beneficiaries of forest ES conservation should be clarified. Policymakers want to understand the influences of the construction of SPP on not only nearby areas but also remote areas. This is because to make an effective policy decision, policymakers need to understand comprehensive influences on beneficiaries. Thus, in this study, we apply 11 indicators to understand the impacts, and introduce new indicators, such as the affected area (Indicator 2) and beneficiaries (Indicator 5), to understand the remote benefit area. Identifying the affected area and beneficiaries can reveal the influence of SPPs on remote areas. These possible impacts on remote benefit areas are not captured by existing primary indicators such as deforested areas and thus give policymakers new insights into the impact of the construction of SPPs on ES. Thus, policymakers can utilize various information obtained by the assessment and its results for policy decision making. Furthermore, presenting multiple and various indicators may provide information on forest ES conservation from various perspectives and enhance the practicality of our study.
From the analysis, we find that the performance of each plant heavily depends on the indicators applied. This implies that the indicators that are applied and prioritized for an assessment are important. Therefore, the next issue for policymakers is among these indicators: which one should be applied to evaluate the impact of SPPs and should be given much priority. We believe this should be determined by discussion and consensus building among various stakeholders. Multi-criteria analysis and deliberative approach are useful in determining the indicators that should be applied [43,44], but this is not the focus of this study. However, presenting multiple indicators instead of a single indicator can provide more information to stakeholders, facilitate the use of assessments, and make the valuation more practical.

4.2. Demand-Side Analysis of ES and the Identification of Beneficiaries

Ecosystems provide various benefits, such as ES, to people, but some of the ESs are not recognized by them as benefits because of their characteristics as a public good. In particular, regulating services have a strong characteristic of a public good, both non-exclusiveness and non-competitiveness. Moreover, users do not pay for the service, leading to excessive usage and the so-called market failure. Due to this phenomenon, globally, attempts have been made to visualize and mainstream ES, such as MEA, TEEB, IPBES, and ESP. In these initiatives, ES has been identified and mainly evaluated from the supply side, i.e., from the perspective of ecosystems. However, less emphasis has been placed on the demand side, i.e., those who benefit from them. Research on the demand side such as the identification of beneficiaries is ongoing and has received increased attention [21]. Some previous studies considered beneficiaries of ES, mainly by mapping them [45,46,47], by land use and landowners [48], and by regarding all residents living in a particular area as beneficiaries [23].
To understand the impact of modification of ecosystem on ES, the volume of directly modified ecosystem, e.g., area of deforestation, is often used as a proxy. However, even if the same area of forest is deforested, its impact on people will vary greatly depending on the demand-side factors. Therefore, to accurately assess the impact, it is necessary to reflect not only directly modified ecosystems from the supply side but also the information on the beneficiaries from the demand side. Identifying the affected area and beneficiaries in this study provides a new perspective on ecosystem valuation from the demand side. For example, our results indicate that some affected areas of each SPP overlapped, especially in the downstream area. Residents in these overlapping areas receive more benefits from forest ES conservation than those in other areas. In this manner, our valuation also contributes to the visualization and mainstreaming of forest ES. In addition, identifying the affected area and beneficiaries can raise people’s awareness that they are not only affected by changes in ecosystems condition but also ecosystem should be properly conserved.

4.3. Practical Valuation for Closing the Information Gap

As explained in Section 1, Olander et al. [19] mentioned that one of the reasons that cause the information gap is that local-specific factors are not fully captured in the valuation. The range of benefits heavily depends on local-specific conditions such as geographical, societal, and biological factors. By considering the beneficiary in the valuation, we believe that the information gap can be closed.
There are three main reasons why our evaluation, which considers the number of beneficiaries, can close the information gap. First, it is possible to provide policymakers with information on ES from new perspectives. This type of local-specific information is useful for local policymakers because the valuation can be used as an explanation to residents who will be influenced by deforestation, and residents can determine whether they will accept the deforestation or not. Thus, a valuation with much practical and real information can make residents recognize themselves as concerned citizens. Second, by identifying beneficiaries, the beneficiary pays principle can be applied in a practical way. As mentioned above, if the people can recognize themselves as concerned citizens, it will be easier for them to understand if they are requested to pay for the cost of ecosystem conservation. Therefore, the evaluation can be used as a basis for the payment for ES (PES). More broadly, by presenting such information to the beneficiaries, it is possible to request them to pay for the cost with more objective evidence, thereby ensuring evidence-based policymaking (EBPM). Third, the valuation can provide multiple indicators for policymakers and residents and provide evidence for decision-making in a much broader way. Olander et al. [19] pointed out that one of the factors that causes the information gap is the failure to develop transparent and unambiguous linkages between ecosystem changes and outcomes. Our valuation can reveal the linkage between deforestation and possible influence on remote residents, thereby narrowing this gap. Fourth, a more rigorous cost–benefit analysis is possible by conducting an economic evaluation that identifies the beneficiaries. Some studies roughly evaluated the beneficiaries, for instance, by assuming that the range of beneficiaries is the entire city, which can lead to an overestimation of the benefits. In this evaluation, by conducting a rigorous evaluation that considers the beneficiaries, it is possible to perform a more realistic cost–benefit analysis and determine whether the ecosystem modification is appropriate based on the social costs and benefits to a region and community. Specifically, our valuation can be used (1) as a basis to explain the impact of constructing SPPs, (2) to decide on whether the construction is appropriate for the region and community, and (3) to give permission to construct SSPs. According to Laurans et al. [5], the purposes for the use of ES valuation can be grouped into three uses—informative, decisive, and technical. Based on this, the explanation is categorized under informative purpose, and the decision making and the grating of permission are under decisive purposes.

5. Conclusions

Since the accident at the Fukushima 1 nuclear power plant in 2011, renewable energy has been actively promoted in Japan, and the construction of SPPs has been rapidly promoted nationwide. The installation of many power plants has caused deforestation; an example is the case of the Satetsu-gawa river basin. However, due to recent climate change, we experience serious natural disasters more frequently, and precipitation increases the probability of forest destruction [49]. From the perspective of disaster prevention, more attention should be paid to forest ES, especially regulating services [50]. Thus, the construction of SPPs that leads to deforestation creates a trade-off between the promotion of renewable energy and the provision of forest ES, which is part of the trade-off between climate change and ecosystem conservation policies (the one that should be prioritized among the two is a major issue for local policymakers). Additionally, the situation of the forest ecosystem is more pessimistic. In Japan, the area of planted forest is 40% of the total forest area. Under the current severe budget constraint and declining trend of domestically produced timber consumption, planted forests are less maintained, and in some cases, they are abandoned [51]. This leads to a lower capacity to supply ES, and sometimes people are affected by this when there are disasters, such as landslides and floods. These are some of the main concerns for local municipalities in Japan. Therefore, to implement forest maintenance policies more effectively, policymakers should distinguish existing plantation forests that should be managed from what should be returned to natural. Based on the analysis of this study, we can identify hotspots of the forest ecosystem in terms of supply and demand of ES, and we believe the results would be useful for local policymakers. Moreover, by using the multiple indicators presented in this study, the relationship between forest ES and the introduction of renewable energy and beneficiaries of forest ES can be clarified from multiple perspectives. This allows local residents to perceive themselves as stakeholders and allows them to think more seriously about the relationship between the construction of renewable energy and forest ES.
Finally, we briefly present the limitations of our study. First, we do not consider the resilience of ecosystems. We assume that deforestation influences residents living in a lower elevation than the forest, but other nearby forests can cover lost ES to some degree. The impact may be much smaller or even negligible. In this sense, our result might be overestimated. The second limitation is that the economic analysis, WTP estimation and the value of forest ES conservation are rather robust. The economic valuation and the identification of a regression equation for WTP is not based on a survey of local residents but a nationwide survey, as we could not collect enough observations for the analysis by surveying only the study area. This may lead to over/underestimations of the economic value. Third, we only conducted a cross-sectional analysis and did not conduct a time series analysis. A change in the extent and value of forest ES conservation is not approached in the analysis. Fourth, although we considered demand-side factors in the analysis, some social factors of the beneficiaries such as social status, ethnicity, and profession are ignored. Only income level is cosidered in the economic valuation as a social factor; however, these ignored social factors may influence the results.
We believe that these limitations do not heavily influence the results. However, more rigid assessments require analysis of ecosystem function, and the inclusion of these effects will be considered in a future study to tackle these limitations.

Author Contributions

Conceptualization, T.H.; methodology, D.K. and T.H.; validation, T.H. and D.K.; geographic analysis and its data collection, D.K.; economic valuation and related survey, M.S.; data curation, D.K.; writing—original draft preparation, T.H.; writing—review and editing, T.H., D.K. and M.S.; supervision, T.H. All authors have read and agreed to the published version of the manuscript.

Funding

This work was supported by the Ministry of the Environment, Japan (MoE) under the research project “Developing ecosystem accounting for national and local policies” led by M.S. and implemented under the consignment study “Research on environmental economics and policy studies”.

Institutional Review Board Statement

Not applicable.

Informed Consent Statement

Informed consent was obtained from all subjects involved in the study.

Data Availability Statement

The data presented in this study are available on request from the corresponding author.

Acknowledgments

We would like to thank the MoE for providing financial support for our research project.

Conflicts of Interest

The authors declare no conflict of interest.

References

  1. Costanza, R.; d’Arge, R.; de Groot, R.; Farber, S.; Grasso, M.; Hannon, B.; Limburg, K.; Naeem, S.; Oneill, R.V.; Paruelo, J.; et al. The value of the world’s ecosystem services and natural capital. Nature 1997, 387, 253–260. [Google Scholar] [CrossRef]
  2. Su, M.; Peng, B. Integrating values of ecosystem services into decision-making in coastal management in Xiamen. Ocean Coast. Manag. 2018, 207, 104590. [Google Scholar] [CrossRef]
  3. Costanza, R.; de Groot, R.; Braat, L.; Kubiszewski, I.; Fioramonti, L.; Sutton, P.; Farber, S.; Grasso, M. Twenty years of ecosystem services: How far have we come and how far do we still need to go? Ecosyst. Serv. 2017, 28, 1–16. [Google Scholar] [CrossRef]
  4. De Groot, R.; Brander, L.; van der Ploeg, S.; Costanza, R.; Bernard, F.; Braat, L.; Christie, M.; Crossman, N.; Ghermandi, A.; Hein, L.; et al. Global estimates of the value of ecosystems and their services in monetary units. Ecosyst. Serv. 2012, 1, 50–61. [Google Scholar] [CrossRef]
  5. Laurans, Y.; Rankovic, A.; Billé, R.; Pirard, R.; Mermet, L. Use of ecosystem services economic valuation for decision making: Questioning a literature blindspot. J. Environ. Manag. 2013, 119, 208–219. [Google Scholar] [CrossRef] [PubMed]
  6. Rieb, J.T.; Chaplin-Kramer, R.; Daily, G.C.; Armsworth, P.R.; Böhning-Gaese, K.; Bonn, A.; Cumming, G.S.; Eigenbrod, F.; Grimm, V.; Jackson, B.M.; et al. When, where, and how nature matters for ecosystem services: Challenges for the next generation of ecosystem service models. BioScience 2017, 67, 820–833. [Google Scholar] [CrossRef]
  7. Ruckelshaus, M.; McKenzie, E.; Tallis, H.; Guerry, A.; Daily, G.; Kareiva, P.; Polasky, S.; Ricketts, T.; Bhagabati, N.; Wood, S.A.; et al. Notes from the field: Lessons learned from using ecosystem service approaches to inform real-world decisions. Ecol. Econ. 2015, 115, 11–21. [Google Scholar] [CrossRef] [Green Version]
  8. Kieslich, M.; Salles, J.M. Implementation context and science-policy interfaces: Implications for the economic valuation of ecosystem services. Ecol. Econ. 2021, 179, 106857. [Google Scholar] [CrossRef]
  9. Barton, D.N.; Kelemen, E.; Dick, J.; Martin-Lopez, B.; Gómez-Baggethun, E.; Jacobs, S.; Hendriks, C.M.A.; Termansen, M.; García- Llorente, M.; Primmer, E.; et al. (Dis) integrated valuation-Assessing the information gaps in ecosystem service appraisals for governance support. Ecosyst. Serv. 2018, 29, 529–541. [Google Scholar] [CrossRef] [Green Version]
  10. Levrel, H.; Cabral, P.; Feger, C.; Chambolle, M.; Basque, D. How to overcome the implementation gap in ecosystem services? A user-friendly and inclusive tool for improved urban management. Land Use Policy 2017, 68, 574–584. [Google Scholar] [CrossRef]
  11. Laurans, Y.; Mermet, L. Ecosystem services economic valuation, decision-support system or advocacy? Ecosyst. Serv. 2014, 7, 98–105. [Google Scholar] [CrossRef]
  12. Spash, C.L.; Vatn, A. Transferring environmental value estimates: Issues and alternatives. Ecol. Econ. 2006, 60, 379–388. [Google Scholar] [CrossRef]
  13. Waite, R.; Kushner, B.; Jungwiwattanaporn, M.; Gray, E.; Burke, L. Use of coastal economic valuation in decision making in the Caribbean: Enabling conditions and lessons learned. Ecosyst. Serv. 2015, 11, 45–55. [Google Scholar] [CrossRef]
  14. Villa, F.; Bagstad, K.J.; Voigt, B.; Johnson, G.W.; Portela, R.; Honzák, M.; Batker, D. A methodology for adaptable and robust ecosystem services assessment. PLoS ONE 2014, 9, e91001. [Google Scholar] [CrossRef]
  15. Schaefer, M.; Goldman, E.; Bartuska, A.M.; Sutton-Grier, A.; Lubchenco, J. Nature as capital: Advancing and incorporating ecosystem services in United States federal policies and programs. Proc. Natl Acad. Sci. USA 2015, 112, 7383–7389. [Google Scholar] [CrossRef] [Green Version]
  16. Palmer, M.A. Socioenvironmental sustainability and actionable science. BioScience 2012, 62, 5–6. [Google Scholar] [CrossRef] [Green Version]
  17. Pandeya, B.; Buytaert, W.; Zulkafli, Z.; Karpouzoglou, T.; Mao, F.; Hannah, D.M. A comparative analysis of ecosystem services valuation approaches for application at the local scale and in data scarce regions. Ecosyst. Serv. 2016, 22, 250–259. [Google Scholar] [CrossRef] [Green Version]
  18. Nelson, E.; Mendoza, G.; Regetz, J.; Polasky, S.; Tallis, H.; Cameron, D.R.; Chan, K.M.; Daily, G.C.; Goldstein, J.; Kareiva, P.M.; et al. Modeling multiple ecosystem services, biodiversity conservation, commodity production, and tradeoffs at landscape scales. Front. Ecol. Environ. 2009, 7, 4–11. [Google Scholar] [CrossRef]
  19. Olander, L.; Polasky, S.; Kagan, J.S.; Johnston, R.J.; Wainger, L.; Saah, D.; Maguire, L.; Boyd, J.; Yoskowitz, D. So, you want your research to be relevant? Building the bridge between ecosystem services research and practice. Ecosyst. Serv. 2017, 26, 170–182. [Google Scholar] [CrossRef]
  20. Watson, K.B.; Galford, G.L.; Sonter, L.J.; Koh, I.; Ricketts, T.H. Effects of human demand on conservation planning for biodiversity and ecosystem services. Conserv. Biol. 2019, 33, 942–952. [Google Scholar] [CrossRef] [PubMed] [Green Version]
  21. Wolff, S.; Schulp, C.J.E.; Verburg, P.H. Mapping ecosystem services demand: A review of current research and future perspectives. Eclog Indic. 2015, 55, 159–171. [Google Scholar] [CrossRef]
  22. Schirpke, U.; Scolozzi, R.; De Marco, C.; Tappeiner, U. Mapping beneficiaries of ecosystem services flows from natura 2000 sites. Ecosyst. Serv. 2014, 9, 170–179. [Google Scholar] [CrossRef]
  23. Bagstad, K.J.; Villa, F.; Batker, D.; Harrison-Cox, J.; Voigt, B.; Johnson, G.W. From theoretical to actual ecosystem services: Mapping beneficiaries and spatial flows in ecosystem service assessments. Ecol. Soc. 2014, 19, 64. [Google Scholar] [CrossRef] [Green Version]
  24. García-Nieto, A.P.; García-Llorente, M.; Iniesta-Arandia, I.; Martín-López, B. Mapping forest ecosystem services: From providing units to beneficiaries. Ecosyst. Serv. 2013, 4, 126–138. [Google Scholar] [CrossRef]
  25. Syrbe, R.U.; Walz, U. Spatial indicators for the assessment of ecosystem services: Providing, benefiting and connecting areas and landscape metrics. Ecol. Indic. 2012, 21, 80–88. [Google Scholar] [CrossRef]
  26. Daily, G.C.; Polasky, S.; Goldstein, J.; Kareiva, P.M.; Mooney, H.A.; Pejchar, L.; Ricketts, T.H.; Salzman, J.; Shallenberger, R. Ecosystem services in decision-making: Time to deliver. Front. Ecol. Environ. 2009, 7, 21–28. [Google Scholar] [CrossRef] [Green Version]
  27. Gowan, C.; Stephenson, K.; Shabman, L. The role of ecosystem valuation in environmental decision making: Hydropower relicensing and dam removal on the Elwha River. Ecol. Econ. 2006, 56, 508–523. [Google Scholar] [CrossRef]
  28. Navrud, S. Economic valuation of inland recreational fisheries: Empirical studies and their policy use in Norway. Fish. Manag. Ecol. 2001, 8, 369–382. [Google Scholar] [CrossRef]
  29. Díaz, S.; Pascual, U.; Stenseke, M.; Martín-López, B.; Watson, R.T.; Molnár, Z.; Hill, R.; Chan, K.M.A.; Baste, I.A.; Brauman, K.A.; et al. Assessing nature’s contributions to people. Science 2018, 359, 270–272. [Google Scholar] [CrossRef] [Green Version]
  30. Pascual, U.; Balvanera, P.; Díaz, S.; Pataki, G.; Roth, E.; Stenseke, M.; Watson, R.T.; Dessane, E.B.; Islar, M.; Kelemen, E.; et al. Valuing nature’s contributions to people: The IPBES approach. Curr. Opin. Env. Sust. 2017, 26–27, 7–16. [Google Scholar] [CrossRef] [Green Version]
  31. Braat, L.C. Five reasons why the science publication “Assessing nature’s contributions to people” (Diaz et al. 2018) would not have been accepted in ecosystem services. Ecosystem. Serv. 2018, 30, A1–A2. [Google Scholar] [CrossRef]
  32. Kenter, J.O. IPBES: Don’t throw out the baby whilst keeping the bathwater; Put people’s values central, not nature’s contributions. Ecosyst. Serv. 2018, 33, 40–43. [Google Scholar] [CrossRef]
  33. Forest Agency. Water Retention Function. Available online: https://www.rinya.maff.go.jp/j/keikaku/tamenteki/con_2_4.html (accessed on 12 July 2021).
  34. Hansen, M.C.; Potapov, P.V.; Moore, R.; Hancher, M.; Turubanova, S.A.; Tyukavina, A.; Thau, D.; Stehman, S.V.; Goetz, S.J.; Loveland, T.R.; et al. High-resolution global maps of 21st-century forest cover change. Science 2013, 342, 850–853. [Google Scholar] [CrossRef] [Green Version]
  35. Sato, M.; Kuriyama, K.; Fujii, H.; Managi, S. Economic valuation of forest ecosystem Service in Japan. Proc. Ins. Stat. Math. 2019, 67, 3–20. [Google Scholar]
  36. Cameron, T.A.; Huppert, D.D. OLS versus ML estimation of non-market resource values with payment card interval data. J. Environ. Econ. Manag. 1989, 17, 230–246. [Google Scholar] [CrossRef]
  37. Covey, J.; Loomes, G.; Bateman, I.J. Valuing risk reductions: Testing for range biases in payment card and random card sorting methods. J. Environ. Plan. Manag. 2007, 50, 467–482. [Google Scholar] [CrossRef] [Green Version]
  38. Rowe, R.D.; Schulze, W.D.; Breffle, W.S. A test for payment card biases. J. Environ. Econ. Manag. 1996, 31, 178–185. [Google Scholar] [CrossRef]
  39. Miller, G.A. The magical number seven, plus or minus two: Some limits on our capacity for processing information. Psychol. Rev. 1956, 63, 81–97. [Google Scholar] [CrossRef] [PubMed] [Green Version]
  40. Kuriyama, K. Chapter 2 Current status and challenges of environmental valuation. In Workshop on Environmental Valuation: Curent Status of Valuation Method; Washida, T., Kuriyama, K., Takeuchi, K., Eds.; Tsukijishokan Inc.: Tokyo, Japan, 1993; pp. 25–45. [Google Scholar]
  41. SCJ. The Report on Valuation of Multifunctionality of Agriculture and Forest Related to Global Environment and Human Life; SCJ: Tokyo, Japan, 2001. [Google Scholar]
  42. Fisher, B.; Turnera, R.K.; Morling, P. Defining and classifying ecosystem services for decision making. Ecologi Ecol. 2009, 68, 643–653. [Google Scholar] [CrossRef] [Green Version]
  43. De Marchi, B.; Funtowicz, S.O.; Lo Cascio, S.; Munda, G. Combining participative and institutional approaches with multicriteria evaluation. An empirical study for water issues in Troina, Sicily. Ecol. Econ. 2000, 34, 267–282. [Google Scholar] [CrossRef]
  44. Ranger, S.; Kenter, J.O.; Bryce, R.; Cumming, G.; Dapling, T.; Lawes, E.; Richardson, P.B. Forming shared values in conservation management: An interpretive deliberative-democratic approach to including community voices. Ecosyst. Serv. 2016, 21, 344–357. [Google Scholar] [CrossRef]
  45. Lin, Y.; Chen, X.; Huang, L.; Zhu, C.; Shahtahmassebi, A.R.; Zhang, J.; Shen, S.; Peng, R.; Deng, J.; Wang, K.; et al. Fine-scale mapping of urban ecosystem service demand in a metropolitan context: A population-income-environmental perspective. Sci. Total Environ. 2021, 781. [Google Scholar] [CrossRef]
  46. Baró, F.; Palomo, I.; Zulian, G.; Vizcaino, P.; Haase, D.; Gómez-Baggethun, E. Mapping ecosystem service capacity, flow and demand for landscape and urban planning: A case study in the Barcelona metropolitan region. Land Use Pol. 2016, 57, 405–417. [Google Scholar] [CrossRef] [Green Version]
  47. Burkhard, B.; Kroll, F.; Nedkov, S.; Müller, F. Mapping ecosystem service supply, demand and budgets. Ecol. Indic. 2012, 21, 17–29. [Google Scholar] [CrossRef]
  48. Remme, R.P.; Edens, B.; Schröter, M.; Hein, L. Monetary accounting of ecosystem services: A test case for Limburg Province, the Netherlands. Ecol. Econ. 2015, 112, 116–128. [Google Scholar] [CrossRef]
  49. Morimoto, J.; Aiba, M.; Furukawa, F.; Mishima, Y.; Yoshimura, N.; Nayak, S.; Takemi, T.; Chihiro, H.; Matsui, T.; Nakamura, F. Risk assessment of forest disturbance by typhoons with heavy precipitation in northern Japan. For. Ecol. Manag. 2021, 479. [Google Scholar] [CrossRef]
  50. Kato, S.; Huang, W. Land use management recommendations for reducing the risk of downstream flooding based on a land use change analysis and the concept of ecosystem-based disaster risk reduction. J. Environ. Manag. 2021, 287, 112341. [Google Scholar] [CrossRef] [PubMed]
  51. Hasegawa, M.; Pulhin, J.M.; Inoue, M. Facing the challenge of social forestry in Japan: The case of reviving harmonious coexistence between forest and people in Okayama Prefecture. Small-Scale For. 2013, 12, 257–275. [Google Scholar] [CrossRef]
Figure 1. Location of the Satetsu-gawa river basin and six SPPs (A to F).
Sustainability 13 11894 g001
Figure 2. Flow of the geographic and economic analysis. Parallelograms indicate data, and the rectangles denote the analysis. Gray-colored parallelograms denote final outputs that are used for the analysis.
Sustainability 13 11894 g002
Figure 3. Example of partial prfile of CE. Respondents are repeatedly asked X times for the question.
Sustainability 13 11894 g003
Figure 4. Affected area of each SPP. (AF) indicate the location of each SPP. Red stripe shows the affected area of each SPP. Light green area shows broadleaf forest, and dark green area shows coniferous forest.
Sustainability 13 11894 g004
Table 1. Data used for the analysis.
ItemType of DataYearSourceReference
Elevation level10 m
mesh
-Website of Geospatial Information Agencyhttps://fgd.gsi.go.jp/download/menu.php, accessed on 12 July 2021
The number of households250 m
mesh
2015Japanese population censushttp://www.stat.go.jp/data/kokusei/2015/kekka.htm, accessed on 12 July 2021
Forest registration dataPolygon2012Provided by Forest Agency and Iwate Prefecture
Location of SPPsPoint2020Website of Electrical Japan INC.http://agora.ex.nii.ac.jp/earthquake/201103-eastjapan/energy/electrical-japan/, accessed on 12 July 2021
Power generation capacity of SPPsStatistics-Website of Electrical Japan INC.http://agora.ex.nii.ac.jp/earthquake/201103-eastjapan/energy/electrical-japan/, accessed on 12 July 2021
Table 2. The area and number of households in the Satetsu-gawa river basin.
Total Area (ha)Forest AreaTotal No. of h.holds
TotalGovernment-OwnedPrivately Owned
TotalConiferBr. LeafTotalConiferBr. Leaf
The whole river basin37,95225,23955943712224,68014,76199197244
Share of forest in total area100.0%66.5%1.5%1.2%0.3%65.0%38.9%26.1%----
Share of each forest type in total forest----100.0%2.2%1.7%0.5%97.8%58.5%39.3%----
Table 3. Deforested and affected areas and the value lost due to the construction of SPPs. The bold figures are the best results of the six SPPs by each indicator.
PlantDeforested AreaAffected AreaLost Value of HCS
Deforested AreaShare in Total Forest AreaRatioAffected AreaNumber of h.hold in the Affected AreaUnit Price per ha per h.holdUnit Price per haTotal Value
Totalof Which Forest Area
(A)(=A/C)(=B/A)(B)(C)(D)(E)(F = D ∗ E)(=F ∗ A)
(ha)(%) (ha)(ha)(Number)(JPY/ha/h.hold)(JPY/ha)(Mil. JPY)
Ind. 1Ind. 3Ind. 4Ind. 2----Ind. 5----Ind. 6Ind. 7
A8.20.6%30925281433767533409,0383.3
B2.70.2%82522021116938533500,2321.3
C1.80.1%1661300715931130533602,6251.1
D1.00.05%3611367218811381533736,4820.7
E1.80.2%11061990980824533439,4360.8
F1.50.3%640985473328533174,9210.3
Table 4. Power generation capacity and related indicators. The bold figures are the best results of the six SPPs by each indicator.
PlantPower Generation CapacityDeforested Area per Unit of Power GenerationAffected Area per Unit of Power GenerationNo. of h.hold Affected per Unit of Power GenerationLost Value per Unit of Power Generation
(MW)(ha/MW)(ha/MW)(Number)(Mil. JPY/MW)
----Ind. 8Ind. 9Ind. 10Ind. 11
A3.02.73842.7255.71.12
B1.81.481223.6521.10.74
C1.51.212004.7753.30.73
D0.91.134080.01534.40.83
E1.11.641809.1749.10.72
F1.11.40895.4298.20.24
Table 5. An overview of the indicators estimated and the order of performance of SPPs assessed by each indicator. Regarding the type of indicator, B, C, and E denote basic, composite, and economic indicators, respectively. In the order of performance, 1 denotes the best performance, and 6 denotes the worst performance.
IndicatorsIndicator TypeTitleOrder of Performance
123456
Best Sustainability 13 11894 i001Worst
1BDeforested areaDFECBA
2BTotal affected areaFEBACD
3CShare of deforested area in total forest in affected areaDCEBFA
4CAffected-deforested area ratioAFBECD
5BNumber of h.holds affectedFAEBCD
6C/EUnit price per hectare of deforested areaFAEBCD
7C/ELost value of HCSFDECBA
8CDeforested area per MW of power generationDCFBEA
9CAffected area per MW of power generationAFBECD
10CNumber of h.holds affected per MW of power generationAFBECD
11C/ELost value per MW of power generationFECBDA
Publisher’s Note: MDPI stays neutral with regard to jurisdictional claims in published maps and institutional affiliations.

