
Precipitation Controls on Soil Biogeochemical and Microbial Community Composition in Rainfed Agricultural Systems in Tropical Drylands

 , , and
Abstract
:1. Introduction
2. Materials and Methods
2.1. Study Sites
2.2. Soil Sampling and Measurements
2.3. Enzyme Analyses
2.4. DNA Extraction and Sequencing
2.5. Data Analysis
3. Results
3.1. Soil pH and Biogeochemical Properties
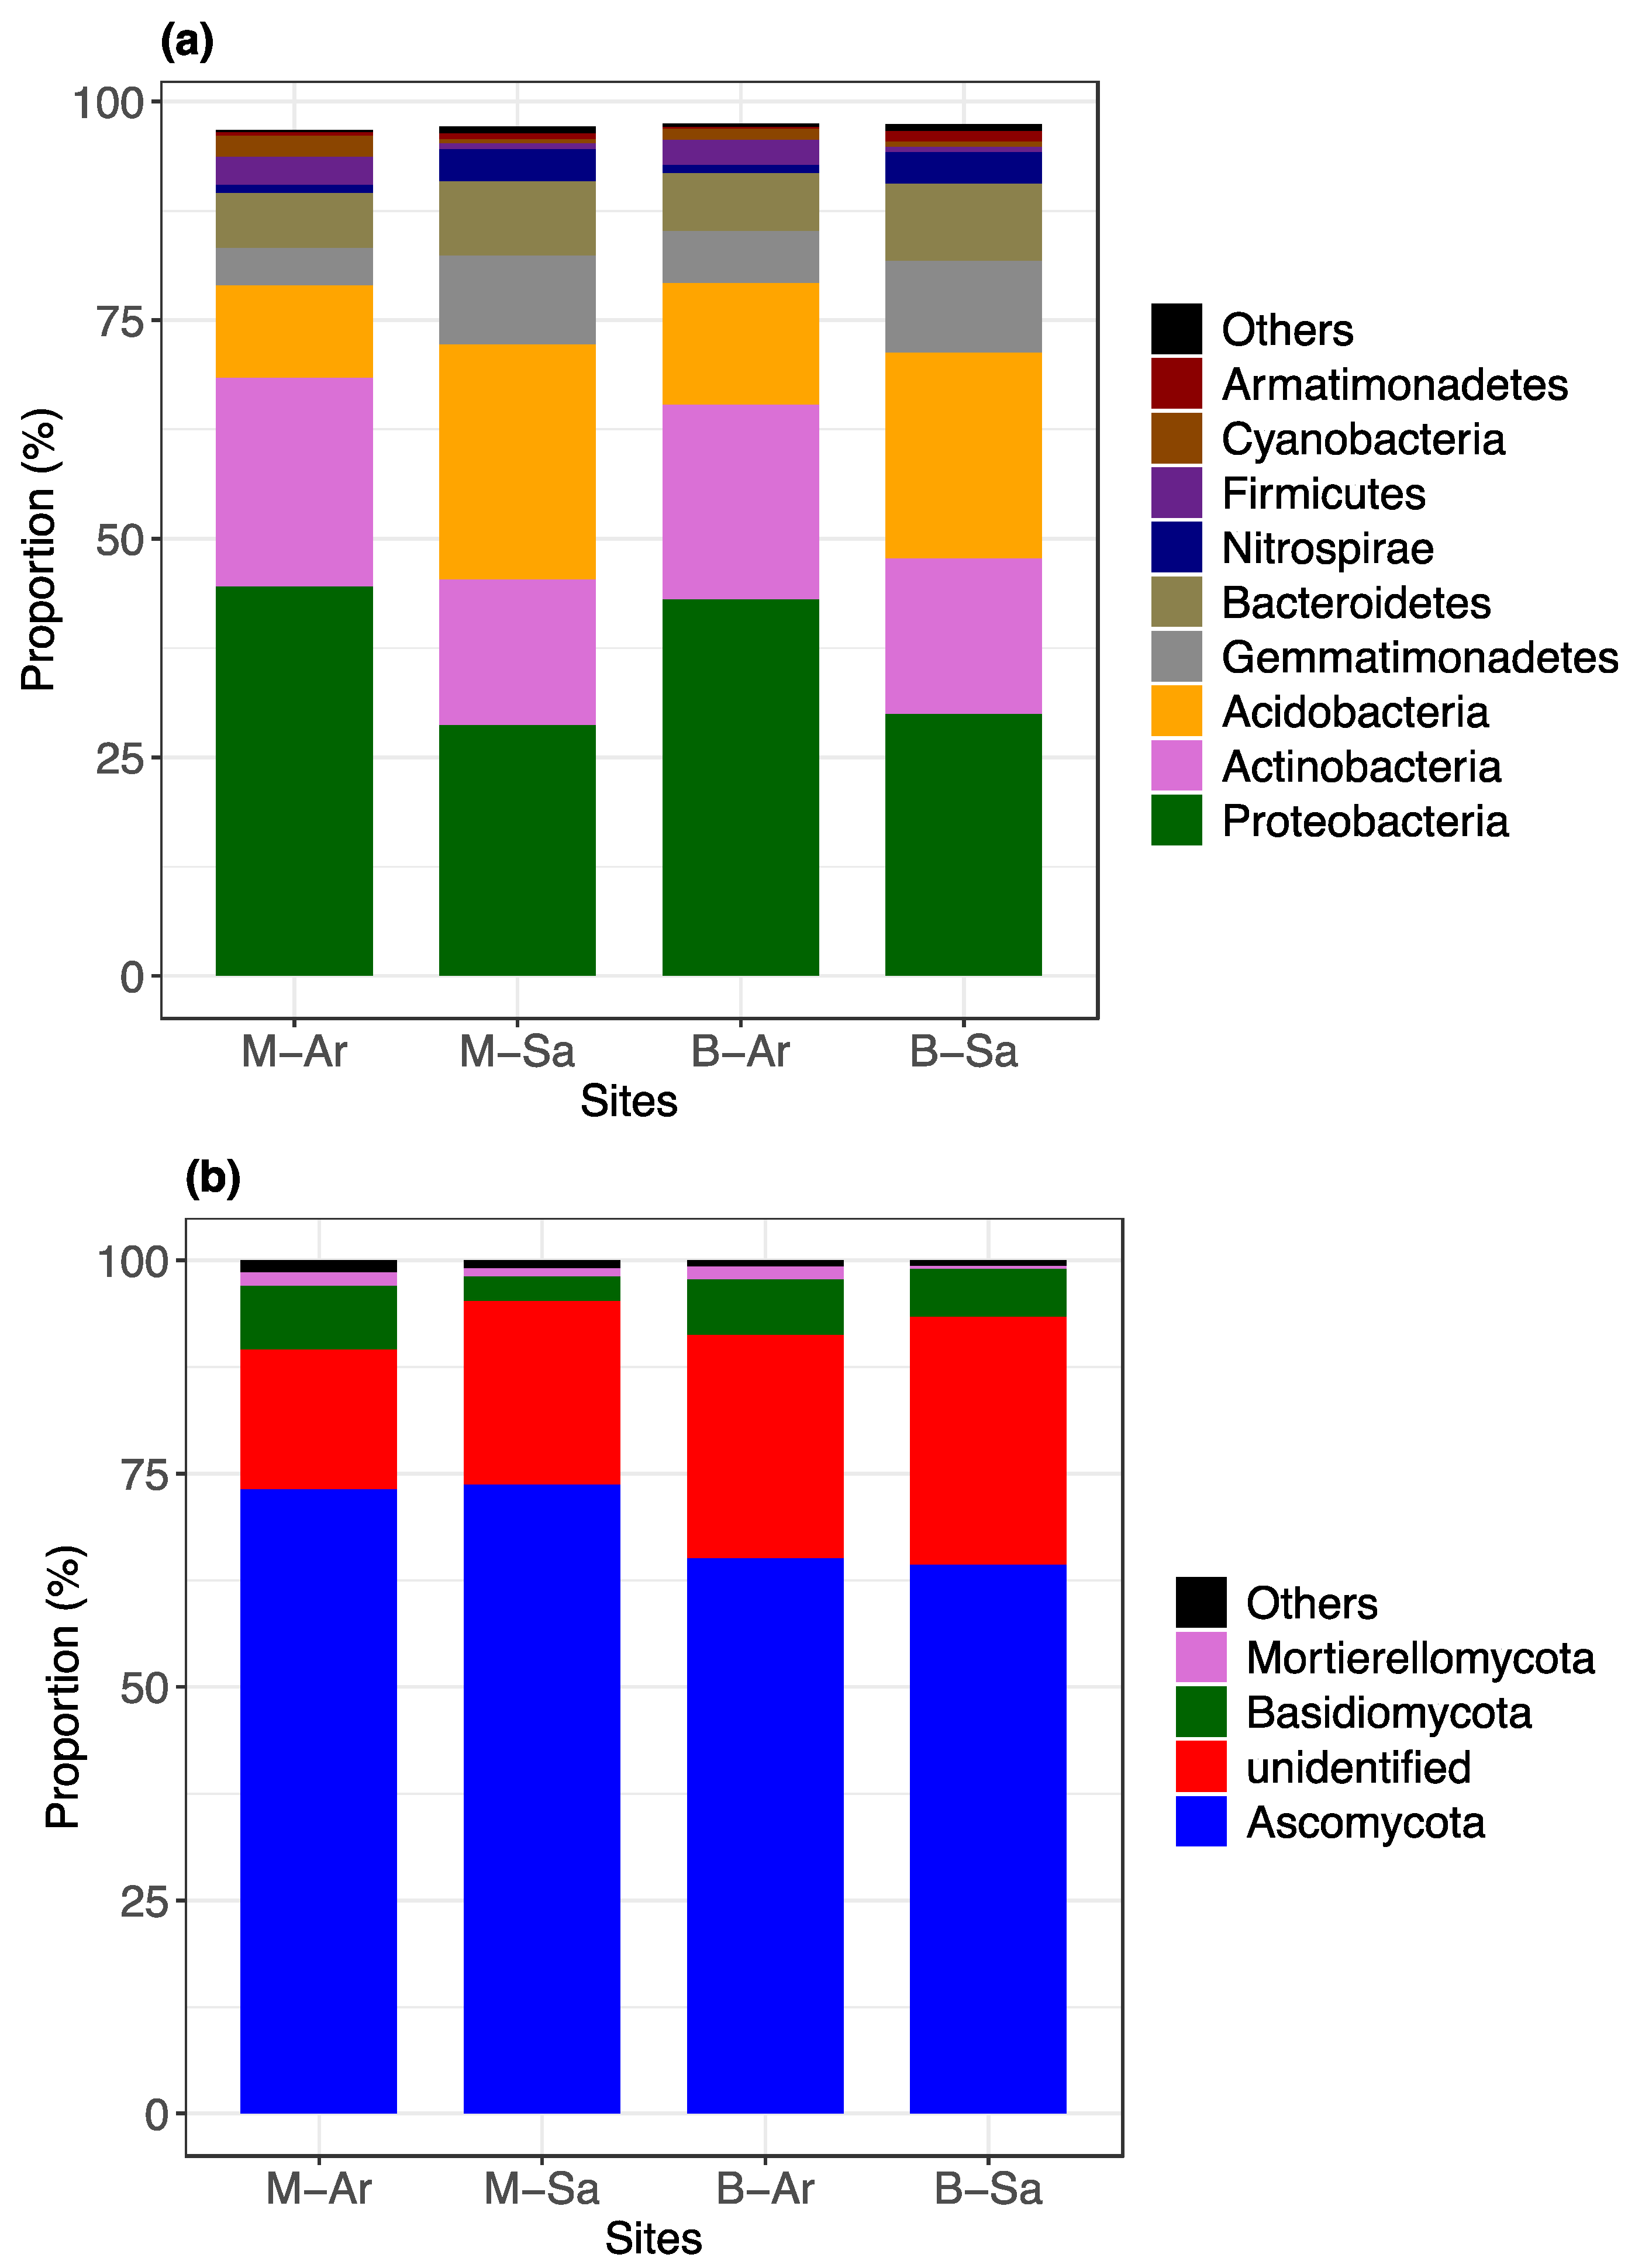
3.2. Soil Microbial Community Composition and Diversity
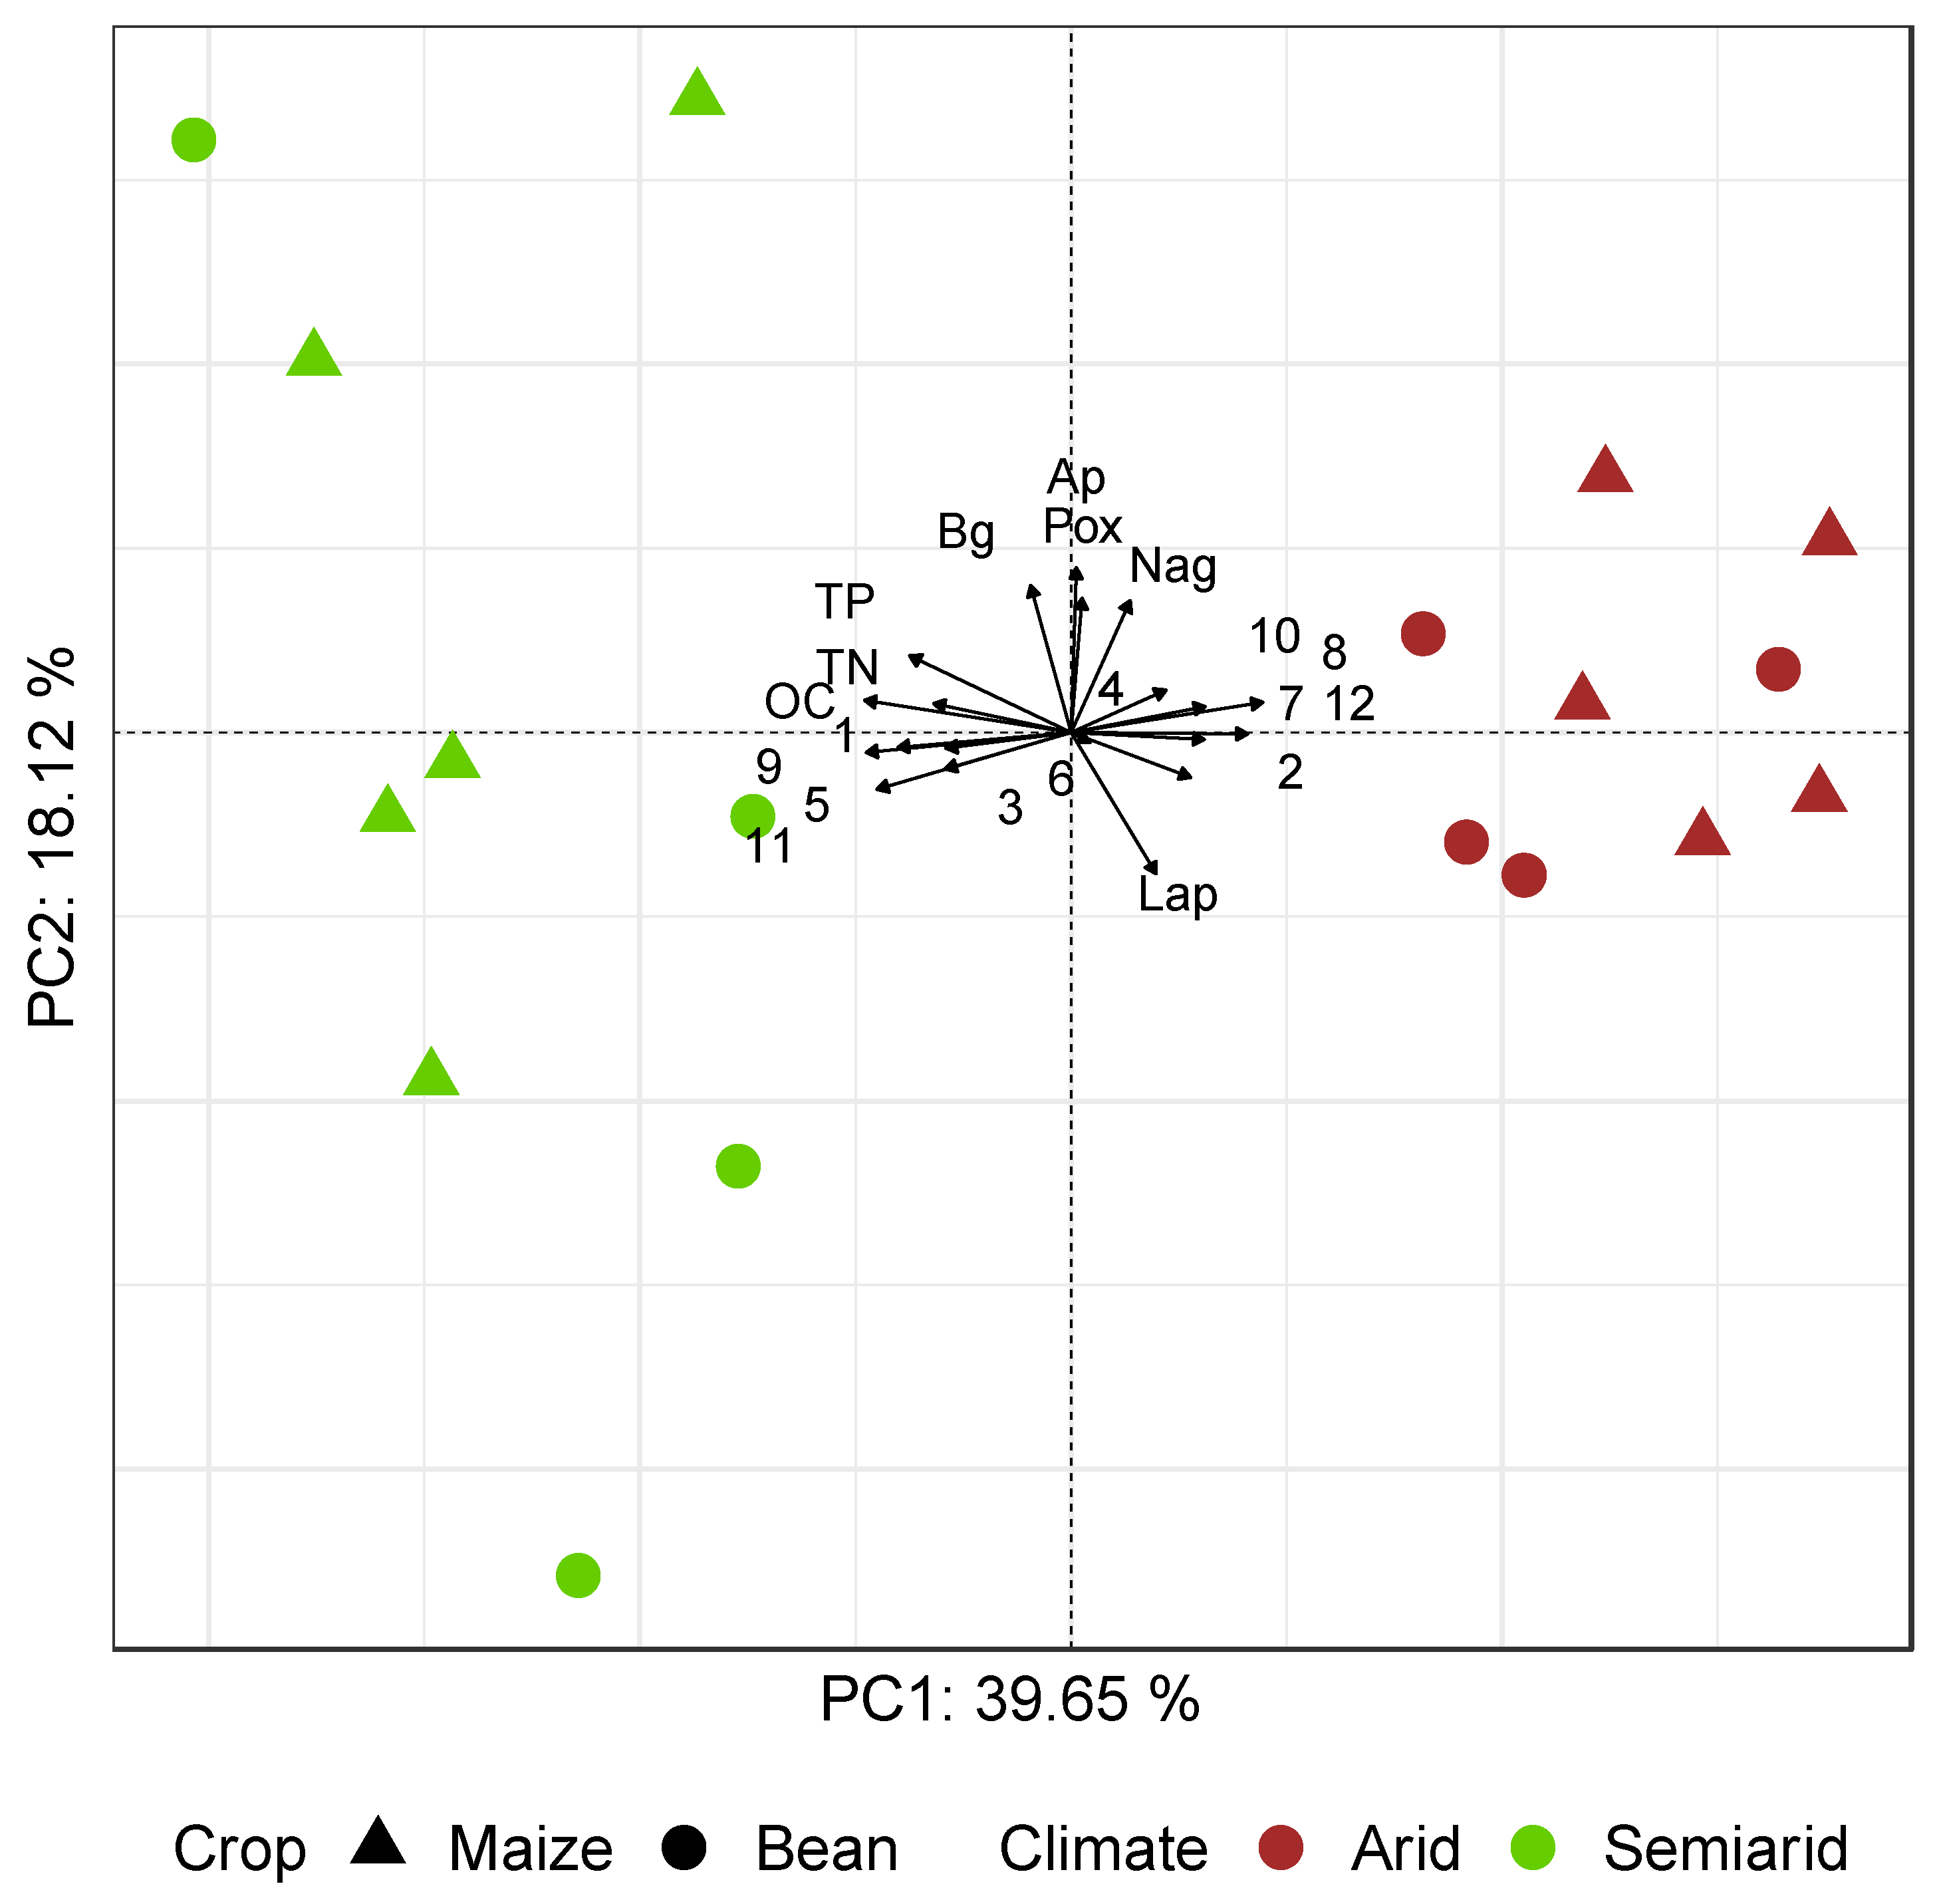
3.3. Multivariate Analysis and Soil Metric Relationships
4. Discussion
4.1. Differences in Soil-Plant Relationships with Changes in Precipitation Regime
4.2. Nutrient Limitation in Agricultural Ecosystems in Tropical Arid Lands
4.3. Soil Biogeochemistry and Microbial Community Composition Are Sensitive to Drought Increase
5. Conclusions
Supplementary Materials
Author Contributions
Funding
Institutional Review Board Statement
Informed Consent Statement
Data Availability Statement
Acknowledgments
Conflicts of Interest
References
- Mendoza-Ponce, A.; Corona-Núñez, R.; Kraxner, F.; Leduc, S.; Patrizio, P. Identifying effects of land use cover changes and climate change on terrestrial ecosystems and carbon stocks in Mexico. Glob. Environ. Chang. 2018, 52, 12–23. [Google Scholar] [CrossRef] [Green Version]
- Hannah, L.; Ikegami, M.; Hole, D.G.; Seo, C.; Buchart, S.H.M.; Peterson, A.T.; Roehrdanz, P.R. Global climate change adaptation priorities for biodiversity and food security. PLoS ONE 2013, 8, e72590. [Google Scholar] [CrossRef]
- Granados, R.; Soria, J.; Cortina, M. Rainfall variability, rainfed agriculture and degree of human marginality in North Guanajuato, Mexico. Singap. J. Trop. Geogr. 2017, 38, 153–166. [Google Scholar] [CrossRef]
- Pontifes, P.A.; García-Meneses, P.M.; Gómez-Aíza, L.; Monterroso-Rivas, A.I.; Caso Chavéz, M. Land use/land cover change and extreme climatic events in the arid and semi-arid ecoregions of Mexico. Atmósfera 2018, 31, 355–372. [Google Scholar] [CrossRef] [Green Version]
- D’Odorico, P.; Bhattachan, A. Hydrologic variability in dryland regions: Impacts on ecosystem dynamics and food security. Philos. Trans. R. Soc. B 2012, 367, 3145–3157. [Google Scholar] [CrossRef] [Green Version]
- Figueroa, D.; Ortega-Fernández, P.; Abbruzzini, T.F.; Rivero-Villar, A.; Galindo, F.; Chávez-Vergara, B.; Etchevers, J.D.; Campo, J. Effects of land use change from native forest to livestock on soil C, N and P dynamics along a rainfall gradient in Mexico. Sustainability 2020, 12, 8656. [Google Scholar] [CrossRef]
- Donatti, C.I.; Harvey, C.A.; Martínez-Rodríguez, M.R.; Vignola, R.; Rodriguez, C.M. Vulnerability of smallholder farmers to climate change in Central America and Mexico: Current knowledge and research gaps. Clim. Develop. 2019, 11, 264–286. [Google Scholar] [CrossRef] [Green Version]
- Bradford, J.B.; Schlaepfer, D.R.; Lauenroth, W.K.; Yackulic, C.B.; Duniway, M.; Hall, S.; Jia, G.; Jamiyansharav, K.; Munson, S.M.; Wilson, S.D.; et al. Future soil moisture and temperature extremes imply expanding suitability for rainfed agriculture in temperate drylands. Sci. Rep. 2017, 7, 1–11. [Google Scholar] [CrossRef] [PubMed] [Green Version]
- Sidibé, Y.; Foudi, S.; Pascual, U.; Termansen, M. Adaptation to climate change in rainfed agriculture in the Global South: Soil biodiversity as natural insurance. Ecol. Econ. 2018, 146, 588–596. [Google Scholar] [CrossRef]
- Wani, S.P.; Rockström, J.; Oweis, T. Rainfed Agriculture: Unlocking the Potential; CAB International: London, UK, 2009. [Google Scholar]
- Acosta-Martínez, V.; Cotton, J.; Gardner, T.; Moore-Kucera, J.; Zak, J.; Wester, D.; Cox, S. Predominant bacterial and fungal assemblages in agricultural soils during a record drought/heat wave and linkages to enzyme activities of biogeochemical cycling. Appl. Soil Ecol. 2014, 84, 69–82. [Google Scholar] [CrossRef]
- Wang, P.; Marsh, E.L.; Kruger, G.; Lorenz, A.; Schachtman, D.P. Belowground microbial communities respond to water deficit and are shaped by decades of maize hybrid breeding. Environ. Microbiol. 2020, 22, 889–904. [Google Scholar] [CrossRef]
- Pugnaire, F.I.; Morillo, J.A.; Peñuelas, J.; Reich, P.B.; Bardegett, R.D.; Gaxiola, A.; Wardle, D.A.; van der Putten, W.H. Climate change effects on plant-soil feedbacks and consequences for biodiversity and functioning of terrestrial ecosystems. Sci. Adv. 2019, 5, eaaz1834. [Google Scholar] [CrossRef] [Green Version]
- Chadwick, R.; Good, P.; Martin, G.; Rowell, D.P. Large rainfall changes consistently projected over substantial areas of tropical land. Nat. Clim. Chang. 2016, 6, 177. [Google Scholar] [CrossRef]
- Elser, J.J.; Bracken, M.E.S.; Cleland, E.E.; Gruner, D.S.; Harpole, W.S.; Hillebrand, H.; Ngai, J.T.; Seabloom, E.W.; Shurin, J.B.; Smith, J.E. Global analysis of nitrogen and phosphorus limitation of primary producers in freshwater, marine and terrestrial ecosystems. Ecol. Lett. 2007, 10, 1135–1142. [Google Scholar] [CrossRef] [PubMed] [Green Version]
- Townsend, A.R.; Cleveland, C.C.; Houlton, B.Z.; Alden, C.B.; White, J.W.C. Multi-element regulation of the tropical forest carbon cycle. Front. Ecol. Environ. 2011, 9, 9–17. [Google Scholar] [CrossRef] [Green Version]
- Hou, E.; Luo, Y.; Kuang, Y.; Chen, C.; Lu, X.; Jiang, L.; Luo, X.; Wen, D. Global meta-analysis shows pervasive phosphorus limitation of aboveground plant production in natural terrestrial ecosystems. Nat. Commun. 2020, 11, 637. [Google Scholar] [CrossRef] [PubMed] [Green Version]
- Campo, J.; Vázquez-Yanes, C. Effects of nutrient limitation on aboveground carbon dynamics during tropical dry forest regeneration in Yucatán, Mexico. Ecosystems 2004, 7, 311–319. [Google Scholar] [CrossRef]
- Condit, R.; Engelbrecht, B.M.J.; Pino, D.; Pérez, R.; Turner, B.L. Species distributions in response to individual soil nutrients and seasonal drought across a community of tropical trees. Proc. Natl. Acad. Sci. USA 2013, 110, 5064–5068. [Google Scholar] [CrossRef] [Green Version]
- Weil, R.R.; Brady, N.C. The Nature and Properties of Soils, 15th ed.; Pearson: Columbus, OH, USA, 2017. [Google Scholar]
- MacDonald, G.K.; Bennett, E.M.; Potter, P.A.; Ramankutty, N. Agronomic phosphorus imbalances across the world’s croplands. Proc. Natl. Acad. Sci. USA 2011, 108, 3086–3091. [Google Scholar] [CrossRef] [Green Version]
- Bardgett, R.D.; van der Putten, W.H. Belowground biodiversity and ecosystem functioning. Nature 2014, 515, 505–511. [Google Scholar] [CrossRef]
- Cleveland, C.C.; Townsend, A.R.; Schmidt, S.K. Phosphorus limitation of microbial processes in moist tropical forests: Evidence from short-term laboratory incubations and field studies. Ecosystems 2002, 5, 680–691. [Google Scholar] [CrossRef]
- Turner, B.L.; Wright, S.J. The response of microbial biomass and hydrolytic enzymes to a decade of nitrogen, phosphorus, and potassium addition in a lowland tropical rain forest. Biogeochemistry 2014, 117, 115–130. [Google Scholar] [CrossRef]
- Ringeval, B.; Augusto, L.; Monod, H.; van Apeldoorn, D.; Bouwman, L.; Yang, X.; Achat, D.L.; Chini, L.P.; Van Oost, K.; Guenet, B.; et al. Phosphorus in agricultural soils: Drivers of its distribution at the global scale. Glob. Chang. Biol. 2017, 23, 3418–3432. [Google Scholar] [CrossRef]
- Margalef, O.; Sardans, J.; Fernández-Martínez, M.; Molowny-Horas, R.; Janssens, I.A.; Ciais, P.; Goll, D.; Richter, A.; Obersteiner, M.; Asensio, D.; et al. Global patterns of phosphatase activity in natural soils. Sci. Rep. 2017, 7, 1337. [Google Scholar] [CrossRef] [Green Version]
- Sterner, R.W.; Elser, J.J. Ecological Stoichiometry: The Biology of Elements from Molecules to the Biosphere; Princeton University Press: Princeton, NJ, USA, 2002. [Google Scholar]
- Demoling, F.; Figueroa, D.; Bååth, E. Comparison of factors limiting bacterial growth in different soils. Soil Biol. Biochem. 2007, 39, 2485–2495. [Google Scholar] [CrossRef]
- Sinsabaugh, R.L.; Hill, B.H.; Follstad Shah, J.J. Ecoenzymatic stoichiometry of microbial organic nutrient acquisition in soil and sediment. Nature 2009, 468, 795–798. [Google Scholar] [CrossRef] [PubMed]
- Cleveland, C.C.; Liptzin, D. C:N:P stoichiometry in soil: Is there a “Redfield ratio” for the microbial biomass? Biogeochemistry 2007, 85, 235–252. [Google Scholar] [CrossRef]
- Schimel, J.P.; Weintraub, M.N. The implications of exoenzyme activity on microbial carbon and nitrogen limitation in soil: A theoretical model. Soil Biol. Biochem. 2003, 35, 549–563. [Google Scholar] [CrossRef]
- FAO. The State of Food Security and Nutrition in the World; Food and Agriculture Organization of the United Nations: Rome, Italy, 2019. [Google Scholar]
- Conde, C.; Estrada, F.; Martínez, B.; Sánchez, O.; Gay, C. Regional climate change scenarios for Mexico. Atmósfera 2011, 24, 125–140. [Google Scholar]
- Middleton, N.; Thomas, S.G. World Atlas of Desertification, 2nd ed.; Arnold: London, UK, 1997. [Google Scholar]
- Mexico’s National Meteorological Service. Long-Term Climatological Data. Available online: https://smn.conagua.gob.mx/es/informacion-climatologica-por-estado?estado=mex (accessed on 7 May 2021).
- SAGARPA. Planeación Agrícola Nacional 2017-2030: Maíz Mexicano; Secretaría de Agricultura, Ganadería, Desarrollo Rural, Pesca y Alimentación: Mexico City, Mexico, 2017.
- SAGARPA. Planeación Agrícola Nacional 2017-2030: Frijol Mexicano; Secretaría de Agricultura, Ganadería, Desarrollo Rural, Pesca y Alimentación: Mexico City, Mexico, 2017.
- Lynch, J.P.; Brown, K.M. Topsoil foraging: An architectural adaptation of plant to low phosphorus availability. Plant Soil 2001, 237, 225–237. [Google Scholar] [CrossRef]
- Jackson, R.B.; Cannadell, J.; Ehleringer, J.R.; Mooney, H.A.; Sala, O.E.; Schulze, E.D. A global analysis of root distributions for terrestrial biomes. Oecologia 1996, 308, 389–411. [Google Scholar] [CrossRef] [PubMed]
- Li, H.; Mollier, A.; Ziadi, N.; Shi, Y.; Parent, L.-E.; Morel, C. Soybean root traits after 24 years of different soil tillage and mineral phosphorus fertilization. Soil Till. Res. 2017, 165, 258–267. [Google Scholar] [CrossRef]
- Jackson, C.R.; Tyler, H.L.; Millar, J.J. Determination of microbial extracellular enzyme activity in waters, soils, and sediment using High Throughput Microplate Assays. J. Vis. Exp. 2013, 80, e50399. [Google Scholar] [CrossRef] [PubMed] [Green Version]
- Moorhead, D.L.; Sinsabaugh, R.L.; Hill, B.H.; Weintraub, M.N. Vector analysis of ecoenzyme activities reveal constraints on coupled C., N and P dynamics. Soil Biol. Biochem. 2016, 93, 1–7. [Google Scholar] [CrossRef]
- Marchesi, J.R.; Sato, T.; Weightman, A.J.; Martin, T.A.; Fry, J.C.; Hiom, S.J.; Wade, W.G. Design and evaluation of useful bacterium-specific PCR primers that amplify genes coding for bacterial 16S rRNA. Appl. Environ. Microbiol. 1998, 64, 765–799. [Google Scholar] [CrossRef] [Green Version]
- Gardes, M.; Bruns, T.D. ITS primers with enhanced specificity for basidiomycetes application to the identification of mycorrhizae and rusts. Mol. Ecol. 1993, 2, 113–118. [Google Scholar] [CrossRef]
- Kazeeroni, E.A.; Al-Sadi, A.M. 454-pyrosequencing reveals variable fungal diversity across farming systems. Front. Plant Sci. 2016, 7, 314. [Google Scholar] [CrossRef]
- Caporaso, J.G.; Kuczynski, J.; Stombaugh, J.; Bittinger, K.; Bushman, F.D.; Costello, E.K.; Fierer, N.; Gonzalez Peña, A.; Goodrich, J.K.; Gordon, J.I.; et al. QIIME allows analysis of high-throughput community sequencing data. Nat. Methods 2010, 7, 335–336. [Google Scholar] [CrossRef] [Green Version]
- Rebollar, E.A.; Sandoval-Castellanos, E.; Roessler, K.; Gaut, B.S.; Alcaraz, L.D.; Benítez, M.; Escalante, A.E. Seasonal changes in a maize-based polyculture of Central Mexico reshape the co-occurrence networks of soil bacterial communities. Front. Microbiol. 2017, 8, 2478. [Google Scholar] [CrossRef] [Green Version]
- Rognes, T.; Flouri, T.; Nichols, B.; Quince, C.; Mahé, F. VSEARCH: A versatile open source tool for metagenomics. Peer J. 2016, 4, e2584. [Google Scholar] [CrossRef]
- DeSantis, T.Z.; Hugenholtz, P.; Larsen, N.; Rojas, M.; Brodie, E.L.; Keller, K.; Huber, T.; Dalevi, D.; Hu, P.; Andersen, G.L. Green genes, a chimera-checked 16S rRNA gene database and workbench compatible with ARB. Appl. Environ. Microbiol. 2006, 72, 5069–5072. [Google Scholar] [CrossRef] [PubMed] [Green Version]
- McMurdie, P.L.; Holmes, S. phyloseq: An R package for reproducible interactive analysis and graphics of microbiome census data. PLoS ONE 2013, 8, e61217. [Google Scholar] [CrossRef] [Green Version]
- McCullagh, P. , Nelder, J.A. Generalized Linear Models, 2nd ed.; Chapman and Hall: London, UK, 1989. [Google Scholar]
- R Core Team. R: A Language and Environment for Statistical Computing; R Foundation for Statistical Computing: Vienna, Austria, 2019; Available online: https://cran.rproject.org/doc/manuals/release/fullrefman.pdf (accessed on 23 June 2021).
- Lenth, R. Emmeans: Estimated Marginal Means, Aka Least-Squares Means. R package Version 1.3.3. 2019. Available online: https://CRAN.R-project.org/package=emmeans (accessed on 23 June 2021).
- Lesk, C.; Rowhani, P.; Ramankutty, N. Influence of extreme weather disasters on global crop production. Nature 2016, 529, 84–87. [Google Scholar] [CrossRef] [PubMed]
- Harrison, M.T.; Tardieu, F.; Dong, Z.; Messina, C.D.; Hammer, G.L. Characterizing drought stress and trait influence on maize yield under current and future conditions. Glob. Chang. Biol. 2014, 20, 867–878. [Google Scholar] [CrossRef] [PubMed]
- Iizumi, T.; Ramankutty, N. Changes in yield variability of major crops for 1981–2010 explained by climate change. Environ. Res. Lett. 2016, 11, 034003. [Google Scholar] [CrossRef]
- Smith, M.R.; Veneklas, E.; Polania, J.; Rao, I.M.; Beebe, S.E.; Merchant, A. Field drought conditions impact yield but not nutritional quality of the seed in common bean (Phaseolus vulgaris L.). PLoS ONE 2019, 14, e0217099. [Google Scholar] [CrossRef] [Green Version]
- Wright, I.J.; Reich, P.B.; Westoby, M. Least-cost input mixtures of water and nitrogen for photosynthesis. Am. Nat. 2003, 161, 98–111. [Google Scholar] [CrossRef]
- Sardans, J.; Grau, O.; Chen, H.Y.H.; Janssens, I.A.; Ciais, P.; Piao, S.; Peñuelas, J. Changes in nutrient concentrations of leaves and roots in response to global change factors. Glob. Chang. Biol. 2017, 23, 3849–3856. [Google Scholar] [CrossRef]
- Gedroc, J.J.; McConnaughay, K.D.M.; Coleman, J.S. Plasticity in root/shoot partitioning: Optimal, ontogenetic, or both? Funct. Ecol. 1996, 10, 44–50. [Google Scholar] [CrossRef]
- Saynes, V.; Hidalgo, C.; Etchevers, J.D.; Campo, J. Soil C and N dynamics in primary and secondary seasonally dry tropical forests in Mexico. Appl. Soil Ecol. 2005, 29, 282–289. [Google Scholar] [CrossRef]
- Sullivan, B.W.; Alvarez-Clare, S.; Castle, S.C.; Porder, S.; Reed, S.C.; Schreeg, L.; Townsend, A.R.; Cleveland, C.C. Assessing nutrient limitation in complex forested ecosystems: Alternatives to large-scale fertilization experiments. Ecology 2014, 95, 668–681. [Google Scholar] [CrossRef] [Green Version]
- Marklein, A.R.; Houlton, B.Z. Nitrogen inputs accelerate phosphorus cycling rates across a wide variety of terrestrial ecosystems. New Phytol. 2011, 193, 696–704. [Google Scholar] [CrossRef]
- Fanin, N.; Hättenschwiler, S.; Schimann, H.; Fromin, N. Interactive effects of C, N and P fertilization on soil microbial community structure and function in an Amazonian rain forest. Funct. Ecol. 2015, 29, 140–150. [Google Scholar] [CrossRef]
- Camenzind, T.; Hättenschwiler, S.; Treseder, K.; Lehmann, A.; Rillig, M.C. Nutrient limitation of soil microbial processes in tropical forests. Ecol. Monogr. 2018, 88, 2–21. [Google Scholar] [CrossRef]
- Giller, K.E. Nitrogen Fixation in Tropical Cropping Systems; CABI: Wallingford, UK, 2001. [Google Scholar]
- Bottomley, P.J.; Myrold, D.D. Biological N inputs. In Soil Microbiology, Ecology, and Biochemistry, 4th ed.; Paul, E.A., Ed.; Academic Press: London, UK, 2015; pp. 447–470. [Google Scholar]
- Kamble, P.N.; Gaikwad, V.B.; Kuchekar, S.R.; Bååth, E. Microbial growth, biomass, community structure and nutrient limitation in high pH and salinity soils from Pravaranagar (India). Eur. J. Soil Biol. 2014, 65, 87–95. [Google Scholar] [CrossRef]
- Yang, P.X.; Ma, L.; Chen, M.H.; Xi, J.Q.; He, F.; Duan, C.-Q.; Mo, M.H.; Fang, D.H.; Duan, Y.Q.; Yang, F.-X. Phosphate solubilizing ability and phylogenetic diversity of bacteria from P-rich soils around Dianchi Lake drainage area of China. Pedosphere 2012, 22, 707–716. [Google Scholar] [CrossRef]
- Goberna, M.; Navarro-Cano, J.A.; Valiente-Banuet, A.; García, C.; Verdú, M. Abiotic stress tolerance and competition-related traits underlie phylogenetic clustering in soil bacterial communities. Ecol. Lett. 2014, 17, 191–201. [Google Scholar] [CrossRef] [PubMed]
- Filippidou, S.; Wunderlin, T.; Junier, T.; Jeanneret, N.; Dorador, C.; Molina, V.; Johnson, D.R.; Junier, P. A combination of extreme environmental conditions favor the prevalence of endospore-forming Firmicutes. Front. Microbiol. 2016, 7, 01707. [Google Scholar] [CrossRef]
- Manzoni, S.; Schimel, J.P.; Porporato, A. Responses of soil microbial communities to water stress: Results from a meta-analysis. Ecology 2012, 93, 930–938. [Google Scholar] [CrossRef] [PubMed]
- Rousk, J.; Bååth, E. Fungal and bacterial growth in soil with plant materials of different C/N ratios. FEMS Microbiol. Ecol. 2007, 62, 258–267. [Google Scholar] [CrossRef] [Green Version]
- Kamble, P.N.; Bååth, E. Carbon and nitrogen amendments lead to differential growth of bacterial and fungal communities in a high-pH soil. Pedosphere 2018, 28, 255–260. [Google Scholar] [CrossRef]
- Wanzek, T.; Keiluweit, M.; Baham, J.; Dragila, M.I.; Fendorf, S.; Fiedler, S.; Nico, P.S.; Kleber, M. Quantifying biogeochemical heterogeneity in soil systems. Geoderma 2018, 324, 89–97. [Google Scholar] [CrossRef] [Green Version]
- Delgado-Baquerizo, M.; Maestre, F.; Gallardo, A.; Bowker, M.A.; Wallenstein, M.D.; Quero, J.L.; Ochoa, V.; Gozalo, B.; García-Gómez, M.; Soliveres, S.; et al. Decoupling of soil nutrient cycles as a function of aridity in global drylands. Nature 2013, 502, 672–676. [Google Scholar] [CrossRef] [PubMed]
- Montecchia, M.S.; Tosi, M.; Soria, M.A.; Vogrig, J.A.; Sydorenko, O.; Correa, O.S. Pyrosequencing reveals changes in soil bacterial communities after conversion of Yungas forests to agriculture. PLoS ONE 2015, 10, e0119426. [Google Scholar] [CrossRef] [PubMed]
- Trivedi, P.; Delgado-Baquerizo, M.; Anderson, I.C.; Singh, B.K. Response of soil properties and microbial communities to agriculture: Implications for primary productivity and soil health indicators. Front. Plant Sci. 2016, 7, 990. [Google Scholar] [CrossRef] [Green Version]
- Wang, S.; Li, T.; Zheng, Z.; Chen, H.Y.H. Soil aggregate-associated bacterial metabolic activity and community structure in different aged tea plantations. Sci. Total Environ. 2019, 654, 1023–1032. [Google Scholar] [CrossRef] [PubMed]
- Su, X.; Su, X.; Yang, S.; Zhou, G.; Ni, M.; Wang, C.; Qin, H.; Zhou, X.; Deng, J. Drought changed soil organic carbon composition and bacterial carbon metabolizing patterns in a subtropical evergreen forest. Sci. Total Environ. 2020, 736, 139568. [Google Scholar] [CrossRef]
- Barnard, R.L.; Osborne, C.A.; Firestone, M.K. Responses of soil bacterial and fungal communities to extreme desiccation and rewetting. ISME J. 2013, 7, 2229–2241. [Google Scholar] [CrossRef] [PubMed]
- Meisner, A.; Bååth, E.; Rousk, J. Microbial growth responses upon rewetting soil dried for four days or one year. Soil Biol. Biochem. 2013, 66, 188–192. [Google Scholar] [CrossRef]
- Meisner, A.; Jacquiod, S.; Snoek, B.L.; ten Hooven, F.C.; van der Putten, W.H. Drought legacy effects on the composition of soil fungal and prokaryote communities. Front. Microbiol. 2018, 9, 294. [Google Scholar] [CrossRef] [Green Version]
- Hueso, S.; Hernández, T.; García, C. Resistance and resilience of the soil microbial biomass to severe drought in semiarid soils: The importance of organic amendments. Appl. Soil Ecol. 2011, 50, 27–36. [Google Scholar] [CrossRef]
- Bouskill, N.J.; Wood, T.E.; Baran, R.; Ye, Z.; Bowen, B.P.; Lim, H.C.; Zhou, J.; van Nostrand, J.D.; Nico, P.; Northen, T.R.; et al. Belowground response to drought in a tropical forest soil. I. Changes in microbial functional potential and metabolism. Front. Microbiol. 2016, 7, 525. [Google Scholar] [CrossRef]
- Fierer, N.; Leff, J.W.; Adams, B.J.; Nielsen, U.N.; Bates, S.T.; Lauber, C.L.; Owens, S.; Gilbert, J.A.; Wall, D.H.; Caporaso, J.G. Cross-biome metagenomic analyses of soil microbial communities and their functional attributes. Proc. Natl. Acad. Sci. USA 2012, 109, 21390–21395. [Google Scholar] [CrossRef] [PubMed] [Green Version]
- Fierer, N.; Bradford, M.A.; Jackson, R.B. Toward an ecological classification of soil bacteria. Ecology 2007, 88, 1354–1364. [Google Scholar] [CrossRef] [PubMed]
- Naylor, D.; Coleman-Derr, D. Drought stress and root-associated bacterial communities. Front. Plant Sci. 2018, 8, 2223. [Google Scholar] [CrossRef]
- Austin, A.T.; Yahdjian, L.; Stark, J.M.; Belnap, J.; Porporato, A.; Norton, U.; Ravetta, D.A.; Schaeffer, S.M. Water pulses and biogeochemical cycles in arid and semiarid ecosystems. Oecologia 2004, 141, 221–235. [Google Scholar] [CrossRef]
- Potts, M. Desiccation tolerance of prokaryotes. Microbiol. Rev. 1994, 58, 755–805. [Google Scholar] [CrossRef] [PubMed]
- Felsmann, K.; Baudis, M.; Gimbel, K.; Kayler, Z.E.; Ellerbrock, R.; Bruehlheide, H.; Bruckhoff, J.; Welk, E.; Puhlmann, H.; Weiler, M. Soil bacterial community structure responses to precipitation reduction and forest management in forest ecosystems across Germany. PLoS ONE 2015, 10, e0122539. [Google Scholar]
- Castro, H.F.; Classen, A.T.; Austin, E.E.; Norby, R.J.; Schadt, C.W. Soil microbial community responses to multiple experimental climate change drivers. Appl. Environ. Microbiol. 2010, 76, 999–1007. [Google Scholar] [CrossRef] [Green Version]
- Neilson, J.W.; Califf, K.; Cardona, C.; Copeland, A.; van Treuren, W.; Josephson, K.L.; Knight, R.; Gilbert, J.A.; Quade, J.; Caporaso, J.G. Significant impacts of increasing aridity on the arid soil microbiome. mSystems 2017, 2, e00195-16. [Google Scholar] [CrossRef] [Green Version]
- Philippot, L.; Andersson, S.G.E.; Battin, T.J.; Prosser, J.I.; Schimel, J.P.; Whitman, W.B.; Hallin, S. The ecological coherence of high bacterial taxonomic ranks. Nat. Rev. Microbiol. 2010, 8, 523–529. [Google Scholar] [CrossRef]
- Lynch, M.D.; Neufeld, J.D. Ecology and exploration of the rare biosphere. Nat. Rev. Microbiol. 2015, 13, 217–229. [Google Scholar] [CrossRef]
- Pedrós-Alió, C. The rare bacteria biosphere. Annu. Rev. Mar. Sci. 2012, 4, 449–466. [Google Scholar] [CrossRef] [PubMed] [Green Version]
- Kurm, V.; van der Putten, W.H.; de Boer, W.; Naus-Wiezer, S.; Hol, W.H.G. Low abundant soil bacterial can be metabolically versatile and fast growing. Ecology 2017, 98, 555–564. [Google Scholar] [CrossRef] [Green Version]
- Soliveres, S.; Manning, P.; Prati, D.; Gossner, M.M.; Alt, F.; Arndt, H.; Baumgartner, V.; Binkenstein, J.; Birkhofer, K.; Blaser, S.; et al. Locally rare species influence grassland ecosystem multifunctionality. Philos. Trans. R. Soc. B 2016, 371, 20150269. [Google Scholar] [CrossRef]
- Campo, J.; Merino, A. Variations in soil carbon sequestration and their determinants along a precipitation gradient in seasonally dry tropical forests. Glob. Chang. Biol. 2016, 22, 1942–1956. [Google Scholar] [CrossRef] [PubMed]
- Paul, E.A. Soil Microbiology, Ecology, and Biochemistry, 4th ed.; Academic Press: London, UK, 2015. [Google Scholar]
- Taylor, D.L.; Sinsabaugh, R.L. The soil fungi: Occurrence, phylogeny, and ecology. In Soil Microbiology, Ecology, and Biochemistry, 4th ed.; Paul, E.A., Ed.; Academic Press: London, UK, 2015; pp. 77–109. [Google Scholar]
- Da Silva, L.L.; Veloso, T.G.R.; Manhaes, J.H.C.; da Silva, C.C.; de Queiroz, M.V. The plant organs and rhizosphere determine the common bean mycobiome. Braz. J. Microbiol. 2020, 51, 765–772. [Google Scholar] [CrossRef] [PubMed]

| Site Characteristics | Arid Region | Semiarid Region |
|---|---|---|
| Climate † | ||
| Mean annual precipitation (MAP, mm yr−1) | 416 | 554 |
| Mean annual temperature (MAT, °C) | 18.1 | 18.9 |
| Potential evapotranspiration (PE, mm yr−1) | 2350 | 1832 |
| Aridity index (MAP/PE ratio) | 0.18 | 0.30 |
| Mean monthly precipitation during the growing season of maize (mm month−1) | 52 ± 10 | 72 ± 20 |
| Mean monthly precipitation during the growing season of common bean (mm month−1) | 65 ± 8 | 94 ± 12 |
| Mean monthly temperature during the growing season of maize (°C month−1) | 19.4 ± 1.0 | 20.1 ± 1.2 |
| Mean monthly temperature during the growing season of common bean (°C month−1) | 20.3 ± 0.5 | 20.9 ± 0.4 |
| Crop characteristics ‡ | ||
| Grain yield (Mg ha−1) | ||
| Maize | 1.17 ± 0.17 | 1.50 ± 0.50 |
| Common bean | 0.28 ± 0.06 | 0.33 ± 0.22 |
| Root biomass (g plant−1) | ||
| Maize | 24.7 ± 3.3 | 24.9 ± 2.9 |
| Common bean | 1.54 ± 0.2 | 0.77 ± 0.16 |
| Leaf N (mg g−1) | ||
| Maize | 17.9 ± 2.4 | 22.8 ± 0.8 |
| Common bean | 39.5 ± 1.5 | 40.4 ± 1.9 |
| Leaf P (mg g−1) | ||
| Maize | 2.3 ± 0.5 | 1.8 ± 0.1 |
| Common bean | 2.7 ± 0.2 | 2.1 ± 0.1 |
| Root N (mg g−1) | ||
| Maize | 6.6 ± 0.8 | 9.3 ± 0.2 |
| Common bean | 16.8 ± 2.2 | 15.6 ± 1.2 |
| Root P (mg g−1) | ||
| Maize | 0.5 ± 0.1 | 0.5 ± 0.04 |
| Common bean | 1.9 ± 0.2 | 1.2 ± 0.2 |
| Crop | Region | Organic C | Total N | Total P |
|---|---|---|---|---|
| (mg g−1) | (µg g−1) | |||
| Maize | Arid | 11.70 Ba ± 0.52 | 1.65 Aa ± 0.36 | 340 Aa ± 73 |
| Semiarid | 22.23 Aa ± 0.75 | 2.27 Aa ± 0.57 | 415 Aa ± 93 | |
| Common bean | Arid | 11.48 Ba ± 0.61 | 1.99 Ba ± 0.40 | 330 Aa ± 81 |
| Semiarid | 19.37 Ab ± 0.91 | 2.97 Aa ± 0.71 | 396 Aa ± 98 |
| Crop | Region | BG | POX | LAP | NAG | AP |
|---|---|---|---|---|---|---|
| (µmol pNP) | (µmol tyrosine) | (µmol pNP g soil−1 hour−1) | (g soil−1 hour−1) | (g soil−1 hour−1) | ||
| Maize | Arid | 0.339 Aa ± 0.014 | 0.295 Aa ± 0.021 | 0.168 Aa ± 0.008 | 0.158 Aa ± 0.014 | 0.679 Aa ± 0.077 |
| Semiarid | 0.373 Aa ± 0.019 | 0.318 Aa ± 0.022 | 0.139 Aa ± 0.009 | 0.129 Aa ± 0.017 | 0.701 Aa ± 0.074 | |
| Common bean | Arid | 0.342 Aa ± 0.017 | 0.322 Aa ± 0.025 | 0.214 Aa ± 0.009 | 0.138 Aa ± 0.015 | 0.638 Aa ± 0.050 |
| Semiarid | 0.251 Aa ± 0.021 | 0.237 Aa ± 0.026 | 0.184 Aa ± 0.011 | 0.126 Aa ± 0.017 | 0.580 Aa ± 0.078 |
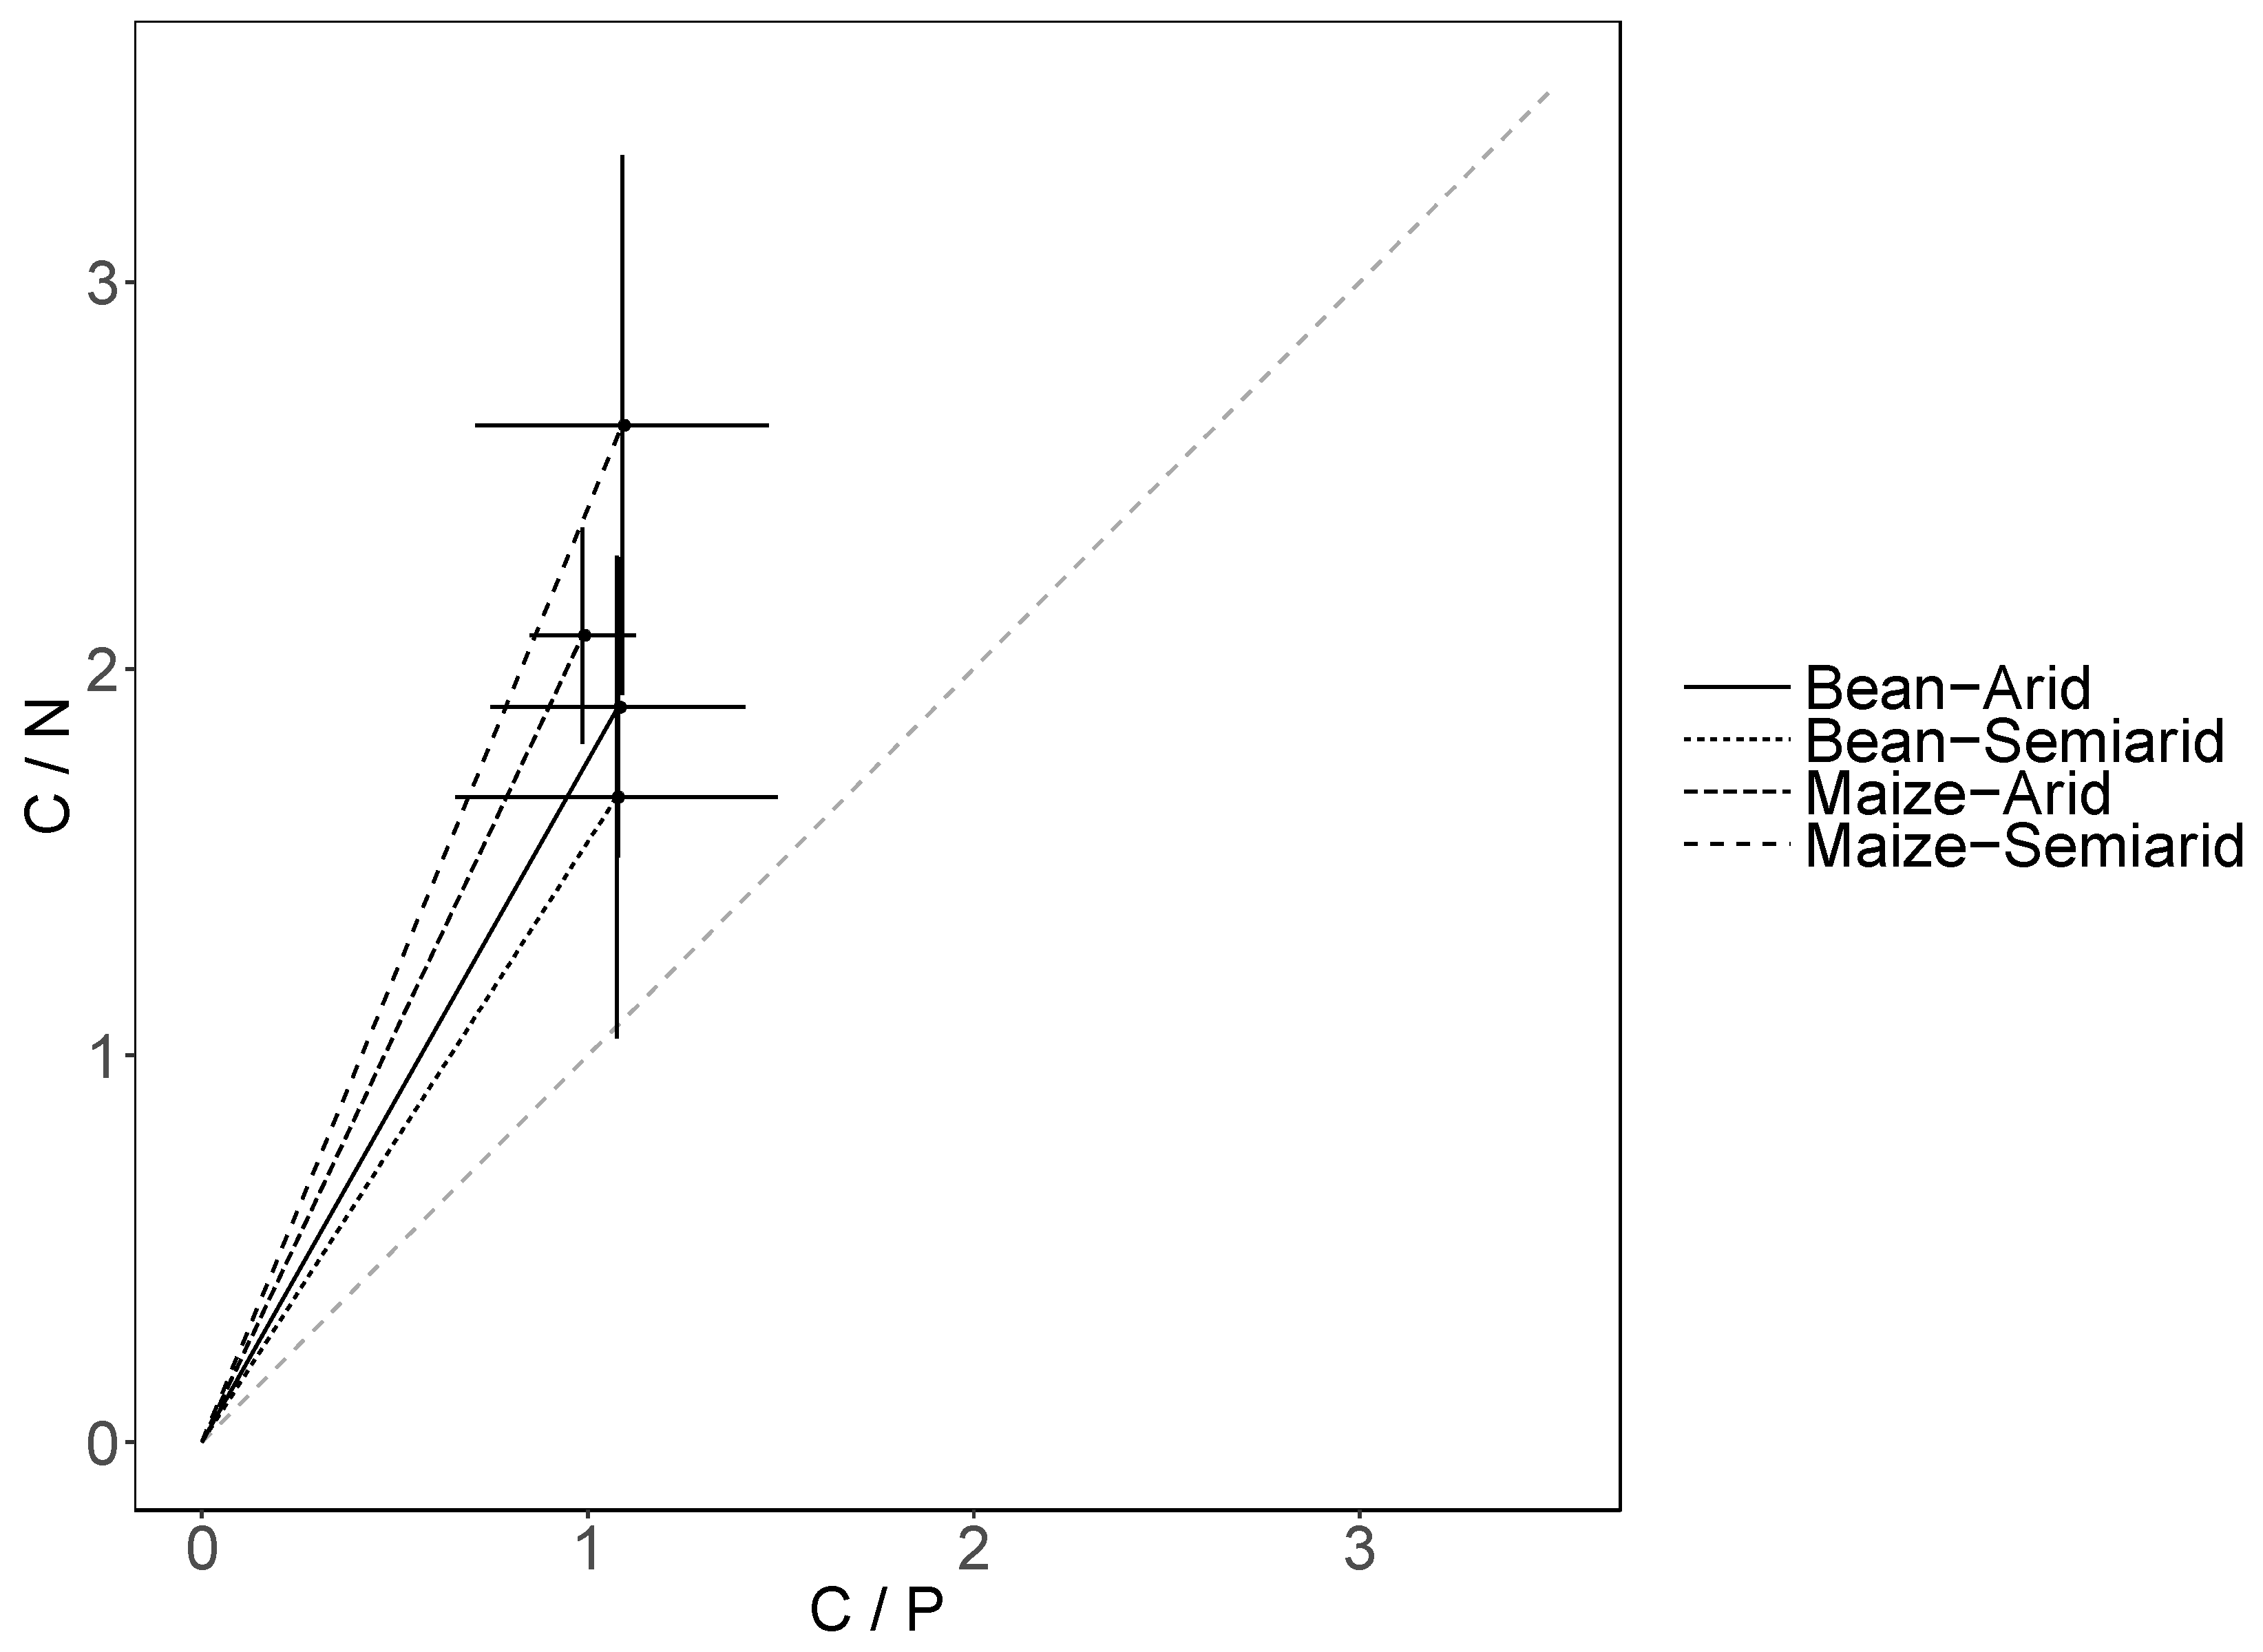
| Crop | Region | (BG + POX): (LAP + NAG) | (BG + POX): AP | (LAP + NAG): AP |
|---|---|---|---|---|
| Maize | Arid | 1.99 Ba ± 0.11 | 0.94 Aa ± 0.11 | 0.43 Aa ± 0.03 |
| Semiarid | 2.69 Aa ± 0.14 | 1.11 Aa ± 0.12 | 0.49 Aa ± 0.07 | |
| Common bean | Arid | 1.93 Aa ± 0.16 | 1.18 Aa ± 0.12 | 0.63 Aa ± 0.05 |
| Semiarid | 1.66 Aa ± 0.17 | 1.12 Aa ± 0.14 | 0.83 Aa ± 0.10 |
| Crop | Region | Shannon Index (H) | Simpson Index (D) | ||
|---|---|---|---|---|---|
| Bacteria | Fungi | Bacteria | Fungi | ||
| Maize | Arid | 5.44 Aa ± 0.04 | 4.19 Aa ± 0.12 | 0.991 Aa ± 0.0005 | 0.936 Aa ± 0.0098 |
| Semiarid | 4.97 Bb ± 0.04 | 4.11 Aa ± 0.12 | 0.987 Bb ± 0.0006 | 0.948 Aa ± 0.0089 | |
| Common bean | Arid | 5.51 Aa ± 0.05 | 4.31 Aa ± 0.13 | 0.992 Aa ± 0.0005 | 0.941 Aa ± 0.0106 |
| Semiarid | 5.27 Ba ± 0.05 | 3.84 Aa ± 0.13 | 0.990 Aa ± 0.0006 | 0.923 Aa ± 0.0111 | |
| PC1 | PC2 | PC3 | |
|---|---|---|---|
| Eigenvalue | 7.929 | 3.625 | 2.546 |
| Cumulative percent variation | 39.65 | 57.77 | 70.5 |
| Eigenvectors | |||
| Soil organic carbon (OC) | −0.96 *** | 0.17 | −0.02 |
| Soil total nitrogen (TN) | −0.64 ** | 0.16 | −0.12 |
| Soil total phosphorus (TP) | −0.75 *** | 0.42 | 0.15 |
| ß-1,4-glucosidase (Bg) | −0.19 | 0.80 *** | 0.15 |
| Polyphenol oxidase (Pox) | 0.05 | 0.73 *** | 0.21 |
| Leucine aminopeptidase (Lap) | 0.40 | −0.77 *** | −0.19 |
| ß-1,4-N-acetylglucosaminidase (Nag) | 0.28 | 0.72 *** | −0.05 |
| Acid phosphatase (Ap) | 0.03 | 0.89 *** | 0.03 |
| Acidobacteria (1) | −0.95 *** | −0.11 | 0.02 |
| Actinobacteria (2) | 0.82 *** | 0.01 | 0.34 |
| Armatimonadetes (3) | −0.58 * | −0.20 | 0.47 |
| Ascomycota (4) | 0.09 | −0.06 | −0.60 ** |
| Bacteroidetes (5) | −0.58 * | −0.08 | −0.36 |
| Basidiomycota (6) | 0.56 * | −0.25 | 0.55 * |
| Cyanobacteria (7) | 0.62 ** | −0.04 | 0.48 * |
| Firmicutes (8) | 0.62 ** | 0.14 | −0.64 ** |
| Gemmatimonadetes (9) | −0.80 *** | −0.08 | −0.16 |
| Mortierellomycota (10) | 0.44 | 0.23 | −079 *** |
| Nitrospirae (11) | −0.90 *** | −0.31 | −0.01 |
| Proteobacteria (12) | 0.89 *** | 0.16 | −0.02 |
Publisher’s Note: MDPI stays neutral with regard to jurisdictional claims in published maps and institutional affiliations. |
© 2021 by the authors. Licensee MDPI, Basel, Switzerland. This article is an open access article distributed under the terms and conditions of the Creative Commons Attribution (CC BY) license (https://creativecommons.org/licenses/by/4.0/).
Share and Cite
Abbruzzini, T.F.; Avitia, M.; Carrasco-Espinosa, K.; Peña, V.; Barrón-Sandoval, A.; Salazar Cabrera, U.I.; Cruz-Ortega, R.; Benítez, M.; Escalante, A.E.; Rosell, J.A.; et al. Precipitation Controls on Soil Biogeochemical and Microbial Community Composition in Rainfed Agricultural Systems in Tropical Drylands. Sustainability 2021, 13, 11848. https://doi.org/10.3390/su132111848
Abbruzzini TF, Avitia M, Carrasco-Espinosa K, Peña V, Barrón-Sandoval A, Salazar Cabrera UI, Cruz-Ortega R, Benítez M, Escalante AE, Rosell JA, et al. Precipitation Controls on Soil Biogeochemical and Microbial Community Composition in Rainfed Agricultural Systems in Tropical Drylands. Sustainability. 2021; 13(21):11848. https://doi.org/10.3390/su132111848
Chicago/Turabian StyleAbbruzzini, Thalita F., Morena Avitia, Karen Carrasco-Espinosa, Víctor Peña, Alberto Barrón-Sandoval, Ulises Isaac Salazar Cabrera, Rocío Cruz-Ortega, Mariana Benítez, Ana E. Escalante, Julieta A. Rosell, and et al. 2021. "Precipitation Controls on Soil Biogeochemical and Microbial Community Composition in Rainfed Agricultural Systems in Tropical Drylands" Sustainability 13, no. 21: 11848. https://doi.org/10.3390/su132111848
APA StyleAbbruzzini, T. F., Avitia, M., Carrasco-Espinosa, K., Peña, V., Barrón-Sandoval, A., Salazar Cabrera, U. I., Cruz-Ortega, R., Benítez, M., Escalante, A. E., Rosell, J. A., Wegier, A., & Campo, J. (2021). Precipitation Controls on Soil Biogeochemical and Microbial Community Composition in Rainfed Agricultural Systems in Tropical Drylands. Sustainability, 13(21), 11848. https://doi.org/10.3390/su132111848