Abstract
Although renewable energy investments in developing and emerging economies play a crucial role in accelerating the clean energy transition, investments remain limited. Building on previous research, this study takes a unique approach by analyzing determinants of clean energy investments from investors from one country, the United States, which represents the largest single source of investments. Based on panel data sourced from Bloomberg New Energy Finance (BNEF)’s Climatescope, we analyzed renewable energy investments by investors from the United States between 2008 and 2019. The analysis included four factors (i.e., economic, socio-environmental, political, and proactivity) and covered 61 emerging/developing countries. Our results suggest that the most significant factor that determines renewable energy investment by investors from the United States is commercial ties between the investing and recipient country. Our findings also demonstrate the importance of a strong legal system and clean energy promotion mechanisms, such as feed-in tariffs, in recipient countries. When breaking down investment flows, the effects of different economic factors may vary, depending on whether the renewable technology is solar or wind, which further highlights the importance of understanding determinants of renewable energy investments.
1. Introduction
In line with international agreements, such as the Kyoto Protocol and the more recent Paris Agreement, many countries have been increasingly addressing the need to reduce greenhouse gas emissions and, as a result, accelerating the transition to clean energy production. While the Kyoto Protocol is focused on economically advanced countries and the the development of legally binding emissions targets, the Paris Agreement encompasses contributions to hazardous emissions reductions for developed, emerging and developing countries, and the subsequent reporting on those contributions [1]. Not only does the agreement serve as a voice for less economically developed members of the international community in negotiating climate problems, but it has also become a mechanism to promote and enhance technology development, comply with provisions, and support transparency among the least developed countries (LCDs) [2]. Moreover, emerging markets continue to be attractive targets for big investors, with renewable energy (RE) company portfolios in developing countries having been found to generate close to average market risk [3]. As such, greater attention is being paid to a wider spectrum of potential investments that target global warming, thus stimulating global financing for the low-carbon energy transition.
When it comes to RE investment, studies have explored the contribution of renewables to the energy mix [4] and renewable energy capacity [5]. Importantly, much research has concentrated on financial flows and investments in renewables [3,6,7,8,9,10,11,12]. This has also included investment in renewables through clean energy green bond proceeds and allocations, and identifying factors that influence such investments [13,14].
At the same time, RE investment research in emerging and developing markets remains understudied despite the growing significance of this group of countries. Part of this may be due to the lack of data for RE investments in emerging/developing markets coupled with incomplete data for social, environmental, economic and political variables. In addition, there are few studies that analyze two-way relationships between countries, such as trade flows. Because commercial ties may be critical in making investment decisions, elucidating specific criteria that investor countries consider when investing in emerging markets would represent a meaningful contribution.
To fill this gap in the academic literature, this paper builds on Ragosa and Warren’s [10] framework (which focused on renewables investments in developing countries) by further investigating renewables investments in emerging economies. To overcome data constraints, this paper utilizes investment data from a relatively new database, Bloomberg New Energy Finance (BNEF)’s Climatescope. The contributions of this paper are three-fold. First, this paper focuses on investors from one investing country, the United States, which accounts for the largest amount of RE investments in emerging/developing countries. Second, this paper expands the set of independent variables for the analysis. All factors are separated into rational groups with economic, socio-environmental, political and renewable potential characteristics. Third, this paper disentangles investments by technology (particularly solar and wind) and not by investor type—the latter of which is prevalent in previous studies.
In the following sections, this paper will provide an overview of (1) the key literature; (2) data and methods; (3) analysis and discussion; and (4) concluding remarks.
2. Literature Review
The global energy transition requires substantial investment; recent evidence shows that an increase in funds channeled toward the most popular renewable technologies (such as wind and solar) has resulted in a sharp decline in generation costs [15]. At the same time, renewable energy investments in less developed markets remain limited, and we see evidence of a particularly large investment gap in sustainable energy [16]. As international investments in renewable energy technologies in emerging/developing countries play a crucial role when it comes to making progress on global commitments, such as the Paris Agreement, this suggests that the poorest countries are struggling to contribute to and reap the benefits of this energy transition [17].
To this end, it is critical to identify factors that catalyze financial flows to support this transition. In other words, what are the determinants of renewable energy investments—particularly for less economically developed economies? In general, prior research has focused on four major areas: (1) economic, (2) socio-environmental, (3) policy-related, and (4) proactivity-related factors. First, economic factors feature predominantly in RE investment research. Studies have paid particular attention to GDP growth, GDP per capita and inflation [18]. In addition to GDP figures, Ragosa and Warren [10] found that domestic credit to the private sector as a percentage of GDP has an impact on international investing in renewables. While the study focused on renewables investments in developing countries, the research excluded public investments from the analysis—a division that, according to some scholars [19], may be unclear.
Second, climate change problems were linked with socio-environmental factors in previous literature. This includes an analysis by Liu et al. [5], which found linkages between carbon dioxide emissions and installed renewables capacity in 29 countries between 2000 and 2015. Similarly, in benchmarking research by Marques et al. [20], Aguirre and Ibikunle [4] found that CO2 emissions levels were significant indicators of renewables deployment. Furthermore, Ragosa and Warren [10] argued that natural resource rents (% of GDP) as a proxy for the competitive environment attracted foreign investments in sustainable energy in developing countries.
Third, policy instruments that serve as a mechanism for the transition to green technology were also identified as potential determinants of investment. In one report, a policy framework to support the enhancement of green investments included key elements, such as setting government objectives toward green transition, reforming the market policy and developing suitable investment conditions, reinforcing the financial system, accumulating resources and technical capacity, and promoting sustainable businesses and consumer awareness of green technologies [21]. Moreover, to facilitate renewables investments, countries have been encouraged to improve the domestic investment environment by implementing regulatory incentives, licensing sustainable energy projects, creating a fair tax system for low-carbon emissions, and creating reasonable pricing policies [22].
Additional studies that analyze green bond proceed allocations found that economic policy support and climate commitments of the recipient country can address the global GHG emission problem by financing renewable energy projects with green bonds [13,14]. In analyzing policy risks in renewables investment, Gatzert and Vogl [6] investigated factors such as feed-in tariffs, energy price risk, resource risk, and inflation risk and found that policy risks can greatly influence the risk and return on investments, while cross-country investments have considerably lower risk and are more attractive. Wall et al. [12] also found that feed-in tariffs were one of the most important political factors to attract foreign investments in low-carbon energy projects, with fiscal measures and tax incentives having a positive effect on the amount of foreign investments (particularly for solar technology). Moreover, emerging countries may be able to attract foreign direct investment by calculating the political risk and the value of long-term RE investments [11].
Fourth, studies have analyzed a country’s proactivity and political climate in implementing policies for promoting sustainable energy and participation in international organizations targeting climate change. Among these factors are the implementation and usage of feed-in tariffs [10], commitment to renewable energy [4] and the Kyoto Protocol policy implementation after 2005 [5]. Ragosa and Waren [10] found that only feed-in-tariffs (FIT) yielded significant results among policy instruments in their regression model, with the implementation of FIT boosting investments by an average of USD 39 million. Furthermore, Aguirre and Ibikunle [4] found that continuous commitments positively influenced the growth of renewable energy contributions to the overall country-level energy supply. Lastly, Liu et al. [5] suggested that there was a significant increase in the installed capacity of renewable energy resources among Kyoto signatories, the OECD and EU countries, after the implementation of the Kyoto Protocol in 2005. Taken together, these findings highlight the potential importance of a country’s proactivity and political climate in attracting RE investments.
With regards to the target of investigation, although several studies have analyzed a large number of investor countries to investigate financial flows in renewables projects [9,10,13,23]; a few have focused on cross-country investments in sustainable energy for just one country. This includes the case of Chinese foreign investments in renewables in the 17 EU countries [7,8]. According to this research, the EU countries with more developed institutional and strong political environments are the most attractive for Chinese sales and services subsidiaries, while R&D investments from China usually go to larger European countries with a strong rule of law. Results suggest that political stability, corruption control and low trade barriers are significant factors for Chinese manufacturing investments in sustainable technology.
Based on this review of the literature—particularly the four determinants identified in the academic discourse and the usefulness of single-country studies—the following section presents data and methods that will be used in this study. Specifically, the research design extends Ragosa and Warren’s [10] analysis by including emerging economies as targets of RE investment and focuses on the RE investments by investors from the United States, the biggest source of investments in RE in emerging/developing countries.
3. Research Design
3.1. Hypothesis Development
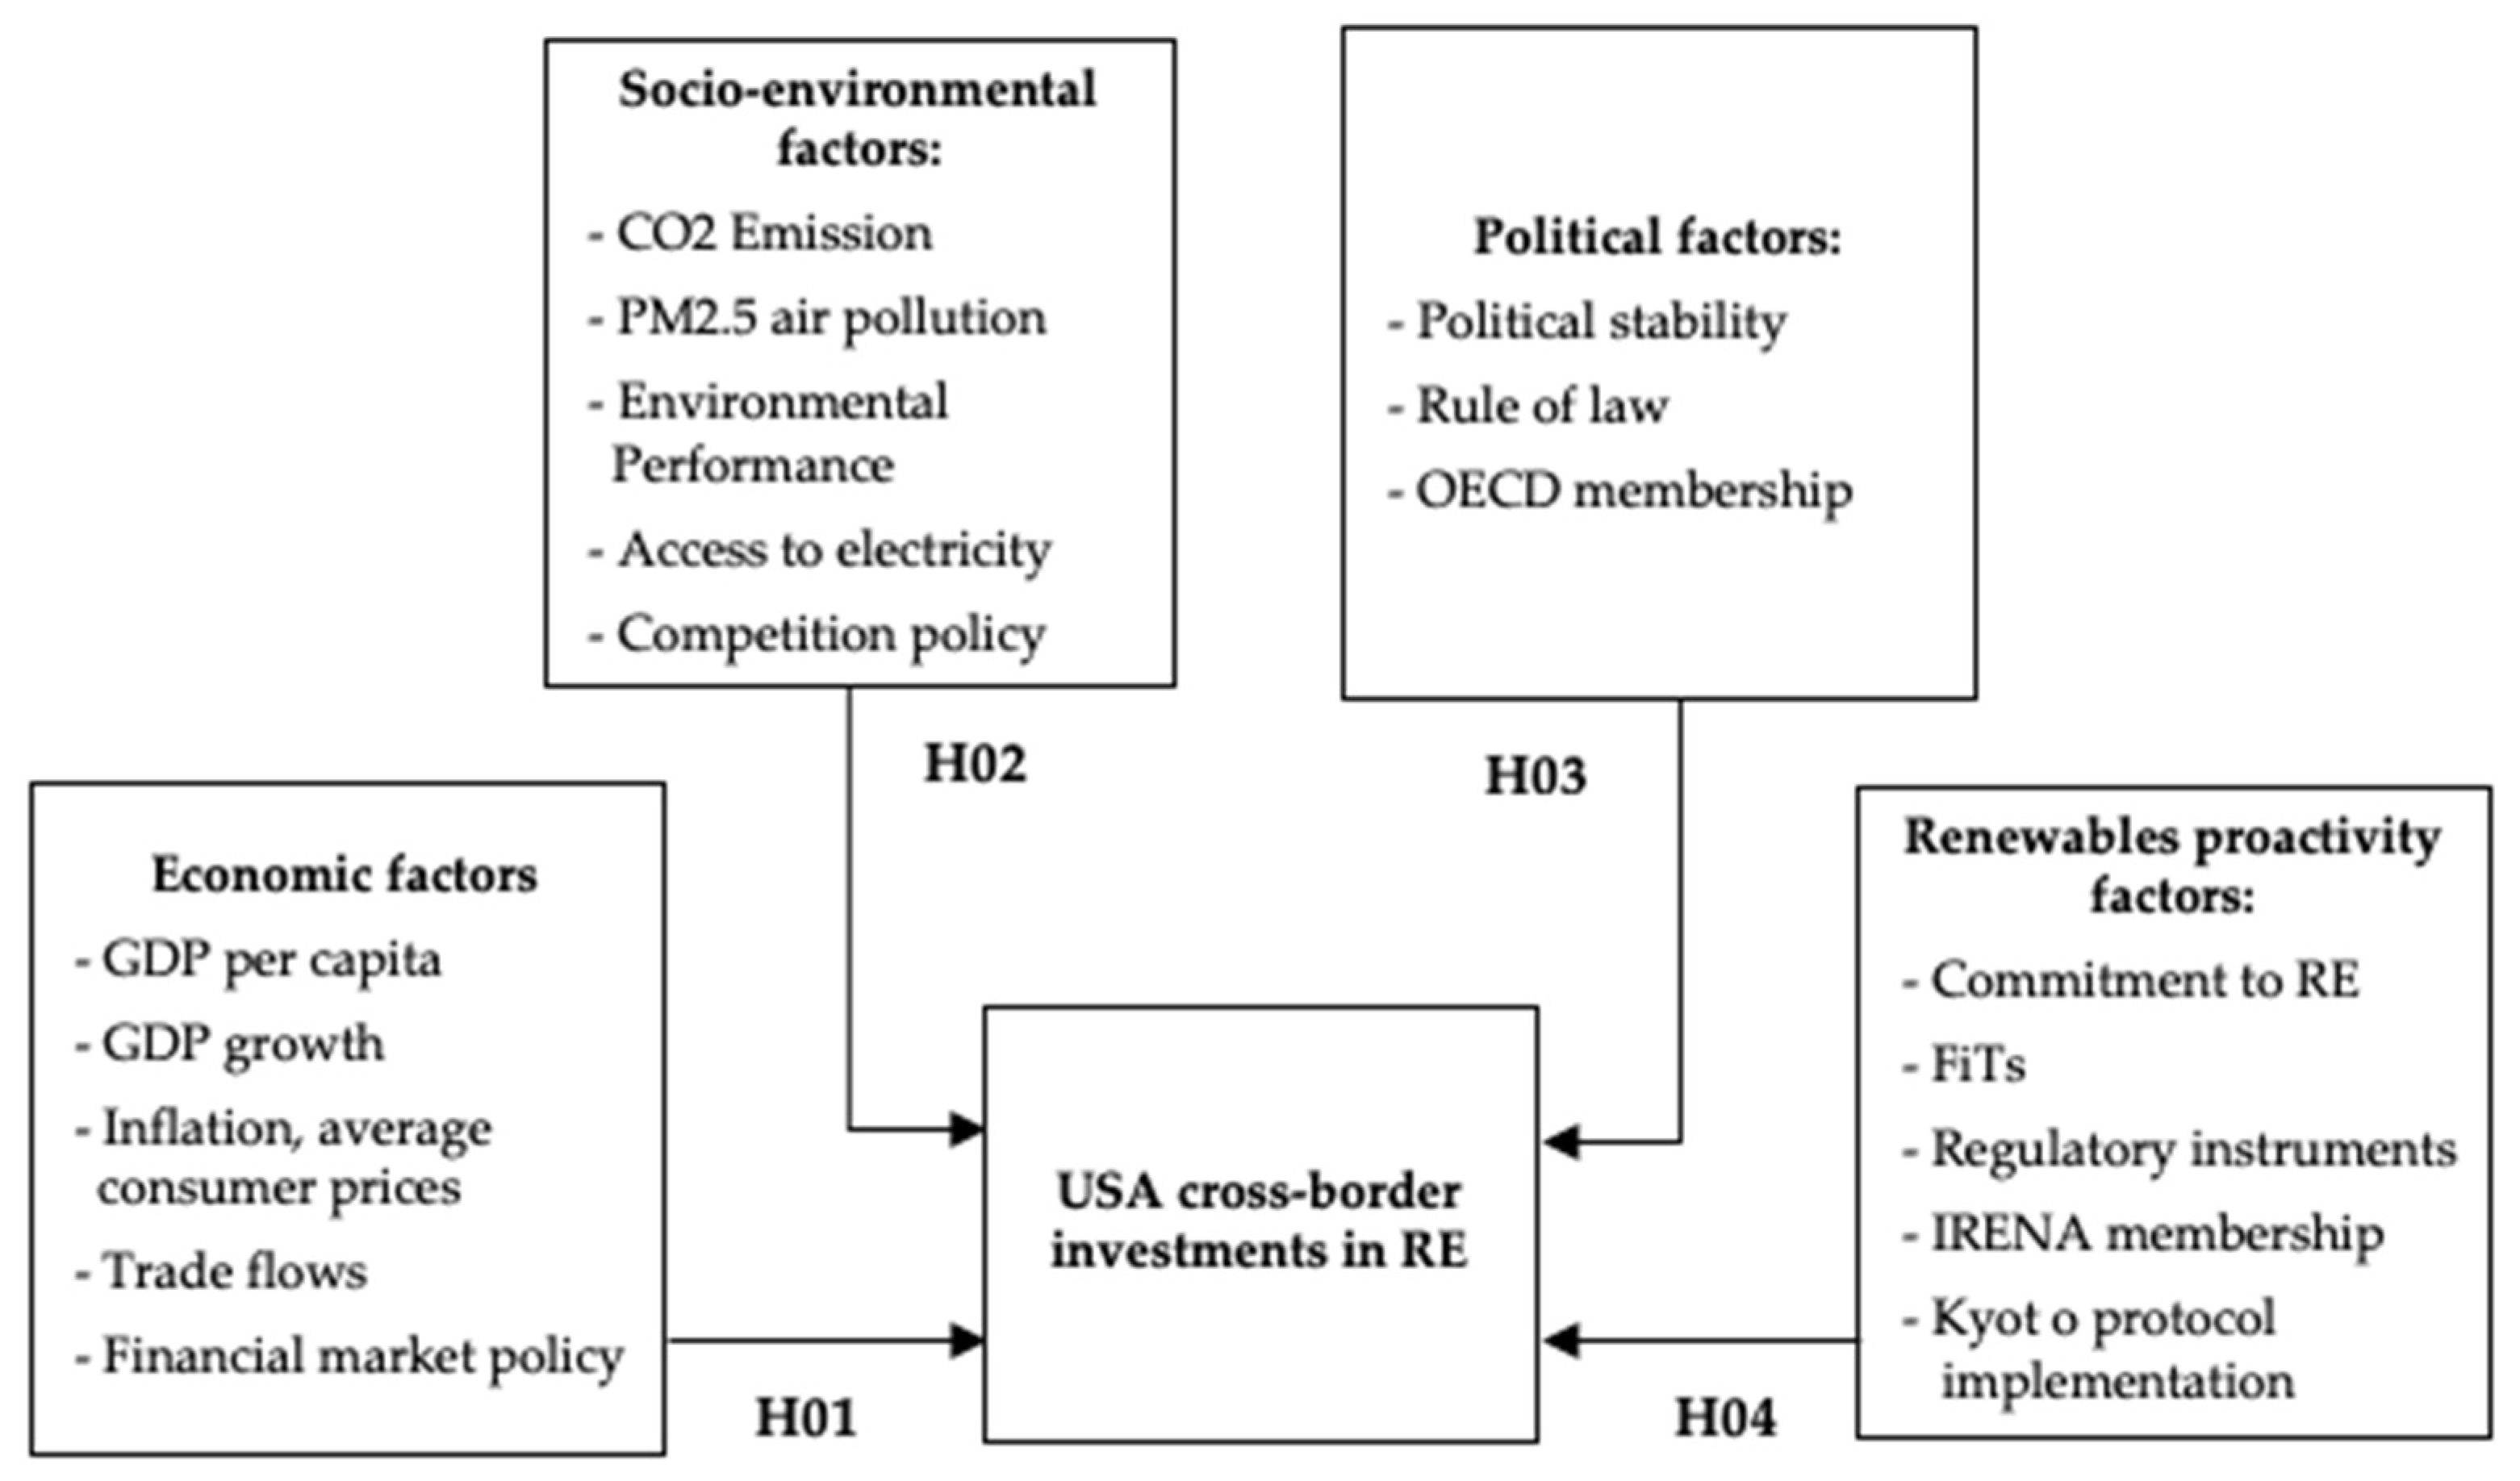
This paper builds on previous studies on cross-border investing in renewable energy [4,5,10]. As shown in Figure 1, the theoretical framework includes four groups of explanatory factors: (1) economic factors; (2) socio-environmental factors; (3) political factors; and (4) renewable energy proactivity factors.

Figure 1.
Theoretical framework for international clean energy investments.
First, prior studies examined country GDP per capita, GDP growth and inflation, using a top-down investment strategy model [18]. Since these are the most significant economic factors which describe market throughput and the overall economic situation, this may affect investors’ decisions when it comes to substantial cross-border investments. We may also expect that renewable energy investments in developing countries may be based on international economic relationships with these countries. As such, the bilateral trade flows variable (export and import) between the United States and the recipient country was included in the research design. If the sign is positive, this means that investors from the United States provide more renewable energy investments to those countries with which the country has stronger commercial ties. Furthermore, as previous research has suggested that the proxy of financial market policy represented by domestic credit to the private sector as a percentage of GDP has a relevantly significant influence on renewables investment flows [10], this leads to the formulation of the first null hypothesis:
Hypothesis 1 (H1).
Economic factors do not affect renewable energy project investment decisions in developing/emerging countries by investors from the United States.
Second, this paper investigates whether socio-environmental factors play a crucial role in renewable energy investments. We note that the renewable energy installed capacity growth is caused primarily by strong environmental concerns, in particular, carbon dioxide emissions [5] and PM2.5 air pollution conditions. As such, we may expect that a recipient country’s overall environmental performance (as represented by the EPI index) may have an impact on renewable energy investments by countries such as the United States. In other words, if the result sign is negative, this would suggest that the United States tends to help developing countries, who are struggling more with meeting international environmental standards. Furthermore, as Ragosa and Warren [10] highlight the role of a competitive environment encouraging foreign investments in renewables, natural resource rents (% of GDP) are introduced as a proxy for competition policy. Finally, this research examines the influence of access to electricity (% of the population) in the recipient country as an indicator of the level of power industry development. Considering these factors, the second null hypothesis is as follows:
Hypothesis 2 (H2).
Socio-environmental conditions of recipient countries do not affect investments in large renewable energy projects in developing/emerging countries by investors from the United States.
Third, “political factors” refer to both recipient countries’ domestic governing system and international representation—in particular, OECD membership, which is considered an important factor in previous studies [23,24], as the organization was created to provide financial support between countries, including energy investments. Political stability and rule of law were highlighted as important factors when it comes to the analysis of international investments and were found to be significant in several studies [10,13]. This leads to the formulation of the third null hypothesis:
Hypothesis 3 (H3).
Political factors do not affect investments in renewable energy projects in developing/emerging countries by investors from the United States.
Lastly, proactivity on renewable energy is represented by binary variables, depending on whether or not policies supporting renewable energy or membership in climate-related international organizations are in place. In Ragosa and Warren’s [10] study, factors, such as feed-in tariffs (FiTs) that support renewably produced electricity’s prices and long-term purchase obligations, as well as regulatory instruments factor, were significant in results on cross-border private investments in renewable energy in developing markets. Regulatory instruments here refer to auditing, monitoring, codes and standards, obligations systems, or required policies created by the recipient government. Aguirre and Ibikunle [4] utilized a continuous commitment dummy variable as a proxy for renewable energy share of total final energy consumption (TFEC): the variable equals one if the share was more than 20% between 2008 and 2019 (and 0 if it did not meet this threshold). Further, we may expect that the United States would invest in countries that are members of International Renewable Energy Agency (IRENA), and countries that promptly ratified the Kyoto Protocol before it entered into force in 2005 (the dummy variable equals one if the country ratified the protocol before 2005, and 0 otherwise). In Ragosa and Warren’s [10] research, this group of variables was aggregated into one measure of renewable energy proactivity. This served as an indicator of the intensity of the recipient country’s interest in renewable energy and support of its development (between a Likert scale of 0 if none of the group factors were mentioned or in place, and 5 if it included all of them). This analysis investigated aggregated measures, as well as each factor’s influence. Accordingly, the next null hypothesis is formulated:
Hypothesis 4 (H4).
Renewable energy supportive policies and RE commitments of recipient countries do not positively affect investments in large renewable energy projects in developing/emerging countries by investors from the United States.
For the second part of the analysis, this study disentangles investments by the United States into two groups based on the most popular renewable technologies: solar and wind. We note that previous studies have also analyzed renewable energy by technology [9,18], and this separation allows us to examine solar and wind potential. The peculiarity of renewable global investments is that we cannot invest randomly in solar and wind power stations in different countries. Each country has its respective wind and solar potential to produce sufficient energy from the two technologies. These variables were already examined in Aguirre and Ibikunle’s [4] research and were found to be very significant in RE’s contribution to energy supply. For the analysis, solar potential is represented by global horizontal irradiance (GHI) in MWh per year in each recipient country [25]. Given the large number of units, the log of values was taken to maintain the consistency of results. For wind technology investments, the regression employs a wind potential variable calculated by the area of the country in square kilometers, which, at a height of 50 m (60 m is a usual height for a wind turbine), has wind density which falls into 3–7 class (wind speed higher than 6.7 m/s). As these variables are time-invariant, given that the geographic nature potential is unlikely to change dramatically over time, random effects are used in the second part of the analysis. Furthermore, to support solar and wind power stations, countries should have necessary capital and economic resources. As such, we may expect the influence of economic factors in this regression to be significant. Accordingly, the last null hypothesis is generated as follows:
Hypothesis 5 (H5).
The effect on investments in large renewable energy projects in developing/emerging countries by investors from the United States does not vary according to the renewable energy technology.
3.2. Data Collection
For the dependent variable, this paper utilized panel data based on the Bloomberg New Energy Finance (BNEF)’s Climatescope database, which combines information about all cross-border finance deals in renewable energy projects in 61 emerging/developing countries. (Based on Climatescope’s classification, emerging/developing countries included in the analysis are Afghanistan, Argentina, Azerbaijan, Bangladesh, Belarus, Brazil, Bulgaria, Burkina Faso, Burundi, Cambodia, Cameroon, Chile, China (Mainland), Colombia, Costa Rica, Croatia, Dominican Republic, Ecuador, Egypt, El Salvador, Eritrea, Georgia, Guatemala, Honduras, India, Indonesia, Jamaica, Jordan, Kazakhstan, Kenya, Liberia, Malawi, Malaysia, Mali, Mexico, Mongolia, Morocco, Mozambique, Nepal, Nicaragua, Oman, Pakistan, Panama, Peru, Philippines, Romania, Russian Federation, Senegal, Serbia, Sierra Leone, Singapore, South Africa, Sri Lanka, Tanzania, Thailand, Turkey, Uganda, Ukraine, Uruguay, Vietnam and Zambia.) BNEF Climatescope includes data regarding large renewable project investments made by organizations from all over the world, but excludes local RE investors in the recipient country. From this database, we utilized only RE investments from organizations in the United States for the first part of the analysis and narrowed this down further to only solar and wind technology investments for the second part. Investment data for China excluded Taiwan and Hong Kong, due to gaps in observations. Specifically, separate data for other variables in the regression were unavailable for Hong Kong and Taiwan. At the time of conducting this research, BNEF data were available between 2008 and 2019. As such, our paper utilized investment data between 2008 and 2019 (or all available years of data) for large RE projects in terms of installed capacity—or larger than 1.5 MW.
For independent variables, economic factors included recipients’ annual GDP growth (percentage), GDP per capita (2010 constant USD), annual inflation, average consumer prices (percentage), trade data (the sum of exports and imports between the United States and the recipient country) and domestic credit to the private sector by banks in recipient country as a percentage of GDP. The primary data source was the World Bank (World Development Indicators) database (see Appendix A for details).
For socio-environmental factors, data included the mean annual PM2.5 air pollution in micrograms per cubic meter (between 2008 and 2019), access to electricity as a percentage of the population (between 2008 and 2018) and the total number of natural resources rents as a percentage of GDP (between 2008 and 2018) from the World Bank (World Development Indicators) database. The 2019 information regarding the percentage of population with access to electricity was available at the IEA, World Energy Outlook 2020 for 2019. Environmental Performance Index (EPI) data between 2008 and 2019 came from the Yale Center for Environmental Law & Policy and the Center for International Earth Science Information Network at Columbia University (CIESIN). Lastly, carbon dioxide emissions (tons) data between 2008 and 2019 were sourced from the 2020 Global Carbon Research Project group.
Political variables consisted of political stability and rule of law indexes between 2008 and 2019, with the World Bank (World Governance Indicators) database serving as the primary source. The OECD dummy variable and renewables proactivity group of dummy variables were generated by the authors. For the second part of the regression, data for solar and wind potential were also calculated by the authors with the help of the Solar and Wind Energy Resource Assessment data source. All explanatory variables and sources are represented in Appendix A.
Appendix B illustrates the matrix of correlations, suggesting that our panel data are not affected by multicollinearity. As an additional tool to analyze the magnitude of multicollinearity, this paper utilized the variance inflation factors (VIF) test for all independent variables (except for dummy variables). As shown in Table 1, while a VIF factor of more than five may be considered risky, our results suggest that the variables are not affected by severe multicollinearity, as the VIF ratios are less than 10 [26].

Table 1.
Variance inflation factors test results.
3.3. Methods
This study utilized three different regression models: logit, tobit and linear. Logit and linear models were used in previous studies on this topic [10], while an additional tobit model was added to the analysis, as the dependent variable for the investment amount in our panel data contained many zero values. Random effects were used for all three models, as the dataset has many time-invariant dummy variables.
The first model is the random effects logistic model:
where is the probability of investment occurring, is the vector variable for explanatory factors and represents the random effect. The logistic model was used to determine the influence of different factors on the likelihood of investments coming from the United States to emerging/developing countries for large renewable energy projects. As such, the binary dependent variable was generated to use in the logit model, where “1” indicates when investment occurred in a particular year and “0” otherwise.
The tobit and linear models assessed the effect of each variable from different groups on the amount of investments from the United States and are based on the following regression:
where is a measure of foreign private investments from the United States flowing into a country at year ; is a vector representing economic factors; is the socio-environmental factors; is the political factors; is the group of dummy variables to assess country’s renewables proactivity; and denotes the error term. For the second part of the analysis with different renewable technologies, only the logit model is used.
4. Key Findings and Discussion
4.1. Regression Results
Based on our analysis, the logit model provided the most significant results. Models 1 and 4 (Table 2) suggest that among all economic variables, inflation, consumer prices and trade generated the strongest positive coefficients regarding the number of investments by investors from the United States. Specifically, if inflation levels are higher in the recipient country, the country is more likely to receive investment by investors from the United States. Our results suggest that trade also has a comparatively high coefficient with strong significance, meaning that investors from the United States prefer to invest in countries with which the country has strong commercial ties. The financial market policy has a negative effect on investment decisions. This means that among emerging/developing markets, investments by investors from the United States support countries with a weaker financial sector. However, growth domestic product per capita and GDP growth levels of the recipient country were inconsistent across all models and demonstrated low significance. However, overall, the majority of economic factors exhibited high significance when it came to RE investment flows. As such, the null Hypothesis H1 can be fully rejected.
Table 2.
Regression results for cumulative renewable energy investments.
In addition, models 1 and 4 show that the environmental performance index has a quite significant negative coefficient. This suggests that investors from the United States prefer to invest in countries that are struggling to meet high environmental standards and have problems with production waste and pollution. At the same time, it seems that investors from the United States do not consider actual environmental issues, such as CO2 emissions, pollution levels and access to electricity by population, when making financial decisions, as these variables were found to have insignificant coefficients. Nevertheless, total natural rents presented significantly negative results in the tobit models (models 3 and 6), which can be interpreted that competition is still an important factor for investments in renewables. The countries that rely more on fossil fuels are less attractive to green investors or are not open to the energy transition and development of new renewable energy projects. Environmental and geological factors seem to influence investment flows to renewable in emerging countries. Taken together, Hypothesis H2 can also be rejected.
In terms of political factors, political stability was found to have a negative effect. While this may suggest that less politically stable countries receive more investment, the results are statistically insignificant and thus, it is difficult to support this statement fully. OECD membership also showed no connection to the amount of renewables investments. However, models 2 and 4 show that the rule of law is a strong determinant of RE investments. In other words, U.S.-based investors focus on countries with strong governance and adequate legal systems and controls. As a result, the null Hypothesis H3 can be rejected.
As shown in model 4, commitment to renewable energy as one of the main sources of energy consumption shows a high coefficient, suggesting that investors from the United States would choose to invest in countries that already have demand for RE resources. This is supported by the Kyoto Protocol ratification variable’s strong positive coefficient in tobit model 6. Aside from feed-in tariffs, other regulatory instruments and monitoring show no significance. As model 5 illustrates, feed-in tariffs might also attract investments to the country, while the IRENA membership factor in models 5 and 6 show a negative sign. This suggests that specific attention is not paid to countries that participate in this agency and that investments are more likely to be channeled to non-member countries. The null Hypothesis H4, thus, can be rejected.
With regards to investments for solar and wind technology respectively, Table 3 shows regression results for the binary outcome of RE investment decisions. For economic factors, all four models for both solar and wind showed comparatively significant results for the GDP growth variable (which has a negative sign). This suggests that investors from the United States prefer to invest in less developed countries for wind and solar technologies. This includes African and southeast Asian countries with high wind and solar potential. In terms of the GDP index, model 3 and model 4 (particularly the highly significant positive coefficient for wind technology) stand in contrast to insignificant negative results from the solar energy model results (models 1 and 2). For model 4, wind technology investments were highly dependent on the recipient country’s GDP. One interpretation could be that while wind turbines may be less expensive to install, they are quite often much more expensive to maintain vis-à-vis solar energy. This differentiation may level the playing field, making solar the less expensive option depending on maintenance costs. In this respect, investments in wind technology are channeled to countries with higher GDP levels, while the opposite is the case for recipients of solar technology investments.
Table 3.
Logistic regression results for solar and wind technology investments.
For socio-environmental factors, CO2 emissions and access to electricity were found to be insignificant for both renewable technologies investments. However, the pollution level variable for wind power was both strong and positive, while the EPI index and natural resources rents were significant and negative. Solar technology did not yield any significant results.
Political factors showed more reliable coefficients, compared to environmental variables. In particular, the rule of law shows statistically significantly high results for both technologies’ investments, with wind coefficients being slightly higher than those for solar. However, political stability and OECD membership showed a predominantly negative sign and low significance, as mentioned in our Table 2 results discussion.
Renewables’ proactivity was found to be more significant in the ungrouped set of variables. Here, the results suggest that IRENA membership of the recipient country is more positively significant for solar technology, while wind power projects investments showed the opposite sign. This implies that wind energy investments are more likely to be channeled to non-IRENA members. Kyoto Protocol ratification and overall commitment to renewables show positive signs but are statistically insignificant. For feed-in tariffs, wind technology shows a strong coefficient of almost 2, while other regulatory instruments suggest a high negative index. These policies show opposite and insignificant results for solar energy projects investments by investors in the United States to emerging/developing markets.
In sum, Table 3 shows bigger coefficients for wind technology investment regressions, while the impact of different factors on solar technology investments are generally insignificant and have small indexes. Thus, the null hypothesis H5 can be rejected.
4.2. Discussion
Our regression results support key findings from previous literature when it comes to RE investment. Specifically, our analysis supports the observation that economic indicators (such as GDP and inflation indexes) have a strong, positive influence on the number of investments [10,18]. At the same time, results for domestic credit to the private sector by banks demonstrated a significant negative relationship, contrary to findings by Ragosa and Warren [10]. This may reflect a distinguishing feature of investors from the United States with those of other countries, as Ragosa and Warren’s [10] analysis included investors for all large RE projects in developing markets, whereas our study focused on investors from one country (i.e., the United States).
Aside from economic factors, this study found a strong positive relationship between investments and factors such as the rule of law and renewables regulatory instruments, especially feed-in tariffs. Our findings support the results by Ragosa and Warren [10] and also those by Aguirre and Ibikunle [4], where it was shown that a commitment to renewable energy plays a crucial role in the development of renewables projects.
By focusing on the case of investments from one country, this allowed us to include more specific variables that elucidate the two-way relationships between investments from the United States and recipient countries. For instance, we added trade as one economic factor. While “trade openness” was already included in Ragosa and Warren’s study [10], the findings were limited to a one-sided factor for the investment recipient. In our study, we were able to examine the import/export numbers of both investing and recipient countries. As a result, our findings suggest that one of the most significant factors of renewable energy investment by investors from the United States is commercial ties with the recipient country.
In addition, while results varied between different RE technology investments, our findings suggest that investors from the United States invest in wind technology in richer countries, while solar technology investments go toward relatively poorer recipients. Although investors do pay attention to the country’s overall environmental performance, investments occurred more in the case of a lower index. The results also demonstrate the importance of a having a strong legal system and clean energy promoting mechanisms, such as feed-in tariffs. However, since the factor of renewable energy commitment is high and positive, investors from the United States may want to concentrate on countries where renewable energy technologies are not as developed as well as those which rely mostly on fossil fuels.
5. Conclusions
Although renewable energy investments in developing and emerging economies play a crucial role in accelerating the clean energy transition, investments are limited. As such, this paper analyzed determinants of RE investments in emerging/developing countries from the perspective of investors from the United States to better understand investment patterns with a view to accelerate future investment. Previous limitations in data were overcome by utilizing Bloomberg New Energy Finance’s Climatescope data, which include investment data for large renewable projects statistic in emerging markets. To enhance the robustness of the analysis, we separated factors by groups (economic, socio-environmental, political, RE proactivity factors) and utilized different regression models (logit, tobit and linear). Our results indicated the importance of strong trade relationships, stable legal systems, initial commitments to renewable energy resources and RE regulatory instruments, such as feed-in tariffs, for RE investors in the United States.
For the second part of analysis, we separated RE investments into two major groups: wind and solar power. Results suggested that higher GDP levels in recipient country are more important for wind technology project investments, while the opposite was the case for solar technology investments.
Despite our contributions to the academic literature, our research is not without its limitations. For the dependent variable, this research utilized data from Bloomberg New Energy Finance. The data source includes only large projects for renewable energy investments (>1 MW), while small capacity projects’ (<1 MW) investments are not considered. In addition, the timeframe for our research was between 2008 and 2019. As such, we were unable to incorporate the most recent years of data in our analysis. Lastly, due to calculation complications, the wind potential variable includes only land wind power stations. There is a significant amount of offshore power stations in a country’s marine territory, which can be covered in further studies.
Author Contributions
Conceptualization, E.A. and H.J.; methodology, E.A. and H.J.; validation, E.A. and H.J.; formal analysis, E.A.; investigation, E.A.; data curation, E.A.; writing—original draft preparation, E.A.; writing—review and editing, H.J.; visualization, E.A. and H.J.; supervision, E.A. and H.J.; project administration, E.A. and H.J. All authors have read and agreed to the published version of the manuscript.
Funding
This research received no external funding.
Institutional Review Board Statement
Not applicable.
Informed Consent Statement
Not applicable.
Data Availability Statement
The data utilized in this study is available upon request.
Conflicts of Interest
The authors declare no conflict of interest.
Appendix A. List of Explanatory Variables
Table A1.
Explanatory variables.
Table A1.
Explanatory variables.
| Dependent variable | |||||
| 1 | Inv | U.S.A. investments in RE in emerging markets | USD | Bloomberg New Energy Finance (BNEF)’s Climatescope | https://global-climatescope.org/clean-energy-investments (accessed on 15 September 2021) |
| 2 | Inv_d | Dummy variable of whether or not the foreign investment took place | dummy var | Created by author | |
| Economic factors | |||||
| 3 | gdp_gr | GDP growth annual (%) | annual % | WDI World Bank (World Development Indicators) | Lee, Zhong (2014) |
| 4 | Pgdp | GDP per capita (constant 2010 USD) | USD | WDI World Bank (World Development Indicators) | |
| 5 | infl | Inflation, average consumer prices | annual % | WDI World Bank (World Development Indicators) | Lee, Zhong (2014) |
| 6 | trade | (ex + imp) U.S.A. trade flows with other countries | USD | ||
| 7 | credit | Domestic credit to private sector by banks (% of GDP) | % of GDP | WDI World Bank (World Development Indicators) | Ragosa et al. (2019) |
| Socio-environmental factors | |||||
| 8 | co2_emis | CO2 Emission | tons | Global Carbon Project. (2020) | Liu (2019), Aguirre, Ibikunle (2014) |
| 9 | poll | PM2.5 air pollution, mean annual exposure | micrograms per cubic meter | WDI World Bank | World Development Indicators |
| 10 | epi | Environmental performance index (EPI) | index | Yale Center for Environmental Law & Policy/Center for International Earth Science Information Network at Columbia University. | |
| 11 | elect | Access to electricity (% of population) | % | WDI World Bank (World Development Indicators), IEA, World Energy Outlook-2020 for 2019 | |
| 12 | nat_re | Total natural resources rents (% of GDP) | % of GDP | WDI World Bank (World Development Indicators) | Ragosa et al. (2019) |
| Political factors | |||||
| 13 | pol_stab | Political stability: estimate | (−2.5 weak to +2.5 strong) | WGI World Bank (World Governance Indicators) | Ragosa et al. (2019) |
| 14 | rule | Rule of Law: Extent to which agents have confidence in and abide by the rules of society | WGI World Bank (World Governance Indicators) | Tolliver et al. (2020) | |
| 15 | oecd | OECD membership | dummy var | Created by author | Wikipedia |
| Renewables’ proactivity | |||||
| 16 | commit | Constant commitment to renewable energy (1 if during 2008–2019 years the coefficient is more 20%, and 0 otherwise) | dummy var | Created by author, modified from Aguirre, Ibikunle (2014) | Aguirre, Ibikunle (2014) |
| 17 | fit | Feed-in tariffs enaction (as if 2018) | dummy var | Created by author based on RENEWABLES 2019 GLOBAL STATUS REPORT | Ragosa et al. (2019) |
| 18 | regul | Regulatory instruments: Auditing, monitoring, codes and standards, obligation schemes or other mandatory requirements are in place (binary) | dummy var | ||
| 19 | irena | IRENA membership | dummy var | Created by author based on Irena website data | |
| 20 | kyoto | Kyoto protocol fast ratification: 1 for the ratified countries before 2005 and 0 otherwise. | dummy var | Created by author, modified from Liu | Liu et al. (2019) |
| 21 | agg_re | Aggregated variable of 16–20 variables all together, range 0–5 | Created by author, modified from Ragosa | Ragosa et al. (2019) | |
| Adjusting variables | |||||
| 22 | solar | Solar potential | MWh per year | Calculated by author, Solar and Wind Energy Resource Assessment | Aguirre, Ibikunle (2014) |
| 23 | wind | Wind potential (land areas only) wind speed class 3–7 at 50 m | km2 | ||
Appendix B. Matrix of Correlations
Table A2.
Matrix of correlations.
Table A2.
Matrix of correlations.
| Variables | (1) | (2) | (3) | (4) | (5) | (6) | (7) | (8) | (9) | (10) | (11) | (12) |
|---|---|---|---|---|---|---|---|---|---|---|---|---|
| (1) gdp_gr | 1.000 | |||||||||||
| (2) pgdp | −0.058 | 1.000 | ||||||||||
| (3) infl | −0.112 | −0.090 | 1.000 | |||||||||
| (4) trade | 0.099 | 0.117 | −0.089 | 1.000 | ||||||||
| (5) credit | 0.069 | 0.461 | −0.117 | 0.332 | 1.000 | |||||||
| (6) co2_emis | 0.162 | 0.018 | −0.050 | 0.751 | 0.446 | 1.000 | ||||||
| (7) poll | 0.228 | −0.278 | 0.057 | 0.131 | 0.030 | 0.288 | 1.000 | |||||
| (8) epi | −0.082 | 0.380 | −0.044 | 0.052 | 0.270 | −0.004 | −0.325 | 1.000 | ||||
| (9) elect | −0.149 | 0.422 | −0.164 | 0.193 | 0.525 | 0.145 | −0.188 | 0.471 | 1.000 | |||
| (10) nat_re | 0.075 | −0.080 | 0.044 | −0.096 | −0.238 | −0.066 | 0.005 | −0.266 | −0.368 | 1.000 | ||
| (11) pol_stab | 0.003 | 0.489 | −0.141 | −0.051 | 0.281 | −0.077 | −0.462 | 0.289 | 0.217 | 0.092 | 1.000 | |
| (12) rule | 0.030 | 0.716 | −0.166 | 0.013 | 0.492 | −0.013 | −0.227 | 0.359 | 0.360 | −0.099 | 0.592 | 1.000 |
Note: (1) GDP growth; (2) GDP per capita; (3) inflation; (4) trade; (5) domestic credit to private sector; (6) CO2 emission; (7) PM2.5 air pollution; (8) environmental performance index; (9) access to electricity; (10) natural resources rents; (11) political stability; (12) rule of law.
References
- Paris Agreement to the United Nations Framework Convention on Climate Change. (12 December 2015). Conference of the Parties. Available online: https://unfccc.int/sites/default/files/english_paris_agreement.pdf (accessed on 15 September 2021).
- Abeysinghe, A.; Craft, B.; Tenzing, J. The Paris Agreement and the LDCs: Analysing COP21 Outcomes from LDC Positions; IIED: London, UK, 2016. [Google Scholar]
- Donovan, C.; Nuñez, L. Figuring what’s fair: The cost of equity capital for renewable energy in emerging markets. Energy Policy 2012, 40, 49–58. [Google Scholar] [CrossRef]
- Aguirre, M.; Ibikunle, G. Determinants of renewable energy growth: A global sample analysis. Energy Policy 2014, 69, 374–384. [Google Scholar] [CrossRef] [Green Version]
- Liu, W.; Zhang, X.; Feng, S. Does renewable energy policy work? Evidence from a panel data analysis. Renew. Energy 2019, 135, 635–642. [Google Scholar]
- Gatzert, N.; Vogl, N. Evaluating investments in renewable energy under policy risks. Energy Policy 2016, 95, 238–252. [Google Scholar] [CrossRef]
- Lv, P.; Spigarelli, F. The integration of Chinese and European renewable energy markets: The role of Chinese foreign direct investments. Energy Policy 2015, 81, 14–26. [Google Scholar] [CrossRef]
- Lv, P.; Spigarelli, F. The determinants of location choice: Chinese foreign direct investments in the European renewable energy sector. Int. J. Emerg. Mark. 2016, 11, 333–356. [Google Scholar] [CrossRef]
- Mazzucato, M.; Semieniuk, G. Financing renewable energy: Who is financing what and why it matters. Technol. Forecast. Soc. Chang. 2018, 127, 8–22. [Google Scholar] [CrossRef]
- Ragosa, G.; Warren, P. Unpacking the determinants of cross-border private investment in renewable energy in developing countries. J. Clean. Prod. 2019, 235, 854–865. [Google Scholar] [CrossRef]
- Shimbar, A.; Ebrahimi, S.B. Political risk and valuation of renewable energy investments in developing countries. Renew. Energy 2020, 145, 1325–1333. [Google Scholar] [CrossRef]
- Wall, R.; Grafakos, S.; Gianoli, A.; Stavropoulos, S. Which policy instruments attract foreign direct investments in renewable energy? Clim. Policy 2019, 19, 59–72. [Google Scholar] [CrossRef]
- Tolliver, C.; Keeley, A.R.; Managi, S. Drivers of green bond market growth: The importance of Nationally Determined Contributions to the Paris Agreement and implications for sustainability. J. Clean. Prod. 2020, 244, 118643. [Google Scholar] [CrossRef]
- Tolliver, C.; Keeley, A.R.; Managi, S. Policy targets behind green bonds for renewable energy: Do climate commitments matter? Technol. Forecast. Soc. Chang. 2020, 157, 120051. [Google Scholar] [CrossRef]
- IRENA. Renewable Power Generation Costs in 2019. Available online: https://www.irena.org/publications/2020/Jun/Renewable-Power-Costs-in-2019 (accessed on 15 September 2021).
- Agbemabiese, L.; Nyangon, J.; Lee, J.-S.; Byrne, J. Enhancing Climate Finance Readiness: A Review of Selected Investment Frameworks as Tools of Multilevel Governance. SSRN Electron. J. 2018. [Google Scholar] [CrossRef] [Green Version]
- Jouvet, P.-A.; Schumacher, I. Learning-by-doing and the costs of a backstop for energy transition and sustainability. Ecol. Econ. 2012, 73, 122–132. [Google Scholar] [CrossRef] [Green Version]
- Lee, C.W.; Zhong, J. Top down strategy for renewable energy investment: Conceptual framework and implementation. Renew. Energy 2014, 68, 761–773. [Google Scholar] [CrossRef]
- Haščič, I.; Rodríguez, M.C.; Jachnik, R.; Silva, J.; Johnstone, N. Public Interventions and Private Climate Finance Flows: Empirical Evidence from Renewable Energy Financing; OECD Environment Working Papers; OECD: Paris, France, 2015; p. 80. [Google Scholar]
- Marques, A.C.; Fuinhas, J.A.; Pires Manso, J.R. Motivations driving renewable energy in European countries: A panel data approach. Energy Policy 2010, 38, 6877–6885. [Google Scholar] [CrossRef]
- Corfee-Morlot, J.; Marchal, V.; Kauffmann, C.; Kennedy, C.; Stewart, F.; Kaminker, C.; Ang, G. Towards a Green Investment Policy Framework: The Case of Low-Carbon, Climate Resilient Infrastructure; OECD Environment Working Papers; OECD: Paris, France, 2012; No. 48. [Google Scholar]
- OECD. Policy Guidance for Investment in Clean Energy Infrastructure: Expanding Access to Clean Energy for Green Growth and Development; OECD Publishing: Paris, France, 2015. [Google Scholar]
- Corrocher, N.; Cappa, E. The Role of public interventions in inducing private climate finance: An empirical analysis of the solar energy sector. Energy Policy 2020, 147, 111787. [Google Scholar] [CrossRef]
- Ang, G.; Röttgers, D.; Burli, P. The Empirics of Enabling Investment and Innovation in Renewable Energy; OECD Environment Working Papers; OECD: Paris, France, 2017; p. 123. [Google Scholar]
- Global Solar Atlas. Available online: https://globalsolaratlas.info/ (accessed on 15 April 2021).
- Kutner, M.H.; Nachtsheim, C.J.; Neter, J.; Li, W. Applied Linear Regression Models, 5th ed.; McGraw-Hill/Irwin: New York, NY, USA, 2005; pp. 406–410. [Google Scholar]
Publisher’s Note: MDPI stays neutral with regard to jurisdictional claims in published maps and institutional affiliations. |
© 2021 by the authors. Licensee MDPI, Basel, Switzerland. This article is an open access article distributed under the terms and conditions of the Creative Commons Attribution (CC BY) license (https://creativecommons.org/licenses/by/4.0/).