Article

Screening of Evaluation Index and Construction of Evaluation Index System for Mine Ventilation System

1
College of Safety Science and Engineering, Liaoning Technical University, Fuxin 123000, China
2
Key Laboratory of Mine Thermodynamic Disasters and Control of Ministry of Education, Liaoning Technical University, Fuxin 123000, China
3
School of Safety and Emergency Management Engineering, Taiyuan University of Technology, Taiyuan 030600, China
4
School of Automation Science and Electrical Engineering, Beihang University, Beijing 100191, China
*
Author to whom correspondence should be addressed.
Sustainability 2021, 13(21), 11810; https://doi.org/10.3390/su132111810
Submission received: 26 September 2021 / Revised: 18 October 2021 / Accepted: 21 October 2021 / Published: 26 October 2021
(This article belongs to the Section Energy Sustainability)

Abstract

:
The mine ventilation system is an indispensable component to improve coal mining efficiency and ensure the safety of production. Only by clearly grasping the comprehensive evaluation quality of the ventilation system can effective countermeasures be formulated. This paper establishes an evaluation index system for mine ventilation systems by combining a qualitative survey with quantitative research. Specifically, the primary indicators are screened through R-type clustering and the coefficient of variation method. The weight of each index is determined by the entropy weight method. Moreover, the technique for order preference by similarity to ideal solution (TOPSIS) method is used to evaluate the quality of the mine ventilation system. Finally, this evaluation system is used to evaluate the ventilation renovation project in the production mining area of the Sihe mine. The evaluation results verify the effectiveness of the establishment of the mine ventilation evaluation index system and of the evaluation methods.

1. Introduction

Coal has expanded globally as one of the foundational energy sources in the last few decades [1]. With the intention of sustainably using the limited coal resources, improving coal mining efficiency and mining safety are key influencing factors [2]. The premise of improving coal mining efficiency is to ensure the efficient operation of underground ventilation system. Moreover, most safety accidents in coal mines are related to underground ventilation systems [3]. A mine ventilation system is a complex dynamic regulation system which is accountable for transporting fresh air flow to underground roadways, meeting the respiratory requirements of staff, diluting harmful gases in roadways and eliminating toxic gases unrelated to production. Therefore, mine ventilation plays an essential role in safe production at the mine. The safety and stability of the mine ventilation system can be affected by many factors, such as design defects in the ventilation system, inadequate daily maintenance, and failure of the ventilation system to match the changes of excavation production in a timely fashion. Dramatic changes in any one of the internal or external factors can generate an enormous challenge to the safety and stability of the ventilation system and expand the risk of potential accidents. Hence, a universal evaluation system is needed in order to evaluate the quality of mine ventilation systems, which can propound scientific evaluation according to changes in the mine ventilation system [4].
The evaluation of mine ventilation systems primarily evaluates the quality of the ventilation system in three aspects: safety and reliability, economic rationality, and technical feasibility. The ventilation system corresponds to the actual demand by reasonably arranging air flow routes and the air use position of the ventilation network. For mine ventilation systems, effective evaluation methods have been proposed to improve the accuracy and effectiveness of evaluation, which can be primarily summarized in three categories: the traditional evaluation method, combining a geographic information system (GIS) with other evaluation methods; the empirical evaluation method, based on several important indicators; and the comprehensive evaluation method, based on multiple index items [5].
Thanks to the efforts of researchers, more and more methods based on the comprehensive evaluation of multiple indicators have been proposed and extensively applied, including: fuzzy mathematics [6], technique for order preference by similarity to ideal solution (TOPSIS) [7], gray theory [8], discriminant analysis method [9], support vector machine method [10], neural network method [11], unascertained measure method [12] and multi-level fuzzy comprehensive evaluation method [13]. The comprehensive evaluation process based on multiple indicators is mainly composed of three parts: the establishment of an evaluation index system, the determination of index weight, and the selection of evaluation methods. Among these, determination of the weight of evaluation indicators is a significant part of the whole evaluation process. According to their different sources of original data and calculation processes when calculating the weight coefficient, weight determination methods are generally divided into three categories: the subjective weighting method, objective weighting method and combination weighting method [14]. The most reasonable weighting method should consider not only the objective law of indicator data, but also the central role of expert experience [15]. Zhang et al. used an improved analytic hierarchy process (AHP) and the entropy weight method to calculate the subjective and objective weight of the indexes for urban distribution networks [16]. Guo et al. proposed the AHP-ENTROPY weighting method combining subjective and objective weighting methods to obtain better index weights [17]. They achieved dynamic weighting of the indicators considering the dynamic changes of the index weights in different system scenarios.
After determining the reasonable index weight, the next crucial step is to select an evaluation method conforming to the actual situation. Zhao et al. proposed a performance evaluation method for smart meters based on grey correlation analysis [18]. Zhang et al. used a comprehensive evaluation method to realize the introduction of dimensional and multi-index quantitative analysis [19]. They used the comprehensive evaluation method to simplify the multi-level evaluation index, reduce the index hierarchy, and calculate the ideal solution. Shi presents the adoption of a fuzzy comprehensive evaluation model and group-decision AHP in evaluating the quality of construction projects [20]. This method could improve the validity and accuracy of the assessment, and it did not rely on the experience of experts. Jia et al. established an index system using the indicator importance sort algorithm [21]. This method was actually a combination method including expert experience and theoretical calculation.
Unlike other evaluation occasions, an evaluation system for mine ventilation has such unique characteristics as multiple indicators, large amounts of statistical data, and many influencing factors. Jiang et al. used the unascertained measure theory and the uncertain information method to determine an evaluation system for mine ventilation. They applied this method to a lead–zinc mine ventilation system and achieved general results [22]. Cheng et al. proposed an integrated comprehensive method based on grey cluster analysis–fuzzy theory for selecting and evaluating the most suitable mine ventilation system [23]. Zhou et al. presented an approach to rank the alternatives by G1-coefficient of variation method. The result showed that this method could rank the alternative development face ventilation mode reasonably [24]. Yan et al. proposed a novel evaluation method based on cloud model clustering for the ventilation system of an underground metal mine [25]. The ventilation effectiveness could be properly classified as demonstrated by one case. Gao used the factor analysis method to screen the ventilation indicators and created the AHP-WRSR evaluation model by combining the analytic hierarchy process (AHP) and weight rank–sum ratio (WRSR) to optimize the scheme of a mine ventilation system [26]. However, qualitative methods such as expert consultation or literature summaries [27] are mostly used for the above index screening methods, and a quantitative screening process for indicators is lacking. Furthermore, some methods for quantitative screening of indicators have repeated indicators. These issues make it difficult for indicators to reflect satisfactory ventilation system information. Some of the above methods require the experience of experts, and if the experience of experts is unreliable, the obtained results will also be affected. Moreover, the above evaluation model is only focused on the evaluation of existing schemes, and no new schemes are considered. Facing complex systems such as multiple samples and multiple indicators, the above methods have the shortcoming of computational complexity and insufficient flexibility.
Aiming at the above problems, this paper studies the mine ventilation evaluation index system by combining qualitative research with quantitative research. Specifically, the primary evaluation index was determined through expert consultation and reference summary. Then, the primary index was screened through R-type clustering and the coefficient of variation method. Because the original data of the index were derived from the questionnaire and had a certain subjective willingness, this paper utilized the entropy weight method to determine the index weight. Finally, inspired by Li et al. [15], the TOPSIS method was employed for scheme evaluation.
The rest of this paper is organized as follows. Section 2 introduces the index screening method based on R-cluster and coefficient of variation. Section 3 establishes the evaluation index system for mine ventilation systems. Section 4 gives a case of mine ventilation optimization and lists the final optimization results and relevant analysis. Finally, the concluding remarks are summarized in Section 5.

2. Index Screening Based on R-Cluster and Coefficient of Variation

2.1. Repeated Index Clustering

Based on the evaluation data collected by the questionnaire, the indicators within the same guideline hierarchy are clustered by the R-type clustering method. Thereby, the data with strong correlations within the same criterion layer are apparently discovered. By screening indicators after R-cluster analysis, the problem of overlapping questionnaire evaluation indicators is effectively decreased. In this study, the minimum clustering criterion of deviation squares (MCCDS) was carried out to cluster indicators of the same criterion layer. Assuming that there are n indicators divided into p classes, the sum of the sums of the squared deviations of p classes is:
S = i = 1 p j = 1 m i ( X i j X i ¯ ) ( X i j X i ¯ )   ( i = 1 , 2 , , p )
where m i represents the number of evaluation indicators in the ith category; X i j represents the value of the jth evaluation indicator in the ith category; and X i ¯ represents the mean value of evaluation indicators of the ith class.
The distinct steps of R-type cluster analysis based on MCCDS are as follows:
  • Step 1: Consider n evaluation index as n categories.
  • Step 2: Any two of the n classes are combined into one class; the others remain unchanged. The total sum of the squared deviations of each scheme is calculated according to Equation (1). The combination scheme with the smallest sum of squares of the total deviation is a new classification. In addition, there is a total of n × ( n + 1 ) / 2 combination schemes.
  • Step 3: Repeat step 2 until the preset number of clusters p is reached.
The number of clusters p is set according to expert experience, which has an outstanding influence on the selection of indicators. In order to decrease the influence of subjective arbitrariness, the classification results need to be tested for plausibility. The K–W nonparametric test was utilized in this paper. The classification is justified if the significance level Sig for each category is >0.05. Otherwise, the cluster analysis needs to be continued until the detection requirements are met.

2.2. Selection of Maximum Information Index

The coefficient of variation is a statistic that measures the degree of dispersion of two or more groups of data. The smaller the coefficient of variation, the more centralized the dataset and the stronger the consistency. On the basis of R-type clustering, by comparing the magnitude of the coefficient of variation of the same category indicator, the indicator with the strongest consistency of the results, that is, the indicator with the smallest coefficient of variation value, is retained [28]. Through further screening of the coefficient of variation, the same category of indicators with weak consistency are removed. Thus, such processing not only preserves the typical indicators in the same category of indicators, but also avoids redundancy and overlap of the same category of indicators. The coefficient of variation of index i is calculated as follows:
C V i = S i E i = 1 n i = 1 n ( x i j x ¯ j ) 2 x j ¯
where C V i represents the coefficient of variation of the i index; S i represents the sample standard deviation of the i index; and E i represents the mean value of the i index.

2.3. Information Contribution Degree of the Selected Index

The principle of judging the rationality of index screening results is that more original information can be reflected with fewer indicators. According to the method that the variance parameter can indicate the information content of the index, the following formula is utilized to calculate the degree of information contribution of the screened index [28]:
I C = i = 1 s V a r x i i = 1 n V a r x i
where I C represents the information contribution degree of the selected index; V a r x i represents the variance of the ith indicators; s represents number of indicators after screening; and n represents number of initial indicators.

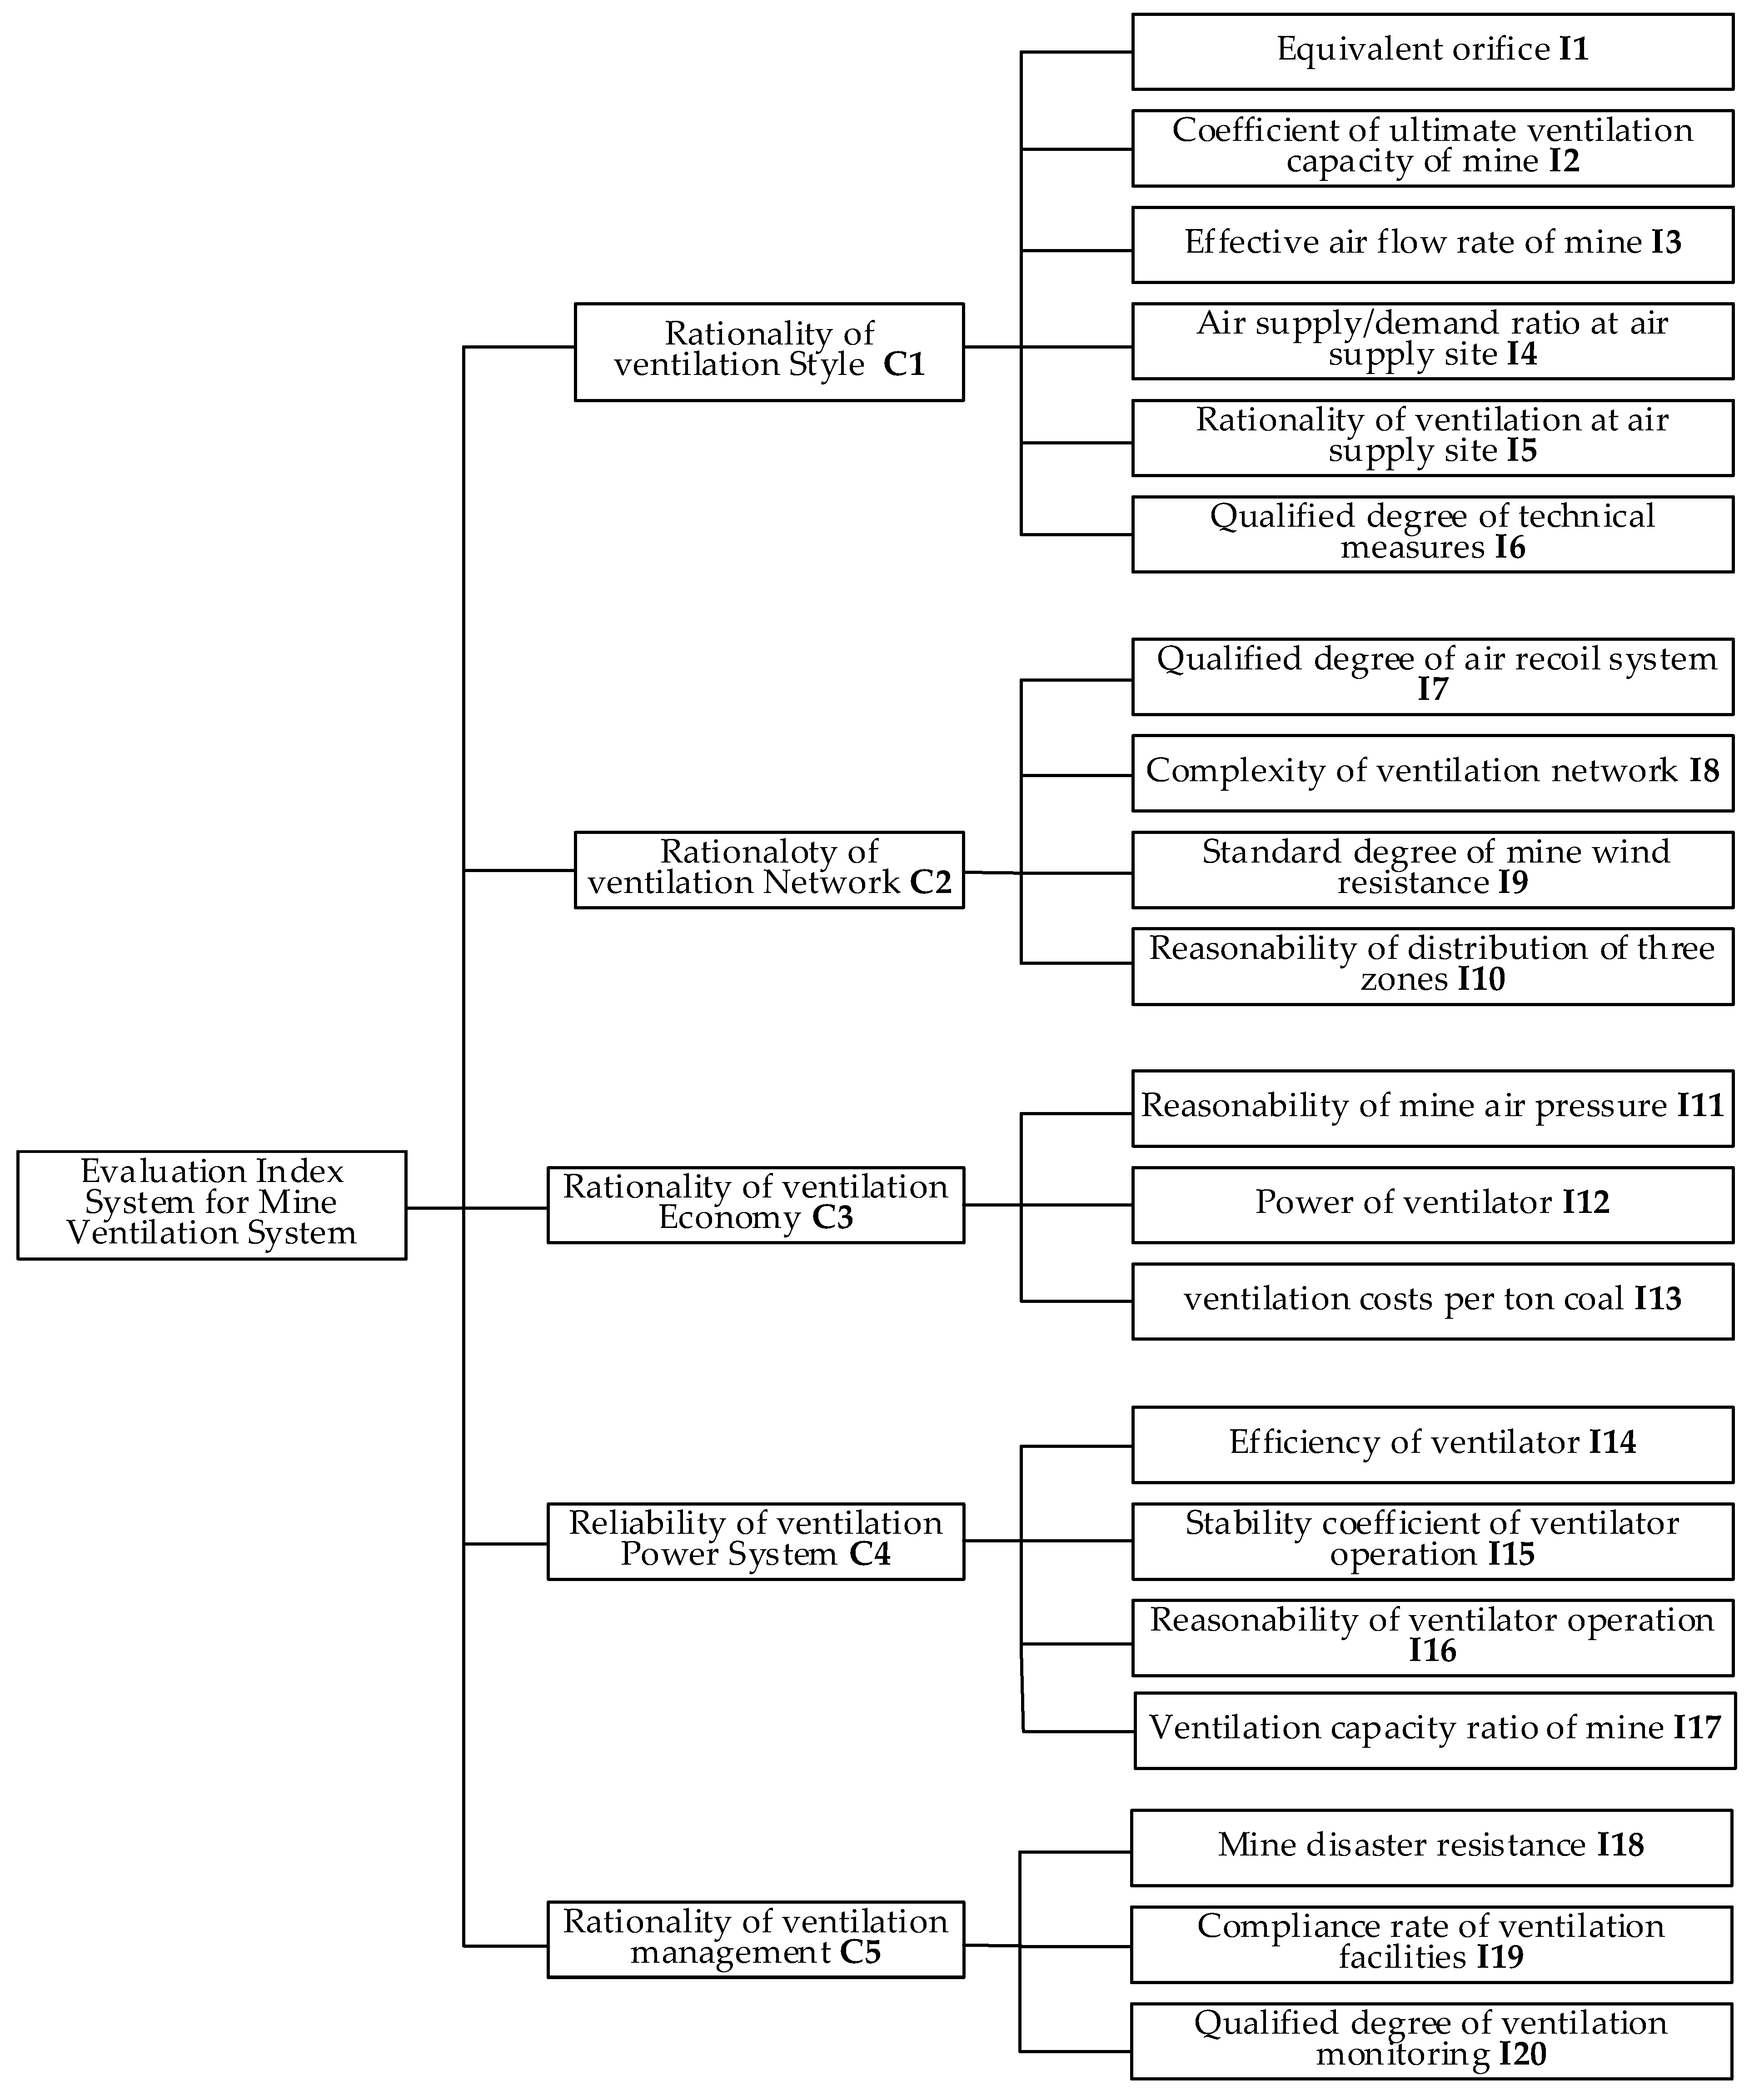
3. Construction of Evaluation Index System for Mine Ventilation System

3.1. Weight Calculation Based on the Entropy Method

The entropy method is an objective method for ascertaining the index weight based on the information entropy of the original index data. In information theory, the entropy is a measure of information irregularity. If a definite indicator contains more information, it indicates that the uncertainty situation is miniature and the corresponding entropy value is smaller. If a definite indicator contains less information, it indicates that the uncertainty situation is considerable and the corresponding entropy value is also large. Entropy values can not only characterize the degree of disorder of data information, but also indicate the degree of dispersion of the data. The main steps of the entropy method are as follows.
Firstly, the evaluation matrix is normalized. The raw data are normalized to map the data to the [0, 1] interval, eliminating the impact of dimensional unit restriction for comparison between different metrics. Generally speaking, there are three categories in an index set: interval index, negative effect index, and positive effect index. These indicators have different tendencies and need to be consistent when there are many categories of indicators for an evaluation system. The normalized formula for the positive effect index is:
x i j = v i j min ( v i j ) max ( v i j ) min ( v i j )
The normalized formula for the negative effect index is:
x i j = max ( v i j ) v i j max ( v i j ) min ( v i j )
where x i j represents the value after normalization of the i sample of the j index; v i j represents the original value of the i sample of the j index; max ( v i j ) represents the largest sample value among all samples for the j indicator; and min ( v i j ) represents the smallest sample value among all samples for the j indicator.
Secondly, the proportion of the i sample value under the j indicator is shown in the following equation, where p i j represents the proportion of the i sample value under the j index:
p i j = x i j i = 1 m x i j
Thirdly, the entropy of each indicator E j is shown in the following equation:
E j = i = 1 m p i j I n p i j I n m
Fourthly, the indicator weight ω j of the j indicator is shown in the following equation:
ω j = 1 E j j = 1 n ( 1 E j )
The value of ω j is between 0 and 1. The larger the ω j value, the more significant the value of the j indicator.

3.2. Evaluation Model of TOPSIS

The correlation between the evaluation scheme and each indicator is difficult to indicate accurately in a definite mathematical expression. Therefore, the evaluation results obtained by linearly adding the index value and the weight are not scientific. In this paper, TOPSIS is utilized to evaluate multiple indexes. TOPSIS method is a systematic evaluation method fitting for multi-index and multi-scheme decision analysis. By calculating the weighted Euclidean distance between a scheme and the positive ideal solution, the closeness of the scheme to the positive ideal solution is obtained. The evaluation model is as follows.
Firstly, a weight normalization matrix is constructed. Assuming n evaluation schemes and m evaluation indicators for each scheme, the following characteristic matrix is obtained.
D = [ x 11 x 12 x 1 m x 21 x 22 x 2 m x n 1 x n 2 x n m ]
where x i j represents the value of the j evaluation indicator in the i evaluation scheme. Then, the characteristic matrix is normalized to obtain the normalized matrix.
r i j = x i j i = 1 n x i j 2
Assuming that the weight of the indicator is ω , a weight normalization matrix in which the weight and normalization matrix are multiplied is determined.
p i j = ω j r i j ( j = 1 , 2 , , m ; i = 1 , 2 , , n )
Secondly, positive and negative ideal solutions are calculated.
Z + = ( max { p 11 , , p n 1 } , max { p 12 , , p n 2 } , , max { p 1 m , , p n m } ) = ( Z 1 + , , Z m + )
Z = ( max { p 11 , , p n 1 } , max { p 12 , , p n 2 } , , max { p 1 m , , p n m } ) = ( Z 1 , , Z m )
Thirdly, the closeness of each evaluation scheme to the optimal and worst solution is calculated.
D i + = j = 1 m ( p i j Z j + )   ( i = 1 , 2 , , n )
D i = j = 1 m ( p i j Z j )   ( i = 1 , 2 , , n )
Fourthly, the closeness of the evaluation object to the positive ideal solution is calculated.
C i = D i D i + + D i   ( i = 1 , 2 , , n )
The value of C i is between 0 and 1. The larger the C i value, the more acceptable the i evaluation scheme.

4. Case Analysis

In the case of the Sihe Mine, the above evaluation system was used to evaluate the Sihe Mine renovation scheme, and the results of the assessment verified the rationality and effectiveness of the evaluation system. The Sihe mine has an independent east mine area (EMA) and west mine area. The EMA has fourteen ventilation shafts, including nine air-intake shafts (AIS) and five return air shafts (RAS). The No. 1 AIS and the No. 4 RAS serve Q1 area. The No. 3 AIS and the No. 5 RAS serve Q2 area. The No. 1 RAS, the No. 2 RAS and the No. 3 RAS serve Q3 area. The Q1 area, the Q2 area and the Q3 area all have independent AIS and RAS. In this case, the evaluation system for the mine ventilation system was studied primarily for Q3 area in EMA.
Through the investigation, it can be seen that the required air volume in Q3 area is 29,800 m3/min, the air supply volume is 47,460 m3/min, and the air supply to demand ratio is 1.59. Wasting of air exists. The effective air volume in EMA is 38,907 m3/min, and the effective air volume utilization rate is 81.98%. The effective air volume utilization rate is unsatisfactory. The common ventilation line of the three return wells in Q3 area is long, which leads to the disturbance phenomenon of fan operation and insufficient stability of fan operation. The total power consumption in Q3 area is 2066.85 kw. The average mining cost is undesirability. Thereby, there are two main means of renovation: (1) Close three RAS or transform them into AIS, and then reasonably arrange complete ventilation facilities and plan air flow routes; (2) Dismantle the buildings with ineffective regulation in the ventilation system and realize the simplification of the ventilation network. The optimized objects are the No. 1 RAS, the No. 2 RAS, the No. 3 RAS and Q4 area. The Q4 area belongs to the mining area, and some roadways are shared with other areas. Aiming at the problems existing in the above the Q3 area, six modification schemes are proposed in combination with the actual production conditions, as shown in Table 1.

4.1. Selection of Index Data

Whether the ventilation system optimization evaluation index system is reasonably established is directly associated to the selection of ventilation system optimization scheme. Therefore, the index system should reflect all the factors affecting the quality of the mine ventilation system scientifically, objectively and as comprehensively as possible. On the basis of following the purpose, scientificity, systematicness, operability and timeliness through literature retrieval combined with the opinions of experts in relevant fields, a mine ventilation system evaluation index system composed of five criterion layers and twenty indicators was preliminarily established, as shown in the Figure 1. Based on the selected twenty evaluation indicators, a questionnaire was designed using a Likert 7-level scale. On the scale, 1 point indicated that the index is extremely unimportant; 2 points indicated that the index is especially unimportant; 3 points indicated that the index is unimportant; 4 points indicated that the index is commonly important; 5 points indicated that the index is very important; 6 points indicated that the index is especially important, and 7 points indicated that the index is extremely important. Questionnaires were counted in an anonymous fashion. Respondents were front-line personnel with a professional title of associate engineer or above with experience in mine ventilation or systematic training or researchers with a master’s degree or above. A total of 60 questionnaires were distributed and 53 valid questionnaires were returned.

4.2. Screening of Evaluation Index

Cluster analysis was performed on the 20 indicators using the method of R clustering, then the K–W test was performed on each class of indicators based on the clustering results. The results of the cluster analysis and K-W tests are shown in Table 2. Through the calculation of coefficient of variation, the index with the smallest coefficient of variation of the same class in each hierarchy of criteria was deleted. The C1 criterion layer removes the I6 index. The C3 criterion layer removes the I11 index. The C4 criterion layer removes the I17 index. The C5 criterion layer removes the I18 index. Furthermore, in the layer of the C2 criterion, the smallest coefficient of variation was the i10 index. The I10 index was an index to describe the distribution of mine resistance and the rationality of the ventilation system. It is generally believed that the distribution of three areas is reasonable. The closer the actual three-zone wind resistance distribution is to the ideal value, the better the ventilation effectiveness. The coefficient of variation of the I10 indicator was found to be greater than the other four indicators removed. Therefore, the I10 indicator was retained considering its importance. According to Equation (3), the information contribution degree of the selected index was calculated.
I C = i = 1 s V a r x i i = 1 n V a r x i = 21.74 25.866 × 100 % = 84.05 %
The results showed that 80% of the indicators after screening could reflect 84.05% of the original information. Gao [26] selected 16 indicators from the same 20 indicators by factor analysis. He used 80% of the screened indicators and only reflected 80.84% of the original data information. With the same 20 indicators, the screening indicator method we proposed could reflect more original data information. Apparently, our method improves approximately 4% on that used by Gao [26]. The validity of our index screening method was thus demonstrated.

4.3. Indicator Calculation of Modification Scheme

Through the measurement of ventilation resistance and the investigation of fan performance in the Sihe Mine, the network construction and calculation of each scheme were carried out with the assistance of network calculation software MVAD. Then, the data of the network solution was substituted into the corresponding indicator calculation formula [26,29] to obtain each index value of the optimization method. The original indicator parameters for each scheme are shown in Table 3.

4.4. Evaluation Index Weight Assignment

From the questionnaires, according to Equations (4)–(8) the entropy weight of each indicator was calculated using the entropy method. The objective weight of each evaluation index was shown as Figure 2.

4.5. Result and Discussion

According to Equations (9)–(16), the comprehensive score of the scheme was calculated using the TOPSIS method. The comprehensive score of the scheme is shown as Figure 3. Based on the results, the scores were 4 and 6 for the significant quality scheme, 5 for the reference scheme, and 1, 2, and 3 for the unsatisfactory quality scheme. From the final composite score, Scheme 6 was the optimal scheme.
The ventilation tasks undertaken by the No. 1 RAS, the No. 2 RAS and the No. 3 RAS belong to a ventilation network and they are interrelated. Combined operation of multiple fans is the main feature of the Sihe ventilation system. Moreover, the ventilation network under the multiple fans is very complex, and system optimization using artificial network calculation can hardly be realized, and thus cannot meet the needs of safe production. Therefore, on the basis of establishing a ventilation network model by computer technology, the renovation scheme of the Sihe coal mine was simulated. The results after simulation for the schemes are shown in Table 4.
There are three production areas, Q1, Q2 and Q3, in the EMA area, and mine excavation coal production is expected to increase. The No. 3 RAS only serves two roadways, Dongjiao and Donggui. Changing the use of the No. 3 RAS will cause insufficient air volume in the Dongjiao, which affects the yield of Q3 area. After changing the No. 1 RAS to AIS the system was safer, the inlet branch of the system network increased, the negative pressure of the system decreased, and the air volume of the system increased. Scheme 4 (3308.1 Pa) and Scheme 6 (3395.8 Pa) both had less negative pressure than the others (Scheme 1: 4031 Pa; Scheme 2: 3926.9 Pa; Scheme 3: 3536.6 Pa; Scheme 5: 3629.9 Pa). Scheme 4 (694.6 m3/s) and Scheme 6 (692.5 m3/s) both had larger air volume than the others (Scheme 1: 647.1 m3/s; Scheme 2: 653.2 m3/s; Scheme 3: 684.7 m3/s; Scheme 5: 682.3 m3/s). Hence, Scheme 4; Scheme 6 were superior to the other schemes. Moreover, From the perspective of engineering quantity, Scheme 6 had less construction quantity than Scheme 4, which could save a lot of manpower and financial resources. Compared with Scheme 4, Scheme 6 was more intensive, and considering that the remaining roadway in Q4 Area could be used as a material bank for Q1 and Q2 areas, Scheme 6 was preferred. Compared with Scheme 5, Scheme 6 was far superior in terms of system power consumption (1177.6 vs. 1239.9), effective air flow rate of mine (86.2% vs. 85.7%) and equivalent orifice (14.44 vs. 13.79). Therefore, scheme 5 was omitted. Scheme 6 was the optimal scheme, i.e., change the No. 1 RAS to AIS and modify the Q4 area.
In response to the shortcomings of the Q3 area, we used scheme 6 to modify the ventilation system; the measured parameters are shown in Table 5. Compared with the parameters of scheme 6 in Table 4, the negative pressure of the No. 3 RAS was 1633.1 Pa, and the measured actual negative pressure was 2030 Pa, which essentially met the actual requirements. The negative pressure of the No. 2 RAS was 1762.7 Pa, and the actual negative pressure measured was 2436 Pa, which also essentially met the actual requirements. The simulation results were on the whole not much different from the actual requirements.
In response to the shortcomings in the Q3 area, we analyzed the ventilation system before and after renovation for the rationality of ventilation system resistance, air volume supply and demand, resistance distribution in the three areas, and economic rationality.
  • After renovation of the ventilation system, the Q3 area was equipped with ventilation tasks by the No. 3 RAS and the No. 2 RAS. The return air volume of the No. 3 RAS was 11,318 m3/min. The operating negative pressure was 2030 Pa, and the equivalent orifice was 4.87 m2. The return air volume of the No. 2 RAS was 25,218 m3/min. The operating negative pressure was 2436 Pa, and the equivalent orifice 8.98 m2. Both the No. 2 RAS and the No. 3 RAS belong to ventilated easy mines. Moreover, according to the “Technical Conditions of Ventilation for Coal Mine Worker Mining” [30], the relationship between resistance and air volume of the mine ventilation system in the production mine was specified. The return air volume of the No. 3 RAS was 11,318 m3/min, and its ventilation resistance value should be less than 2940 Pa; the actual pressure was 2030 Pa. The return air volume of the No. 2 RAS was 25,218 m3/min, and its ventilation resistance value should be less than 3920 Pa; the actual pressure was 2436 Pa. Thus, the ventilation system of the Sihe Coal Mine conforms to the provisions of “Technical Conditions of Ventilation for Coal Mine Worker Mining” after renovation. Considering the air demand of the long-distance tunneling roadway in the northern EMA, the Supply/Demand Ratio of the No. 3 RAS and the No. 2 RAS was increased in order to avoid inadequate air volume and excessive waste of air volume.
  • In addition, after renovation of the ventilation system, the ventilation resistance of the inlet section, using section, and return section of the No. 2 RAS revealed a situation of low resistance in the inlet section, high resistance in the return section and moderate resistance in the using section. The average 100 m resistance (36.15 Pa) of the total ventilation route was low, indicating that the distribution of system resistance was reasonable and the ventilation system was reasonable. Since the No. 3 RAS was only used to eliminate gas, the inlet air route was long and the return air route was the length of the wellbore. The resistance in the inlet and return areas showed the special situation of the high inlet section and low return section. After renovation of the ventilation system, the effective air volume of the mine was 29,910 m3/min. The total air inlet volume of the mine was 33,532 m3/min, and the effective air volume was 89.2%, which met the requirements of the regulation and effectively utilized the air volume. Moreover, the equivalent orifice was 13.7 m2, which was an easy ventilation system.
  • Before renovation of the ventilation system, the exhaust volume of the fan in the No. 1 RAS was 14,460 m3/min. The negative pressure was 2080 Pa. The operating power was 501.3 kW, and the average daily power consumption was 12,031.2 kWh. After changing the No. 1 RAS to AIS, at least USD 679,000 per year would be saved in power consumption for fan operation. In addition, it could also save the maintenance cost of fan and auxiliary facilities and labor costs for about ten personnel, including post and maintenance personnel. In general, about USD 773,000 in various costs would be saved each year.
  • There was a large disturbance intensity between the No. 1 RAS fan and the No. 3 RAS fan before renovation, which was calculated to be 33.85% in excess of the fan disturbance cut-off value [31]. After renovation, the resistance in the common section between the No. 1 RAS and the No. 3 RAS was 251.48 Pa and the disturbance intensity of the fan was 11.9%, which fulfilled the relevant requirements.

5. Conclusions

Based on analysis of the shortcomings of the existing mine ventilation evaluation systems, a mine ventilation evaluation system combining qualitative and quantitative analysis was herein proposed. Through theoretical analysis and case discussion, the following conclusions can be summarized:
  • The 20 evaluation indexes of mine ventilation were selected through expert consultation and reference summary. Then the primary index was screened through R-clustering and the coefficient of variation method. The results showed that 80% of the indicators after screening could reflect 84.05% of the original information. Apparently, our method is improved by approximately 4% compared with Gao [26].
  • Because the original data of the index was derived from a questionnaire and had a specific subjective willingness, this paper utilized the entropy weight method to determine index weight. This method decreased the influence of subjective factors on the weight of indicators as much as possible, so that the weight of indicators was more acceptable and the evaluation results were more scientific.
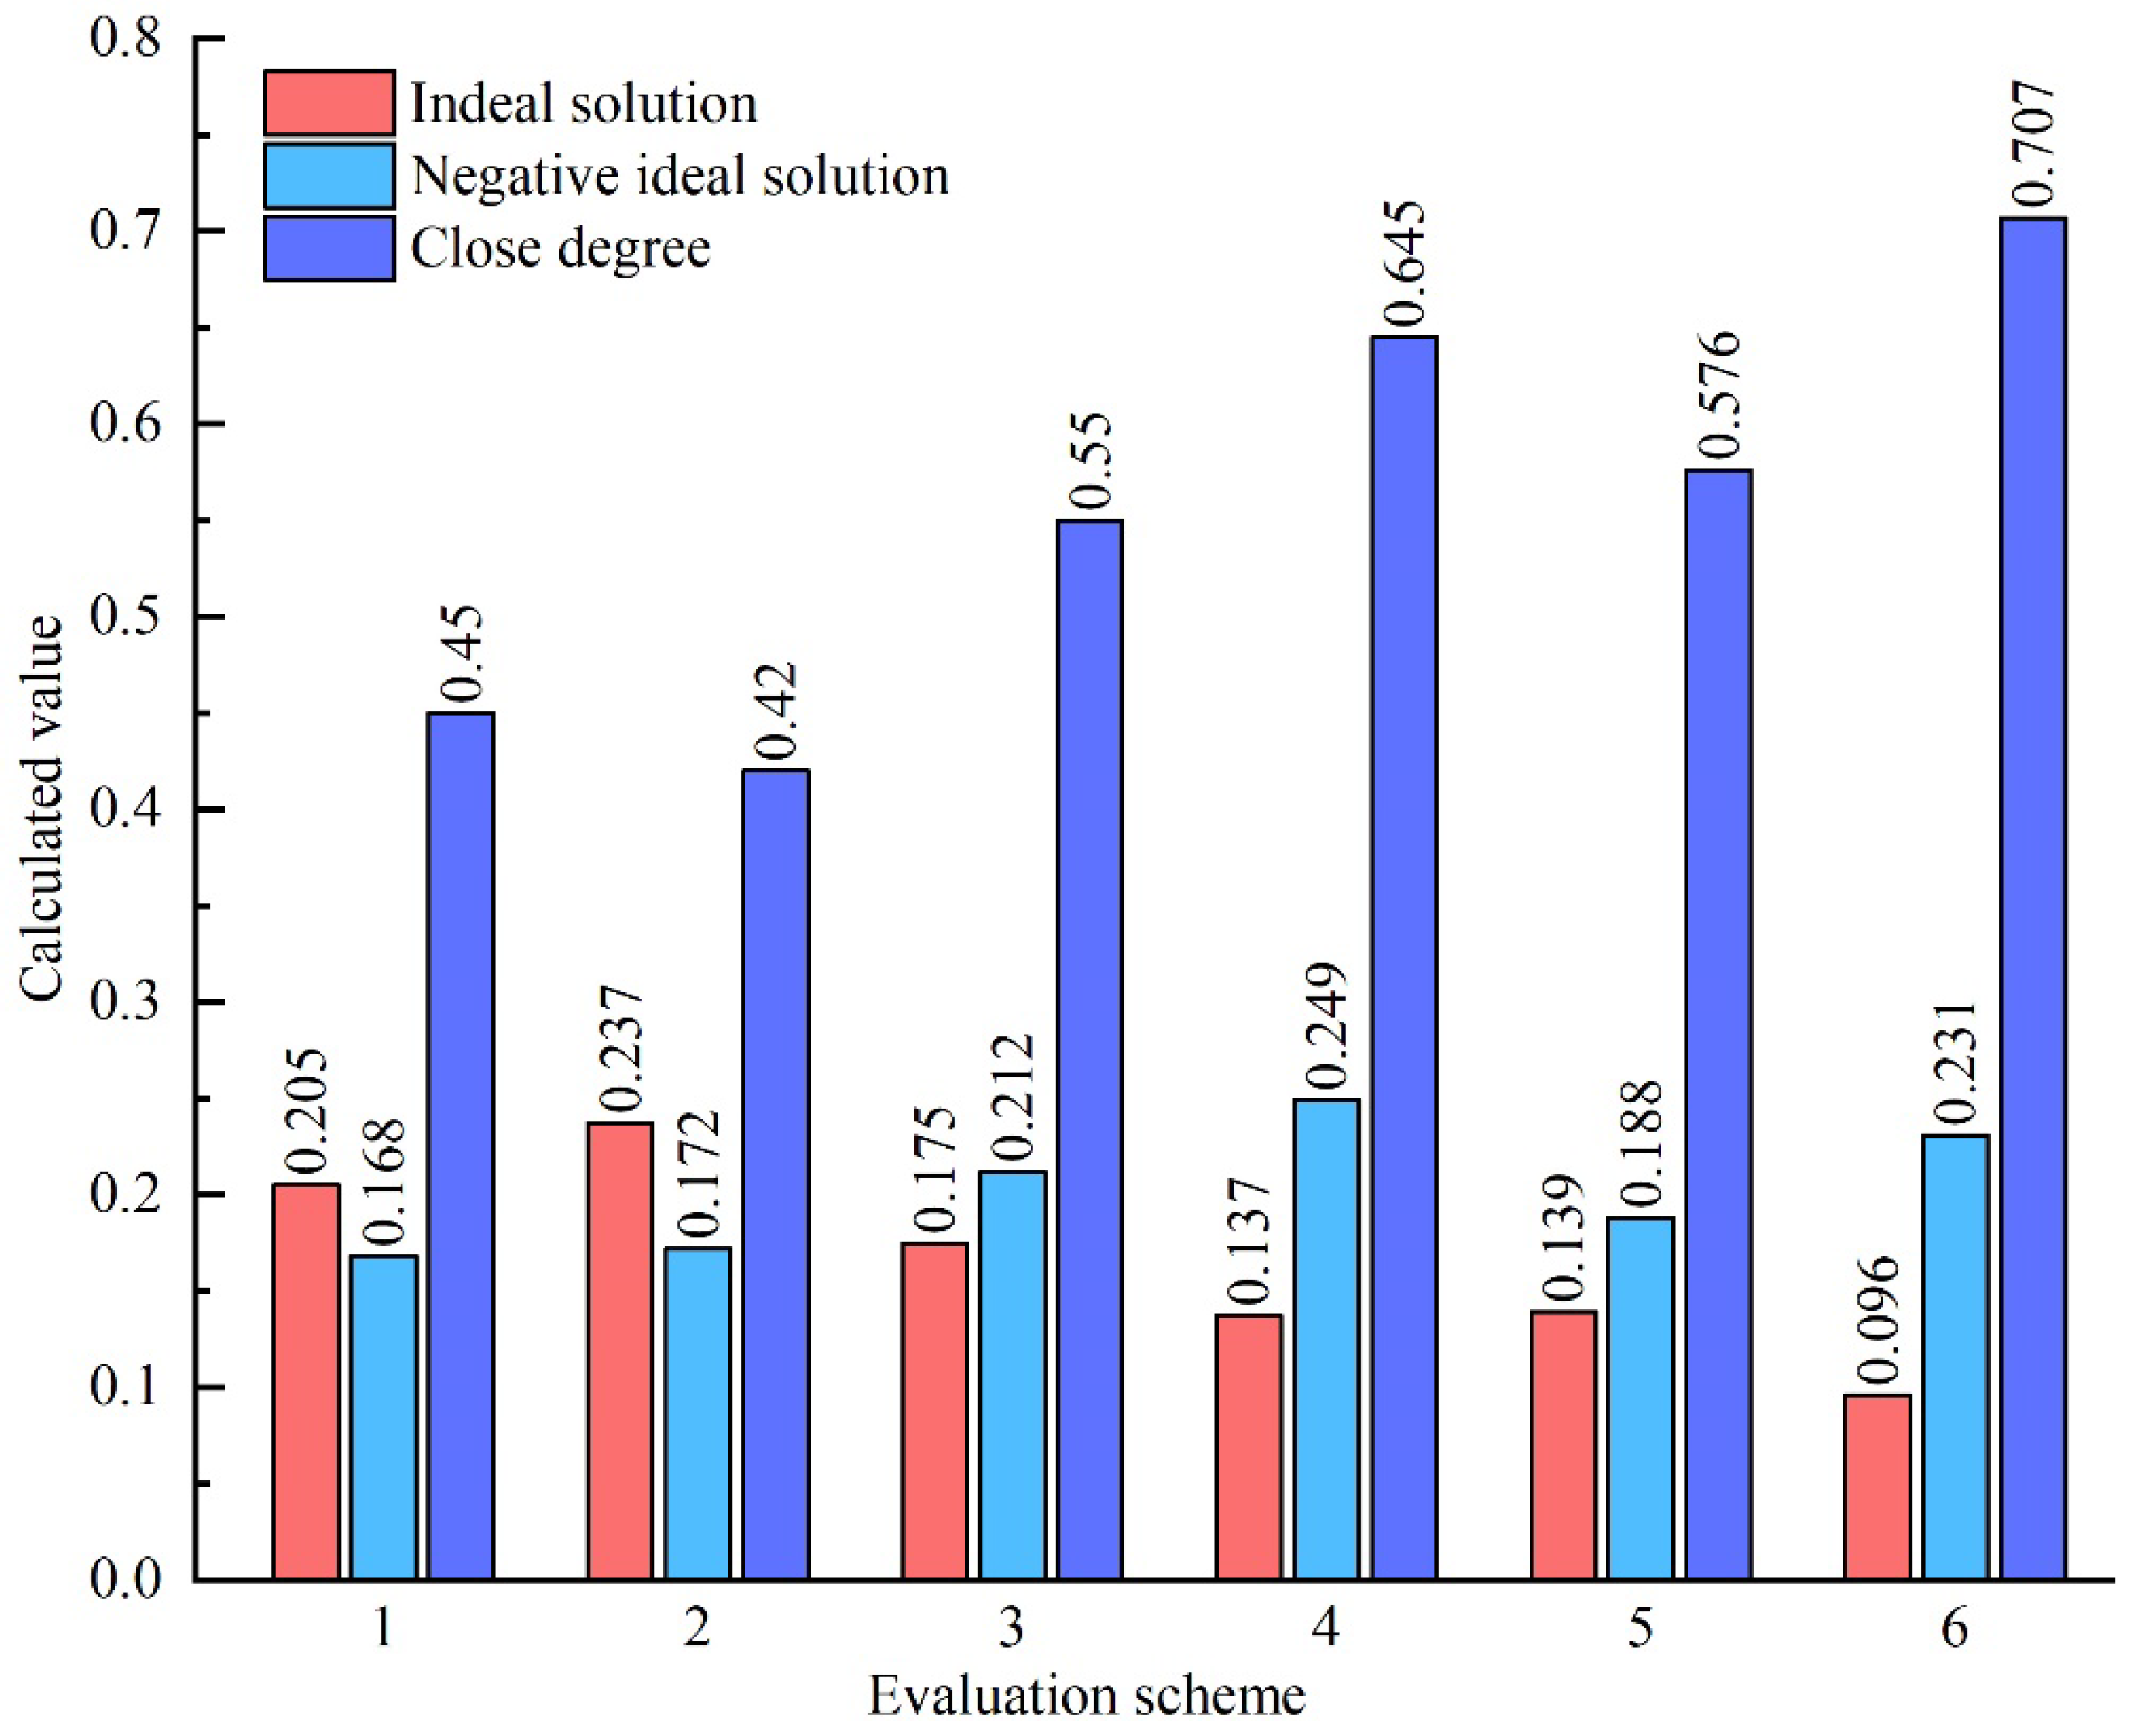
  • Aiming at the properties of enormous sample data, a complex indicator system and the possibility of future ventilation evaluation system expansion, the TOPSIS method was utilized to evaluate the mine ventilation evaluation system. The ventilation evaluation system was applied to the Sihe mine. The ventilation simulation results showed that Scheme 4; Scheme 6 had lower negative pressure and higher air volume compared to other schemes. Compared with Scheme 4, Scheme 6 was more time-saving and labor-saving in the renovation project. Compared with Scheme 5, Scheme 6 had great advantages in terms of system power consumption, effective air volume rate, and equivalent orifice. The actual test results were essentially consistent with the simulation results of Scheme 6. The correctness of the optimized scheme is verified by simulation results and practical renovation.
The evaluation system method proposed in this paper provides a novel solution for multi-index and multi-quantity optimization decision-making for mine ventilation evaluation systems.

Author Contributions

Q.-P.B., Y.-C.L. and C.S. contributed equally to the research design and preparation of the manuscript. All authors have read and agreed to the published version of the manuscript.

Funding

This research received no external funding.

Institutional Review Board Statement

Not applicable.

Informed Consent Statement

Not applicable.

Data Availability Statement

Data sharing not applicable.

Conflicts of Interest

The authors declare no conflict of interest.

References

  1. Lechner, A.M.; Kassulke, O.; Unger, C. Spatial assessment of open cut coal mining progressive rehabilitation to support the monitoring of rehabilitation liabilities. Resour. Policy 2016, 50, 234–243. [Google Scholar] [CrossRef]
  2. Gao, Y.; Liu, D.; Zhang, X.; He, M. Analysis and Optimization of Entry Stability in Underground Longwall Mining. Sustainability 2017, 9, 2079. [Google Scholar] [CrossRef] [Green Version]
  3. Zhang, X.H.; Wang, L.G.; Feng, X.L. Fuzzy integrated evaluation for safety of metal mine ventilation system. China Min. Mag. 2010, 19, 93–96. [Google Scholar]
  4. Lee, D.-K. Optimal design of mine ventilation system using a ventilation improvement index. J. Min. Sci. 2016, 52, 762–777. [Google Scholar] [CrossRef]
  5. Bai, Y.Y.; Wen, C.P.; Chen, Z.H. Evaluation of mine ventilation system working condition based on catastrophe progression method. Electron. J. Geotech. Eng. 2016, 21, 7517–7525. [Google Scholar]
  6. Ren, S.; Wang, X.S.; Jiang, D.Y. Multiple fuzzy integrated evaluation for safety of mine ventilating system. China Saf. Sci. J. 2009, 19, 127–131. [Google Scholar]
  7. Li, X.F.; Wu, Y.; Zhao, Z.Y.; Liu, Y.; Xie, P.; Zou, J.; Xuan, P.; Zhu, J.; Huang, L. Research on index system and comprehensive evaluation method of China’s electricity spot market. In Proceedings of the 8th Renewable Power Generation Conference, Shanghai, China, 24–25 October 2019; pp. 1–7. [Google Scholar]
  8. Jing, G.X.; Yao, R.; Zhang, F.R. Grey comprehensive judgement for the reliability of mining ventilation system. China Saf. Sci. J. 2001, 11, 65–68. [Google Scholar]
  9. Shi, X.Z.; Zhou, J. Reliability assessment for mine ventilation system safety using Fisher discriminant analysis. J. Min. Saf. Eng. 2010, 27, 562–567. [Google Scholar]
  10. Su, Y.Y.; Liu, X.H.; Li, J.Z. Mine ventilation system index system reduction and its safety evaluation. China Saf. Sci. J. 2013, 23, 83–89. [Google Scholar]
  11. Liu, H.T.; Li, L.L. Comprehensive Evaluation Analysis of Mine Gas Safety Based on Integrated Method. In Proceedings of the 2009 International Conference on Computational Intelligence and Software Engineering, Wuhan, China, 11–13 December 2009; IEEE: Washington, DC, USA, 2009; pp. 1–4. [Google Scholar]
  12. Xiao, P.; Ding, Y.; Li, S.G. Evaluation of Gas Prevention and Control System Based on Unascertained Measurement Mode. China Saf. Sci. J. 2017, 27, 98–103. [Google Scholar]
  13. Zhu, W. A comprehensive benefit evaluation model of multi energy complementary system operation for different applica-tion scenarios. In Proceedings of the IEEE Power & Energy Society Innovative Smart Grid Technologies Conference, Washington, DC, USA, 16–18 February 2021; 2021; pp. 1–5. [Google Scholar]
  14. Yi, D.F.; Liu, D. Construction of the Coal Mine Production Safety Management Evaluation System Based on the Sustainable Development. In Proceedings of the Asia-Pacific Power and Energy Engineering Conference, Shanghai, China, 27–29 March 2012; pp. 1–5. [Google Scholar] [CrossRef]
  15. Li, Y.M.; Chen, Z. Evaluation Index System and Evaluation Method of China’s Regional Potential for Electrical Energy Sub-stitution. Math. Probl. Eng. 2018, 2018, 3834921. [Google Scholar]
  16. Zhang, K.; Zhu, R.; Song, R.; Shi, F.; Shi, S.; Fang, C. A Mesh Analysis Model and the Coherent Evaluation Index System for Urban Distribution Network Planning. In Proceedings of the 2021 3rd Asia Energy and Electrical Engineering Symposium (AEEES), Chengdu, China, 26–29 March 2021; pp. 443–447. [Google Scholar] [CrossRef]
  17. Guo, S.; Feng, P.; Hu, W.; Xu, C.; Xiao, J.; Xu, J. Multi-index Comprehensive Evaluation for the River Source Heat Pump Energy Supply System Based on Dynamic Weighting. In Proceedings of the 2021 3rd Asia Energy and Electrical Engineering Symposium (AEEES), Chengdu, China, 26–29 March 2021; IEEE: Washington, DC, USA, 2021; pp. 1177–1184. [Google Scholar]
  18. Zhao, T.; Wang, S.; Zuo, J.; Duan, X.; Wang, X. Performance Evaluation of Smart Meters Based on Grey Relational Analysis. In Proceedings of the 2018 10th International Conference on Intelligent Human-Machine Systems and Cybernetics (IHMSC), Hangzhou, China,, 25–26 August 2018; IEEE: Washington, DC, USA, 2018; Volume 2, pp. 312–315. [Google Scholar]
  19. Zhang, Z.; Lu, H. Research on Power Spot Market Comprehensive Index System and Evaluation Method. In Proceedings of the 2020 IEEE 4th Conference on Energy Internet and Energy System Integration (EI2), Wuhan, China, 30 October–1 November 2020; IEEE: Washington, DC, USA, 2020; pp. 3479–3484. [Google Scholar] [CrossRef]
  20. Shi, H. A Method Used for Quality Assessment of Construction Project Based on FCE and Group-decision AHP. In Proceedings of the 2009 Second International Symposium on Electronic Commerce and Security, Nanchang, China, 22–24 May 2009; IEEE: Washington, DC, USA, 2009; pp. 333–336. [Google Scholar] [CrossRef]
  21. Jia, N.P.; You, Y.Q.; Lu, Y.J.; Guo, Y.; Yang, K.W. Research on the Search and Rescue System-of-Systems Capability Evalua-tion Index System Construction Method Based on Weighted Supernetwork; IEEE Access: Washington, DC, USA, 2019; Volume 7, pp. 97401–97425. [Google Scholar]
  22. Jiang, F.; Guo, J.T.; Li, X.Y.; Chen, G.; Yang, W.C.; Wang, X.L.; Zhang, S.; Li, M. Evaluation of a Lead-Zinc Mine’s Ventilation System Based on Unascertained Measurement Model. In Proceedings of the 11th International Symposium on Computational Intelligence and Design, Hangzhou, China, 8–9 December 2018; pp. 208–211. [Google Scholar]
  23. Cheng, J.; Luo, Y. Mathematical models for optimizing and evaluating mine ventilation systems. In Proceedings of the 13th United States/North American Mine Ventilation Symposium, Sudbury, ON, Canada, 13–16 June 2010; pp. 387–393. [Google Scholar]
  24. Zhou, Z.-Y.; Kizil, M.; Chen, Z.-W.; Chen, J.-H. A new approach for selecting best development face ventilation mode based on G1-coefficient of variation method. J. Cent. South Univ. 2018, 25, 2462–2471. [Google Scholar] [CrossRef]
  25. Yan, F.; Li, Z.-J.; Dong, L.-J.; Huang, R.; Cao, R.-H.; Ge, J.; Xu, K.-L. Cloud model-clustering analysis based evaluation for ventilation system of underground metal mine in alpine region. J. Cent. South Univ. 2021, 28, 796–815. [Google Scholar] [CrossRef]
  26. Gao, J.J. Establishments and Applications of Evaluation Index System for Complex Ventilation Network Optimization. Ph.D. Thesis, Liaoning Technical University, Fuxin, China, 2017. [Google Scholar]
  27. Liu, Y.; Liu, J.; Shao, G.; Yu, J. Research on Construction of Evaluation Index System of R&D Platform. In Proceedings of the 2021 IEEE Asia-Pacific Conference on Image Processing, Electronics and Computers (IPEC), Dalian, China, 14–16 April 2021; IEEE: Washington, DC, USA, 2021; pp. 891–894. [Google Scholar]
  28. Yu, H.; Li, L.; Zhang, Z.; Jin, M. Screening of Effectiveness Evaluation Index and Construction of Network Index System of Command and Control System. In Proceedings of the 2019 IEEE 3rd Information Technology, Networking, Electronic and Automation Control Conference (ITNEC), Chengdu, China, 15–17 March 2017; IEEE: Washington, DC, USA, 2019; pp. 417–424. [Google Scholar]
  29. Li, X.R.; Zhou, J.C.; Li, B.Y.; Wang, F. Integrated assessment of Mine Ventilation System Safety. Coal Technol. 2013, 32, 80–81. [Google Scholar]
  30. State Administration of Work Safety of China. Technical Conditions of Ventilation for Coal Mine Worker Mining(AQ1028-2006); State Administration of Work Safety of China: Beijing, China, 2006.
  31. State Administration of Work Safety; State Administration of Coal Mine Safety. The Safety Regulation for Coal Mining; Coal Industry Press: Beijing, China, 2016.
Figure 1. Primary model of evaluation index system.
Sustainability 13 11810 g001
Figure 2. The results of index weight.
Sustainability 13 11810 g002
Figure 3. Comprehensive evaluation results.
Sustainability 13 11810 g003
Table 1. Reconstruction scheme of the Sihe mine ventilation system.
SchemeDescriptionModification Works
1Close the No. 3 RAS, otherwise no changeConstruction of closed wall on both sides of the No. 3 ventilation shaft bottom
2Change the No. 3 RAS to AIS, otherwise no changeDismantle fan and auxiliary devices in the No. 3 RAS; Add heating air room and other relevant facilities.
3Close the No. 1 RAS, otherwise no changeDismantle two closed walls in the No. 2 RAS; Open one wind bridge between the No. 1 RAS and the No. 2 RAS; Apply a closed wall on the north and south sides of the No. 1 RAS.
4Change the No. 1 RAS to AIS, otherwise no changeDismantle two closed walls between the No. 1 RAS and the No. 2 RAS; Apply one closed wall on the north and south sides of the bottom of the No. 1 RAS; Dismantle four closed walls between the general return wind roadway and the shunting yard in EMA.
5Close the No. 1 RAS and modify the Q4 area, otherwise no changeDismantle the air door between Lane 3015 and the North Transport on the basis of Scheme 3; Dismantle the air door between the east auxiliary tape roadway and the north tape roadway; Build one air door in the front of the second and third lanes of the No. 2 RAS, respectively.
6Change the No. 1 RAS to AIS and modify the Q4 area, otherwise no changeDismantle the air door between Lane 3015 and the North Transport on the basis of Scheme 4; Dismantle the air door between the east auxiliary tape roadway and the north tape roadway; Build one air door in the front of the second and third lanes of the No. 2 RAS, respectively.
Table 2. Index screening results of R clustering + coefficient of variation analysis.
Criterion LevelIndex CodeClustering CategoriesNonparametric TestCoefficient of VariationRetain or Delete
C1I120.4930.2315Retain
I220.1886Retain
I310.4530.1783Retain
I410.1876Retain
I510.1876Retain
I610.1586Delete
C2I750.4930.2559Retain
I1050.2285Retain
I940.6950.2583Retain
I840.2295Retain
C3I1120.6550.1723Delete
I1320.1843Retain
I123 0.2392Retain
C4I143 0.2536Retain
I154 0.2289Retain
I165 0.2395Retain
I171 0.2014Delete
C5I18210.1799Delete
I1920.2048Retain
I203 0.2142Retain
Table 3. Value of Evaluation Scheme.
IndicatorScheme 1Scheme 2Scheme 3Scheme 4Scheme 5Scheme 6
I112.2512.5314.1514.813.7914.44
I21.431.431.831.831.831.83
I30.850.8510.8930.8820.8570.862
I42.572.602.732.762.722.76
I595.295.291.993.598.4100
I70.170.170.170.170.170.17
I85.275.285.275.285.275.28
I938.5936.9826.5024.0729.9027.13
I100.0005660.0003730.0023120.0026010.0023310.002818
I121343.31319.11194.41135.31239.91177.6
I131.6381.6221.6331.6331.6371.616
I1480.379.269.164.273.670.3
I150.7850.8180.7150.8520.7540.85
I1629.3830.5517.2419.8921.8723.75
I19111111
I20111111
Table 4. The relevant parameters of the schemes calculated by simulation software.
Scheme123456
No. 3 RASNegative Pressure (Pa)\\1795.71712.01719.61633.1
Service Rating (KW)\\463.8449.9451.2436.2
Air volume (m3/s)\\258.3262.8262.4267
No. 1 RASNegative Pressure (Pa)1780.21742\\\\
Service Rating (KW)428.1425\\\\
Air volume (m3/s)240.5244\\\\
No. 2 RASNegative Pressure (Pa)2250.82184.91740.91596.11910.31762.7
Service Rating (KW)915.2894.1742.3689.2802.1741.4
Air volume (m3/s)406.6409.2426.4431.8419.9425.5
Total Power (KW)1343.31319.11194.41135.31239.91177.6
Effective Air Flow Rate of Mine (%)85%85.1%89.3%88.2%85.7%86.2%
Distribution of Three Zones0.0005660.0003730.0023120.0026010.0023310.002818
Equivalent Orifice12.2512.5314.1514.8013.7914.44
Table 5. Parameters of ventilation system before and after renovation.
ItemsBefore RenovationAfter Renovation
No. 1 RASNo. 2 RASNo. 3 RASNo. 1 RASNo. 2 RASNo. 3 RAS
Air Supply/DemandDemand Airflow (m3/min)10,80010,8007200None80006800
Supplying Airflow (m3/min)14,46022,86010,140None20,06811,318
Supply/Demand Ratio1.34:12.12:11.41:1None2.51:11.67:1
Rationality of
Resistance
Percentage of Inlet Section Resistance18.1%33.14%41.41%None18.62%67.01%
Percentage of Return Section Resistance33.2%33.19%58.59%None35.68%32.99%
Percentage of Using Section Resistance48.7%33.67%0%None45.70%0%
Rationality of
Economic
Exhaust Air Rate (m3/min)14,46022,8609900None25,21811,318
Negative Pressure (Pa)208031202330None24362030
Publisher’s Note: MDPI stays neutral with regard to jurisdictional claims in published maps and institutional affiliations.

