1. Introduction
Even though vehicular accidents at train grade crossing are a small fraction of global highway crashes [
1,
2], their high damage potential makes them very concerning [
3,
4]. Due to the large disproportion between the mass of the train and the road vehicle, most accidents involve serious injuries and deaths [
5,
6]. Furthermore, as rail cargo and passenger traffic increases [
7] the significant financial impacts derived from these incidents, including damaging vehicles, trains, and infrastructure, while simultaneously disrupting critical supply chain links, will be exacerbated [
8,
9]. Trains also transport large quantities of hazardous materials, which may be flammable, explosive, or toxic, and worsen potential financial and humanitarian impacts [
10,
11].
The extremely large inertia trains experience at nominal operating velocities makes emergency braking unfeasible [
12]. Therefore, railways always have the right of way and vehicular traffic should invariably stop in the path of an approaching train [
13]. However, as accidents increased over time, it became evident that warning systems were required at the crossings to avoid accidents [
14]. Train grade crossings can be classified as passive and active, depending on their existing safety measures. Among passive measures, railway warning signs and stop signs are the most widely used [
1]. Active measures include light and sound signals to catch the attention of the motorist and prevent them from traversing the railway when a train is approaching [
15]. Among the most frequent active measures are flashing lights in bright colors, sounds, and in some cases lowering barriers to block the intersection [
16].
Investment in passive and active safety measures for train grade crossings during the last 45 years has greatly reduced the number of accidents, injuries, and fatalities [
17]. However, over the last 10 years, accident reduction has plateaued and is unlikely to further decline in the future, even with continued safety investments, confounding stakeholders [
18]. Further research to understand railway crossers’ motivations and attitudes has been suggested as a mean to reduce accidents [
19]. Higher road traffic both in spatial and temporal criteria is an important factor, which may increase accidents, creating an important link to be explored. Efficient traffic flow at train grade crossings has the potential to reduce driving stress and reduce high-risk patterns in railway crossers [
3,
15].
Previous research has indicated that safety and traffic efficiency are interrelated [
20]. Daily commuter schedules for activities with high pressure arrival times (such as work or school) may cause higher-risk attitudes in drivers in light of incoming trains [
21]. Commercial drivers tend to adopt riskier behaviors at train grade crossings when facing tighter schedules [
22]. Furthermore, previous research has indicated that when sound signals and barriers are activated well in advance of the arrival of the train, creating longer wait times, the incidence of riskier behaviors increase [
8]. Frequent railway crossers are well-aware of these extended warning delays, and when in time pressure situations, they may decide to cross anyway, even bypassing lowered barriers [
13,
15].
The impact of train grade crossings on road traffic flow needs to be additionally evaluated in terms of economic activity disturbance, community inconvenience, and disruption to emergency services [
15]. Emergency services, such as firefighters and ambulances, have suffered near accidents and serious delays at train grade crossings [
13,
23]. Furthermore, there is evidence that previous experience with trains blocking intersections for long periods have increased the frequency of dangerous actions by vehicle drivers [
1]. Analyzing railway and road interaction is of critical importance to improve traffic flow, improve emergency services performance and reduce the risk of accidents [
11,
17].
Providing railway crossers with warnings well in advance of incoming trains to their intersections may give them the option to change their routes to avoid the traffic delay and potentially unsafe situations [
11]. Cellphone or car navigation tools in vehicles can be used to provide warnings that may cause commuters to modify their route or their schedule [
15]. In 1997, Texas proposed and tested the Advance Warning to Avoid Railroad Delays (AWARD) system [
24]. Although, the technical proof of concept was successful, the system was deemed as unnecessary. The selected pilot locations had low traffic on trains and cars while technology in that period involved large costs, which were considered unjustified by the project [
11,
25]. However, since then, the widespread adoption of vehicular navigation systems provides previously unavailable dynamic route calculation to the general public, allowing users to easily adjust routes according to changing road conditions. Moreover, in the last two decades, there has been a significant reduction of the cost of the implementation for sensory systems. Importantly, in the same time period, sustained investment in train grade crossing safety has not decreased the accidents at railway crossings, which even increased in some cases. Therefore, the implementation of an early warning system would be less technologically and financially challenging and could mitigate the stagnation in safety measure efficiency. Thus, further research on the implementation of such a system is required, a gap that this study begins to address [
17]. The warning system proposed in the proposed research will not be based on the AWARD system, considering the 24-year technology gap, which has increased the potential applications for motorist navigation systems and significantly decreased the implementation costs. Additionally, its development in high population urban areas will be evaluated in future stages, with an initial implementation in low population, high accident locations. The novel system removes the incentive of high-risk behavior from railway crossers with advance notices of incoming trains, simultaneously improving local traffic flow.
To explore why accident reductions at train grade crossings have plateaued during the last decade, this study performs spatiotemporal analyses on data of accidents at those locations. Accidents are characterized to ascertain their potential link with daily community activities. The parameters will be applied to the development of an advanced warning system for railway crossers. The system will send an advanced notice of an incoming train to the cellphone or car navigation system of interested parties, allowing users to adjust their commutes. In the case of emergency vehicles, the proposed system will allow the efficient evaluation of the best route available. To avoid the failure of the 1997 AWARD system, this project will have a phased rollout, initially targeting the train grade crossings that have the highest level of accidents.
2. Materials and Methods
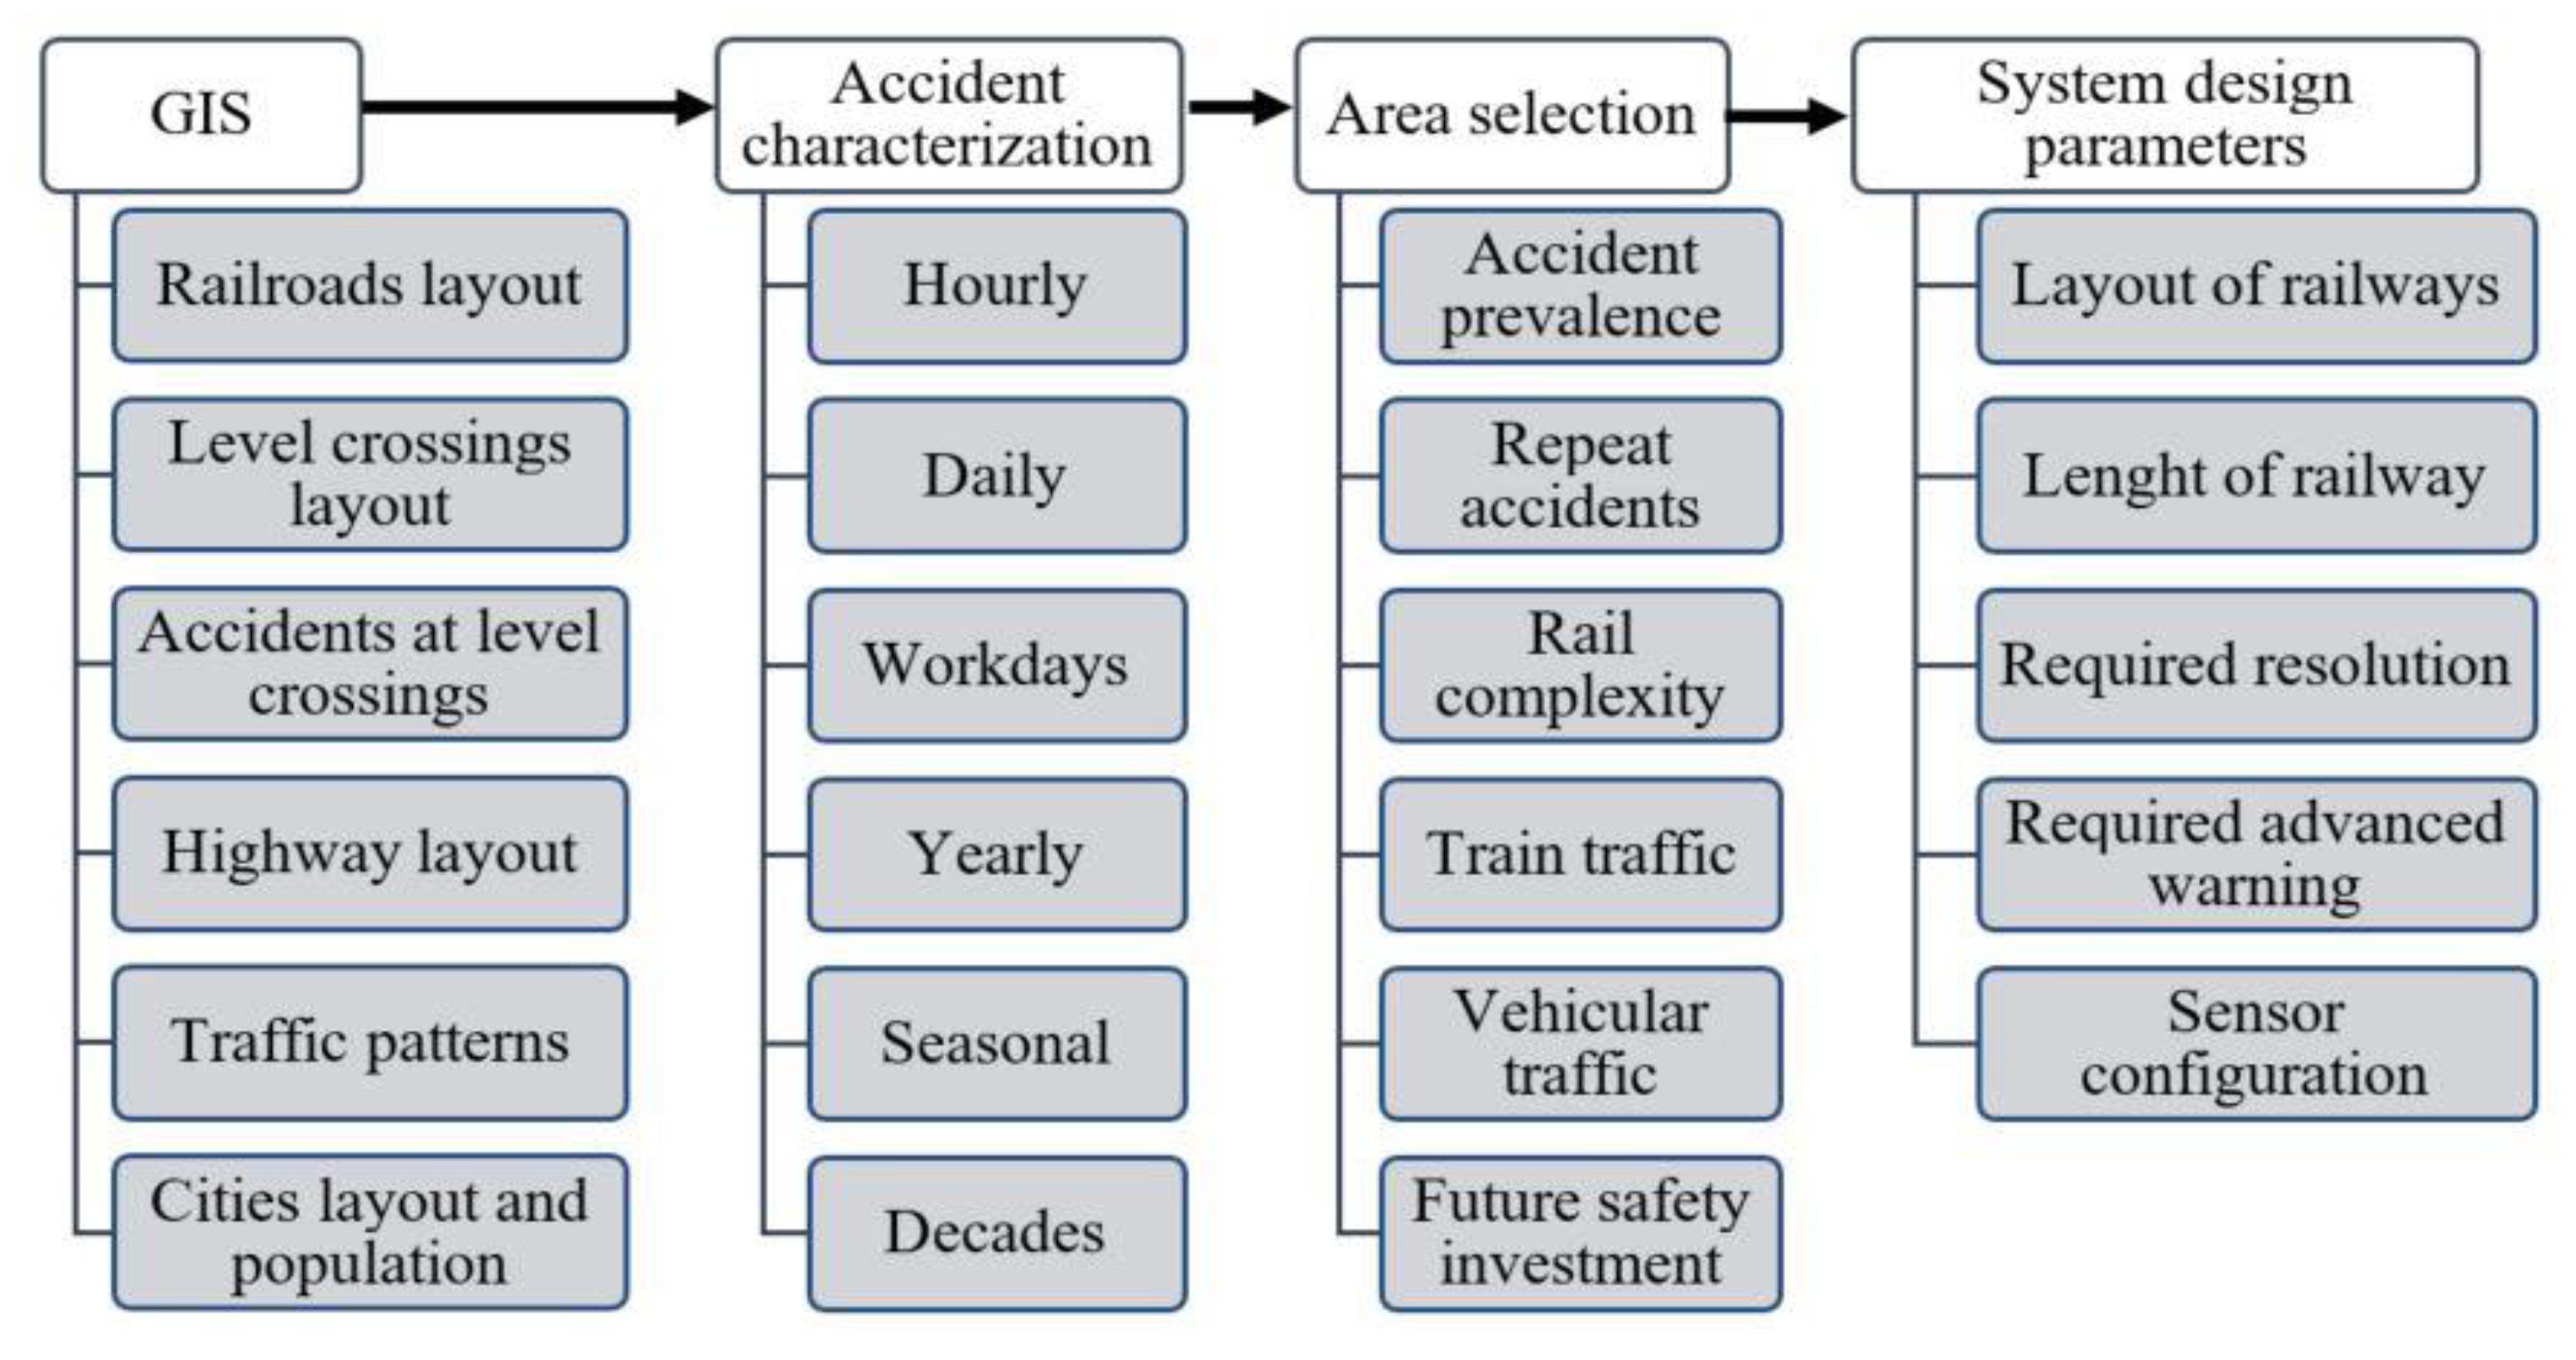
The framework on the implementation of the proposed advance warning system from train grade crossings followed the structure outlined in
Figure 1. Data related to train grade crossings layout, operation, and safety were incorporated into a Geographic Information System (GIS), performing diverse analyses to better assess and characterize the potential implementation of the system in diverse locations. Accident characterization, as indicated in the second column of the flow chart, provides stakeholders a better understanding of the underlying causality of accidents and operational safety at train crossings. Correlating community activities with diverse framework analyses in hourly or daily timescales will allow developers to assess the sustainability of the proposed system. Situations where further traditional safety measures (passive or active) cannot continue to improve accident reduction would require the advanced warning system. Once the effectiveness of the system has been ascertained, the implementation area will be selected, as indicated in column three of the diagram. Areas with urgent needs such as high accident incidence or presence of high-level repeat accidents in the same train grade crossings would most benefit from the initial implementation of the system. Additionally, areas with high railway layout complexity would need to be segmented to allow the system’s proper implementation. Therefore, the initial implementation of the system would benefit from having unique railways with low complexity and higher train traffic on the lines. Once the area has been selected, operational parameters of the system will be identified. The layout and spacing of the sensors will depend on the railway’s layout, length, the detection resolution, and required warning to motorists, among other factors. The steps outlined in
Figure 1 will be taken sequentially to implement the proposed system.
The proposed method evaluates data related to train grade crossings layout, operation, traffic, and safety. Information from the Highway-Rail Crossing Database Files and Reports was provided by the Federal Railroad Administration [
26]. It was incorporated into GIS and overlaid with public data provided by diverse US agencies. Data for highway rail accidents from 1975 to 2019 were obtained from the Office of Safety Analysis of the Federal Railroad Administration [
27] and compiled into a single database to perform analyses on accidents at train grade crossing accidents for more than 45 years in the US. Geospatial data for railways in the continental US were downloaded from the Homeland Infrastructure Foundation—Level Data [
28]. Road data were retrieved from the Federal Highway Administration [
29] and from the Texas Department of Transportation [
30]. The configuration and population of cities in the continental US were evaluated from Census Bureau data [
31,
32]. GIS analyses characterize accidents at train grade crossings in the continental United States (US). Data analysis revealed patterns in transportation traffic and historical accident incidence, thus identifying potential candidates to install the advanced warning system.
3. Results
The data for highway rail accidents from 1975 to 2019 were evaluated according to their temporal and spatial characteristics to ascertain safety trends. The analyses characterized train grade crossing accidents for the development of an advanced warning system, which would aid in preventing accidents and improving vehicle and train traffic flow.
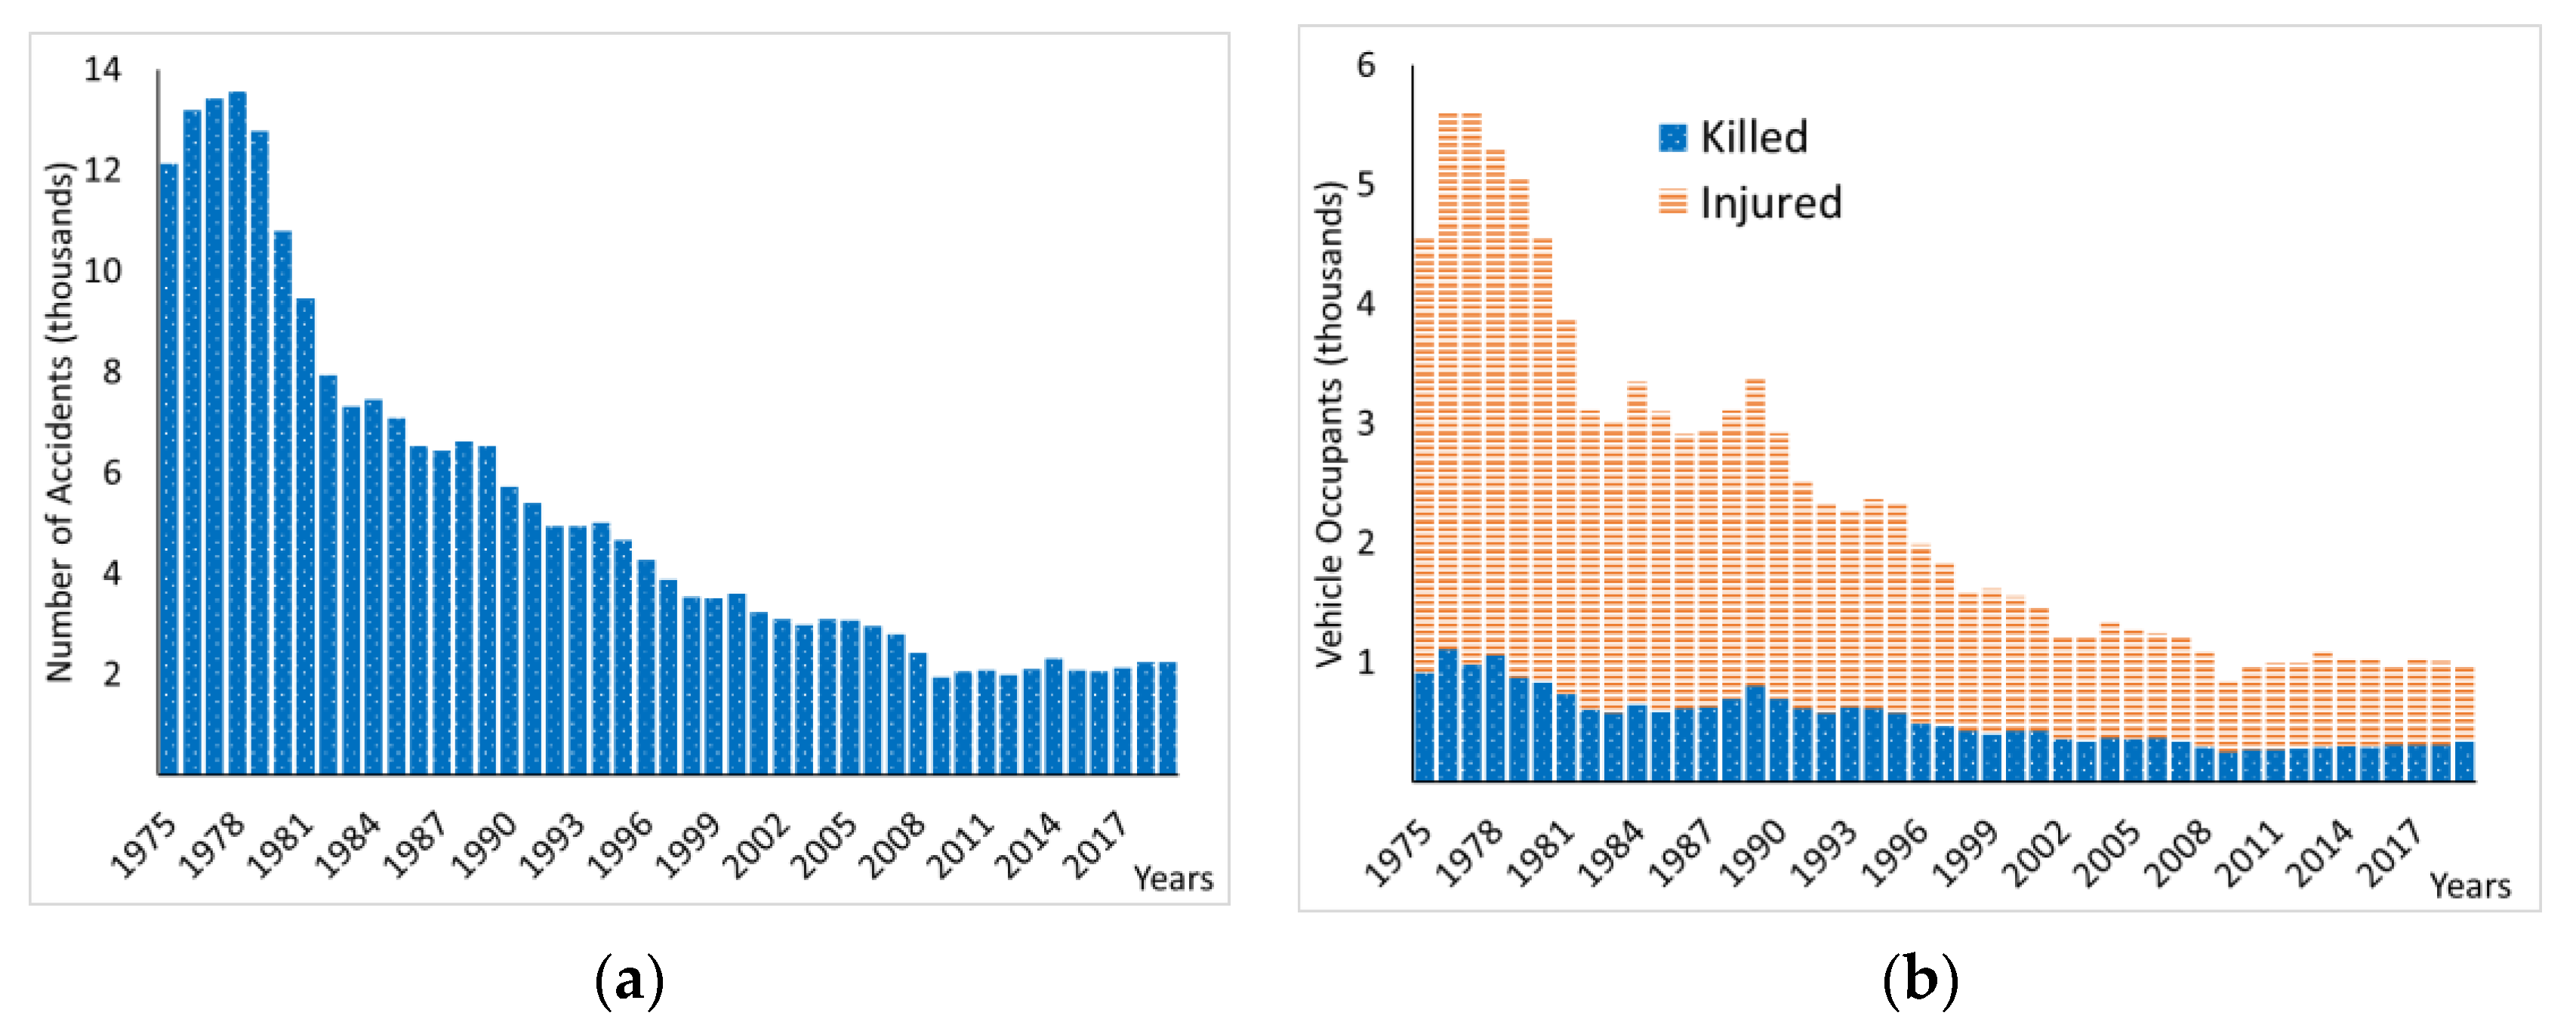
Figure 2a highlights an exponential 85% reduction in accidents from its peak in 1978 to its lowest levels in 2009. However, after the first decade of the 2000s, results indicate no significant decrease in accidents. Furthermore, some years in the last 10 years have seen increases in the number of accidents, as high as 19% compared with 2009.
Figure 2b indicates that vehicle passenger deaths and injuries have similarly decreased over the last four decades but have also leveled off in the last 10 years. Furthermore, there have been spikes in that timeframe as high as 41% (compared with 2009) for some years.
The data from the Federal Railroad Administration [
33] are presented in
Figure 3. The analyses highlight that several impacts from grade crossing accidents are at present significant and in some cases have increased.
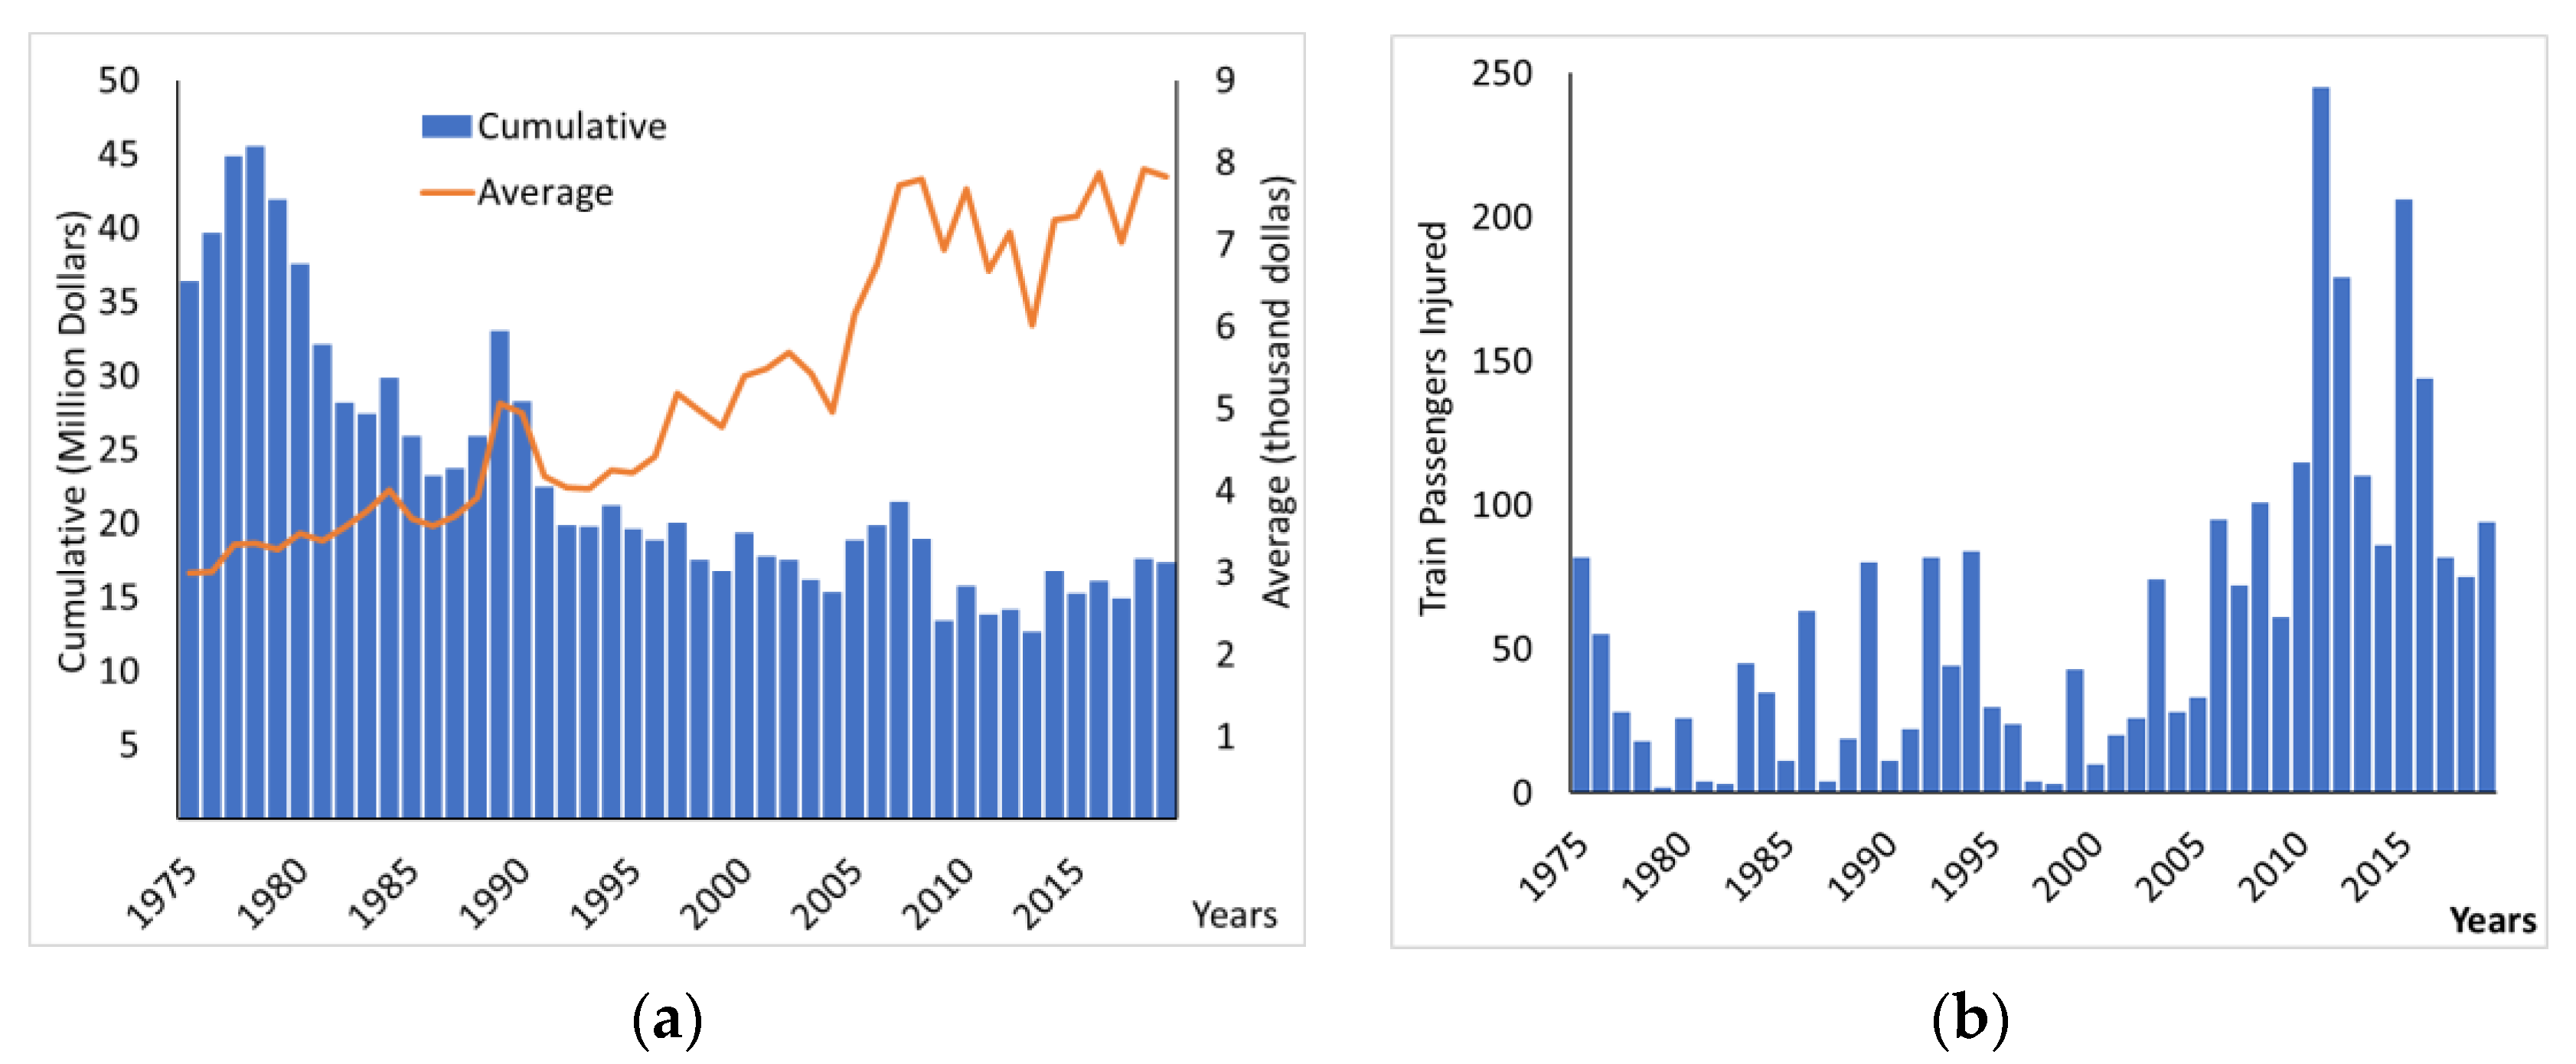
Figure 3a indicates that the yearly cumulative damages from vehicles decreased 75% from 1979 to 2009, considering damages adjusted for inflation by applying the Consumer Price Index (CPI) for new vehicles [
34]. However, the adjusted mean damage per accident almost tripled in the last 45 years, with a steady increase every year, indicating that the mean damage value per vehicle has increased. Additionally,
Figure 3b show the increase in the yearly number of injured train passengers resulting from accidents on train grade crossings. The combined information highlights that even as the number of accidents decreases, several of its negative implications continue to increase.
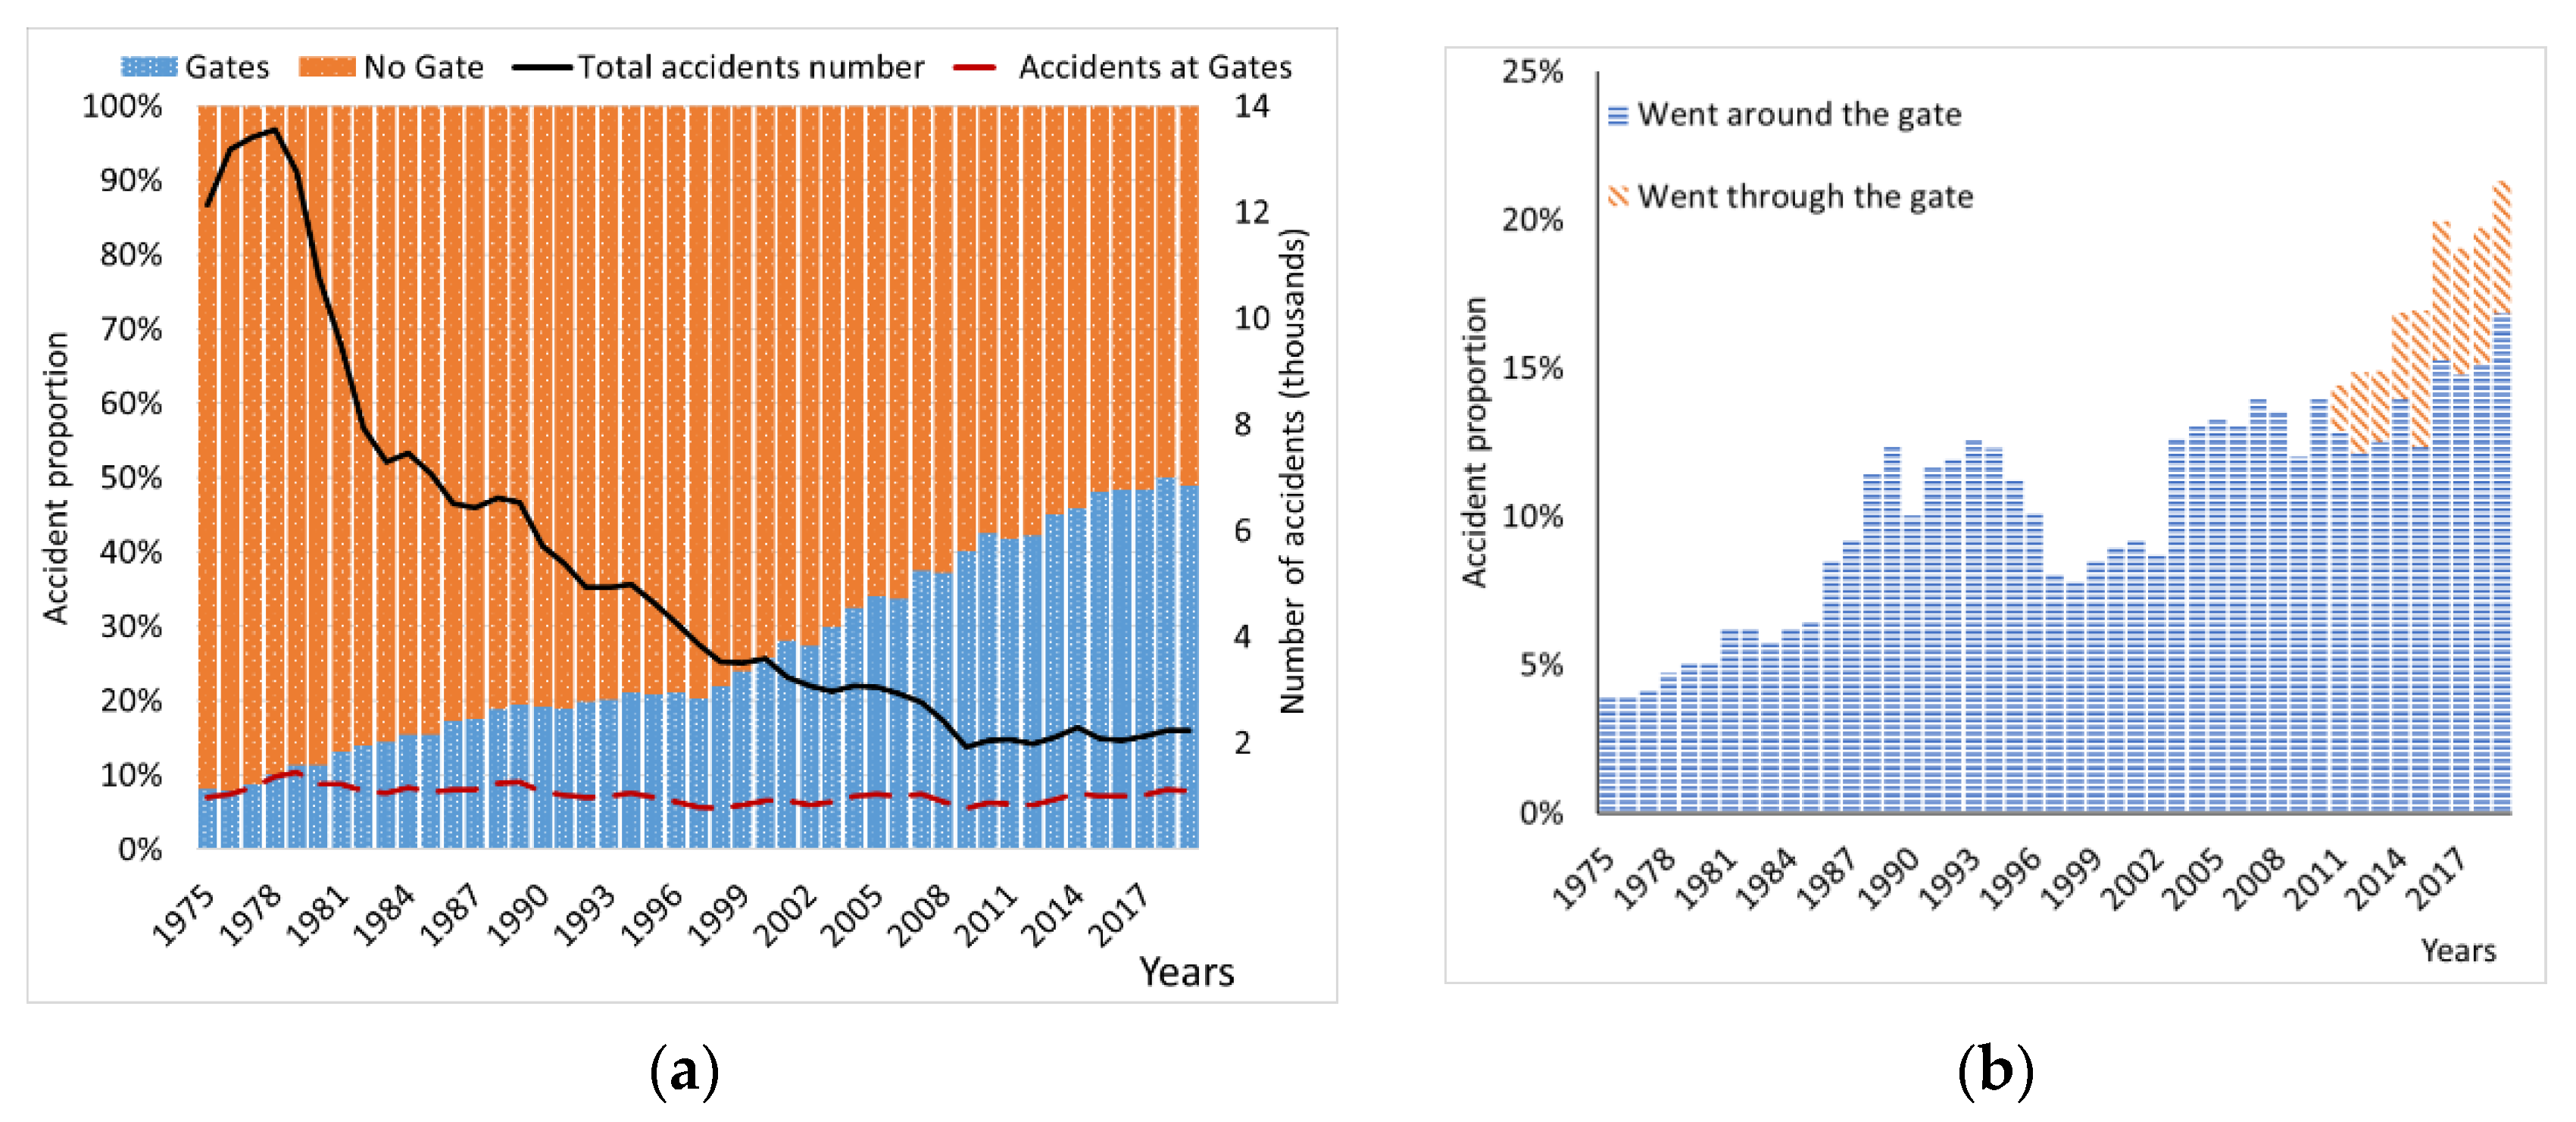
Train grade crossings with gates represent the highest level of active safety measures, blocking the intersection during the train’s approach [
35]. Historical data provided by the Federal Railroad Administration on historical grade crossings [
33] were evaluated to ascertain the improvement in these safety measures over the last five decades. From 1970–1979, only 4% of all grade crossings in the US were gated, while almost 14% were gated by 2019, generating a large safety improvement, more than tripling the number of safer intersections. However,
Figure 4a shows that accidents at gated intersections rose from less than 10% in 1975 to almost 50% in 2019. These results indicate that, despite the existing barriers, many accidents continue occurring, with highway users potentially invading the crossings when safety measures are already engaged. Furthermore, when vehicle user actions are evaluated, as indicated in
Figure 4b, the number of accidents caused by vehicles going around or through the barrier increased fourfold during the same period. Therefore, other additional safety measures, such as the advanced warning system proposed in this study, may complement crossing gates. The proposed system would help to better manage traffic patterns, considering that some of the factors that cause accidents are related to waiting time when barriers are activated and increasing traffic in the roads. The warning system will allow drivers to avoid blocked level crossings.
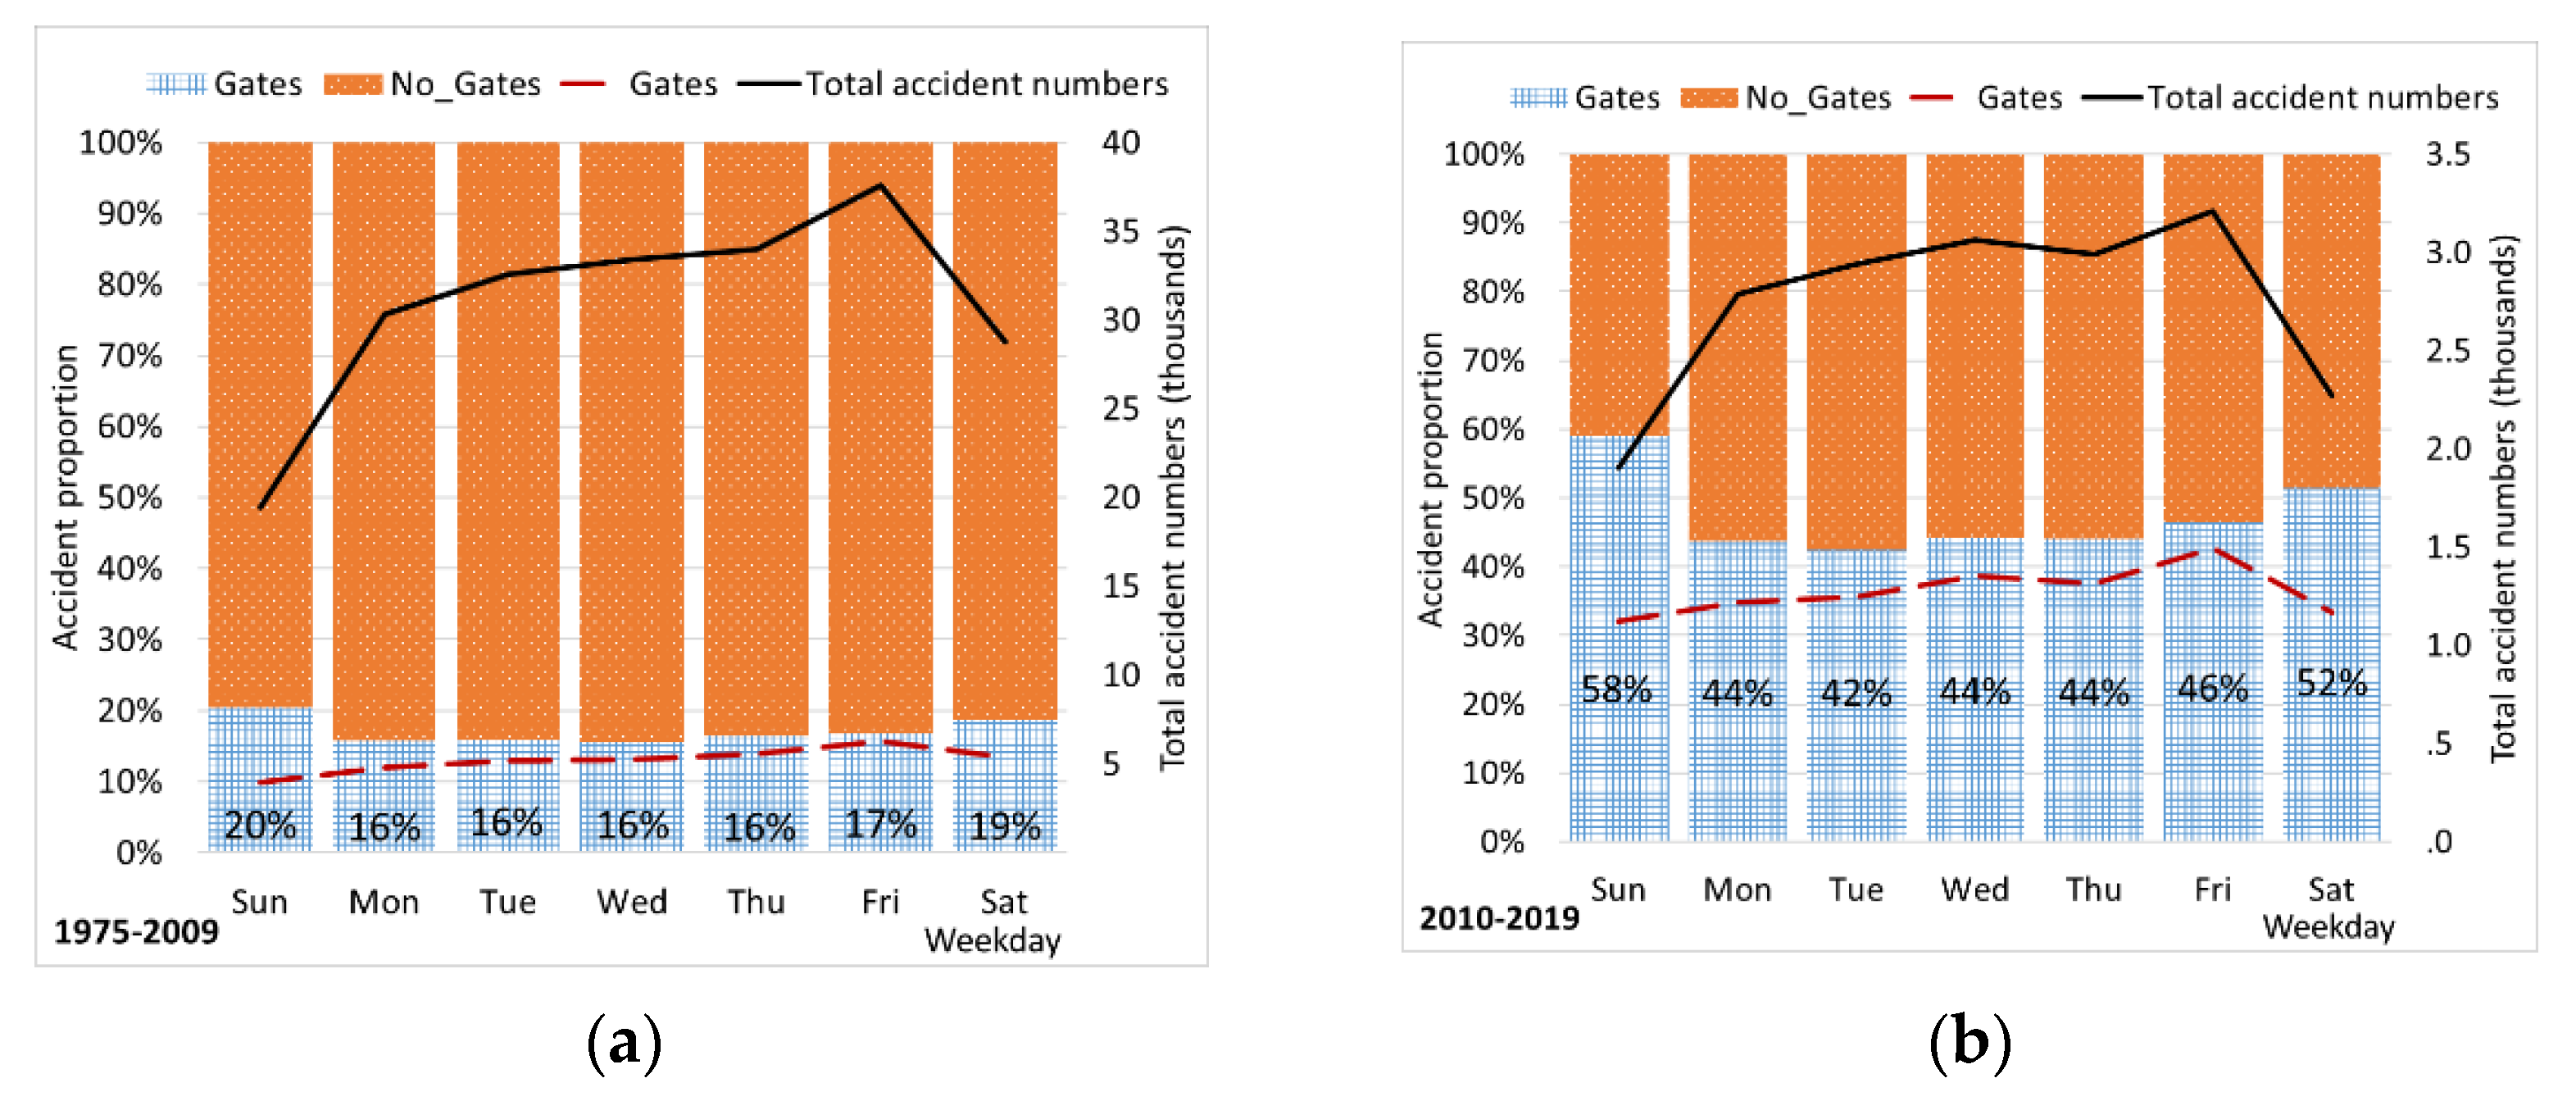
A comparison between sections (a) and (b) of
Figure 5 highlights the considerable increase in accidents at gated crossings after 2010. Furthermore, for both periods, it indicates that Monday through Thursday has the lowest proportion of accidents in gated crossings. Friday shows a slight increase in accidents in gated locations, with substantial increases during the weekend. On Sundays, after 2010, more than 58% of all accidents occurred at gated locations. The increase in traffic accidents at gated locations, coupled with the observed increase in crossing invasion related accidents, indicate that driving habits are determinant on the pattern of accidents at level crossings.
The results presented in
Table 1 suggest a pattern of accidents dependent on commuters’ schedules. From Monday to Friday after midnight, there is a reduction in the number of accidents, increasing after 7 a.m., with a slight reduction at noon lunch time. At 1 p.m. daily, an increase in incidents is observed, with the highest peak at 3 p.m., the end of the school day, with 5 p.m. having the third largest increase, coinciding with the end of the work day. Friday has the highest number of cumulative accidents (more than 17%), with the most significant hourly accident proportion between 5 p.m. and midnight, potentially reflecting of the social patterns at the start of a weekend.
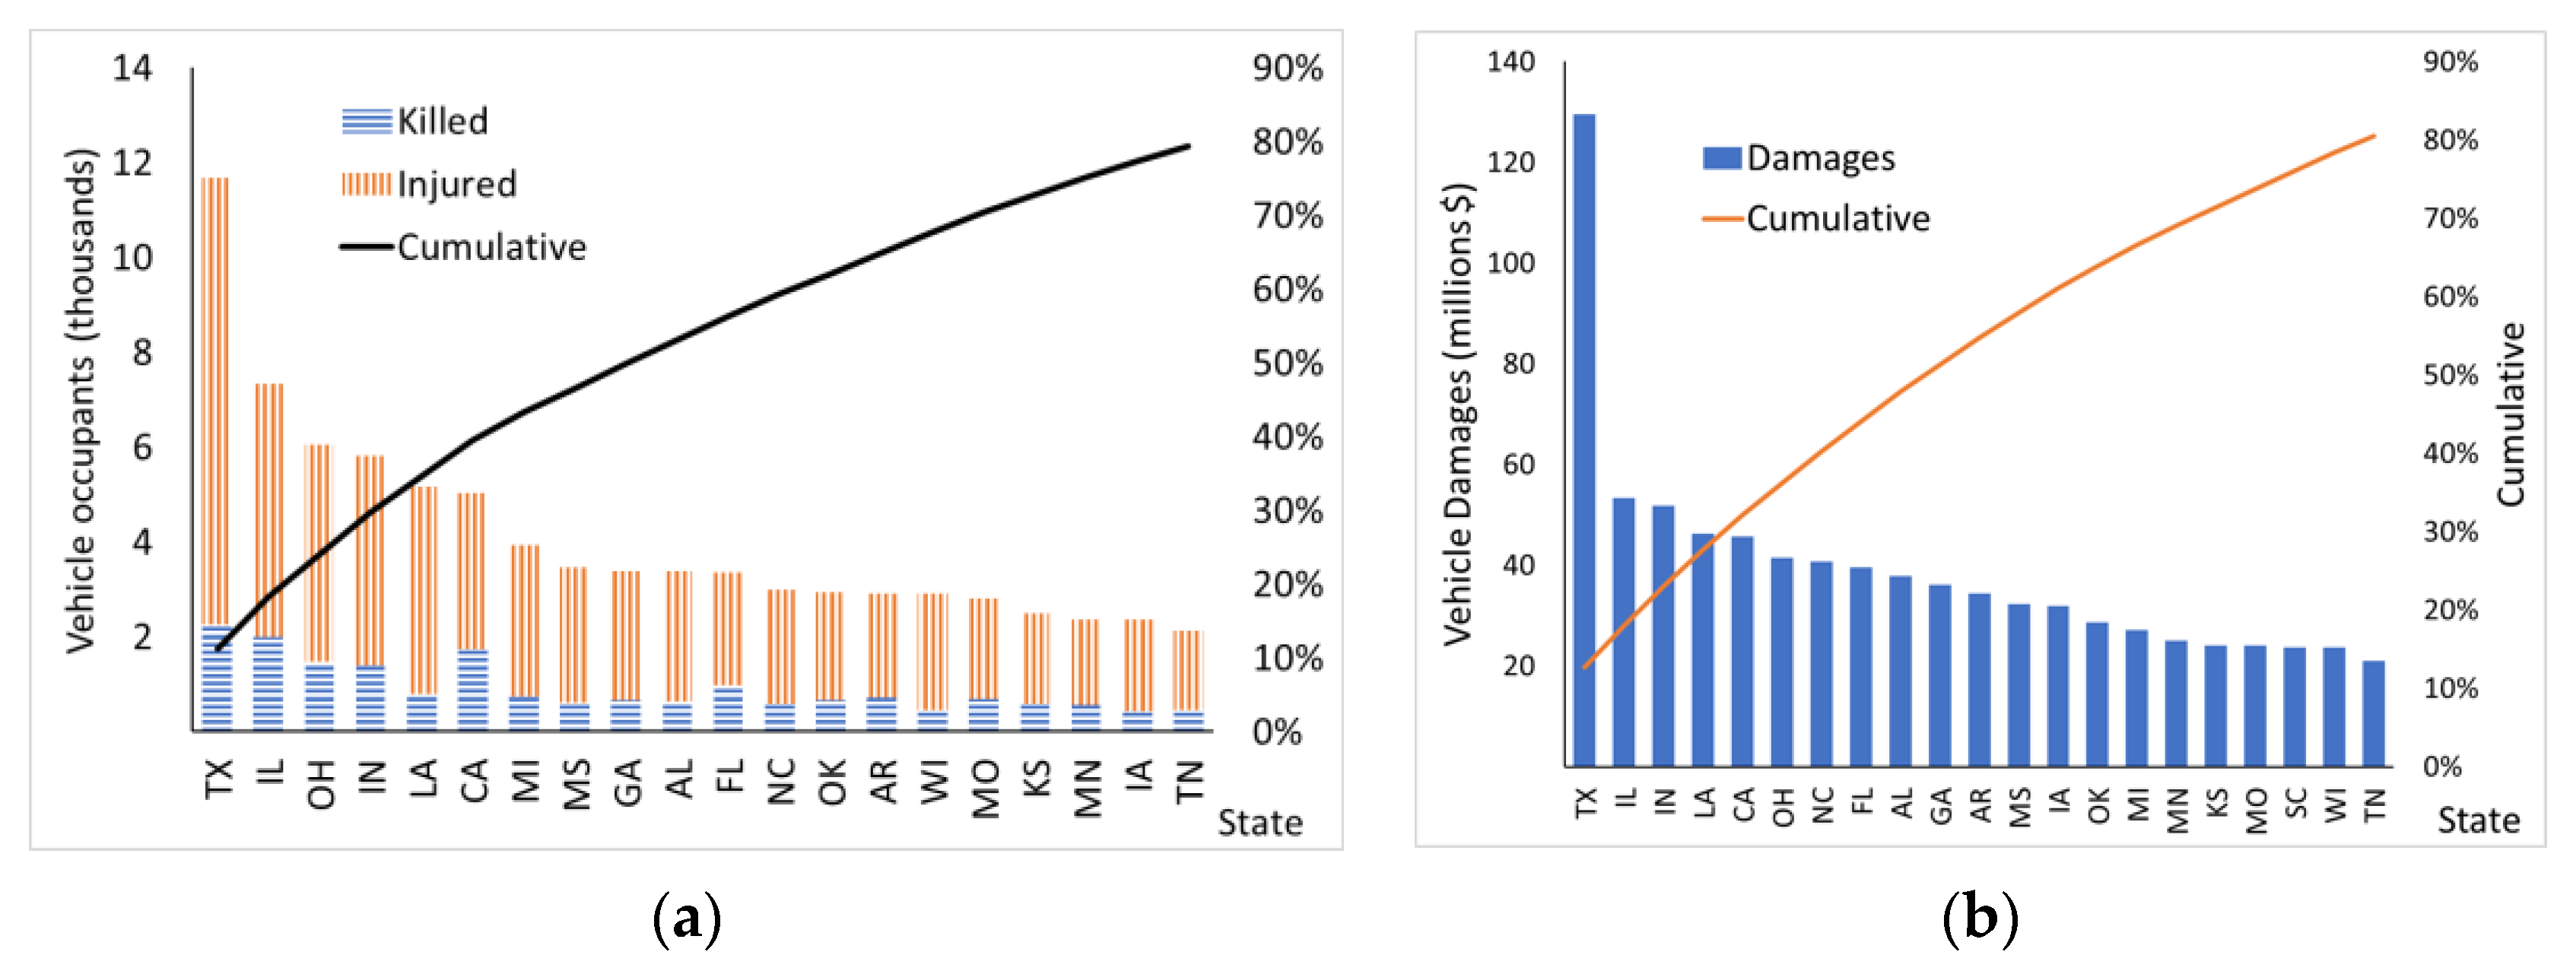
As indicated in
Figure 6, 20 US states accumulate more than 80% of vehicle passenger injuries, deaths, and damages. Texas has the highest number of combined injured and death vehicle occupants, with almost twice the number of injured when compared with Illinois, the second ranked state, as shown by
Figure 6a. Vehicle damages (adjusted for inflation), presented in
Figure 6b, display Texas as the state with the highest cumulative damages in the nation. Based on these results, the implementation of the proposed system may bring significant benefits for Texas.
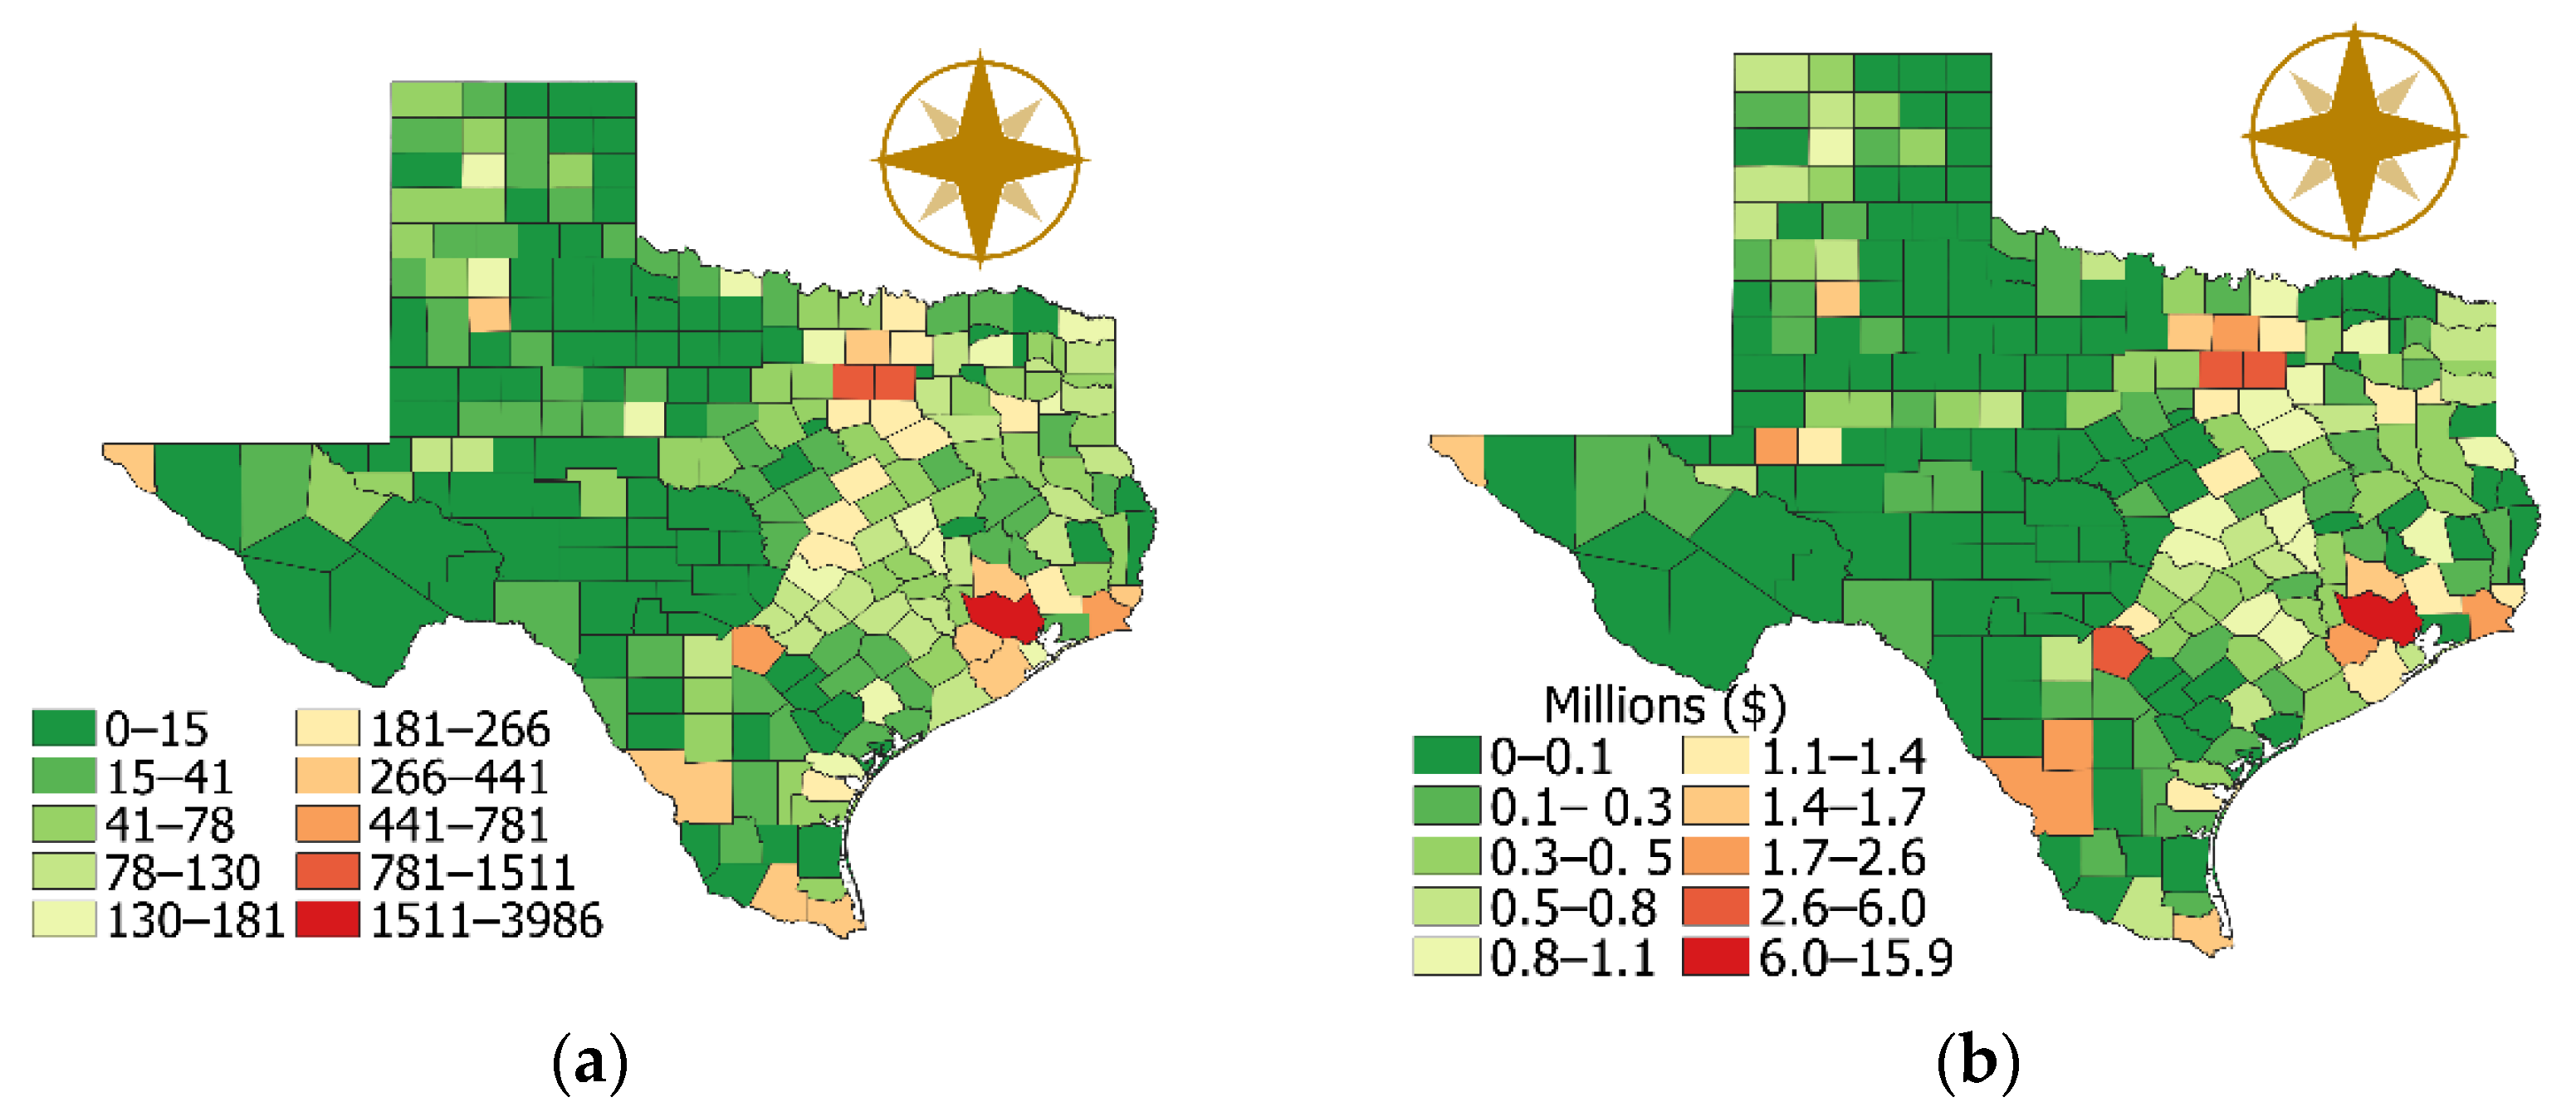
A geospatial analysis was implemented to identify the locations with the highest number of accidents, financial damages, injuries, and deaths caused by level crossing accidents in Texas, as shown in
Figure 7. The analysis will aid in identifying locations for the initial implementation of the proposed advanced warning system. Both maps indicate that the highest number of accidents and financial damages are concentrated mostly in large urban counties. Harris County, which contains Houston, had the highest number of cumulative accidents since 1975, almost 4000, with vehicular damages close to USD 16 million. Dallas and Tarrant Counties, home of the metropolitan area of Fort Worth and Dallas, had more than 2500 accidents and almost USD 11 million in damages. Bexar, containing the city of San Antonio, had almost 800 accidents with damages over USD 4 million.
Figure 8 also indicates that the highest number of injuries (
Figure 8a) and deaths (
Figure 8b) are accumulated in counties containing the largest cities. Harris County again has the highest number of vehicular deaths (170) and injuries (more than 1300), the Dallas-Fort Worth area had 130 deaths and more than 800 injuries, while Bexar County, home of the city of San Antonio, had 82 deaths and 324 injuries.
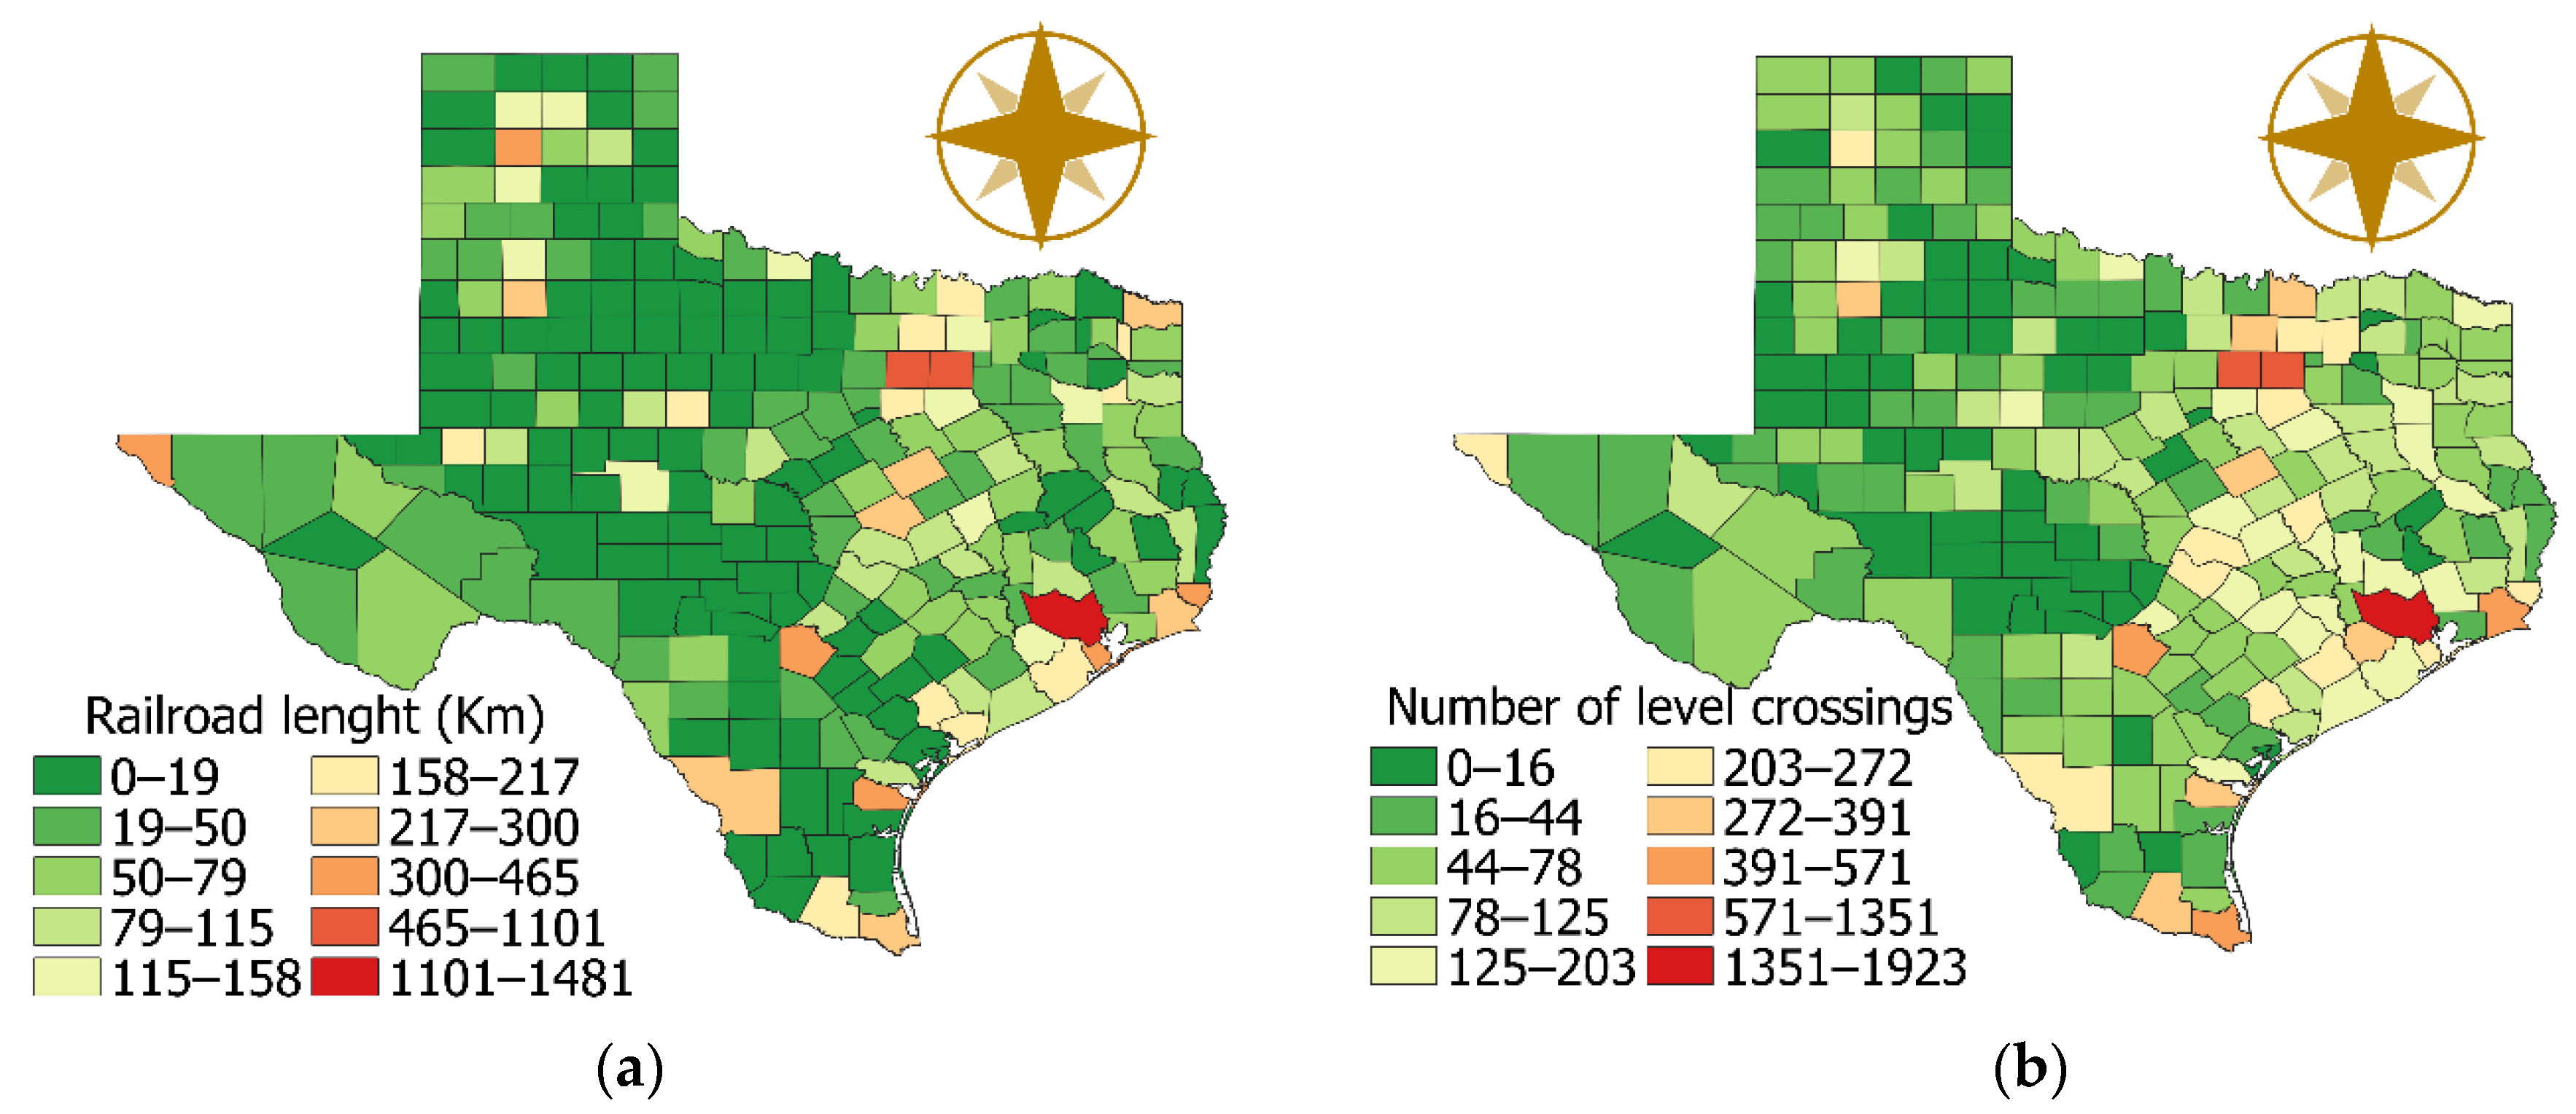
Other parameters such as the number of diverse train lines, grade crossings, and the length of the railways have significant importance on the logistics of the system.
Figure 9a,b indicate that the larger metropolitan areas have more complex railway systems. For instance, the Dallas and Tarrant County region has more than 2100 km of railways with 2231 crossings, Harris County has almost 1500 km of railway and 1923 crossings, while Bexar County has more than 469 km of railway with 571 crossings. On the other hand, a number of rural counties in Texas have a large number of accidents and only one or two railways traversing their geography, with less train grade crossings and complexity. Such counties can be a better location for the initial implementation of the proposed system in both avoiding the complex railway patterns of urban areas while providing an impactful reduction in traffic accidents.
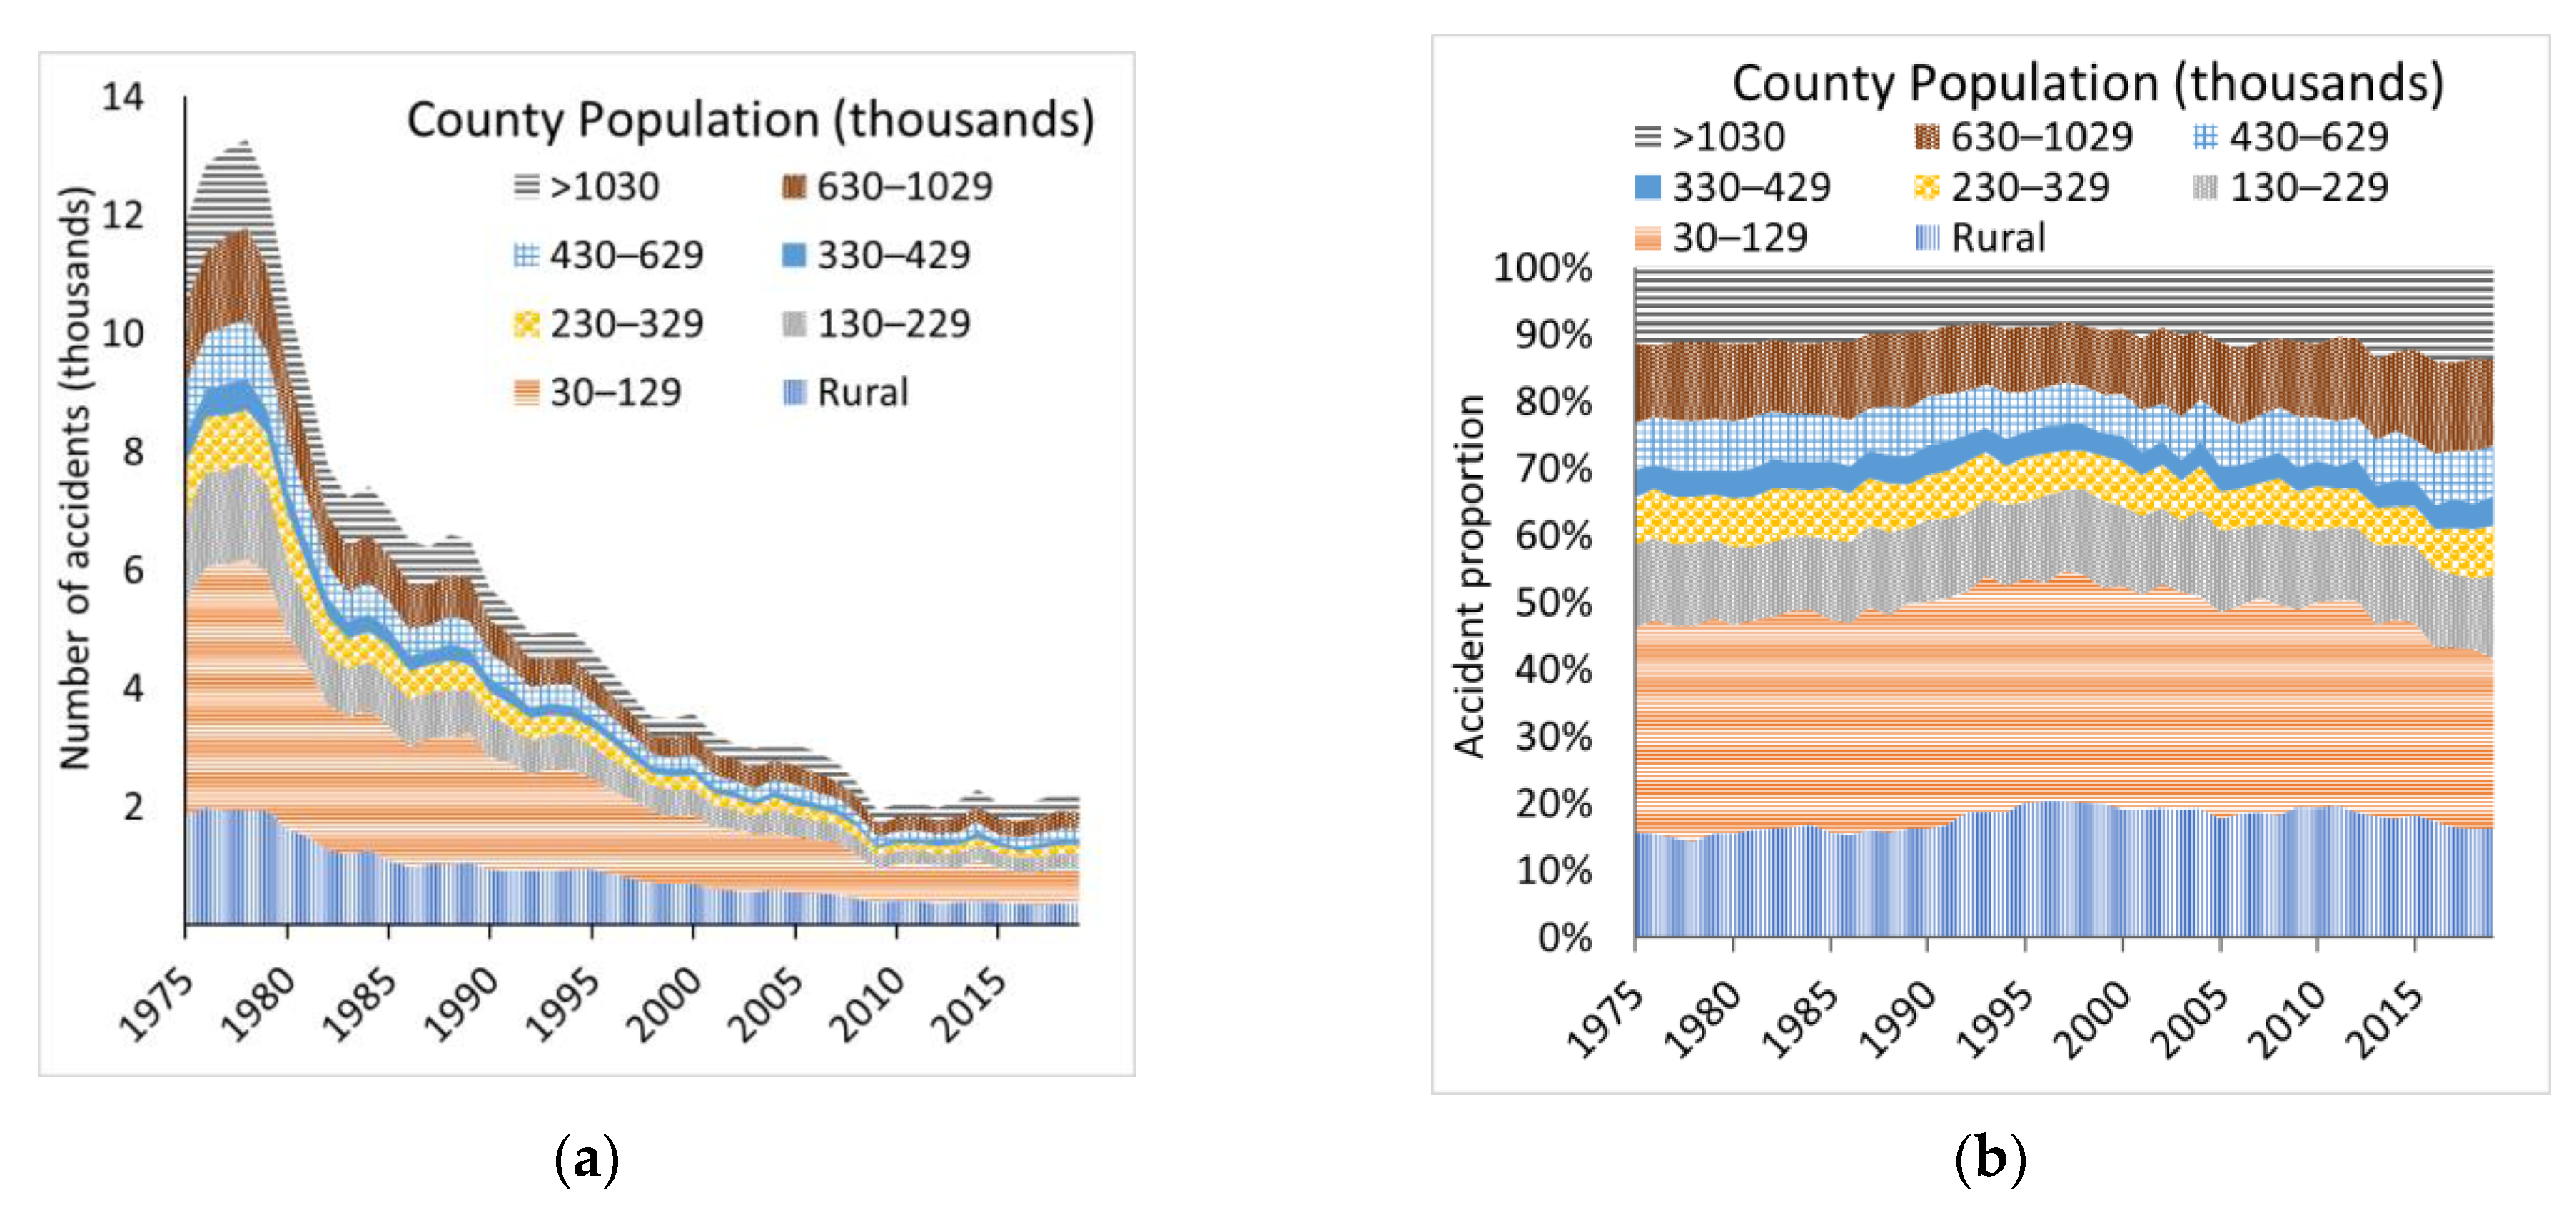
Further clarifying the benefits of the initial placement of the proposed warning system in rural locations with low population, a yearly accident analysis is shown in
Figure 10, classifying accidents by the population of the county of occurrence.
Figure 10a indicates that accidents had their most impactful initial reduction in counties with populations smaller than 130,000.
Figure 10b highlights that the proportion of accidents by county population has changed only slightly, with rural areas and counties smaller than 130,000 representing between 40 and 50% of the accidents. On the other hand, cities with populations of 630,000 and larger historically had between 17 and 28% of the accidents. Implementing the system in rural and small population counties will capture a large segment of the accidents at level crossings.
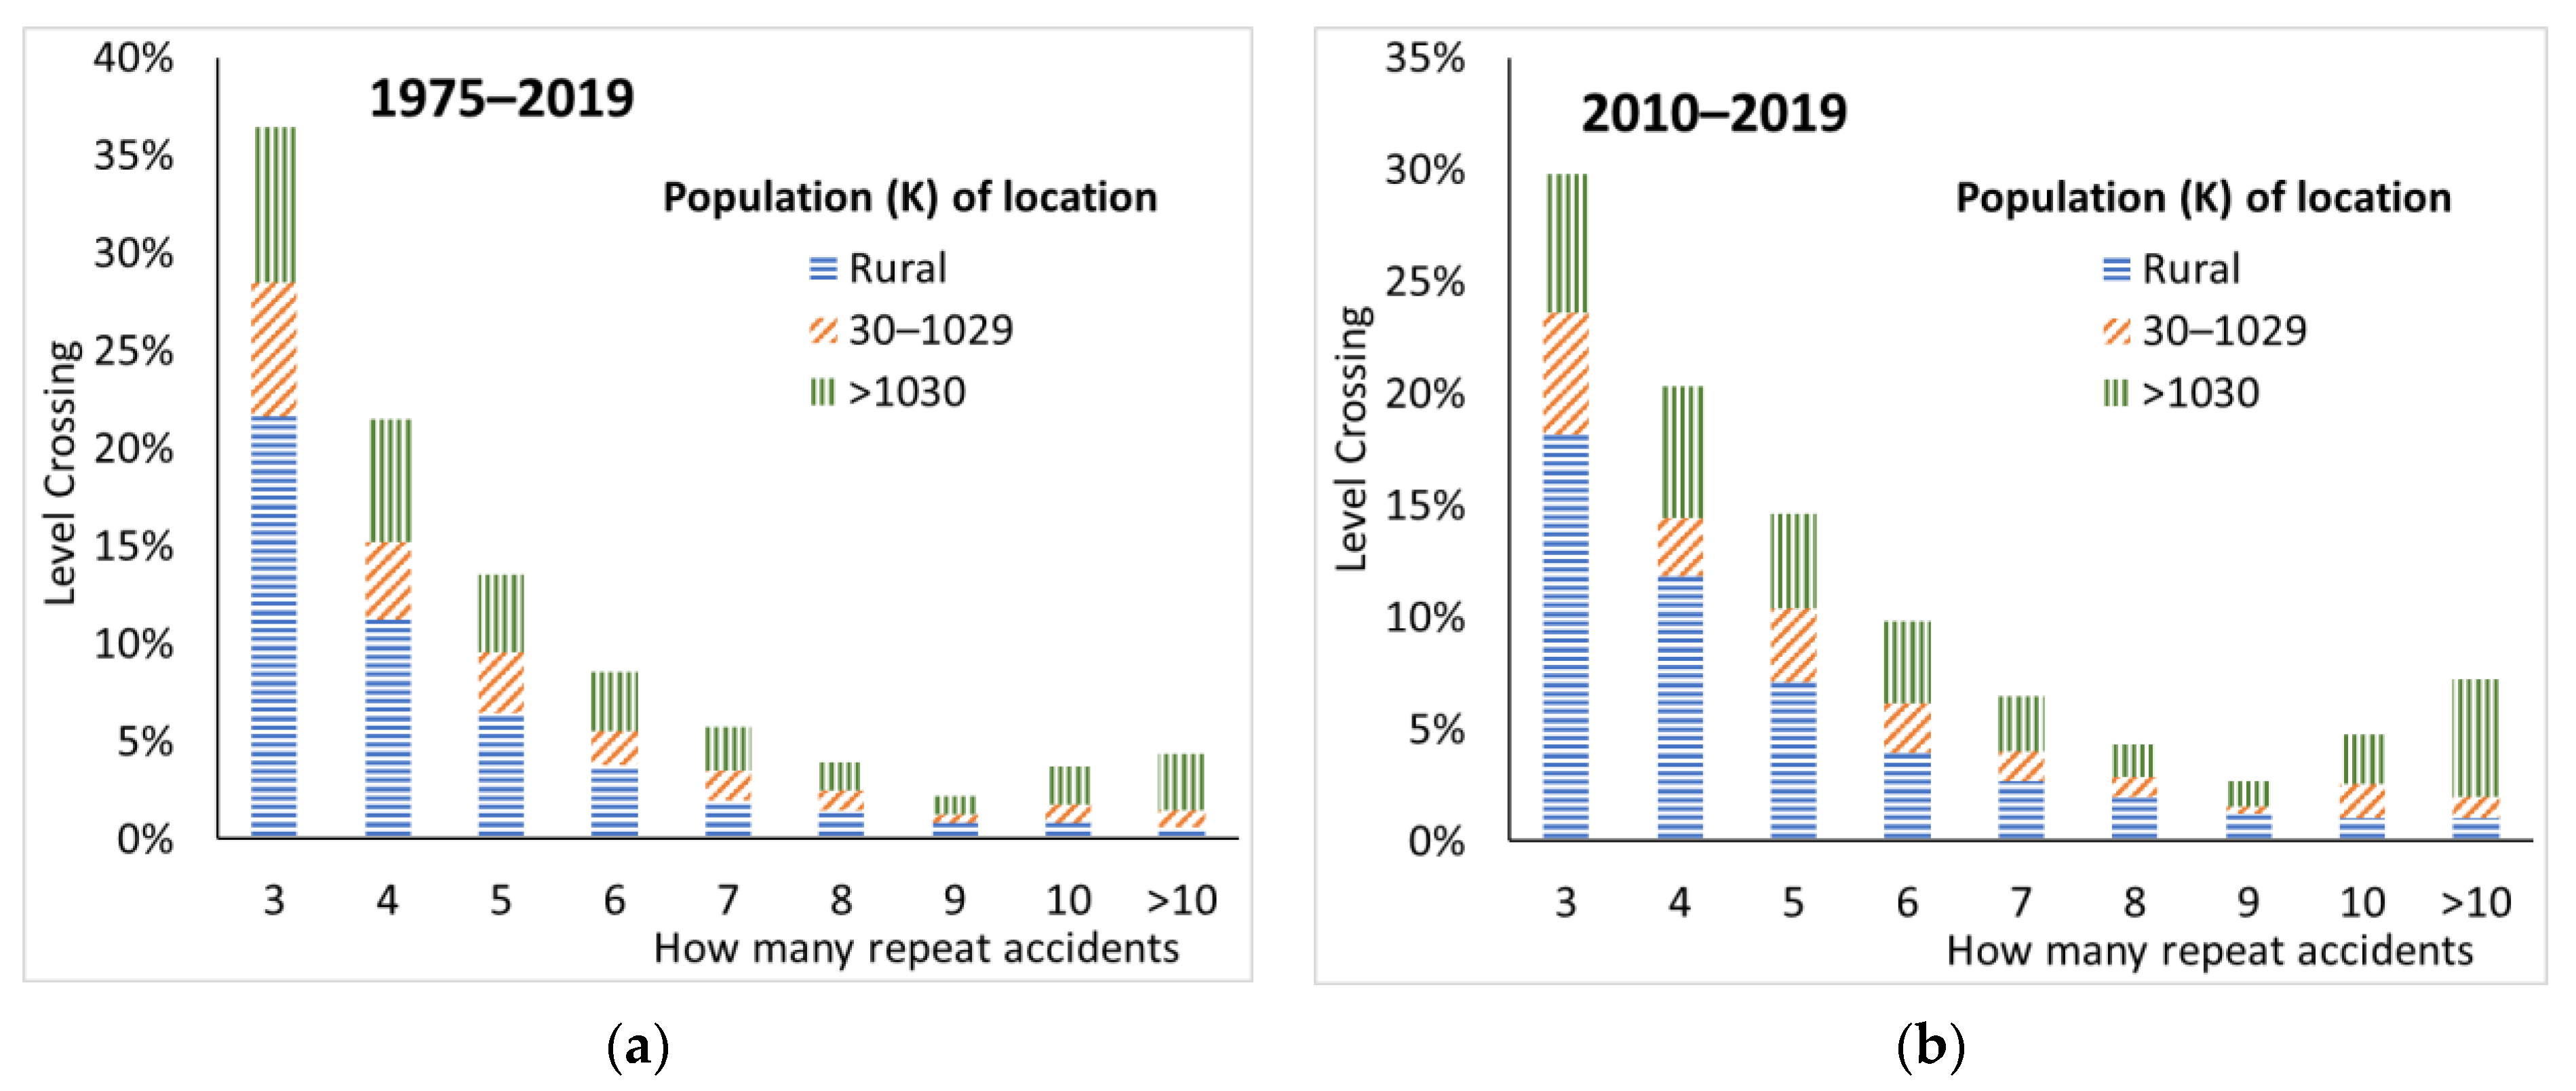
The Federal Railroad Administration (FRA) has indicated that one of the parameters that measures danger levels at train crossings is repetitive accidents on the same intersection over time [
36]. Evaluating grade crossings that had more than one accident for that period will provide an additional guideline on the optimal railways for the initial implementation of the proposed advance warning system.
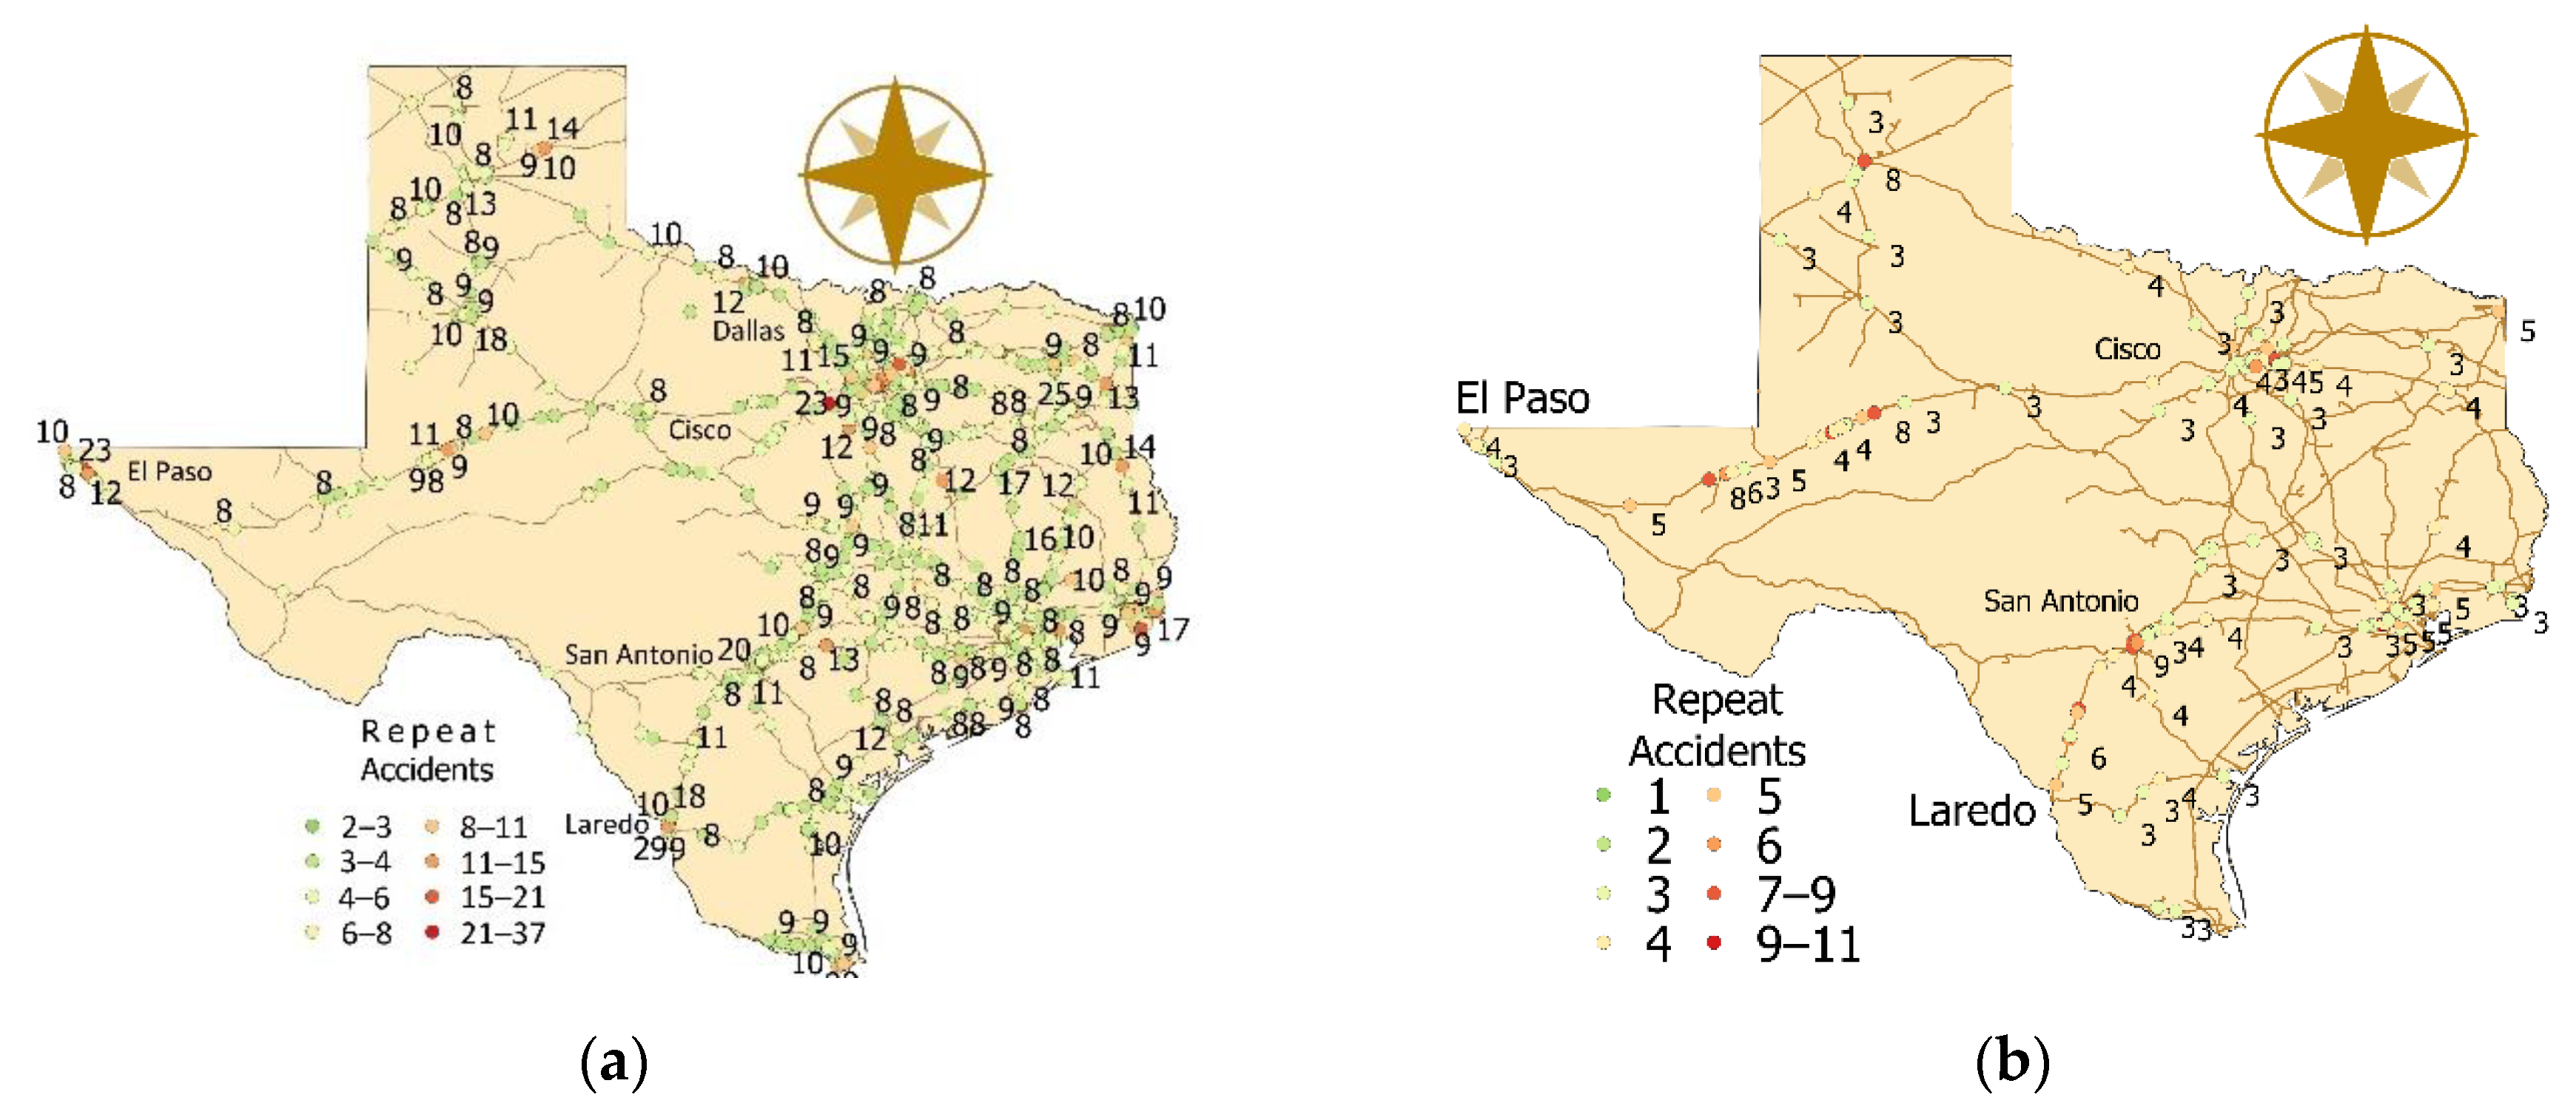
Figure 11a indicates that almost half of the level crossings in Texas with three or more repeat accidents are located in rural areas, and 20% of repeat accidents occur in small- and medium-size cities (30,000–230,000), with the remaining 30% occurring in the three largest cities in Texas. The results in
Figure 11b explore if the repeat accident factor has changed in more recent times. The results indicate that repeat accidents continue to be more frequent in rural and low population locations.
Figure 12a indicates that there is a noteworthy number of repeat accidents in individual rail lines traversing long stretches of rural and small-town counties in Texas. For instance, in West Texas, the line connecting Dallas with El Paso contains a considerable number of grade crossings with repeat accidents in both periods. Furthermore,
Figure 12b shows that there are at least two level crossings on this railway with eight accidents since 2010. The railway connecting San Antonio and Laredo is another example of a mostly unique line traversing rural counties with substantial number of accidents and repeat incidents at several crossings.
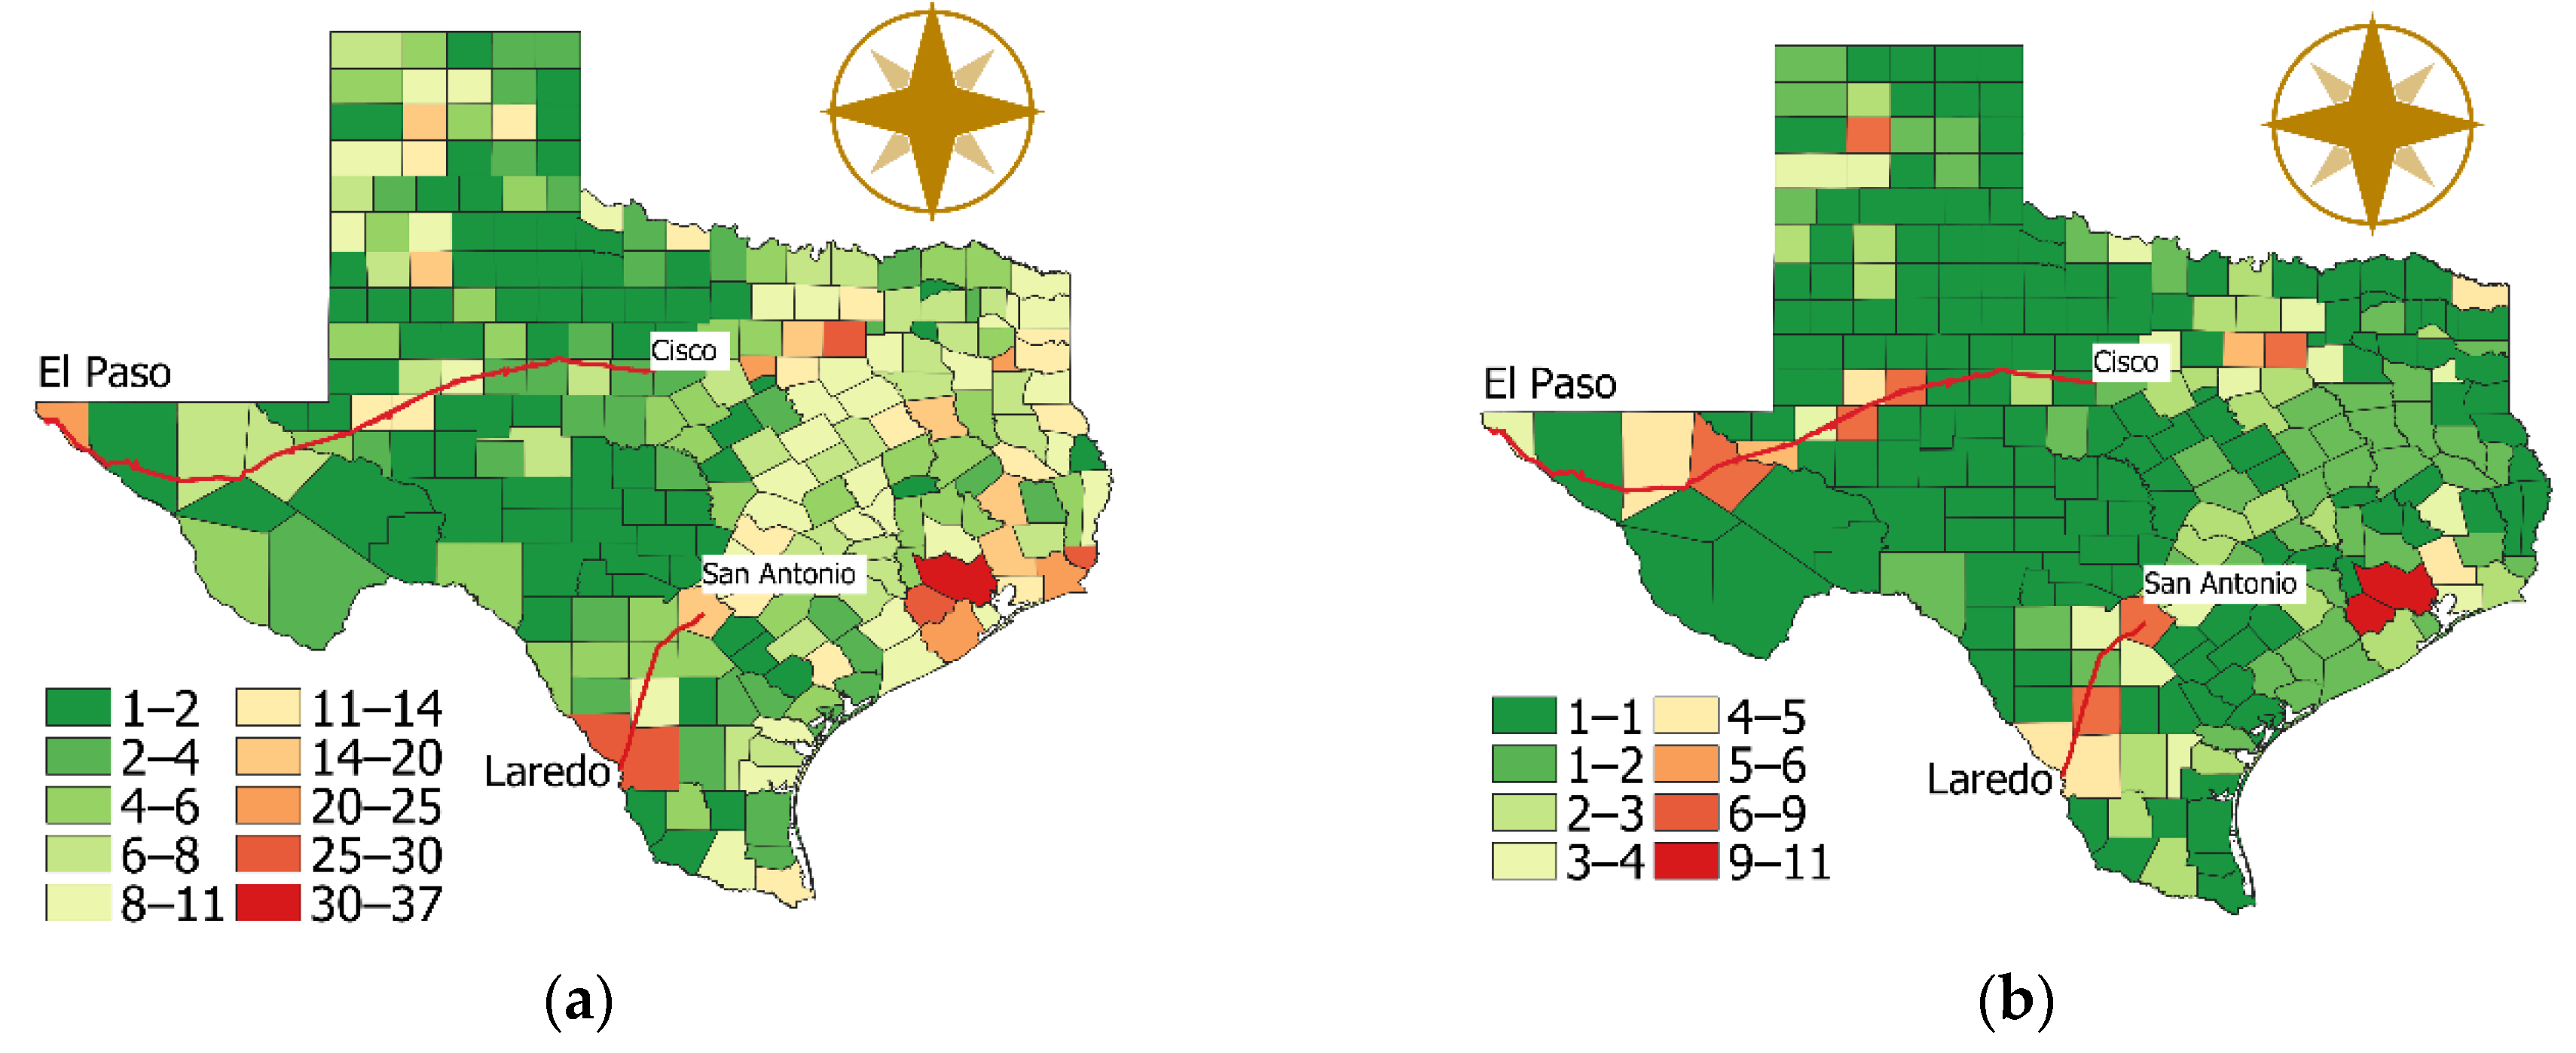
Figure 13a validates that a number of counties in rural locations and medium cities have a large number of repeat accidents. Therefore, the line between San Antonio and Laredo, Texas and from Dallas to El Paso, starting at Cisco, Texas are good candidates to develop the first stage of the proposed system. Since some of the level crossings with repetitive accidents could have received investments to improve their safety levels, the analysis was also performed for the last 10 years (2010–2019), as shown in
Figure 13b. The results continue showing significant number of repeat accidents at individual rail crossings. The San Antonio–Laredo line traverses La Salle County, which contains at least one level crossing in the range of six to nine repeat accidents. In the Cisco–Laredo line, three counties, Reeves, Midland, and Howard, also contain each at least one level crossing in the range of six to nine repeat accidents in the last decade.
4. Discussion
The study has indicated that railway crossing accidents are influenced by vehicular schedules and time pressure situations, which could cause drivers to disregard some safety measures and opt for riskier behaviors. Providing drivers with advance-targeted warnings on upcoming nearby level crossings activity would reduce accidents by efficiently rerouting drivers, avoiding the path of incoming trains. Furthermore, the proposed tool would allow efficient transit for emergency vehicles, which in many locations now find themselves blocked at grade crossings. As previously indicated, advanced targeted warnings for incoming trains has been proposed in the past. The Advance Warning to Avoid Railroad Delays (AWARD) system was successfully tested in 1997 in Texas [
24]. The system involved expensive sensors and receiving equipment, while no vehicle-integrated navigation systems existed at the time. Furthermore, the initial pilot location had low vehicle and train traffic, which, combined with the high cost of technology at the time, led to the conclusion that the project was not justifiable. For the initial implementation, identifying locations with lower railway layout complexity and higher accident risk will increase the project’s success probability, as previously indicated in this study. Therefore, lines containing grade crossings with higher levels of repeat accidents in less complex rail lines that traverse small- to mid-size cities would provide a suitable setting for the initial implementation of the proposed advance warning system. More complex rail lines could be evaluated after initial implementation.
An important design criterion for the proposed advanced warning system is the spacing between the sensors. The sensitivity of the system in tracking the trains will be determined by sensor separation. Equation (1) calculates the time for the next sensor acquisition in the system, a relevant factor determining the resolution of the system:
where
dsep is the separation between sensors in the railway,
St is the train speed, and
tnsa is the time for next sensor acquisition in the system. To evaluate how far in advance vehicle drivers will receive warnings of potential activity at level crossings, it is necessary to evaluate the distance between the motorist and the first sensor in the line that will report to the system. Equation (2) will aid the designers in properly calibrating the resolution and therefore the sensitivity of the system:
where
dmfs is the distance between the motorist and the first reporting sensor,
St is the train speed, and
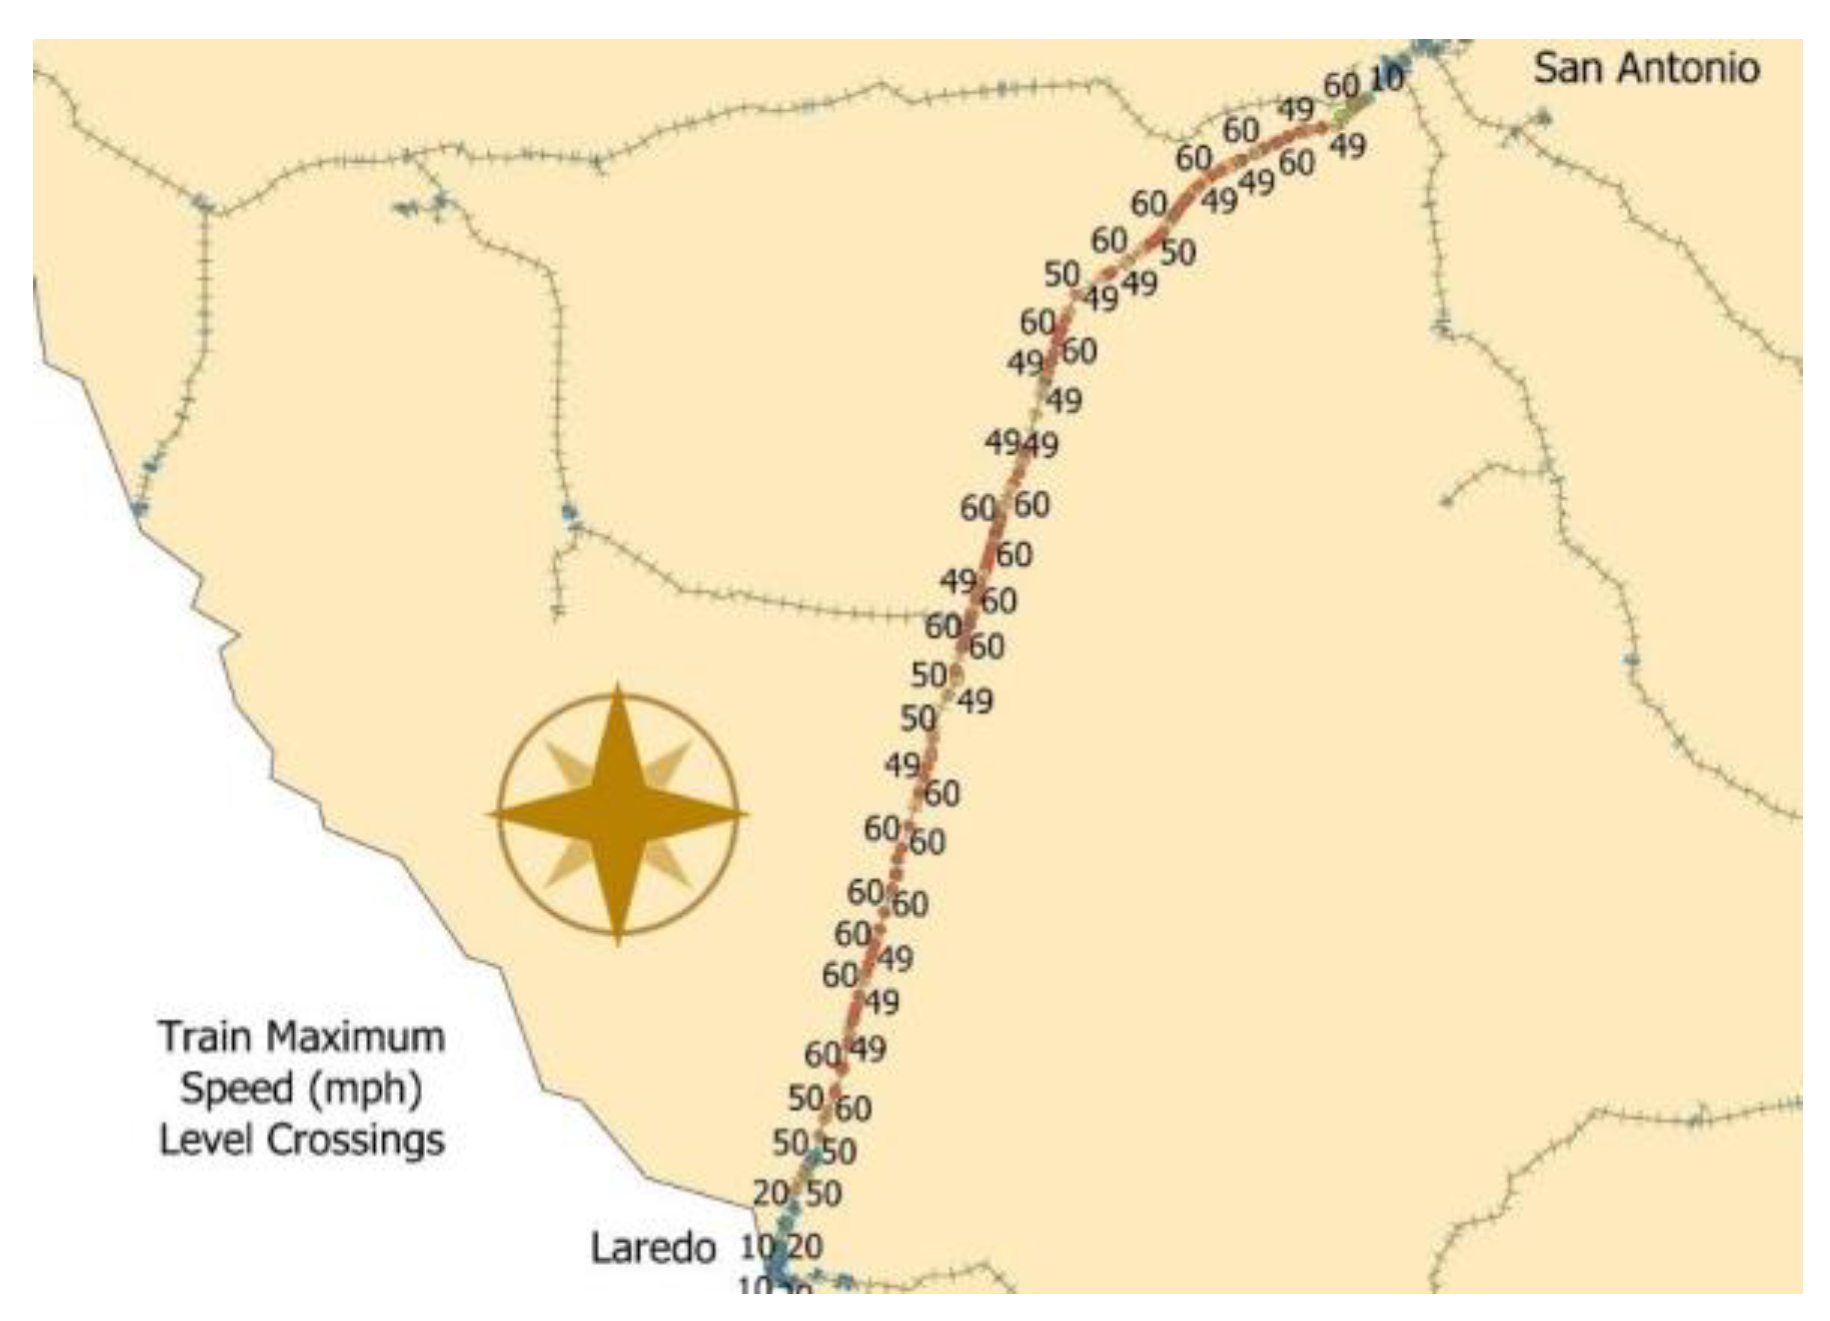
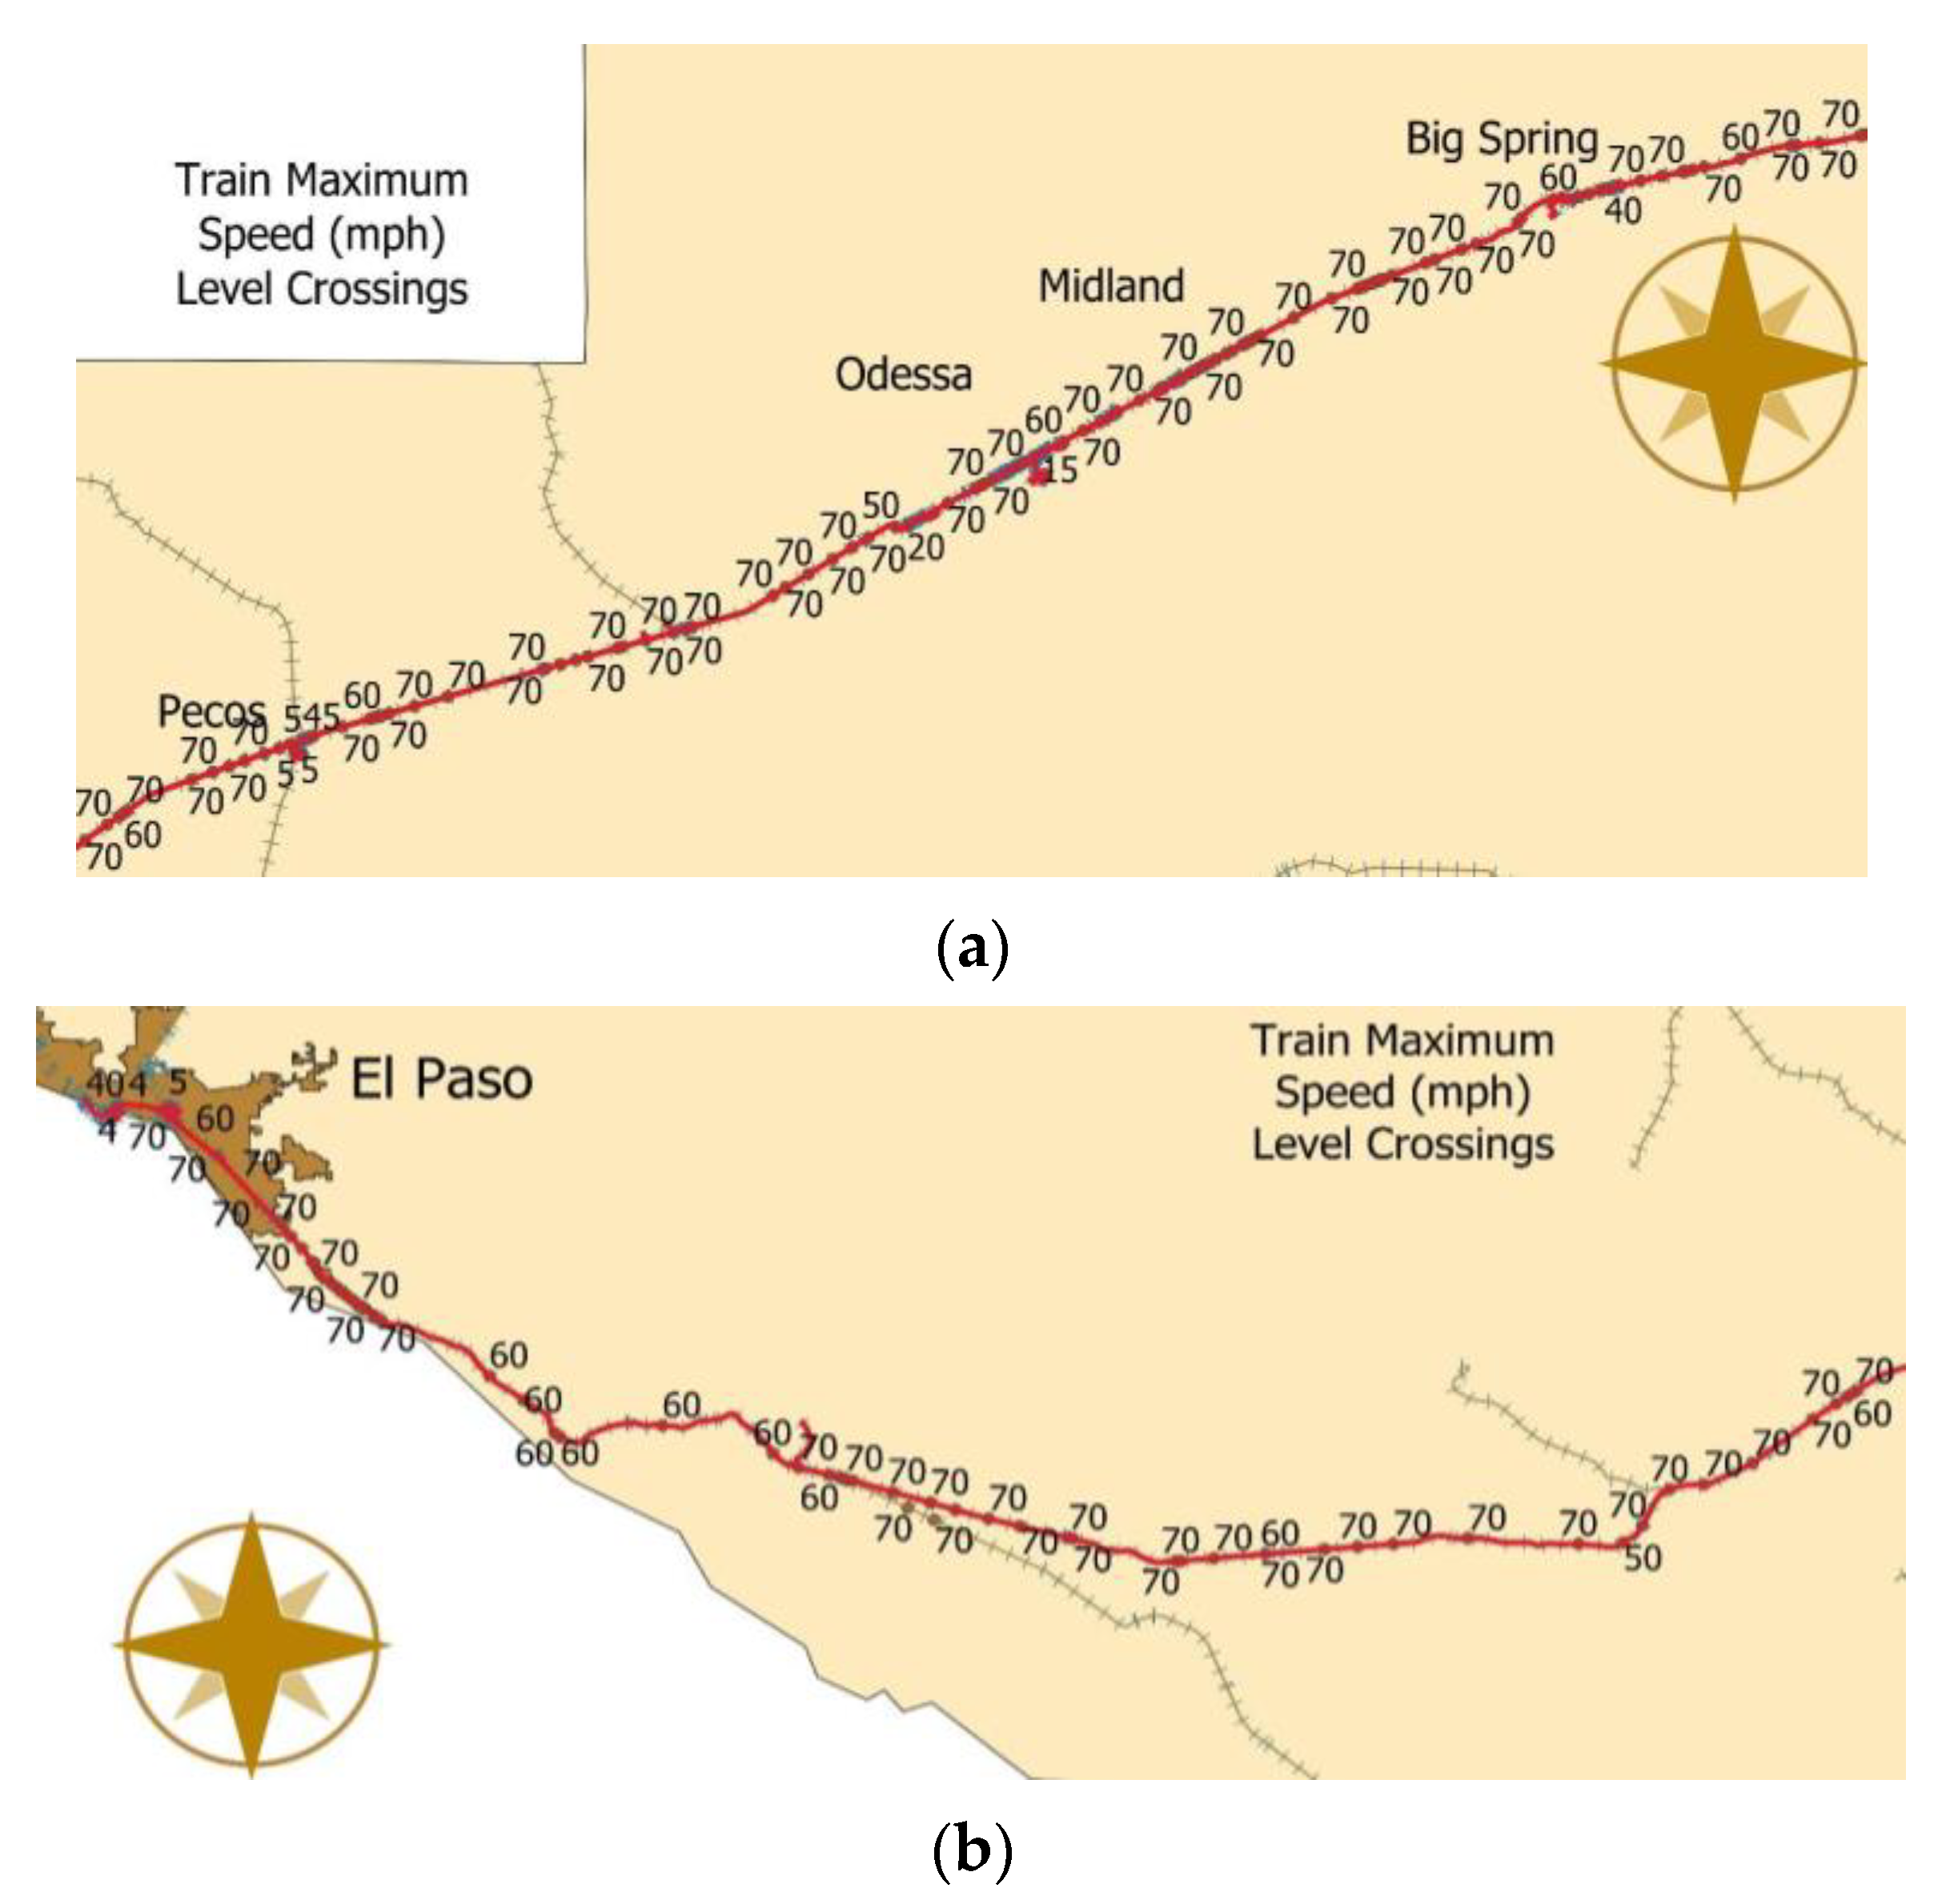
tmw is the time of the advanced warning the motorist will receive. Both equations require data for the trains speed to perform their respective analyses. A geospatial analysis was performed to evaluate the maximum speed from trains at level crossings, as reported by the Federal Railroad Administration for both lines under consideration. For the San Antonio–Laredo line, the results are presented in
Figure 14. A top speed of 60 mph is achieved over rural counties, with some reductions for sidetracks and line interconnections. Lower speeds are localized in urban areas, as the trains depart or reach their destination, with 10–20-mph speeds.
Figure 15a shows the eastern portion of the Cisco–Laredo line, with maximum speeds on average of 70 mph with some level crossing reductions to 40–60 mph ranges. The indicated locations represent mostly rural counties, where trains traverse less populated areas. In the western section of the line, represented in
Figure 15b, the maximum speed becomes very stable, at 70 mph, for several segments of the rail, even in the outskirts of El Paso. The speeds are different from those observed in
Figure 14, with lower speeds near Laredo and San Antonio, which will need to be considered in the placement of the spacing of the sensors and deciding which will be the first sensor to alert motorist.
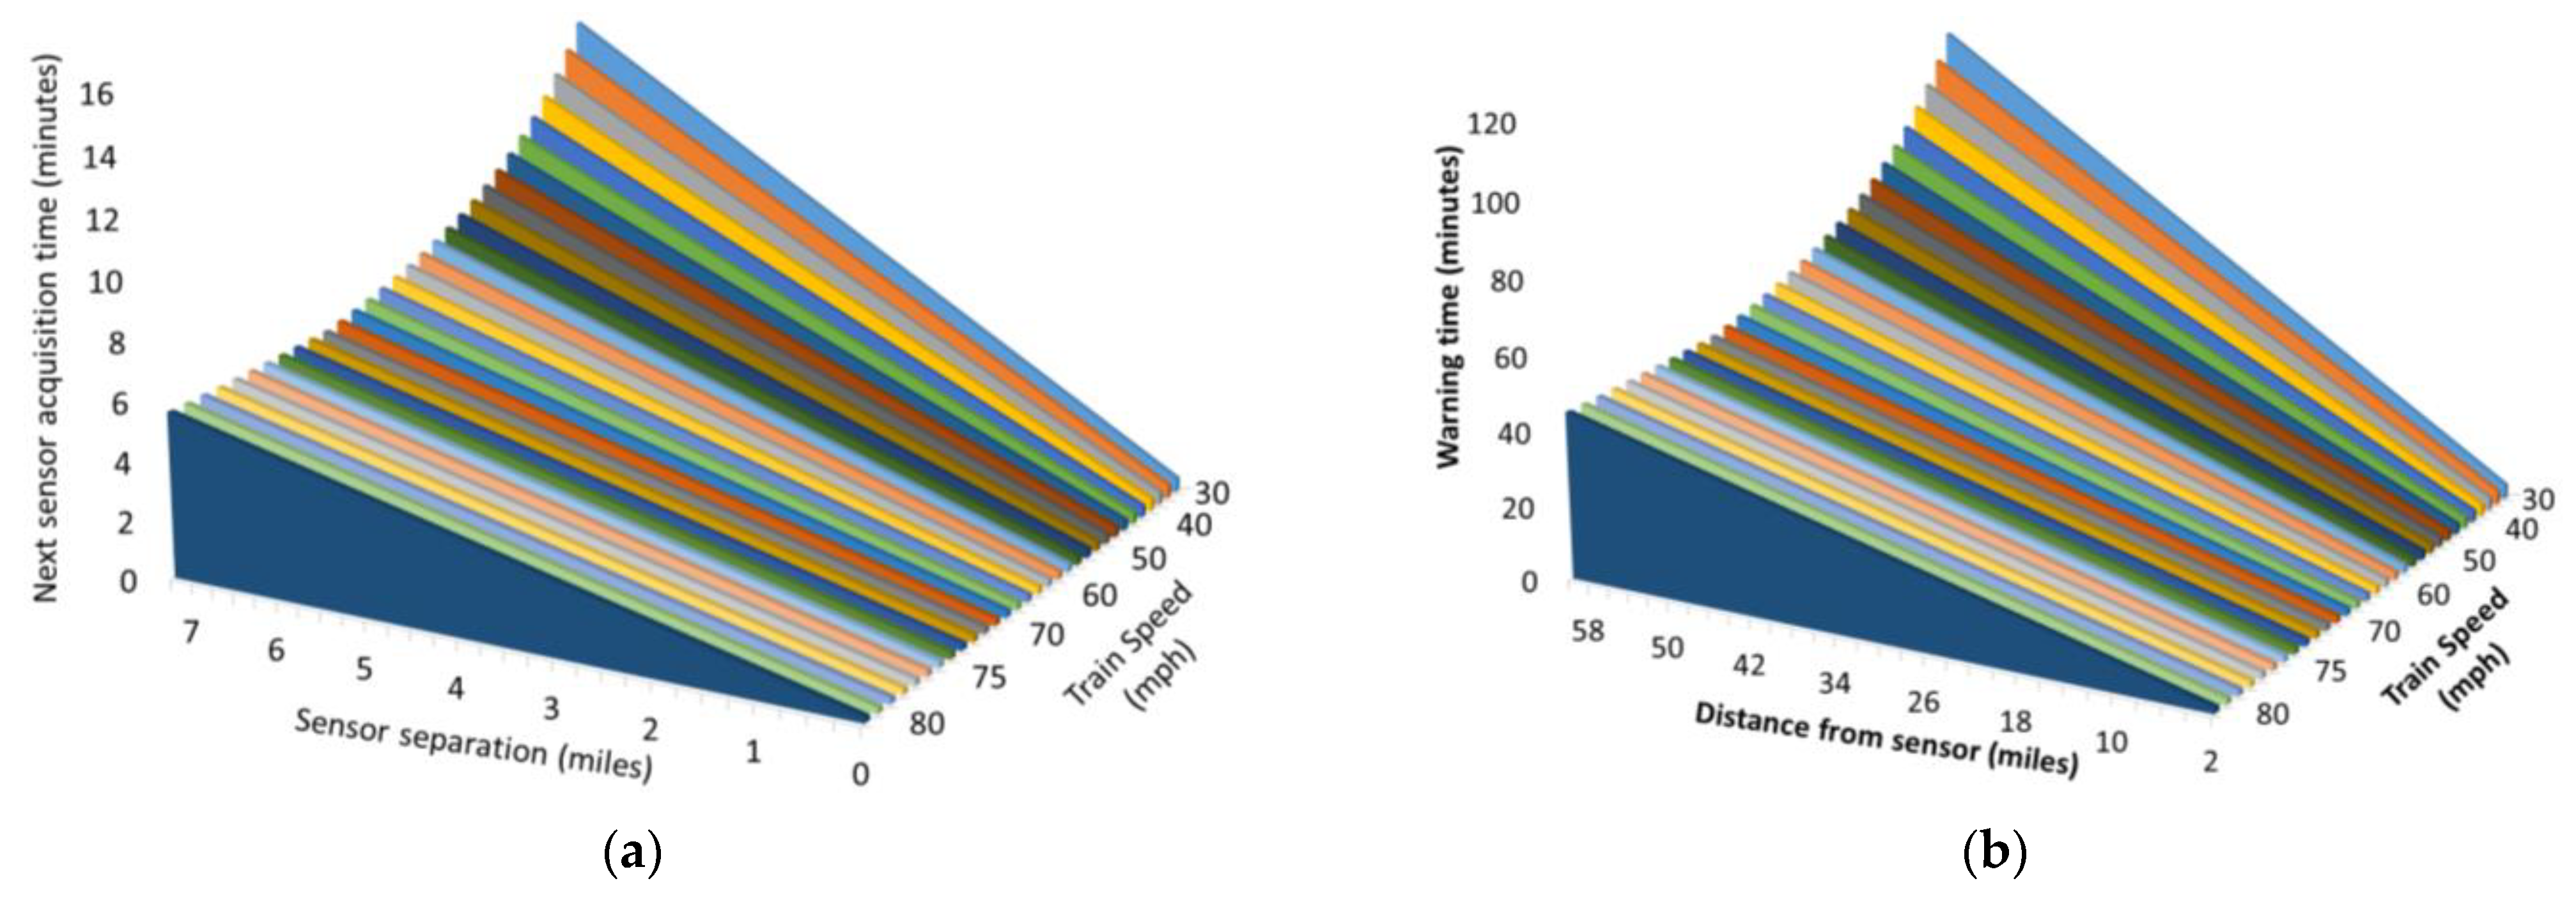
Applying Equations (1) and (2), the train speeds reported by FRA, and the geospatial configuration of the railways, the advanced warning systems can be designed to have the proper train tracking resolution and adequate warning times for motorist.
Figure 16a applies Equation (1) to the reported train speed to ascertain what would be the required spacing on the sensors. Tracking resolution, or the time interval between position updates of the train, is determined accordingly. For instance, for trains moving at 60 mph, a sensor separation of half a mile would provide a tracking resolution of 30 s. Similarly, for a sensor spaced out one mile the resolution would be one minute. Tracking resolutions of one and two minutes, for trains with a speed of 30 mph, would require half a mile and one-mile sensor spacings, respectively. Since Cisco–El Paso line has trains with speeds up to 70 mph, the tracking resolution would be even higher, with 20 s for half a mile spacing and 40 s for one mile.
Considering that the San Antonio–Laredo line has a length of roughly 150 miles, the system on this section would require 150 sensors, providing a tracking resolution of approximately one-minute intervals, giving ample opportunity to correctly monitor trains. On the other hand, the Cisco–Laredo railway has a length of almost 500 miles and would require a higher number of sensors. Since trains on this track have a higher maximum speed of 70 mph,
Figure 16a indicates that a separation of 1.25 miles between sensors would provide a tracking resolution of 66 s. Furthermore, a 1.5-mile separation would provide 78 s, which may be acceptable considering the long stretches of rural area that the line covers. The numbers of sensors required would be reduced from 500 to 400 for a 1.25-mile separation and to less than 335 for a 1.5-mile separation, providing significant savings while providing adequate tracking levels. Applying
Figure 16b to the San Antonio–Laredo route, considering maximum speeds of 60 mph, the warning can be as far in advanced as one hour for motorist 60 miles away from the sensor. On the other hand, for speeds of 30 mph, it would be a warning of two hours for motorist at this same distance from the sensor. The system would require calibration and training to guide motorists to the best alternative routes.
5. Conclusions
Data provided by the Federal Railroad Administration were evaluated to perform spatiotemporal characterization of accidents at train grade crossings in the United States. The efficiency of safety investments since 1975 was assessed by investigating accident reduction. The results indicated that accident reduction plateaued after 2010, with even some yearly increases afterwards. The results additionally indicated a strong connection between motorist’s schedules and accidents at level crossing, as evaluated in their numbers, damages, injuries, and deaths. Certain hours have substantial increases in incidents, highlighting tight arrival times as an important driver of accidents. The results indicated that providing motorists with a new advanced warning system would help in reducing accidents. Drivers will be able to reroute effectively, altering their path to avoid potential accidents and delays.
Two suitable railways in Texas were selected for the initial implementation of the advanced warning system. The selection criteria included the number of accidents at crossings, track length, and rail line complexity. Importantly, a large number of the intersections in these lines have repeat accidents over time, highlighting their high risk levels. The selected lines have lower layout complexity levels, avoiding the challenging placement of sensors and increasing the predictability of train traffic and their characteristics. Trains were evaluated in accordance with their traffic levels and speeds to determine the resolution that the system will be able to provide depending on the layout and spacing of the sensors. It was determined that railways with higher train speeds may increase sensor spacing, reducing costs without compromising the system’s resolution and reliability.
The methods and data proposed in the research can be applied for other geographical locations. As the initial stages of the system show their efficacy and applicability, more complex railways, in larger urban areas, will be integrated to the system. For future research, we plan to evaluate the proper integration of the proposed system into navigation systems already in operation in many vehicles and in cellular phones. The system will be able to receive input from the advanced warning system, integrate it with other road characteristics and provided motorist with optimal routes, which will improve driver safety and traffic flow. The impact of high traffic patterns in the roads and the duration of the wait times at grade crossing will be integrated in the study. For the initial implementation of the system, locating sensors along the line was a good option, allowing for the high-resolution location on the trains. The system will be able to acquire enough data, providing drivers with proper warning of inbound trains to level crossings on their routes. Future research will assess the possibility of placing sensors in high-density railway areas to serve the highest accident level crossings and optimize the system operation.


