Abstract
Using woody biomass in thermochemical gasification can be a viable alternative for producing renewable energy. The type of biomass and the process parameters influence the producer gas composition and quality. This paper presents research on the composition of the producer gas from the gasification of three woody biomass species: spruce, alder, and pine. The experiments were conducted in a drop-tube reactor at temperatures of 750, 850, and 950 °C, using air as the gasifying agent, with equivalence ratios of 0.38 and 0.19. Gas chromatography with a thermal conductivity detector was used to determine the composition of the producer gas, while the production of total organic compounds was detected using Fourier-transform infrared spectroscopy. All three wood species exhibited very similar producer gas composition. The highest concentration of combustible gases was recorded at 950 °C, with an average of 4.1, 20.5, and 4.6 vol% for H2, CO, and CH4, respectively, and a LHV ranging from 4.3–5.1 MJ/m3. The results were in accordance with other gasification studies of woody species. Higher temperatures enhanced the composition of the producer gas by promoting endothermic and exothermic gasification reactions, increasing gas production while lowering solid and tar yields. The highest concentrations of combustible gases were observed with an equivalence ratio of 0.38. Continuous TOC measurement allowed understanding the evolution of the gasification process and the relation between a higher production of TOC and CO as the gasification temperature raised.
1. Introduction
The increasing worldwide energy demand is currently supplied mostly by conventional fossil fuel resources (over 65% of the electricity), which are continuously producing emissions of CO2 and pollutant gases in the atmosphere [1]. Renewable energies propose an alternative solution to meet the current energy needs and mitigate the environmental effects of conventional energies. Different approaches are currently researched and implemented using various renewable resources. These efforts will increase the share of electricity produced from renewables by up to 37–60% [1]. Biomass as a carbon-neutral renewable resource is a promising alternative, currently providing a worldwide total primary energy supply of around 10% [2].
Estonia aims to increase the efficiency of the current generation technologies and increase the share of renewables. The country has already achieved producing 25% of the total energy from renewables and is expecting to increase the share of renewables in electricity production and transportation by up to 50% and 10%, respectively, by 2030 [3]. Biomass is a promising renewable resource in Estonia, currently providing over 50% and 7% of heat and electricity, respectively, using wood residues and woody resources from forests [4]. Forests cover around 50% of the country’s territory, of which around 32% are pine, 18% spruce, and 13% alder [5]. The country has advanced technical expertise in thermochemical conversion processes from the conversion of oil shale for electricity and the conversion of biomass for heat supply through district heating [3]. This expertise allows the potential implementation of thermochemical processes, such as gasification or co-processing of biomass and oil shale, to produce energy and high-quality products.
Woody biomass resources can be converted through different thermochemical conversion processes, including combustion, pyrolysis, and gasification. From the latter processes, gasification is used for the production of syngas or producer gas, rich in H2 (5–20 vol%), CO (17–22 vol%), CH4 (2–3 vol%), and CO2 (9–15 vol%) [6]. H2, CO, and CH4 are the most significant gas species produced in gasification; other heavier hydrocarbons including C2H6, C2H4, C3H8, C6H14, C6H6, and C7H8 are also present in lower concentrations and also influence the LHV of the producer gas. Gasification can use low moisture content woody biomass (<35%), such as spruce, pine, and alder, to produce gas in a partial oxidation atmosphere, at temperatures from 600 to 1400 °C [7]. The producer gas has several applications: for example, hydrogen generation, and the synthesis of methanol and ammonia in the chemical industry. The producer gas is also used in the energy industry (considered a renewable source if obtained from biomass) [8]. The gasification process occurs in different stages, starting with drying at 100–200 °C. At 200–500 °C, biomass is pyrolyzed, and its components (hemicellulose 220–315 °C, cellulose 315–400 °C, and lignin > 400 °C) are decomposed into char and gases (H2, CO, CO2, and CH4) [9]. Biomass undergoes partial oxidation at higher temperatures (>900 °C), in which char and gases react in exothermic reactions that provide heat to the other gasification stages [10]. The main gasification stage, known as reduction, is where the producer gas is obtained through the gasification reactions. A typical biomass gasification process yields 85, 5, and 10 wt% of gas, liquids, and solids, respectively [11].
The yields and composition of the gasification products depend on the operational parameters used. Air, steam, O2, CO2, and gas mixtures are used as gasifying agents. Air is the most widely used for its low price and low yield of tar and solids [12]. The selection of the ER (ratio of biomass and gas agent compared to that of complete combustion) dramatically affects the gasification process performance and products, determining the availability of oxygen, gas, and tar yields [7]. High ERs increase the gas yields (especially H2) but decrease the LHV of the gas and the gasification efficiency [12]. ERs close to 1 result in a process more similar to combustion, and ERs < 0.1 result in a process closer to pyrolysis [6]. The gasification temperature influences the yield of products, duration, and efficiency of the process. Therefore, it is necessary to have a constant and stable temperature to ensure control of the process [13]. Low gasification temperatures (600–700 °C) require less external heat and increase the efficiency but produce lower gas yields and higher tar and solid yields. High temperatures (700–1000 °C) reduce the efficiency but favor the gas yield [12] through endothermic reactions, such as Boudouard (increasing CO production and decreasing CO2), methane, and char reforming (increasing H2 production) [14]. Gasification temperatures above 1000 °C produce more H2, CO, and CH4 and less CO2, tar, and solid yields [7].
The optimization of the operational parameters in thermochemical gasification of fuels, including WB, has caught the attention of different researchers. Operational conditions directly affect the quality and composition of the producer gas, as well as the yields of tars, unburned char, ash, and soot. Recent research has studied the effect of gasification temperature on the process performance and the production of residues. An increase in temperature to 900–950 °C has been related to an increase in producer gas and the fraction of H2 in the producer gas [15]; low temperatures led to low reaction rates and low production of H2, while higher temperatures contributed to a higher reaction rate in endothermic reactions, such as methane reforming and water–gas [16]. Biomass gasification has also been studied through computational models. An Aspen plus model of sawdust gasification at temperatures of 650–800 °C observed an increase in CO and a decrease in CO2 and CH4, due to the higher production of CO through the water–gas shift reaction and the tar cracking reaction. A decrease in the tar yield and an increase in the yield of producer gas was also observed [17]. The latest research has also focused on the effect of biomass composition in soot formation [18], the effect of temperature on soot formation [19], modeling the formation of soot, and the positive effect of higher gasification temperatures on char conversion [20].
An innovative experimental approach of biomass gasification is proposed to understand the evolution of the gasification process, by studying the effect of the gasification temperature on the composition of the producer gas, with a simultaneous study on the correlation of TOC production with the gasification temperature and the production of combustible gases. For the abovementioned purposes, a study of the composition of the producer gas from the gasification of Estonian WB at different temperatures and ERs was conducted in this paper. This research makes part of the first large-scale study on thermochemical gasification of local WB and its potential for energy generation in Estonia. A laboratory-scale batch reactor was used to gasify samples of spruce, alder, and pine at 750, 850, and 950 °C, using two blends of N2 and O2 as gasifying agents. GC-TCD and FTIR were used to measure the producer gas. The composition of the main combustible gases H2, CO, and CH4, as well as the TOC and the evolution of the gasification process over time, were analyzed and compared for the WB species. As a result of this research, gaseous products from the gasification of WB were identified and characterized, which opens the path for future studies on the utilization of Estonian WB resources in thermochemical gasification processes. The scope of the research was focused on the producer gas composition; solid and liquid products can be analyzed in future research, considering the importance of tars and solid residues in gasification.
2. Materials and Methods
2.1. Biomass Characterization
Three of the most common woody species from Estonian forests were used as feedstocks: Norway spruce, Grey alder, and Scots pine. These feedstocks were collected from local forests; samples were separated into bark and wood, chopped into woodchips, ground and sieved to less than 1 mm in particle size, and stored in air plastic bags. The WB was gasified in as-received conditions; no pre-drying was used. The samples were prepared based on ISO 14780:20 (solid biofuels sample preparation).
The characterization of WB included proximate analysis (moisture, ash, volatile, and fixed carbon content), elemental analysis (C, H, N, S, and O), and calorimetry, which were previously carried out [21]. An elemental analyzer Vario MACRO CHNS (to determine C, H, N, and N) and an ion chromatography Dionex ICS-1000 (to determine S) were used for the elemental analysis in compliance with ISO 16948 and ISO 16994, respectively. Memmert and Nabertherm RT120 drying ovens (for moisture content) were used along with a Nabertherm L9 Muffle furnace (for ash content) to carry out proximate analysis in compliance with ISO 18134-2 and ISO 18122. The HHV and LHV were determined through calorimetric measurements with bomb calorimeters IKA 2000C and IKA 5000C following ISO 18125.
2.2. Experimental Set-Up
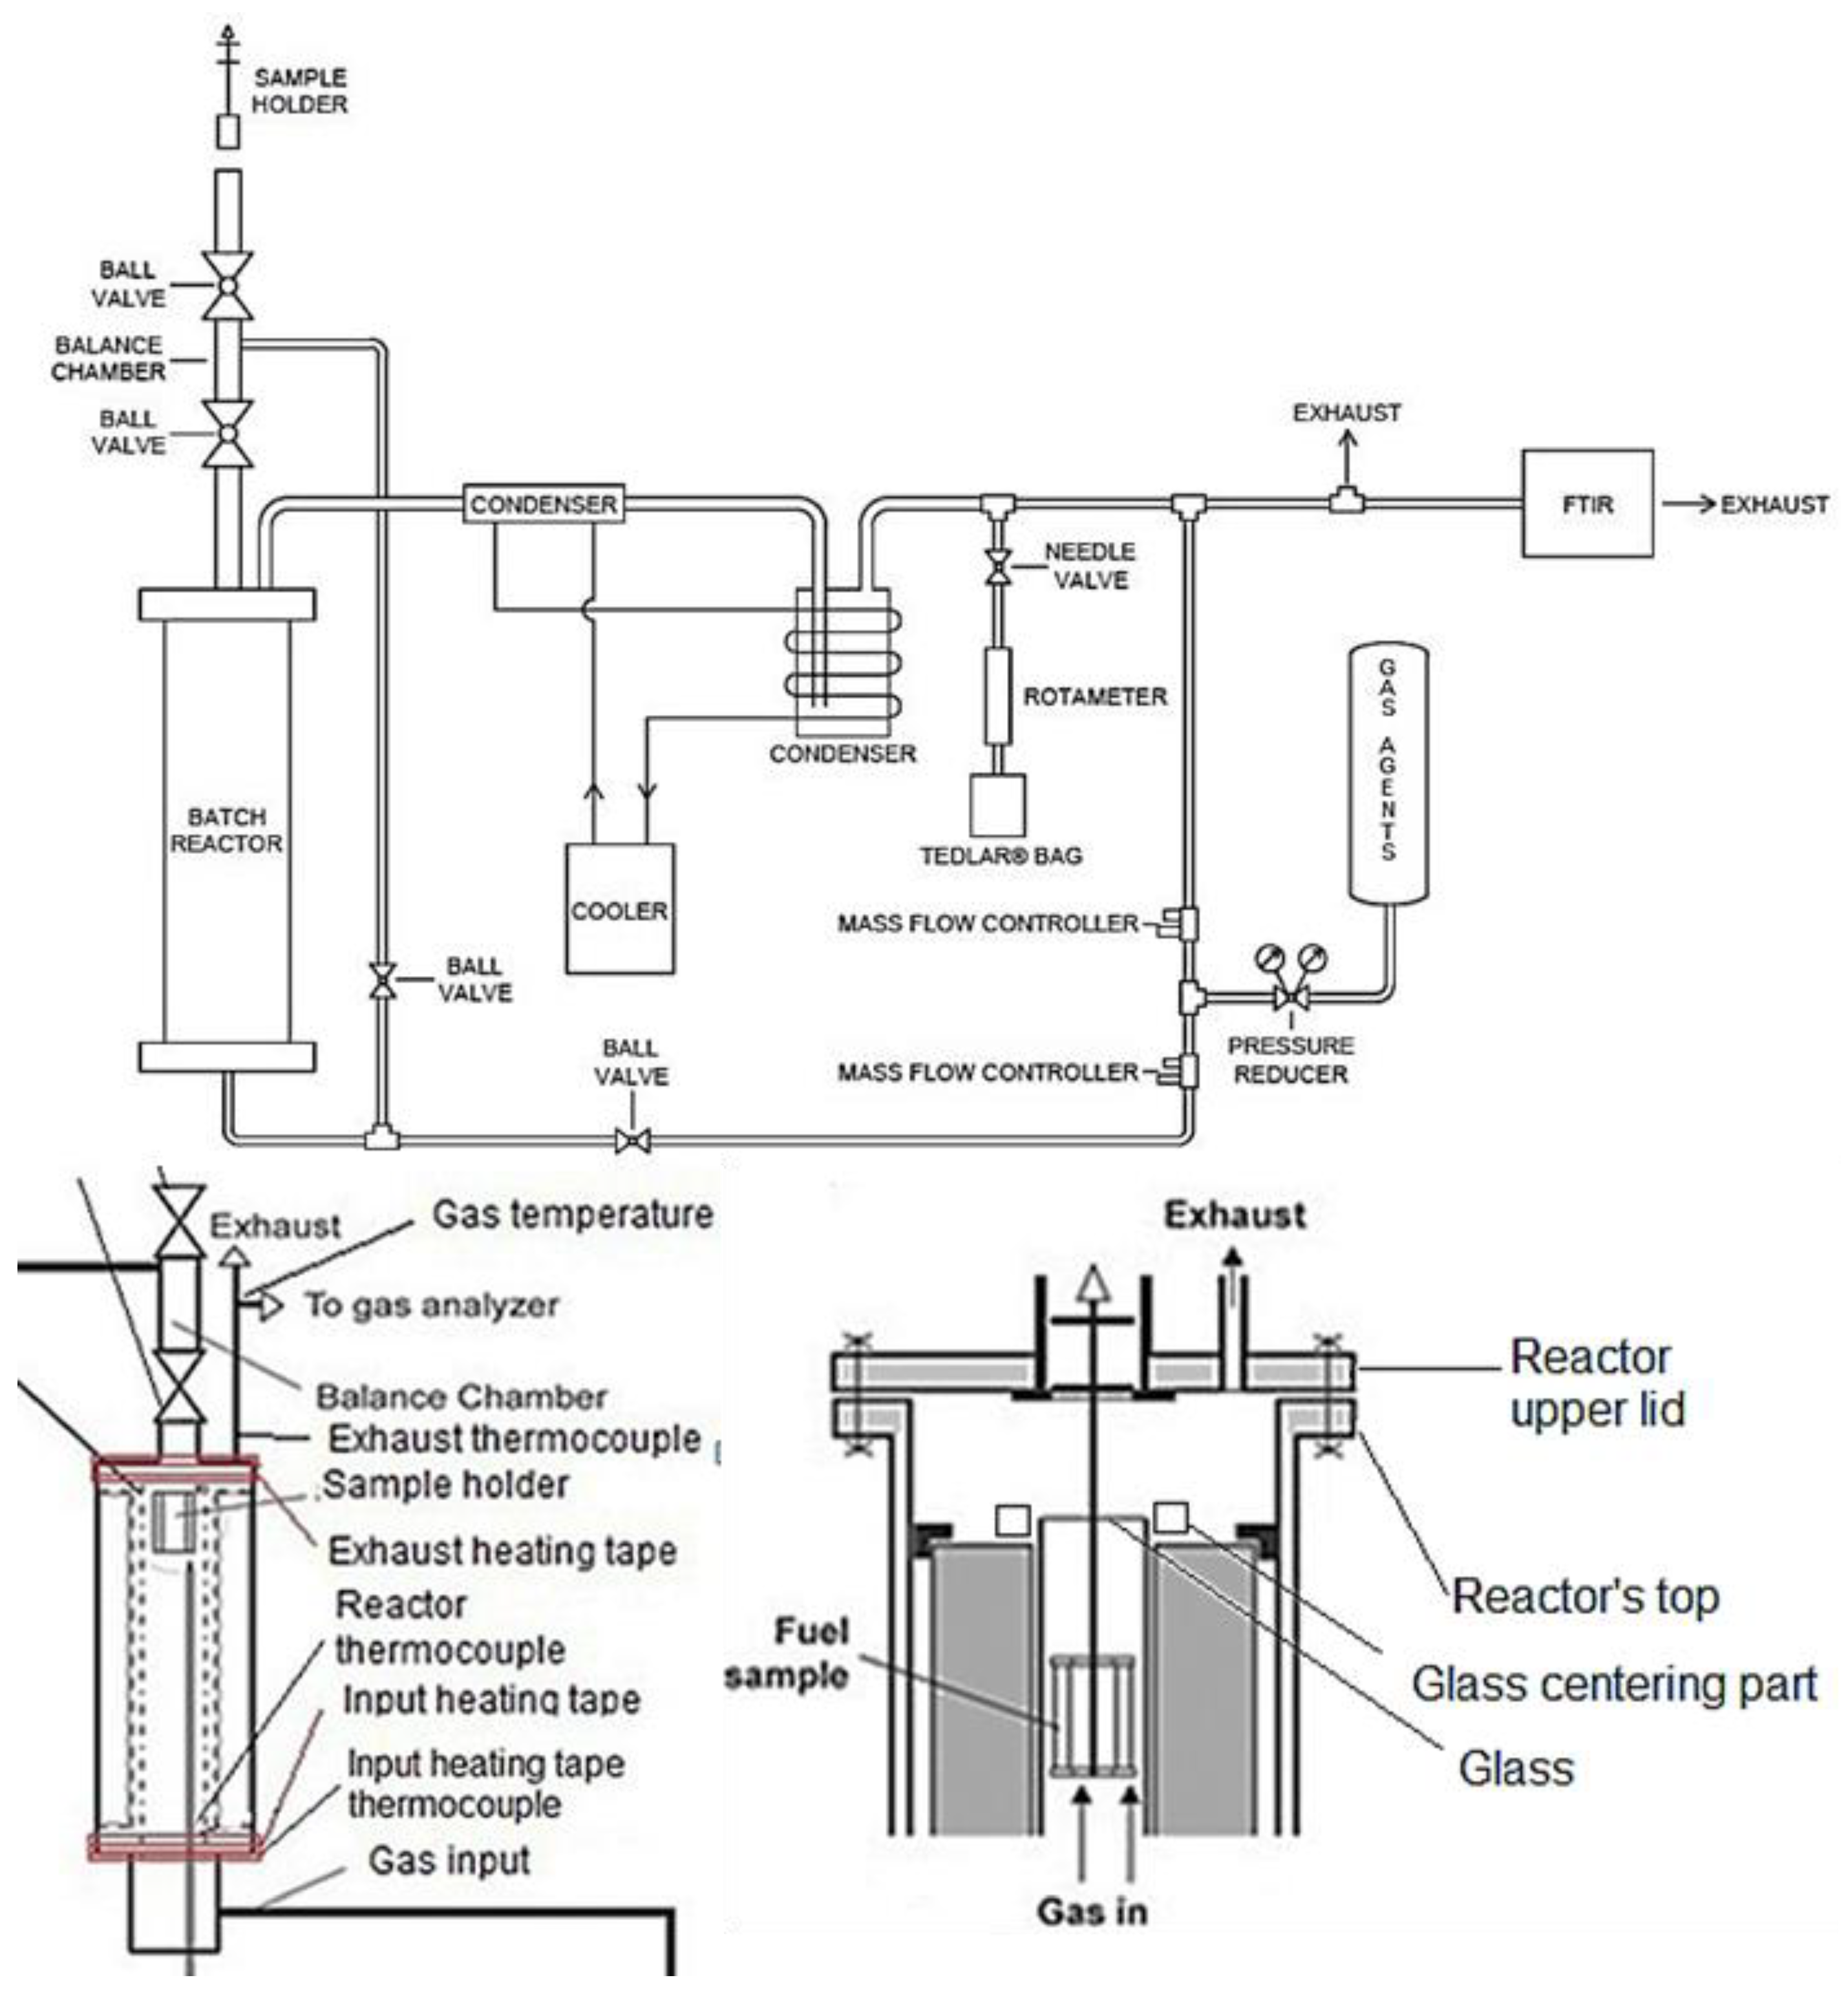
A prototype batch drop-tube, updraft, fixed-bed reactor was used to conduct gasification experiments with alder, spruce, and pine at 750, 850, and 950 °C in isothermal conditions, and with atmospheric pressure (Figure 1). The operational temperatures were selected from a range between 700–1000 °C, as this range promotes H2 and CO production and decreases CO2 production [22]. The process was executed at atmospheric pressure, as higher pressures can reduce tar formation and favor the production of combustible gases, but the operational costs can be significantly affected [6]. Future experiments could be carried out in pressurized conditions.
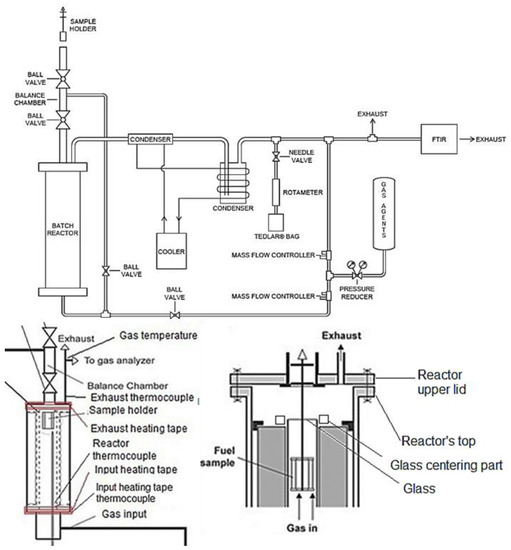
Figure 1.
Diagrams of the gasification system (modified from [23]).
Each experiment used approximately 1.5 g ± 10% of WB. Three experiments were performed for every condition to ensure reproducibility. A mixture of N2 and O2 was used as the gasifying agent with a flow rate of 0.3 L/min ± 0.8%. For all WB samples, a blend of 21 vol% O2 and 79 vol% N2 was used (ER 0.38). For alder, an additional blend of 10.5 vol% O2 and 89.5 vol% N2 (ER 0.19) was used at 850 and 950 °C. The gas agent blends and flow rates were selected to simulate gasification in air atmospheres and reduced oxygen atmospheres and to achieve gasification with ERs close to the range of 0.2–0.4, to increase the production of combustible gases in the producer gas, as further explained in Section 3.4.
The gasification process used for the experiments consisted of a sample holder containing the WB, which was introduced on top of the reactor’s balance chamber, where it stayed for 2 min in N2 atmosphere, after which it went through the reaction chamber, which consisted of a quartz cylindrical glass covered by an internal heater, thermal insulation, and the reactor’s body. The internal heater kept an isothermal condition in the system, while the temperature was measured and controlled with a type K thermocouple centered internally in the reactor. The internal heater provided a temperature precision of ±10 °C, with a maximum operating temperature of 1000 °C. Once the samples were inside the reaction zone, the gas agents (N2+O2) were supplied at the bottom of the reactor (updraft) using individual Alicat Scientific mass flow controllers for each gas canister, with ±0.8% precision. After the gas agents were supplied by the mass flow controllers, these were mixed and delivered to a pre-heated reactor’s gas input, through a stainless-steel pipe connection to the bottom of the reactor. The gas agent input and the producer gas exhaust were heated with external heating tapes at 150 °C to avoid condensation in the reactor or pipes. The internal heater, as well as the heating tapes and the mass flow controllers, were controlled using LabView software and a data acquisition NI SCXI-1000 chassis, with NI-1102 and NI-1124 modules.
After the gasification was finished, the sample holder was moved to the balance chamber for 5 min in N2 atmosphere, to avoid reactions with the environment, and then removed from the reactor. The producer gas exited through the reactor’s exhaust and passed through a cleaning and cooling system to condensate volatiles and remove tar. The cooling system consisted of two condensers and a CoolCare refrigeration system supplying water at 4 to 6 °C. The condensers had wool (replaced on every experiment) to absorb tar and clean the gas. Each experiment was carried out for around 8 min (plus 7 min in the balance chamber) until the TOC content measured by FTIR indicated the end of the reactions. The duration of the sample in the reaction zone of the batch reactor was determined based on the TOC measurements from the FTIR equipment, which showed that, after 7–8 min, the gasification process was virtually completed. The gasification system was not equipped to properly collect all liquid (tars) and solid residues produced during gasification.
2.3. Equivalence Ratio and Stoichiometric Reactions
As stated in Section 2.2., the ERs used in gasification were around 0.38 for spruce alder and pine at 750, 850, and 950 °C, and 0.19 for alder at 850 and 950 °C. The ERs were calculated using the elemental composition of each sample (Section 3.1) and the gas agent flow rate. The stoichiometric A/F ratio and the operational A/F ratio were calculated for each WB sample. The stoichiometric A/F ratio was calculated using the elemental composition of each WB species as follows:
| General formula | |
| Spruce | |
| Alder | |
| Pine |
The operational A/F ratio was calculated based on the experiment conditions (sample mass and gas agent flow rate). Two gas blends were considered for alder, as mentioned in Section 2.2. The operational and stoichiometric A/F ratios and the ER are shown in Table 1. The ER and the A/F ratios were calculated as follows:

Table 1.
A/F ratios and ER for WB samples.
2.4. Gas Measurement
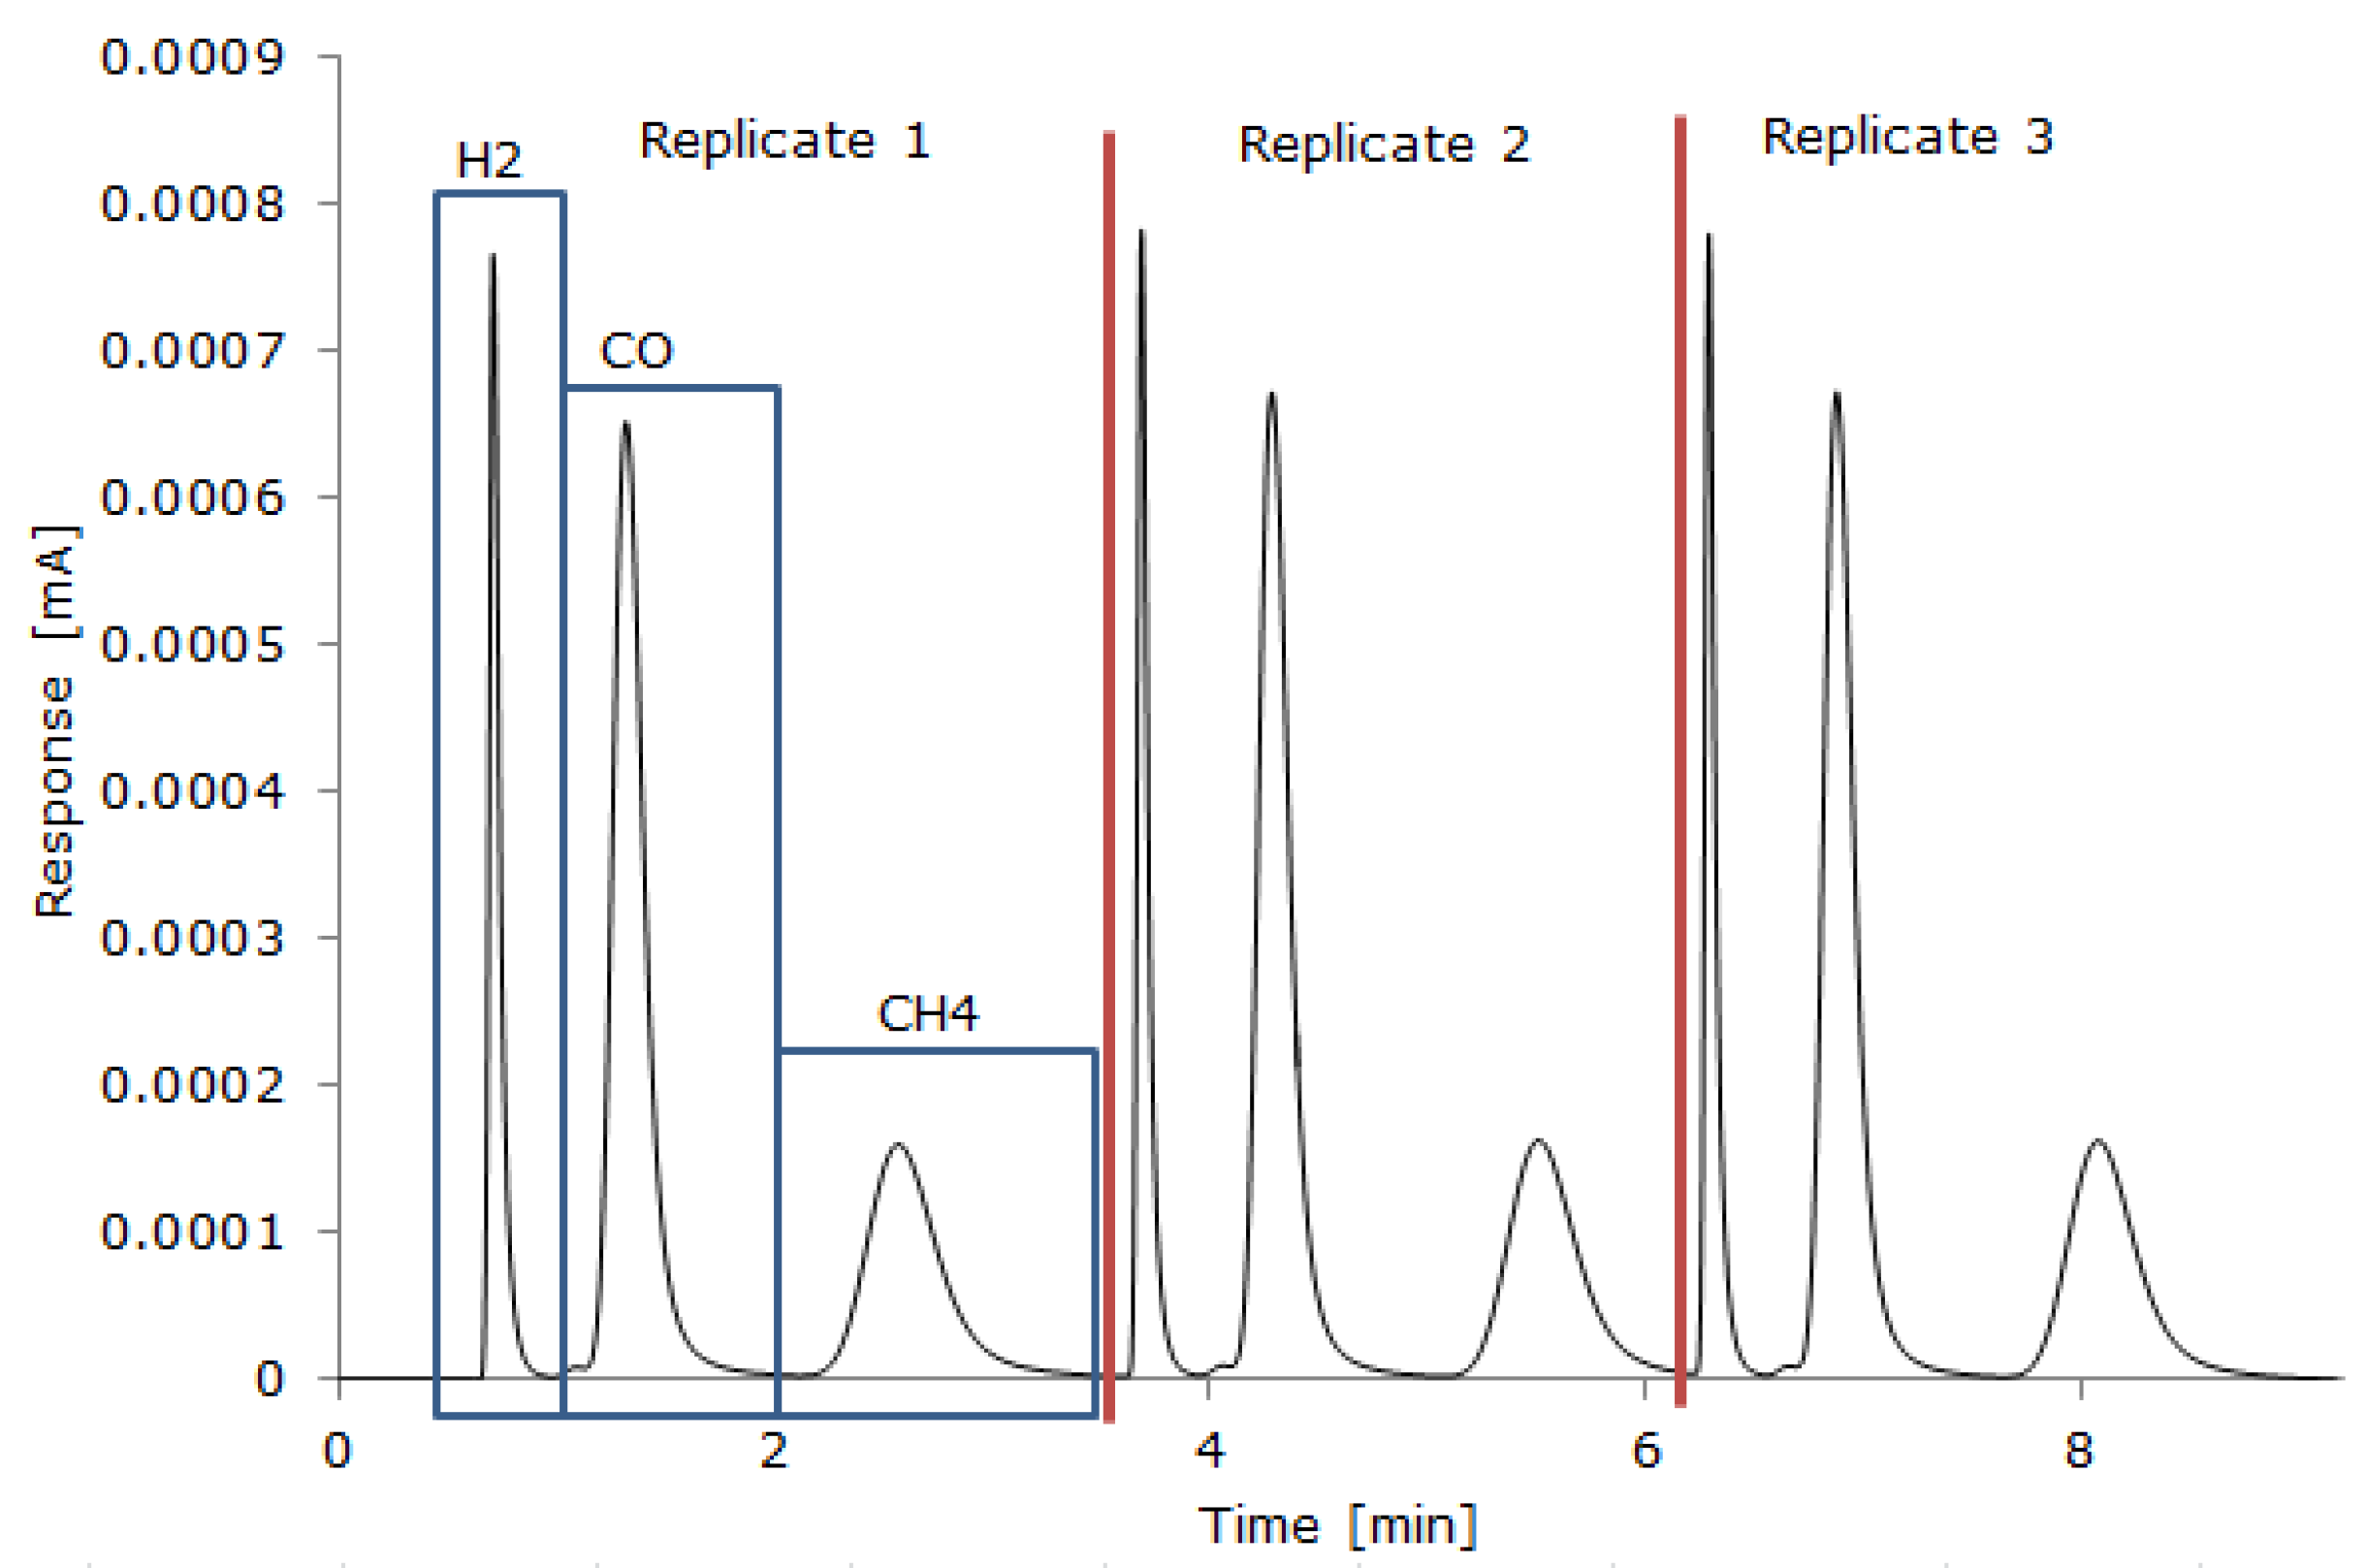
A GC-TCD Gazohrom 3101 gas analyzer and an FTIR Gasmet DX4000 gas analyzer with a continuous gas supply were used to measure the producer gas composition after it had been cleaned and cooled. For the GC-TCD analysis, a sample of the total producer gas was collected from the beginning until the end of the gasification process in a Tedlar bag. A total of 2 mL of the gas sample from the Tedlar bag was introduced into the GC-TCD with a gas syringe, and three replicates were made for each gas sample; the RSD between GC-TCD replicates was up to 7%. The GC-TCD measured H2, CO, CH4, and CO2. Two packed columns with a total length of 2.5 m long and 3.6 mm in diameter were used for the separation of gases at room temperature. Air at 70 mL/min was used as the gas carrier to detect H2, CO, and CH4, while Argon at 40 mL/min was used to detect CO2. The GC-TCD was calibrated beforehand through a linear relation between the area under the detected spectra peaks and the gas species concentration (vol%) (Figure 2). The current changes (mA) provided by the GC were displayed using the Keysight Benchview software, and the area under the curve was calculated with the Clarity Chromatography Station software to determine the gas species concentration, based on the calibration. The FTIR equipment was set for continuous analysis of the producer gas (every 5 s), which was diluted in N2 with a flow rate of 3 l/min. The FTIR measured TOCs, which were further analyzed using Calcmet software, to track the beginning, evolution, and end of the gasification process and to verify that the reactor atmosphere was inert before and after each experiment.
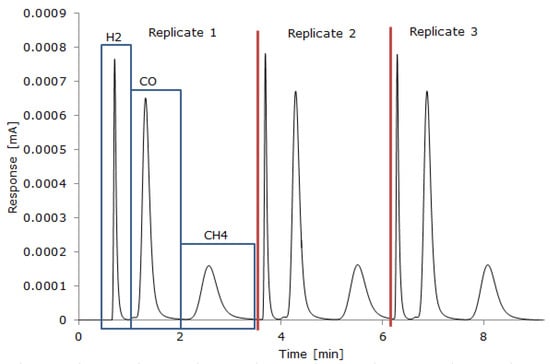
Figure 2.
A typical chromatogram of the analysis of H2, CO, and CH4 by GC-TCD.
The LHV of the producer gas was calculated with the concentration (vol%) of H2, CO, and CH4 as follows [24]:
3. Results and Discussion
3.1. Woody Biomass Composition
Table 2 includes the composition of the Norway spruce, Grey alder, and Scots pine samples, along with their elemental analysis, proximate analysis, and calorific values. A comparison of these results with those from other studies is provided as well. As indicated in Table 2, compared to samples of similar species characterized in other studies, the composition obtained from local WB samples had nearly the same proximate and elemental composition. Furthermore, the elemental composition, ash content, moisture, fixed carbon, and heating values of the three samples measured are all within the same range.

Table 2.
Elemental analysis, proximate analysis, and calorific value for spruce, alder, and pine.
3.2. Producer Gas Composition
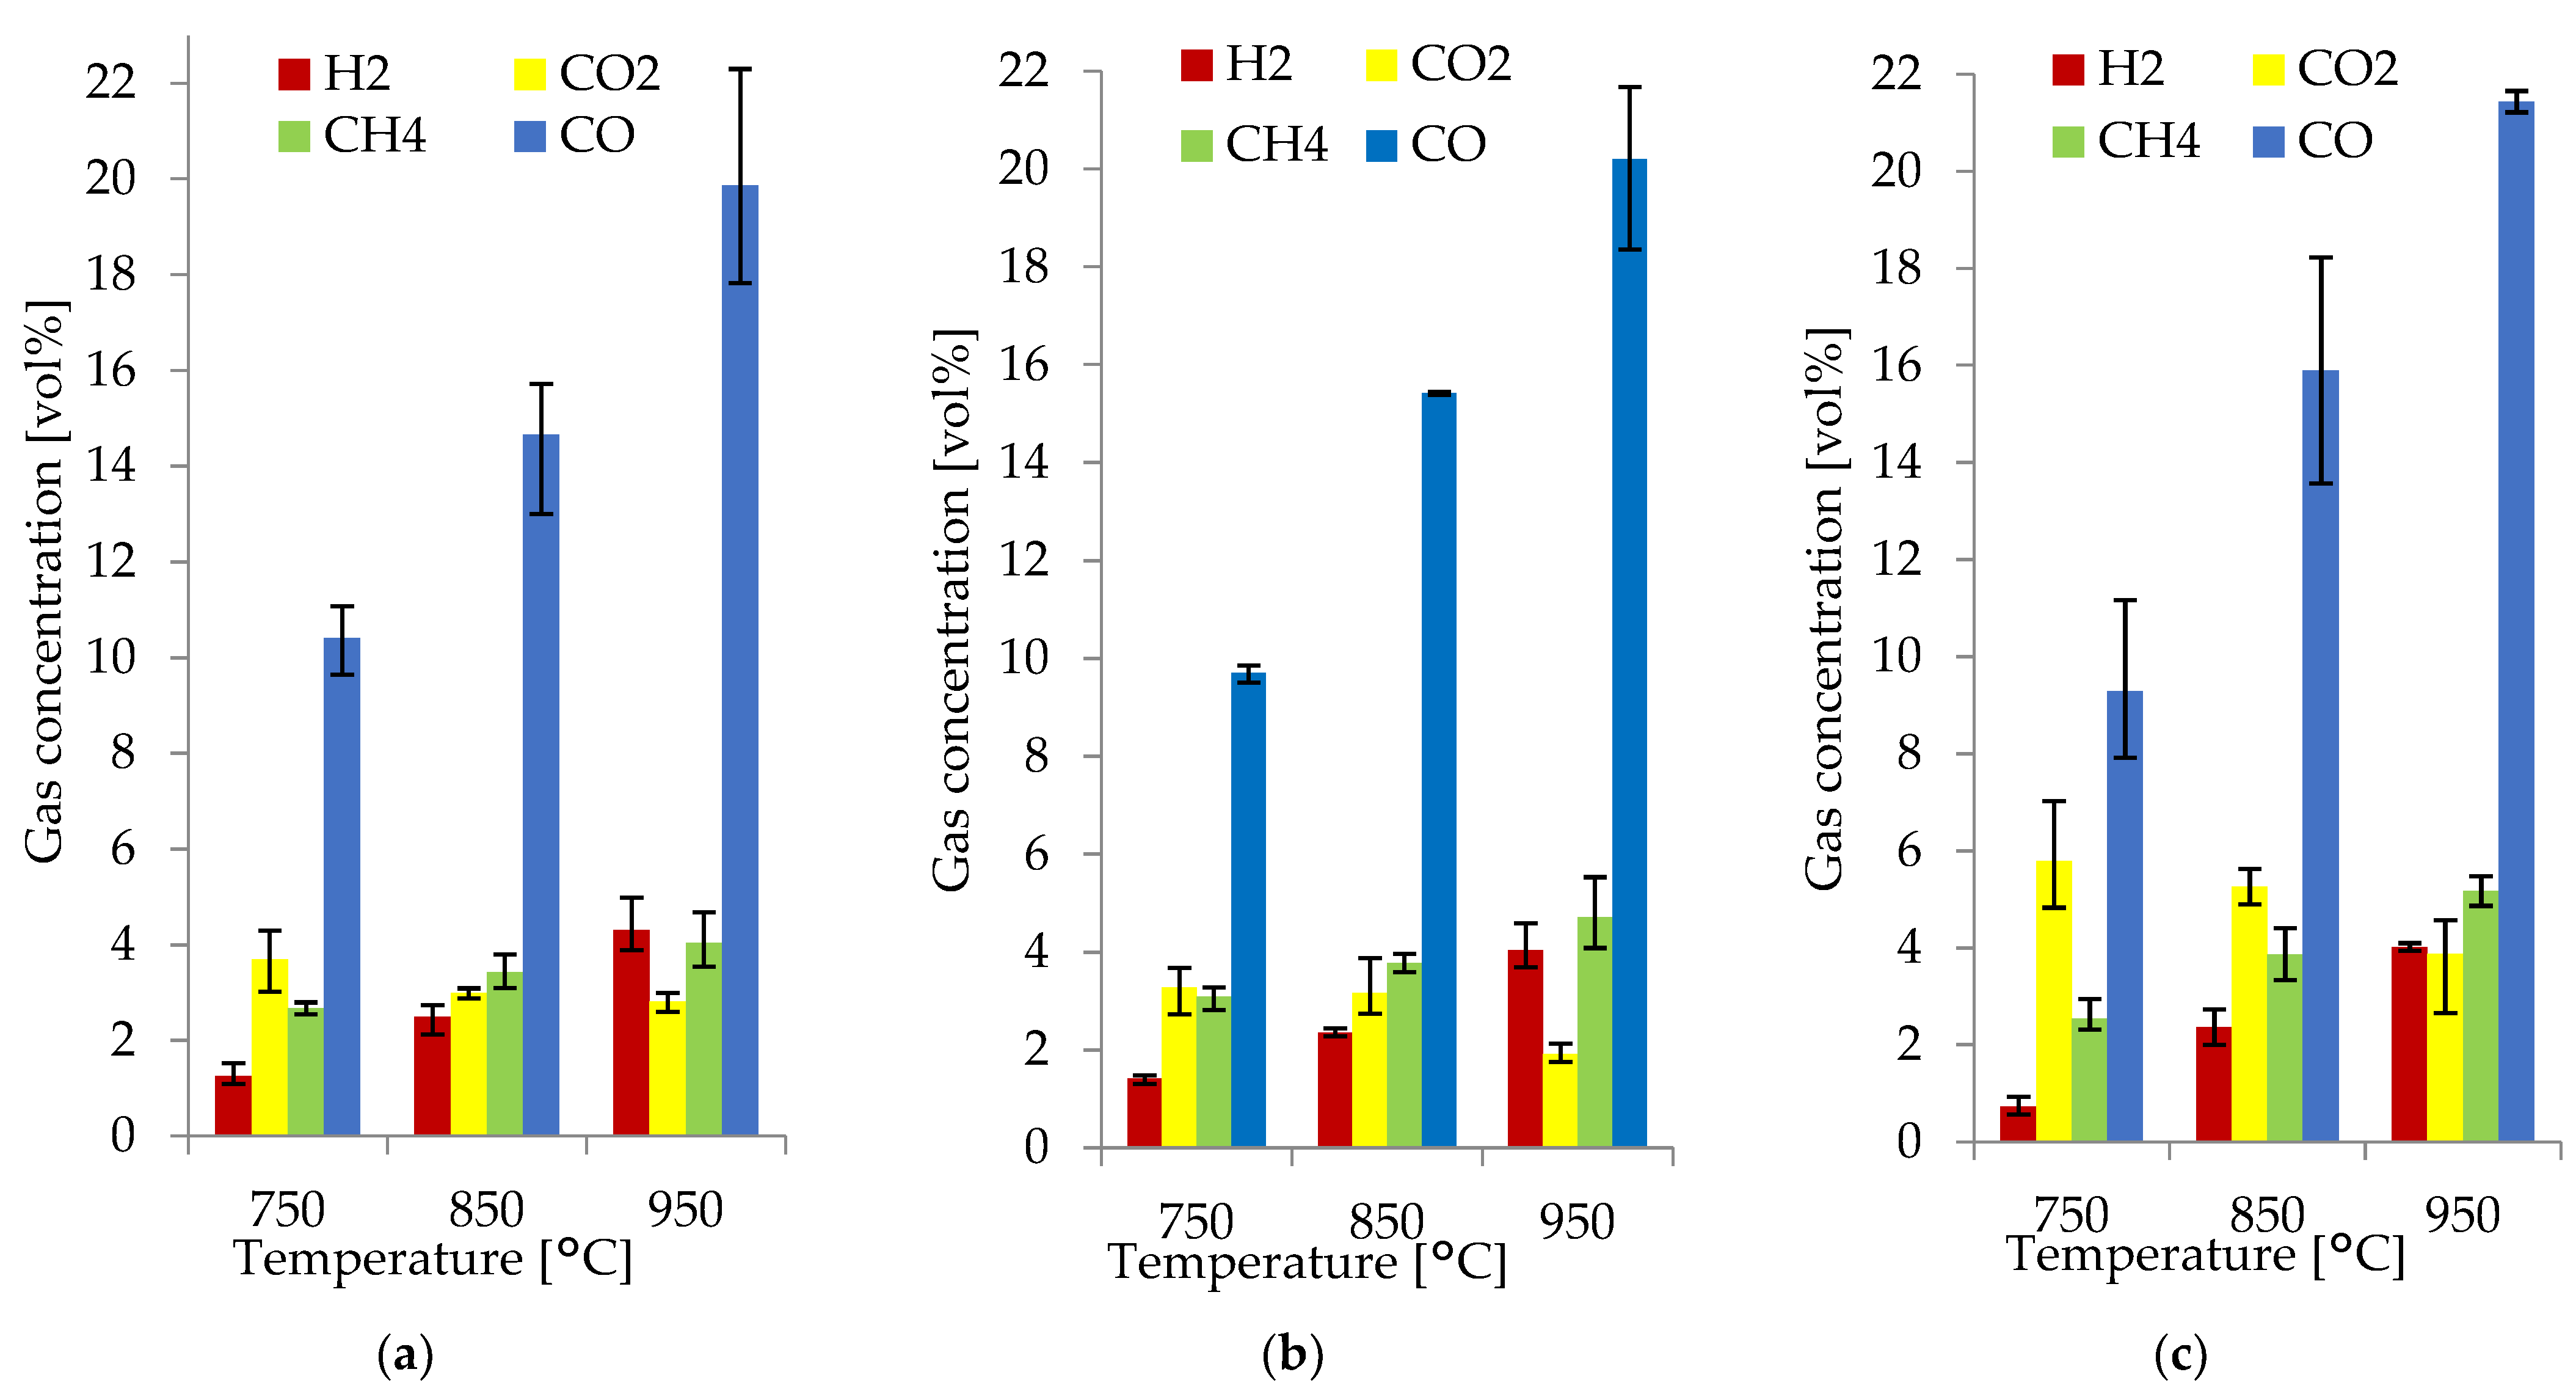
The H2, CO, CH4, and CO2 concentrations in the producer gas obtained at 750, 850, and 950 °C with an average RSD of 11.8% are shown in Figure 3a–c. H2, CO, CH4, and CO2 were the main gas species obtained from gasification; the rest of the producer was gas composed of H2O; O2; sulfur dioxide (SO2); hydrocarbons such as ethane (C2H6), ethylene (C2H4), propane (C3H8), hexane (C6H14), benzene (C6H6), and toluene (C7H8); and nitrogen-containing compounds NO, NO2, N2O, NH3, and other hydrocarbons.
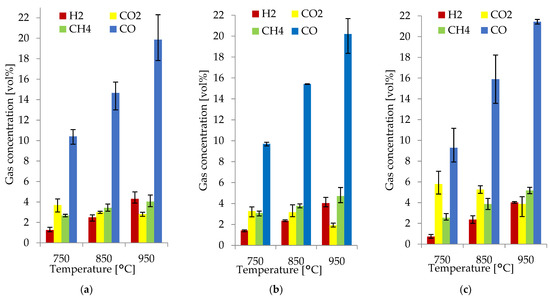
Figure 3.
Producer gas composition from the gasification of spruce (a), alder (b), and pine (c).
Figure 3 shows that the gas composition of each biomass species differed very slightly. The main component of the combustible gases was CO, with a concentration between 9.3–10.4 vol% at 750 °C, 14.7–15.9 vol% at 850 °C, and 19.9–21.4 vol% at 950 °C. For H2, there was a variation in concentration from 0.7–1.3 vol% at 750 °C, 2.4–2.5 vol% at 850 °C, and 4.0–4.3 vol% at 950 °C. CH4 concentration ranged from 2.5–3.1 vol% at 750 °C, 3.4–3.9 vol% at 850 °C, and 4.1–5.2 vol% at 950 °C. The CO2 concentration ranged from 1.9–5.9 vol% at all temperatures. In all the WB species, the producer gas composition was comparable because of their similarities in elemental composition and other properties such as moisture, fixed carbon, ash content, and heating values. This, together with the implementation of uniform operational parameters, led to a producer gas with a very similar composition.
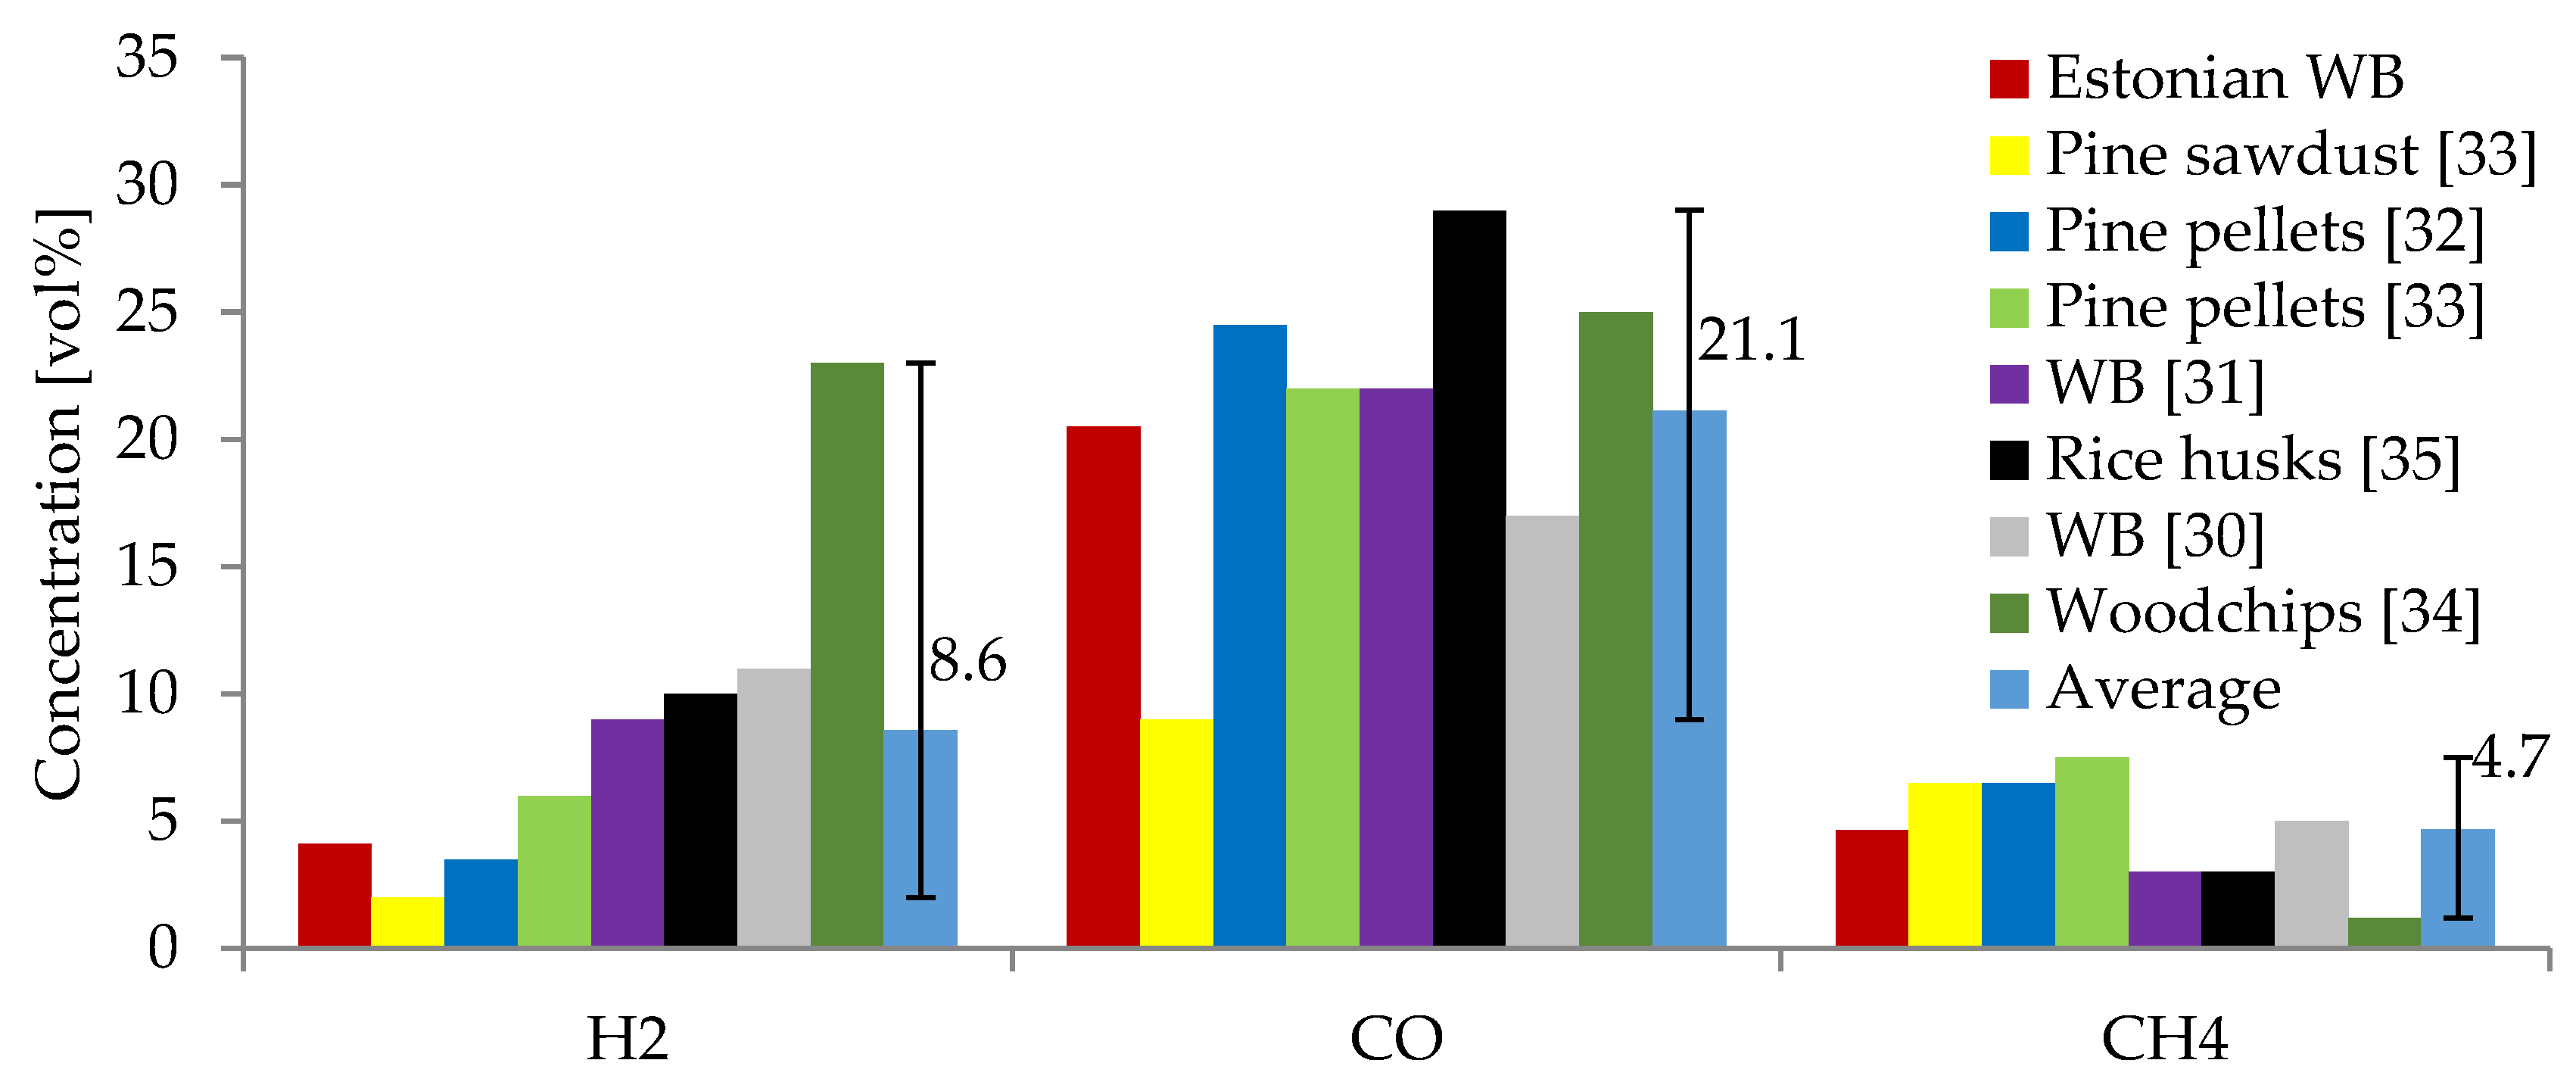
The results obtained at 950 °C showed the highest concentration of combustible gases (H2, CO, and CH4). These were compared to other studies on the gasification of wood chips and other biomass in air atmospheres at temperatures ranging from 700 to 1100 °C. These studies used WB [30,31], pine pellets [32,33], pine sawdust [33], woodchips [34], and rice husks [35] as feedstock. A comparison of the average gas composition for each study is shown in Figure 4. As can be seen, CO is the main combustible gas in all cases, with concentrations ranging from 9–35 vol%. This study’s CO concentrations are comparable and within the same range as those derived from other studies [30,31,32,34,36,37,38]. In the above-mentioned studies, the concentration of H2 ranged from 2–35 vol% compared to a concentration from 4.0 to 4.3 vol% obtained in the producer gas from the gasification of the currently studied WB, which was similar to the results of Joka et al., Inayat et al., and Poskrobo et al. [31,32,33]. However, some studies of WB gasification in fixed-bed reactors by Brynda et al. and Bhatia et al. [34,37] also demonstrated higher concentrations of H2 (16–25 vol%). The concentration of CH4 from the studied WB was within the same range as in most of the reviewed studies. A slightly higher concentration of CH4 was obtained in the current study (4.1–5.2 vol%) compared to that of 1–5 vol% obtained from other studies using fixed-bed reactors [30,31,34,37,38]. The CO2 concentration was lower in the current study (1.9–3.9 vol%) compared to that of other studies using WB (9.5–15 vol%) [30,31,34,37].
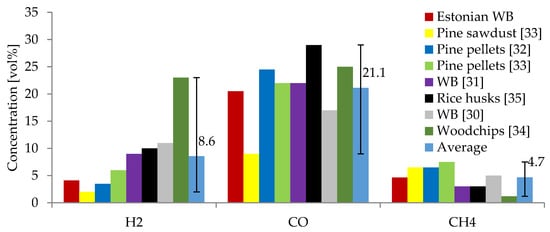
Figure 4.
Comparison of producer gas composition of Estonian WB with other studies found in the literature.
3.3. Effect of Temperature
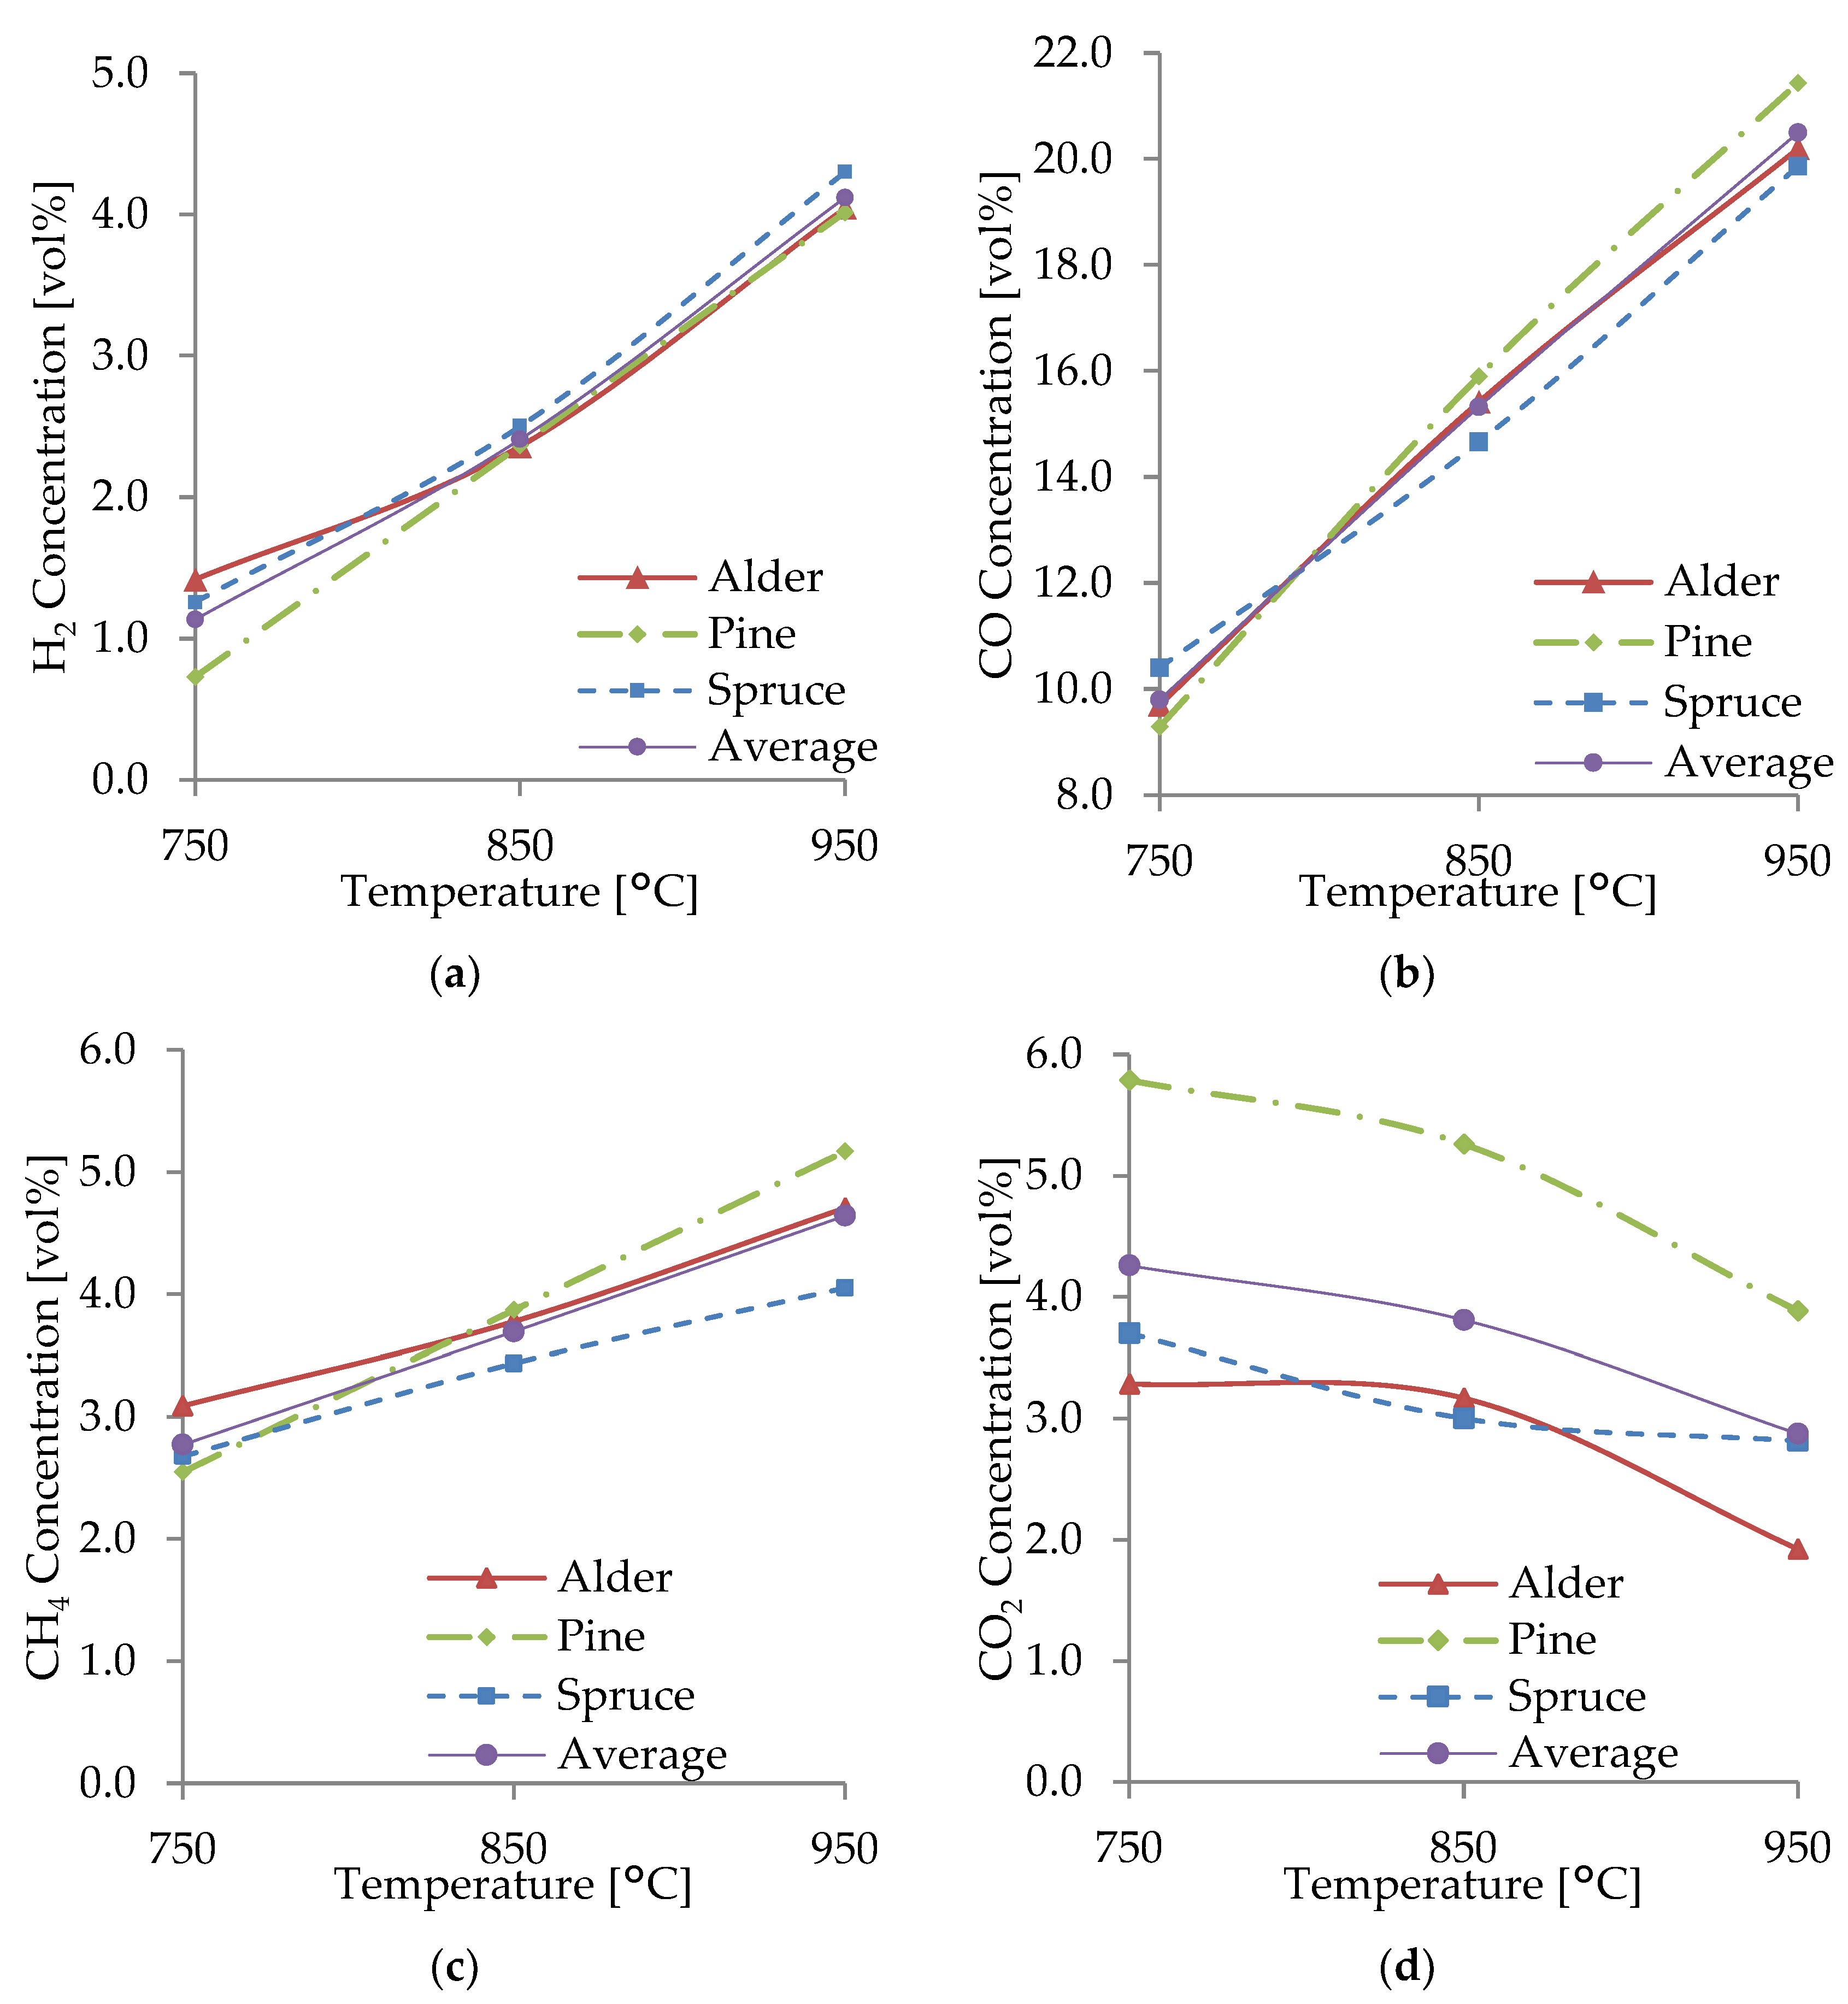
Figure 5a–d display the effect of the gasification temperature on the main combustible gases (H2, CO, and CH4) and CO2 from spruce, alder, and pine gasification. It is observed that as the gasification temperature increased from 750 to 850 and 950 °C, the H2, CO, and CH4 concentrations increased, while the CO2 concentration decreased as the temperature increased. The levels of H2, CO, and CH4 at 950 °C were higher than those in gasification at 750 °C by 3.6-, 2.1-, and 1.7-fold, respectively. The behavior is consistent with what Almeida et al. [39] found during the gasification experiments at 700–950 °C using olive kernels, waste, and bagasse as feedstock, where a significant increase in H2, CO, and CH4 concentrations was observed up to 850 °C, while CO2 levels decreased. Similarly, the present results agree with the findings of Halim et al. [40] of palm fiber gasification at 650–900 °C, where it was found that with increasing temperature, H2 concentrations and CO concentrations increased, but CH4 concentrations decreased. The results of Yahaya et al. [41] also agree with the current results, which indicate that increasing the temperature from 700 to 900 °C increased CO and H2. Likewise, a study on the gasification of empty fruit bunches by Lau Sze Yii et al. [42] showed an overall higher volume percentage of H2, CO, and CO2 at 900 °C compared to those at 700 and 800 °C. The effect of temperature was similar also for household waste studied by Zeng et al. [43], where H2, CO, and CH4 gradually increased, while CO2 decreased as the gasification temperature increased.
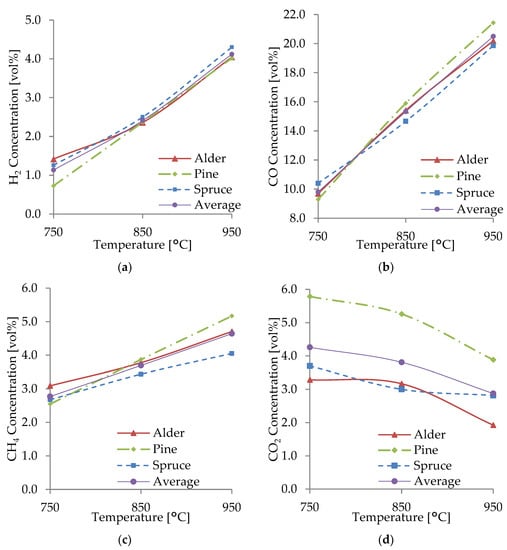
Figure 5.
Concentrations of H2 (a), CO (b), CH4 (c), and CO2 (d) from the gasification of WB.
The yield of gas species depends on the heterogeneous, homogeneous, endothermic, and exothermic chemical reactions that occur in the reduction zone during gasification. The main gasification reactions (R1–R6) analyzed are indicated below.
| Primary reactions | (R1) | Boudouard | (+172.0 kJ/mol) | |
| (R2) | Water–gas | (+131.0 kJ/mol) | ||
| (R3) | Water–gas shift | (−41.0 kJ/mol) | ||
| Secondary reactions | (R4) | Methane dry reforming | (+247.0 kJ/mol) | |
| (R5) | Methane steam reforming | (+206.0 kJ/mol) | ||
| (R6) | Methane formation | (−75.0 kJ/mol) |
A general increase in H2, CO, and CH4 concentrations was observed at temperatures of 850 and 950 °C, respectively. Gas concentrations increased at higher temperatures as the products of endothermic reactions (R1, R2, R4, and R5) were favored and the reactants of exothermic reactions (R3, R6) were favored, according to Le Chatelier’s principle [42]. It was found that the higher yield was a result of an increase in the rate of all reactions, especially R1–R3 and R6, and an increased degree of thermal cracking at higher temperatures. At temperatures above 850 °C, water–gas (R2 and R3), Boudouard (R1), and steam-reforming reactions (R5) dominated the gasification process and produced higher amounts of CO and H2. Lau Sze Yii et al. [42] also had similar observations. Additionally, the water–gas reaction (R2) may have had a more considerable contribution than the Boudouard reaction (R1) for the production of H2 and CO, as at higher bed temperatures, this reaction (R2) has a faster reaction rate, as also explained by Almeida et al. [39]. The equilibrium constants (K) of some reactions are more sensitive to temperatures, such as the K of R4, which is significantly more sensitive than that of R1 and R2 [38]. As the reactions mentioned above and their equilibrium constants were favored at higher temperatures, the WB underwent an increased heat transfer and production of H2, CO, and CH4, producing a higher-quality producer gas. However, as the gasification process was allothermal, higher temperatures required more energy and decreased process efficiency.
The production of H2 was favored by the chemical reactions R2 and R5–R6. As the temperature increased, reactions R2, R4, and R5 moved toward the production of products, including H2 and CO. This was also observed by Huang et al. [38] and by Halim et al. [40], where an increment in H2 occurred at higher temperatures due to methane dry and steam-reforming reactions (R4 and R5). This effect on the yield of H2 was also noticed by Ahmad et al. [7] due to the water–gas and steam-reforming reactions (R2 and R5). The endothermic methane-reforming reactions and secondary reactions of tar reforming and cracking had a significant role in producing H2 at temperatures over 850 °C, as also observed by Yahaya et al. [41] and Lau Sze Yii et al. [42]. An increase in H2 as the gasification temperature rises has been previously reported when using WB resources, including pine waste, pine sawdust, wood pine, eucalyptus, and holm-oak sawdust [44]. According to Franco et al. [45], alkali and alkaline earth metals in the WB may also play a role in promoting the water–gas shift reaction, acting as catalysts producing more H2. A relatively lower concentration of H2 in the producer gas can be attributed to having air as gasifying agent and a WB with relatively low moisture content, resulting in a lower amount of steam participating in R2, R3, and R5 and thus a lower production of H2. The water–gas shift reaction (R3) favored CO and H2O production, reducing H2 production.
CO was the predominant combustible gas with a concentration as high as 21.4 vol% for pine and an average concentration of 20.5 vol% at 950 °C. The production of CO significantly increased as the gasification temperature increased. The main reactions involved in CO production were the heterogeneous endothermic Boudouard (R1) and the water–gas (R2 and R3) reactions, as, at higher temperatures, carbon reacts with steam and CO2, producing CO. There is an observable correlation between the increase in CO and a decrease in CO2; this was due to the consumption of CO2 in R1, R3, and R4, which favored CO production as temperature raised. Some studies have observed the same behavior in CO production as the gasification temperature increases, with a remarkable increase in CO in the gasification of coconut and palm kern shells [41] and empty fruit bunches [42]. Some other studies have reported an equilibrium peak in CO production at 900 °C [40]. Meanwhile, CO has also been observed to decrease with temperature rise, owing to the exothermic oxidation reactions, such as char partial combustion [7].
From the main gasification reactions, CH4 was produced from the heterogeneous reaction of methane formation (R6). The current experiments noted that the CH4 production had a slight increase at higher gasification temperatures, especially with alder and spruce. CH4 production did not increase in the same magnitude as H2 and CO since it played an essential role as a reactant in the methane dry and steam-reforming reactions (R4 and R5) to produce H2 and CO. This behavior was also observed by Emami et al. [44]. Likewise, CH4 consumption in R4 and R5 reduced its concentration at higher temperatures in the gasification of palm fibers [40] and palm kernel shells [41].
The production of CO2 at lower temperatures was affected mainly by the exothermic water–gas shift reaction (R3) in which the products were favored. As the temperature increased, the water–gas shift reaction favored the reactants, consuming CO2. CO2 production also decreased with temperature rise owing to its role as a reactant in the Boudouard (R1) and dry-reforming (R4) reactions. Therefore, the concentration of CO2 in the producer gas decreased as the temperature increased. This behavior was also observed by Emami et al. [44], where CO2 decreased or remained constant, especially at temperatures above 830 °C. However, Yahaya et al. [41] reported an increase in the concentration of CO2 from 700–800 °C, followed by a drastic decrease at higher temperatures, while Lau Sze Yii et al. [42] reported higher CO2 concentration at higher temperatures.
The gasification temperature had an effect on the composition of the producer gas and the yield of products. From observations in this current study, the char and tar yield significantly decreased with temperature rise. Higher gasification temperatures increased the heat transfer in the WB particles, which produced a higher yield of gas and a lower yield of solid and liquid residues. Moreover, secondary cracking and thermal cracking reactions of tar occurring at more elevated temperatures produced more gases owing to the volatilization of active components of tar, as explained by Sikarwar et al. [46]. For the current prototype reactor, gasifying Estonian WB at 950 °C led to producing a high yield of producer gas with a higher concentration of combustible gases. Some studies have found 900 °C to be the optimal temperature for high carbon conversion and gas yield [14]. Other experiments consider optimal temperatures of around 1000 and 1100 °C for fixed-bed and fluidized-bed reactors, respectively [46]. Lower temperatures (<750 °C), as shown in this work, resulted in a producer gas with a lower concentration of combustible gases. On the other hand, high gasification temperatures (>1000 °C) can affect the efficiency of the gasification, the materials, and the construction of the reactor, producing higher yields of undesirable gases (NOx) and leading to ash fusion [44]. Future research for the implemented WB could study the gasification behavior with a larger range of temperatures of up to 1000 °C
3.4. Effect of the ER
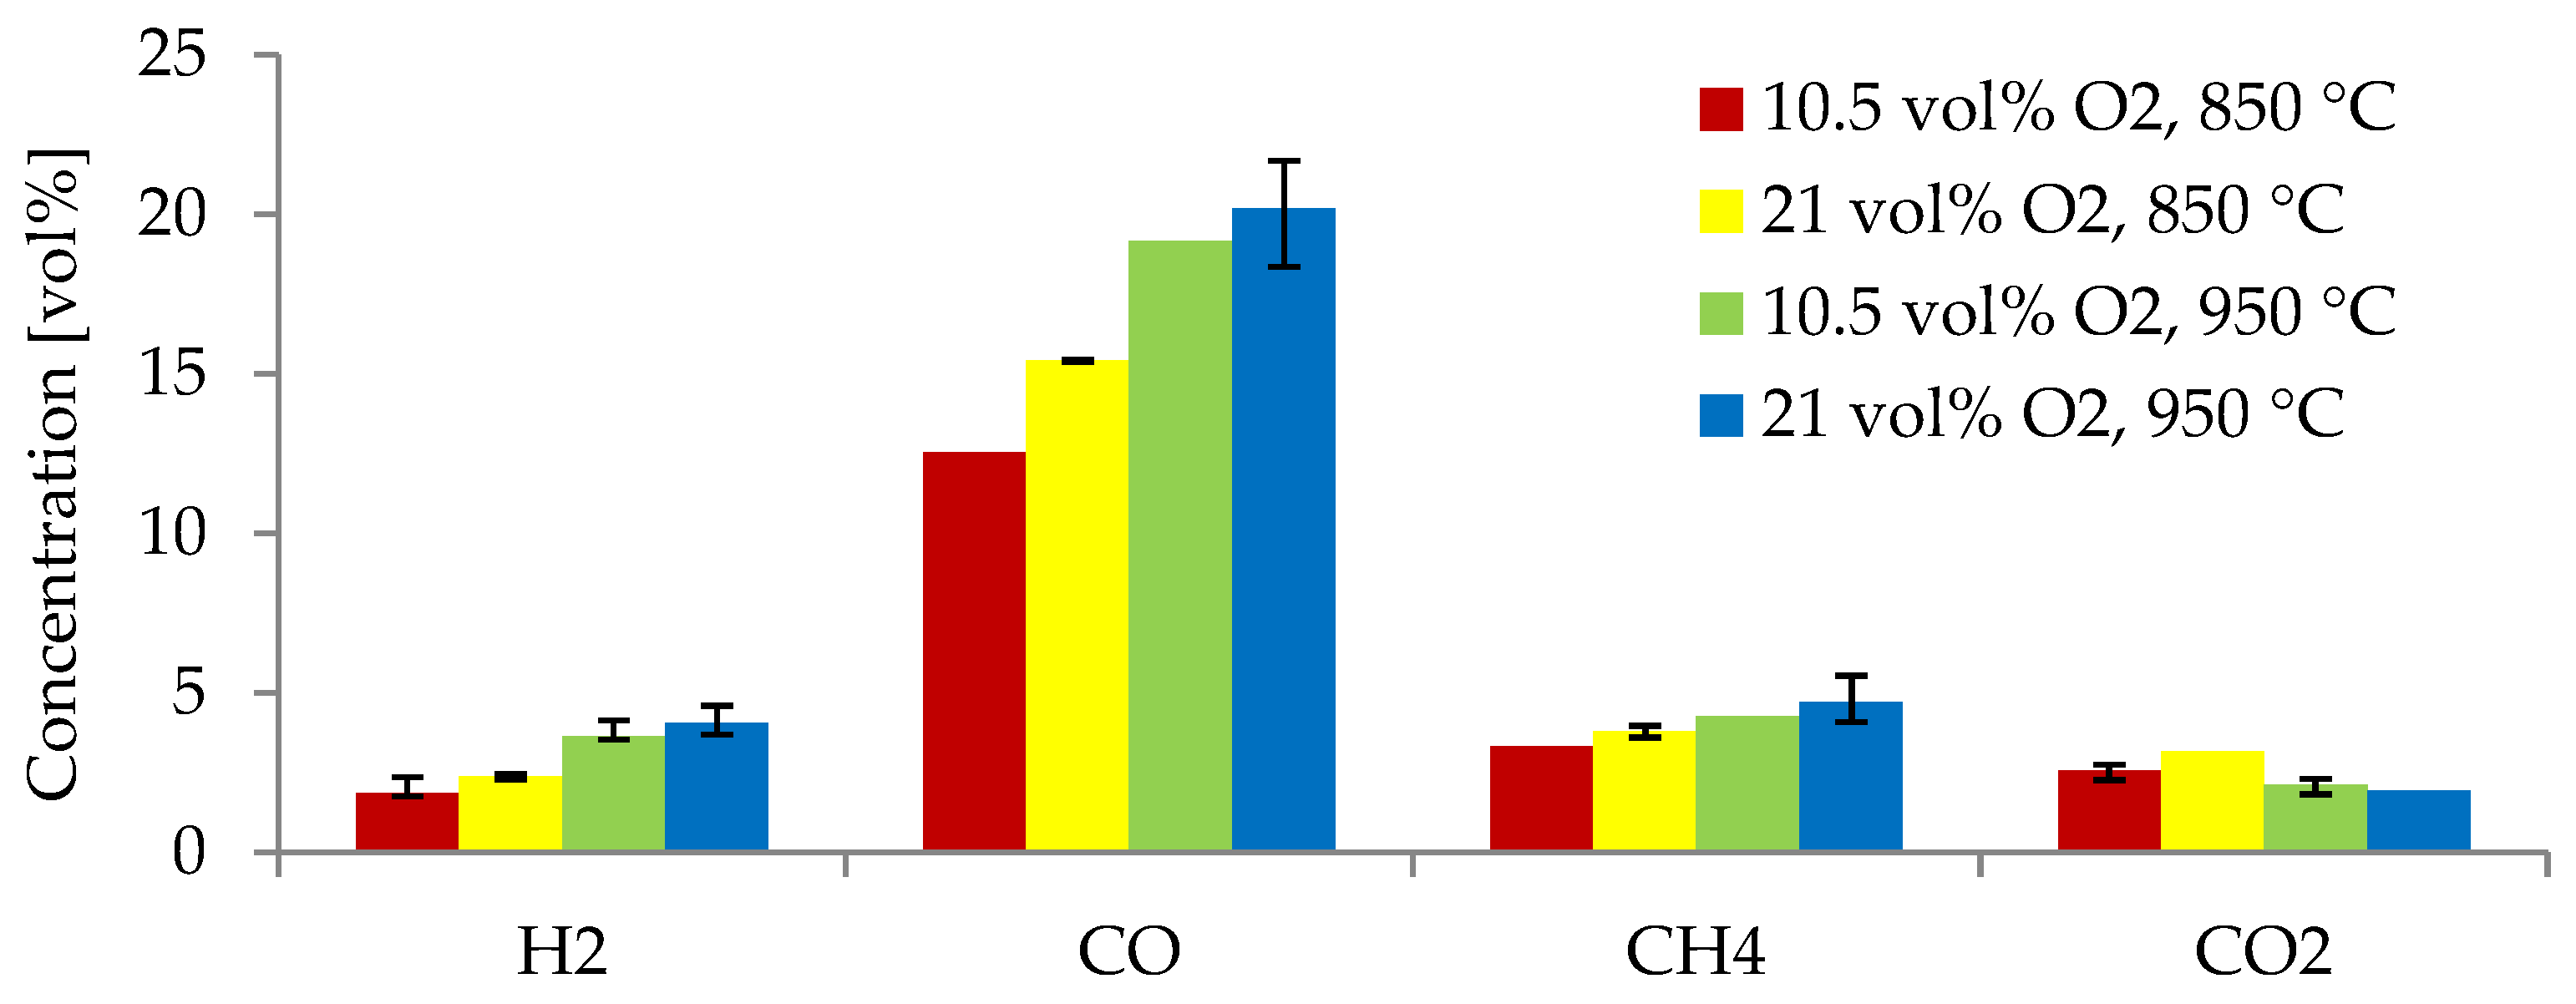
Figure 6 indicates the producer gas composition from the gasification of alder at 850 and 950 °C using two equivalence ratios: 0.38 and 0.19. As previously explained, gasification experiments at higher temperatures (950 °C) resulted in higher concentrations of H2, CO, and CH4. For gasification of alder at 850 °C, the yields of H2, CO, CH4 decreased (22.1%, 18.7%, and 12.5%, respectively) when using an ER of 0.19 compared to those obtained with an ER of 0.38. At 950 °C, the yields of H2, CO, and CH4 were 10.5%, 5.1%, and 9.7% lower, respectively, when using an ER of 0.19 compared to using an ER of 0.38. The concentration of H2 decreased the most as the ER was reduced.
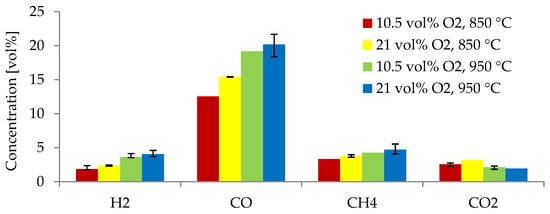
Figure 6.
Producer gas species obtained from alder gasification at different gas agent blends and temperatures.
In the current study, 0.38 was the optimal ER for producing higher concentrations of H2 and CO while reducing CO2. This value is within the optimal range (0.2–0.4) for gasification processes [42]. These results agree well with different studies, in which it has been observed that ERs lower than 0.2 result in incomplete gasification [46] and ERs greater than 0.4 decrease the calorific value of the producer gas and increase the content of CO2, as the process starts to behave as a combustion process [43]. An ER of 0.38 was suitable for the current study, as too-high ERs led to the promotion of oxidation reactions, reducing the production of H2 and CO and the efficiency. This behavior is due to the increase in oxygen supply to the process, leading to more complete oxidation, rather than partial oxidation, which is required for gasification [42]. However, some studies have found an optimal ER in the lower optimal range. Almeida et al. [39] tested ERs from 0.2 to 0.4 and found an ER of 0.2 to be the most optimal for gasification of olive kernels. Lau Sze Yii et al. [42] demonstrated an optimal ER of 0.3 in the gasification of empty fruit bunches for increasing the concentration of H2 and CO. In the current study, an ER of 0.38 resulted in the highest concentration of combustible gases. This ER is in the upper limit of the optimal range (0.2–0.4). A higher ER of 0.38 may have also contributed to tar cracking and the reaction of volatiles, increasing the gas yield and the production of combustible gases, compared to gasification with an ER of 0.19. The latter was also observed by Sikarwar et al. [36]
3.5. LHV
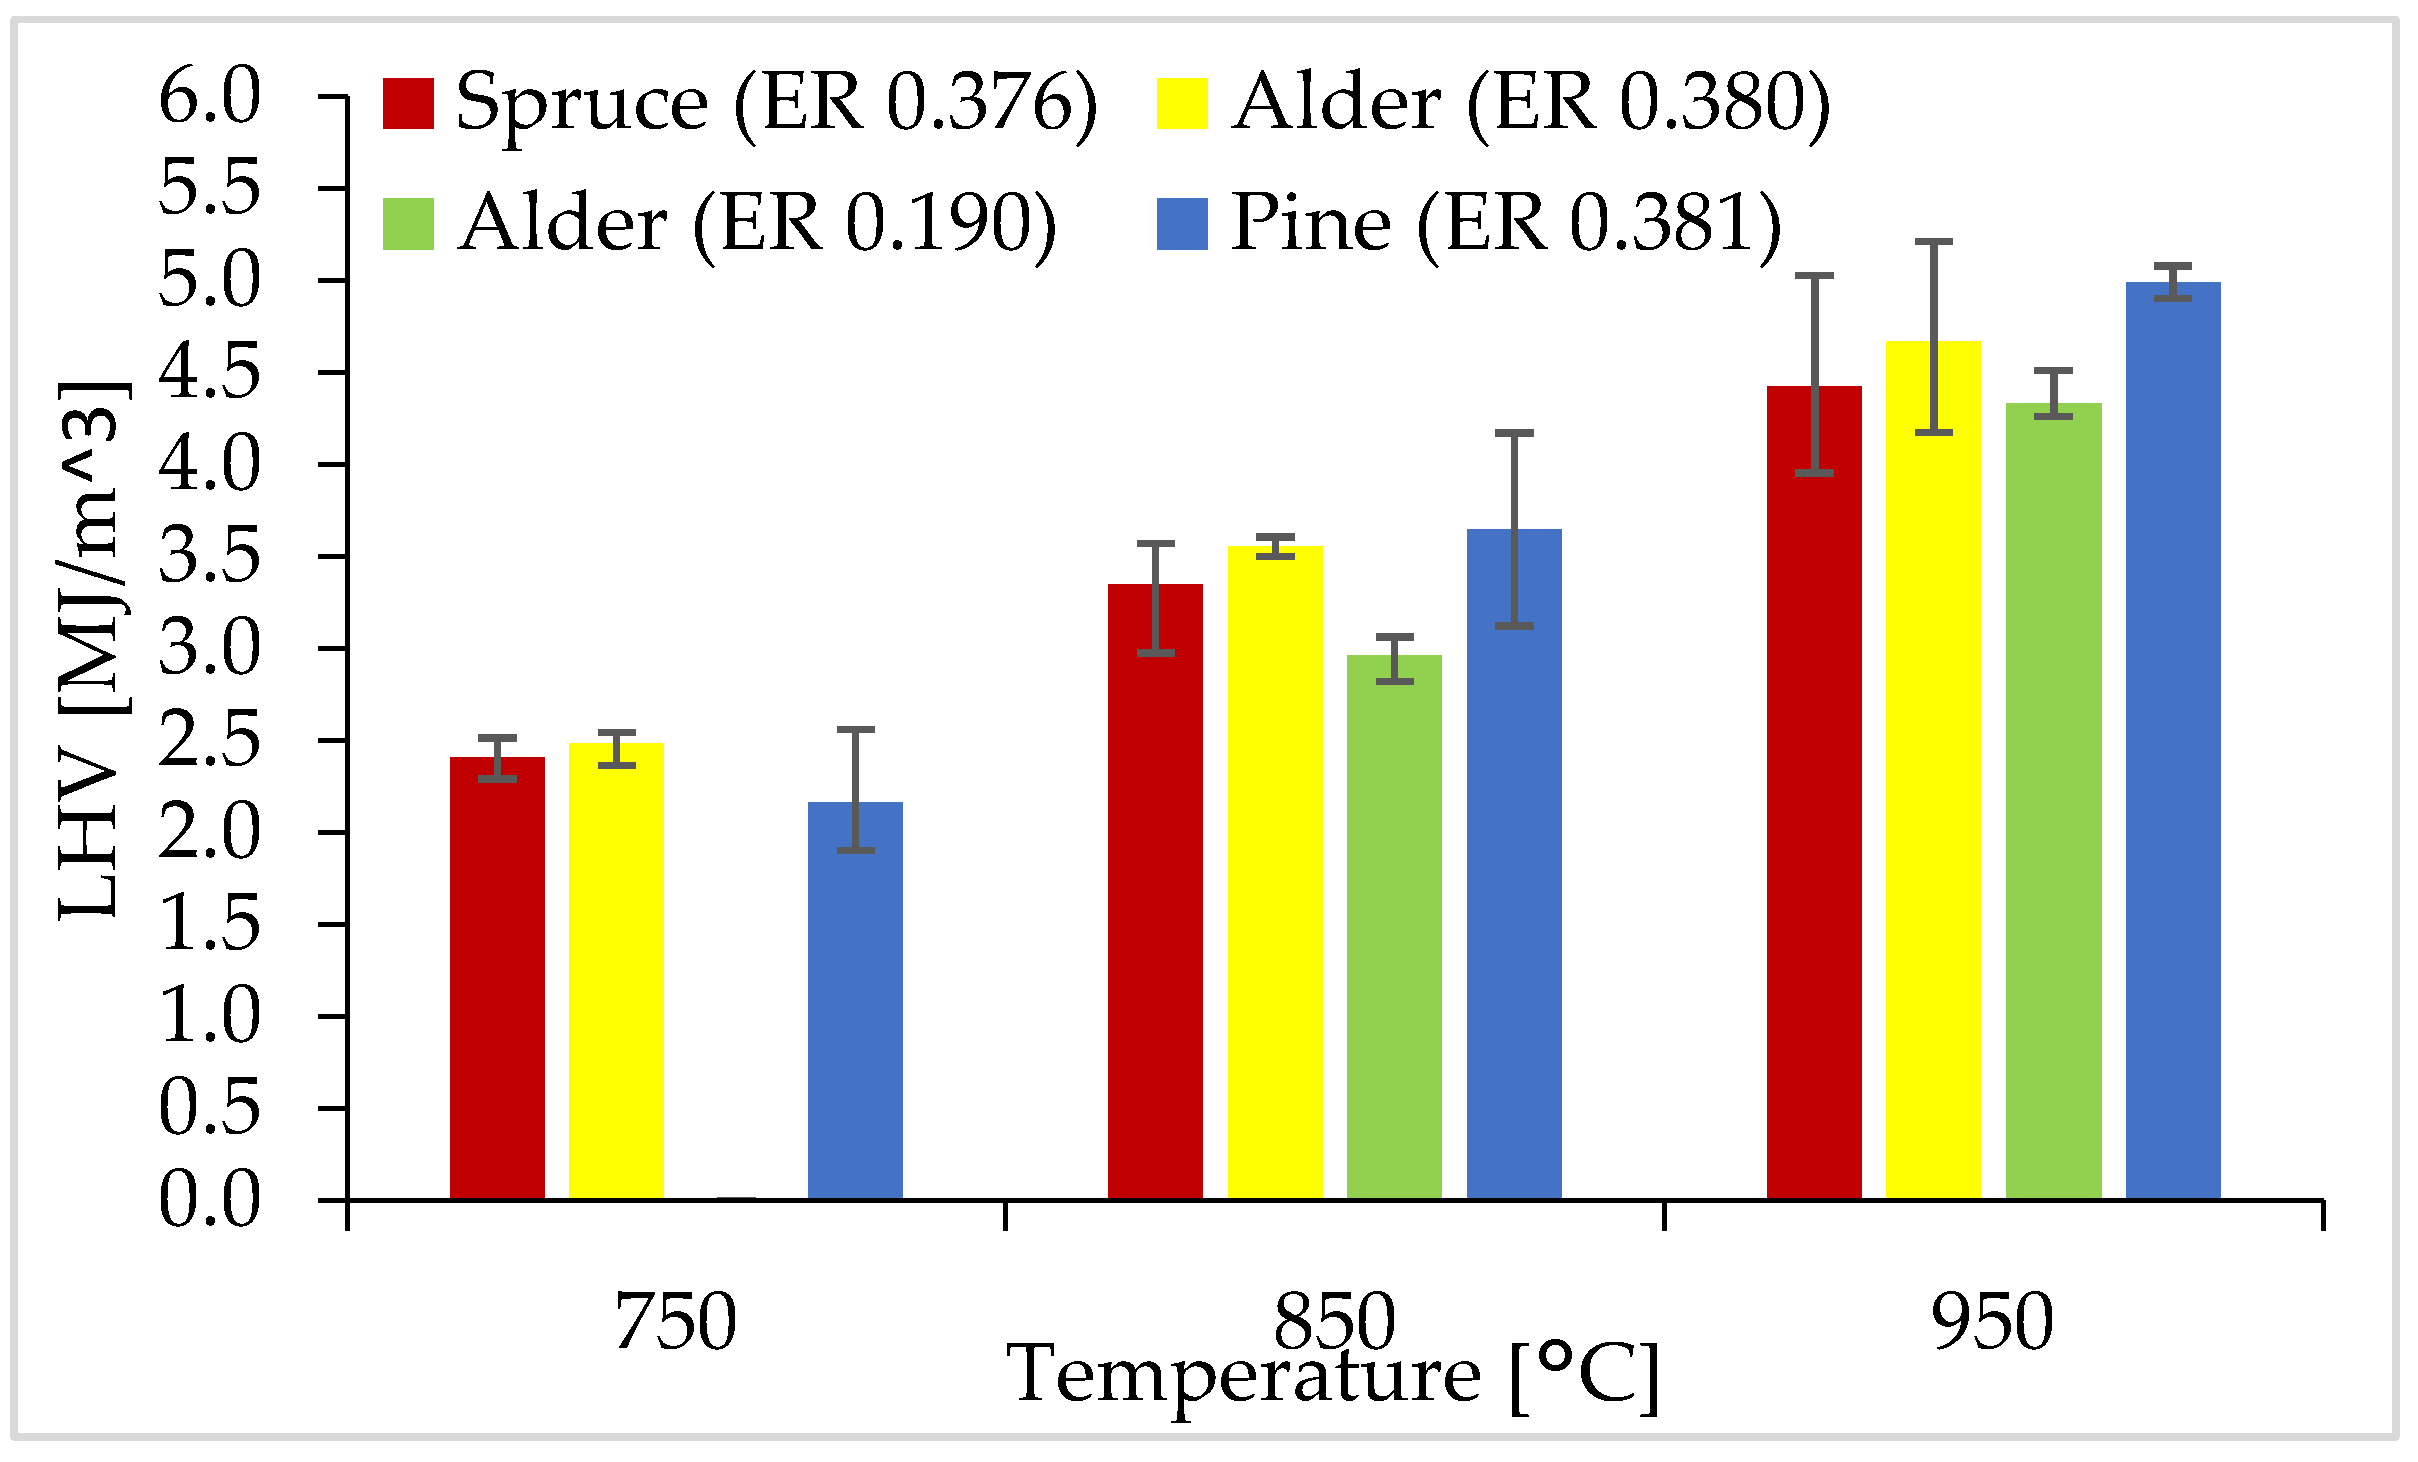
Figure 7 displays the LHV calculated for WB gasification in all temperatures and ER conditions.
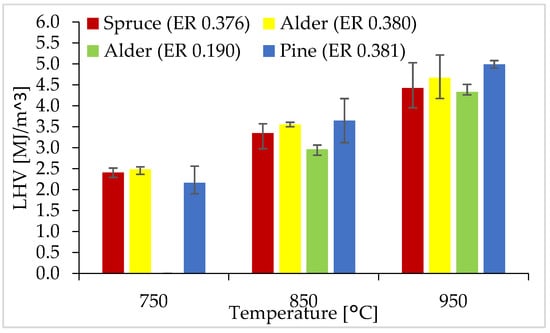
Figure 7.
LHV for WB at 750, 850, and 950 °C.
From Figure 7, it is shown that the LHV ranged from 2.0–5.0 MJ/m3, with an average RSD of 9.3%. The LHV increased as the gasification temperature raised, with an average LHV of 2.4, 3.5, and 4.7 MJ/m3 at 750, 850, and 950 °C, respectively, using an ER of around 0.38. There were no significant differences in the LHV of all three WB types; however, pine had the highest LHV at 850 and 950 °C. Compared to gasification with an ER of 0.39, the LHV was lower for gasification using an ER of 0.19. As observed in Section 3.3, the concentration of combustible gases increased as the gasification temperature raised, which directly resulted in an increase in the LHV at higher temperatures. Additionally, a lower ER of 0.19 resulted in incomplete gasification, producing fewer combustible gases and thus a lower LHV.
The producer gas obtained from gasification of WB at 950 °C had an LHV comparable to a typical LHV (4–7 MJ/m3) obtained from the gasification with air as a gasifying agent [6]. Even though the producer gas had a relatively low LHV and a high concentration of N2 (>50 vol%), the gas agent is less expensive and produces low amounts of chars and tars, with a simple gasification system [12,47,48]. Future experiments with steam as a gas agent could potentially increase the heating value up to 18 MJ/m3. However, an increase in tars and a decrease in efficiency should be considered. Other potential options to consider are CO2 and steam–air mixtures. The LHV could also be increased by optimizing the gasification parameters to increase the production of H2, decrease the share of tars and solids produced, and decrease the heat losses in the reactor.
3.6. Total Organic Compounds
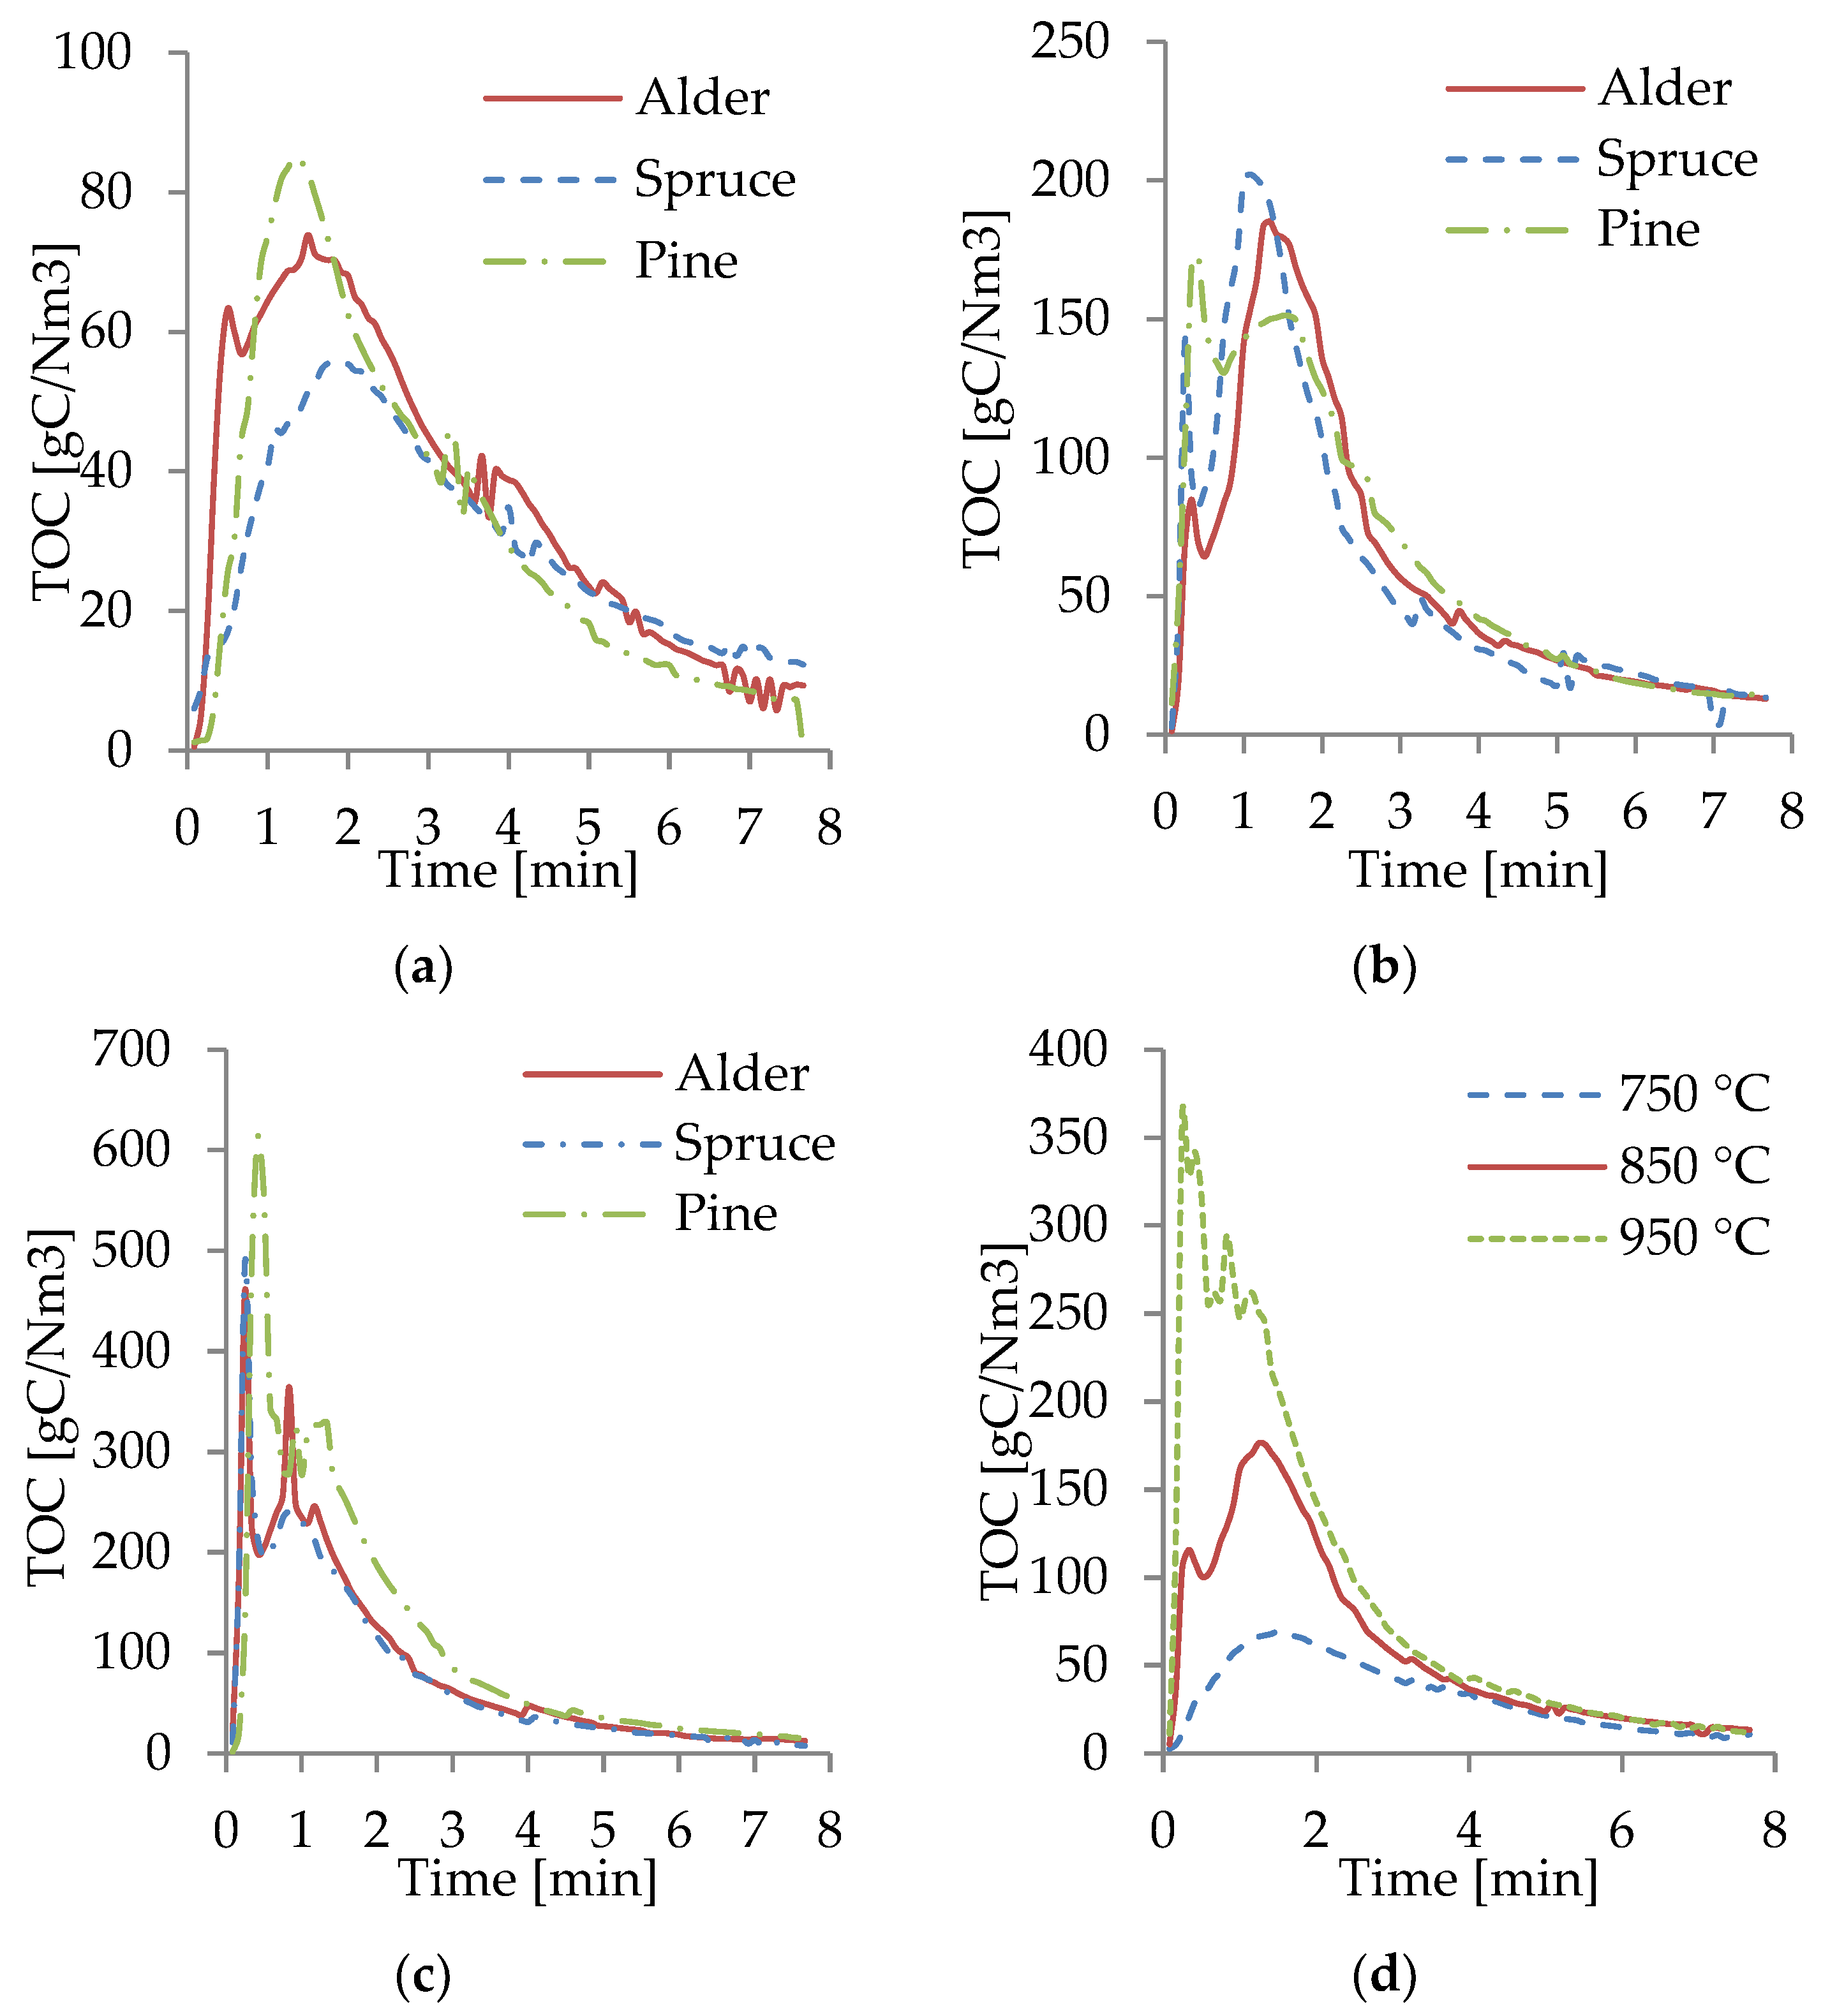
The TOC spectra measured by the FTIR from the gasification at different temperatures are shown in Figure 8a–c. For all WB samples at 950 °C, most of the fractions of TOC were produced in the first 3 min of the process, with the highest peaks of TOC occurring within the first minute. This behavior was caused by the increase in the heating rate, owing to a higher gasification temperature, promoting more rapid pyrolysis and gasification. At 850 °C, most of the TOCs were produced within the first 4 min. However, the peaks were significantly lower than at 950 °C, and the TOC production was more evenly distributed throughout the gasification time. The TOC at 750 °C was the lowest and more evenly distributed throughout the process compared to those at 850 and 950 °C. In this case, at 750 °C, the reactions occurred at a lower rate.
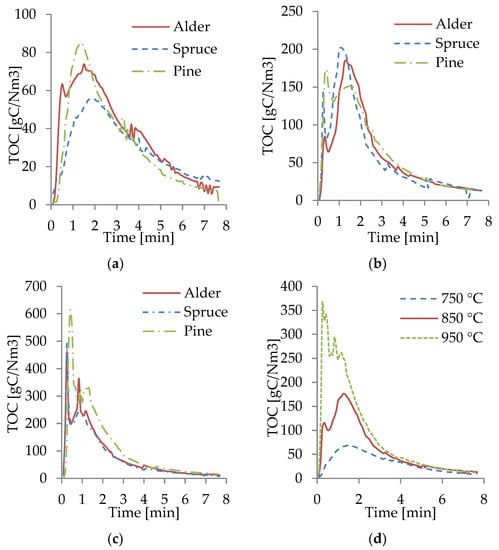
Figure 8.
TOC from gasification of WB at 750 (a), 850 (b), and 950 °C (c) and average TOC (d).
For all the temperatures and all WB species, the largest TOC peaks occurred at the beginning of the gasification. Moreover, it was observed that the gasification ended after 7–8 min, when the TOC production was stable and close to zero and most of the biomass had been transformed into gas, tar, and solid residues. The TOC content was observed to be similar for all WB samples, as shown in Figure 8a–c. This behavior was expected based on the results of the composition of the biomass and the results obtained from the composition of the producer gas. The slight differences in the TOC content of pine correlated with the slightly higher concentration of CH4, CO, and CO2 in the producer gas. Figure 8d shows an average of the TOC content at different temperatures, where it can be visually seen how significantly higher the TOCs production was at 950 °C, compared to 750 °C, which can be related to the higher concentration of CO and CH4 in the producer gas as the gasification temperature increased.
From Figure 8d, the correlation between the obtained combustible gases and the TOC produced can be identified. Higher production of TOC led to a producer gas with a considerably larger concentration of combustible gases, especially CO. A temperature rise can be also correlated with an increased TOC and concentration of CO. The TOC curves show the importance of not only the gasification temperatures but also the residence time. Most of the TOC was produced at the first 3 min of the reaction; this indicated that the defined residence time directly affected the composition of the producer gas, as longer residence times have a larger dilution of air (especially N2), reducing the concentration of combustible gases. Continuously measuring the composition of the producer gas, from the beginning until the end of the gasification to track the progress of the reactions, can contribute to defining the optimal gasification parameters, increase the combustible share and the LHV in the producer gas, and increase the overall efficiency of the process.
4. Conclusions
A study of the effect of temperature and equivalence ratio on the composition of the producer gas (H2, CO, CH4, and CO2) was carried out with woody biomass (WB). The experimental study consisted of the gasification of samples at 750, 850, and 950 °C in a drop tube reactor using air as a gasifying agent. Two ERs were tested: 0.38 and 0.19. According to the obtained results, Estonian WB resources are suitable for gasification since the producer gas has a composition comparable to other studies. The producer gas obtained provides potential possibilities for studying thermochemical gasification of mixtures of WB resources and mixtures of biomass/oil shale as a next step.
The composition and properties of the studied WB samples did not differ significantly. The woody species produced similar concentrations of combustible gases at gasification at 950 °C with an average of 4.1, 20.5, and 4.6 for H2, CO, and CH4, respectively, and a LHV ranging from 4.3–5.1 MJ/m3. The similarities show that mixtures and residues of these local wood species (alder, spruce, and pine) may be utilized to generate a high-quality producer gas through gasification. These results are consistent with those from other studies on the composition of producer gas. A higher LHV and concentration of combustible gases could be achieved by performing gasification with air/steam blends as the gasifying agent.
Several factors affect the composition of the producer gas, including gasification temperature. At higher temperatures, such as 850 and 950 °C, gas concentrations of H2, CO, and CH4 increased while CO2 content decreased. The optimum temperature to produce the highest concentration of combustible gases would be 950 °C in the chosen conditions if the composition of the gas would be the priority. CO was the predominant gas species, followed by CH4 and H2. Furthermore, an ER of 0.38 was observed to yield a higher concentration of combustible gases than an ER of 0.19.
The behavior of TOC through the gasification process confirmed the relation between the increase in combustible gases as temperature raised, especially for CO. A continuous measurement of TOC throughout the gasification process operating with batch feeding allows optimizing the residence time and decreasing the concentration of diluted N2 in the producer gas, thus increasing the concentration of combustible gases. Continuous TOC measurement allows an understanding of the evolution of the gasification process. Future experiments with continuous measurement of the producer gas composition could provide a detailed study of the evolution of the production of combustible gases to increase the process’s efficiency and the quality of the producer gas. This can be a valuable consideration for future research of gasification of biomass, especially for a non-continuous feed of BM.
Author Contributions
Conceptualization, A.L.C. and A.K.; methodology, A.L.C., A.K., and O.J.; software, A.L.C.; validation, A.L.C., A.K., and O.J.; formal analysis A.L.C., A.K., and H.L.; writing—original draft preparation, A.L.C.; writing—review and editing, A.L.C., A.K., and H.L.; visualization, A.L.C., A.K., and H.L.; supervision, A.K. All authors have read and agreed to the published version of the manuscript.
Funding
This work was supported by the Estonian Research Council Grant (PSG266).
Institutional Review Board Statement
Not applicable.
Informed Consent Statement
Not applicable.
Data Availability Statement
Data are not publicly available; the data may be made available on request from the corresponding author.
Conflicts of Interest
The authors declare no conflict of interest.
Nomenclature
| A/F | Air-to-fuel ratio |
| ER | Equivalence ratio |
| FTIR | Fourier-transform infrared spectroscopy |
| GC-TCD | Gas chromatography with thermal conductivity detector |
| HHV | Gross of higher heating value |
| LHV | Net or lower heating value |
| RSD | Relative standard deviation |
| TOC | Total organic compounds |
References
- IRENA. REthinking Energy 2017: Accelerating the Global Energy Transformation; IRENA: Abu Dhabi, United Arab Emirates, 2017; Volume 55. [Google Scholar]
- IEA. Energy Atlas World Energy Statistics & World Energy Balances; IEA: Paris, France, 2020. [Google Scholar]
- International Renewable Energy Agency. National Renewably Energy Action Plan (NREAP) 2020; International Renewable Energy Agency: Abu Dhabi, United Arab Emirates, 2020. [Google Scholar]
- Republic of Estonia Ministry of Economic Affairs and Communications. National Development Plan of the Energy Sector until 2030; Republic of Estonia Ministry of Economic Affairs and Communications: Tallinn, Estonia, 2017.
- Statistics Estonia Eesti Statistika Kvartalikiri. 2/18. Quarterly Bulletin of Statistics Estonia—Statistics Estonia. 2018. Available online: https://www.stat.ee/sites/default/files/2020-07/Quarterly_Bulletin_2-2018.pdf (accessed on 1 August 2021).
- Strezov, V.; Evans, T.J. Biomass Processing Technologies; CRC Press: Boca Raton, FL, USA, 2014. [Google Scholar]
- Ahmad, A.A.; Zawawi, N.A.; Kasim, F.; Inayat, A.; Khasri, A. Assessing the gasification performance of biomass: A review on biomass gasification process conditions, optimization and economic evaluation. Renew. Sustain. Energy Rev. 2016, 53, 1333–1347. [Google Scholar] [CrossRef]
- Higman, C.; van der Burgt, M. Gasification, 2nd ed.; Gulf Professional Publishing: Burlington, MA, USA, 2008; ISBN 9780750685283. [Google Scholar]
- Sansaniwal, S.K.; Pal, K.; Rosen, M.; Tyagi, S. Recent advances in the development of biomass gasification technology: A comprehensive review. Renew. Sustain. Energy Rev. 2017, 72, 363–384. [Google Scholar] [CrossRef]
- Sepe, A.M.; Li, J.; Paul, M.C. Assessing biomass steam gasification technologies using a multi-purpose model. Energy Convers. Manag. 2016, 129, 216–226. [Google Scholar] [CrossRef]
- Zhang, L.; Xu, C.C.; Champagne, P. Overview of recent advances in thermo-chemical conversion of biomass. Energy Convers. Manag. 2010, 51, 969–982. [Google Scholar] [CrossRef]
- La Villeta, M.; Costa, M.; Massarotti, N. Modelling approaches to biomass gasification-review. Renew. Sustain. Energy Rev. 2017, 74, 71–88. [Google Scholar] [CrossRef]
- Ruiz, J.; Juárez, M.; Morales, M.; Muñoz, P.; Mendívil, M. Biomass gasification for electricity generation: Review of current technology barriers. Renew. Sustain. Energy Rev. 2013, 18, 174–183. [Google Scholar] [CrossRef]
- Mahinpey, N.; Gomez, A. Review of gasification fundamentals and new findings: Reactors, feedstock, and kinetic studies. Chem. Eng. Sci. 2016, 148, 14–31. [Google Scholar] [CrossRef]
- Pachapur, V.L.; Kutty, P.; Pachapur, P.; Brar, S.K.; Le Bihan, Y.; Galvez-Cloutier, R.; Buelna, G. Seed Pretreatment for Increased Hydrogen Production Using Mixed-Culture Systems with Advantages over Pure-Culture Systems. Energies 2019, 12, 530. [Google Scholar] [CrossRef]
- Cao, L.; Yu, I.K.; Xiong, X.; Tsang, D.C.; Zhang, S.; Clark, J.H.; Hu, C.; Ng, Y.H.; Shang, J.; Ok, Y.S. Biorenewable hydrogen production through biomass gasification: A review and future prospects. Environ. Res. 2020, 186, 109547. [Google Scholar] [CrossRef]
- Hu, Y.; Cheng, Q.; Wang, Y.; Guo, P.; Wang, Z.; Liu, H.; Akbari, A. Investigation of Biomass Gasification Potential in Syngas Production: Characteristics of Dried Biomass Gasification Using Steam as the Gasification Agent. Energy Fuels 2019, 34, 1033–1040. [Google Scholar] [CrossRef]
- He, Q.; Guo, Q.; Umeki, K.; Ding, L.; Wang, F.; Yu, G. Soot formation during biomass gasification: A critical review. Renew. Sustain. Energy Rev. 2021, 139, 110710. [Google Scholar] [CrossRef]
- Wijayanta, A.T.; Alam, S.; Nakaso, K.; Fukai, J.; Shimizu, M. Optimized combustion of biomass volatiles by varying O2 and CO2 levels: A numerical simulation using a highly detailed soot formation reaction mechanism. Bioresour. Technol. 2012, 110, 645–651. [Google Scholar] [CrossRef]
- Ferreiro, A.; Segurado, R.; Costa, M. Modelling soot formation during biomass gasification. Renew. Sustain. Energy Rev. 2020, 134, 110380. [Google Scholar] [CrossRef]
- Sulg, M.; Konist, A.; Järvik, O. Characterization of different wood species as potential feedstocks for gasification. Agron. Res. 2021, 19, 276–299. [Google Scholar]
- Chhiti, Y.; Salvador, S.; Commandré, J.-M.; Broust, F.; Couhert, C. Wood Bio-Oil Noncatalytic Gasification: Influence of Temperature, Dilution by an Alcohol and Ash Content. Energy Fuels 2011, 25, 345–351. [Google Scholar] [CrossRef][Green Version]
- Cascante Cirici, P. Biomass and Oil Shale Co-Pyrolysis. Master’s Thesis, Tallinn University of Technology, Tallinn, Estonia, June 2019. [Google Scholar]
- Proto, A.R.; Longo, L.; Gambella, F.; Zimbalatti, G.; Macrì, G.; Gallucci, F.; Caruso, L.; Salerno, M.; Colantoni, A. Energetic Characteristics of Syngas Obtained from Gasification of Hazelnut Prunings. Procedia—Soc. Behav. Sci. 2016, 223, 835–840. [Google Scholar] [CrossRef]
- Demirbas, M.F. Characterization of Bio-oils from Spruce Wood (Picea orientalisL.) via Pyrolysis. Energy Sources Part A Recover. Util. Environ. Eff. 2010, 32, 909–916. [Google Scholar] [CrossRef]
- Branca, C.; Di Blasi, C.; Galgano, A.; Broström, M. Effects of the Torrefaction Conditions on the Fixed-Bed Pyrolysis of Norway Spruce. Energy Fuels 2014, 28, 5882–5891. [Google Scholar] [CrossRef]
- Formowitz, B. Pyrolysis behavior of modified grey alder wood samples by TG-MS and TGA technoques. In Proceedings of the 18th European Biomass Conference and Exhibition, Lyon, France, 3–7 May 2010; Volume 3000, pp. 3–7. [Google Scholar]
- Suttibak, S.; Sriprateep, K.; Pattiya, A. Production of Bio-oil from Pine Sawdust by Rapid Pyrolysis in a Fluidized-bed Reactor. Energy Sources Part A Recover. Util. Environ. Eff. 2015, 37, 1440–1446. [Google Scholar] [CrossRef]
- Purevsuren, B.; Dashzeveg, O.; Alyeksandr, A.; Janchig, N.; Soninkhuu, J. Pyrolysis of pine wood and characterisation of solid and liquid products. Mong. J. Chem. 2018, 19, 24–31. [Google Scholar] [CrossRef]
- Sethuraman, S.; Van Huynh, C.; Kong, S.-C. Producer Gas Composition and NOx Emissions from a Pilot-Scale Biomass Gasification and Combustion System Using Feedstock with Controlled Nitrogen Content. Energy Fuels 2011, 25, 813–822. [Google Scholar] [CrossRef]
- Inayat, M.; Sulaiman, S.A. Effect of Blending Ratio on Quality of Producer Gas From Co-Gasification of Wood and Coconut Residual. MATEC Web Conf. 2018, 225, 05005. [Google Scholar] [CrossRef]
- Joka, M.; Poskrobko, S. Methane rich gasification of wood pellets. E3S Web Conf. 2016, 10, 00031. [Google Scholar] [CrossRef]
- Poskrobko, S.; Król, D.; Gozdur, A.B. Gasification of waste wood biomass. Drewno 2016, 59, 241–248. [Google Scholar]
- Brynda, J.; Skoblia, S.; Pohořelý, M.; Beňo, Z.; Soukup, K.; Jeremiáš, M.; Moško, J.; Zach, B.; Trakal, L.; Šyc, M.; et al. Wood chips gasification in a fixed-bed multi-stage gasifier for decentralized high-efficiency CHP and biochar production: Long-term commercial operation. Fuel 2020, 281, 118637. [Google Scholar] [CrossRef]
- Chaurasia, A. Modeling, simulation and optimization of downdraft gasifier: Studies on chemical kinetics and operating conditions on the performance of the biomass gasification process. Energy 2016, 116, 1065–1076. [Google Scholar] [CrossRef]
- Mohammed, M.; Salmiaton, A.; Azlina, W.W.; Amran, M.M.; Fakhru’L-Razi, A. Air gasification of empty fruit bunch for hydrogen-rich gas production in a fluidized-bed reactor. Energy Convers. Manag. 2011, 52, 1555–1561. [Google Scholar] [CrossRef]
- Bhatia, S. 18. Biomass Gasification. In Advanced Renewable Energy Systems; Woodhead Publishing India PVT: New Deli, India, 2014; pp. 474–490. [Google Scholar]
- Huang, F.; Jin, S. Investigation of biomass (pine wood) gasification: Experiments and Aspen Plus simulation. Energy Sci. Eng. 2019, 7, 1178–1187. [Google Scholar] [CrossRef]
- Almeida, A.; Neto, P.; Pereira, I.; Ribeiro, A.; Pilão, R. Effect of temperature on the gasification of olive bagasse particles. J. Energy Inst. 2019, 92, 153–160. [Google Scholar] [CrossRef]
- Halim, N.H.A.; Saleh, S.; Samad, N.A.F.A. Effect of Gasification Temperature on Synthesis Gas Production and Gasification Performance for Raw and Torrefied Palm Mesocarp Fibre. ASEAN J. Chem. Eng. 2020, 19, 120–129. [Google Scholar] [CrossRef]
- Yahaya, A.Z.; Somalu, M.R.; Muchtar, A.; Sulaiman, S.A.; Daud, W.R.W. Effect of particle size and temperature on gasification performance of coconut and palm kernel shells in downdraft fixed-bed reactor. Energy 2019, 175, 931–940. [Google Scholar] [CrossRef]
- Yii, B.L.S.; Ismail, W.M.S.W.; Yahya, F.N.; Rasid, R.A. The Effect of Operating Temperature and Equivalence Ratio in an Entrained Flow Gasification of EFB. Mater. Today Proc. 2019, 19, 1373–1381. [Google Scholar] [CrossRef]
- Zeng, R.; Wang, S. Study on the Characteristics of the Influence of Temperature and Excess air ratio effect on Waste Gasification Syngas. IOP Conf. Ser. Earth Environ. Sci. 2018, 199, 032094. [Google Scholar] [CrossRef]
- Taba, L.E.; Irfan, M.F.; Daud, W.A.M.W.; Chakrabarti, M.H. The effect of temperature on various parameters in coal, biomass and CO-gasification: A review. Renew. Sustain. Energy Rev. 2012, 16, 5584–5596. [Google Scholar] [CrossRef]
- Franco, C.; Pinto, F.; Gulyurtlu, I.; Cabrita, I. The study of reactions influencing the biomass steam gasification process. Fuel 2003, 82, 835–842. [Google Scholar] [CrossRef]
- Sikarwar, V.S.; Zhao, M.; Clough, P.; Yao, J.; Zhong, X.; Memon, M.Z.; Shah, N.; Anthony, E.J.; Fennell, P.S. An overview of advances in biomass gasification. Energy Environ. Sci. 2016, 9, 2939–2977. [Google Scholar] [CrossRef]
- Wang, L.; Weller, C.L.; Jones, D.D.; Hanna, M.A. Contemporary issues in thermal gasification of biomass and its application to electricity and fuel production. Biomass Bioenergy 2008, 32, 573–581. [Google Scholar] [CrossRef]
- Couto, N.; Rouboa, A.; Silva, V.; Monteiro, E.; Bouziane, K. Influence of the Biomass Gasification Processes on the Final Composition of Syngas. Energy Procedia 2013, 36, 596–606. [Google Scholar] [CrossRef]
Publisher’s Note: MDPI stays neutral with regard to jurisdictional claims in published maps and institutional affiliations. |
© 2021 by the authors. Licensee MDPI, Basel, Switzerland. This article is an open access article distributed under the terms and conditions of the Creative Commons Attribution (CC BY) license (https://creativecommons.org/licenses/by/4.0/).

