Article

Driving Green Investments by Measuring Innovation Impacts. Multi-Criteria Decision Analysis for Regional Bioeconomy Growth

Consorzio Italbiotec, 20138 Milan, Italy
*
Author to whom correspondence should be addressed.
Sustainability 2021, 13(21), 11709; https://doi.org/10.3390/su132111709
Submission received: 6 September 2021 / Revised: 11 October 2021 / Accepted: 20 October 2021 / Published: 23 October 2021

Abstract

:
Regional policies play a pivotal role in green transition and pursuing the European Green Deal decarbonization targets. Despite the general recognition of the strategic value of the bioeconomy in realizing this challenge, regional roadmaps for its growth are not yet a widespread tool in local innovation policy. Conversely, driving green investments by measuring the innovation potential of the bioeconomy could shape a low-carbon economy by leveraging the full potential of local resources. In order to validate a replicable decision-making model driving 2021–2027 ERDF funds towards this mission, this paper measures the economic, social and technological impact of the Lombard bioeconomy through five applications and eight criteria. The methodology allows quantification of the local bioeconomy value and, through a Multi-Criteria Decision Analysis (MCDA), identifies the bio-based applications with the highest innovation potential. By measuring the current and prospective impact of the bioeconomy, Bio-chemicals, Agri-foods, and Biopolymers emerges as the applications with the highest innovation potential rate for Lombardy. Five recommendations to drive green investments and shape the regional roadmap for the bioeconomy are finally defined, providing a tool for industrial applications with a greater impact on local competitiveness.

1. Introduction

1.1. How Measuring the Bioeconomy Impacts Accelerate Regional Green Transition

By mobilizing a total of 1 trillion euros in sustainable investments over the next decade, Europe aims to ensure a substantial acceleration of the green transition by earmarking 30% of the EU’s multiannual budget (2021–2028) and the NextGenerationUE, the 800 billion euro financial instrument for COVID-19 recovery [1]. The path towards climate neutrality must be ensured by the commitment of the regions and local governments, investing for this purpose at least 30% of the European Regional Development Fund (ERDF), supported by 37% of the Cohesion Fund, the two leading European financing measures to support regional growth and development. In addition, the Just Transition Mechanism addresses the socio-economic impacts of the transition, focusing on the regions with the highest intensity of CO2 emissions and those with the highest number of employees in the fossil fuel sector, by mobilizing at least 65–75 billion euro in the period 2021–2027 [2].
The bioeconomy or bio-based economy, as the “production of renewable biological resources and the conversion of these resources and waste streams into value-added products, such as food, feed, organic products and bioenergy”, is one of the most powerful tools to overcome dependence on fossil sources, creating sustainable bioproducts and bioenergy from renewable biological resources [3,4]. With an added value of 614 billion euro (4.7% of GDP) and 17.5 million employees (8.9% of the total workforce) in 2017 [5], the bioeconomy in Europe is considered by a growing number of European regions as a pillar of socio-economic development thanks to its central role in tackling major economic, financial, social and environmental challenges such as resource depletion, climate change, and limited biomass availability [6].
Despite this positive growth, only 19 Member States have implemented or are developing a bioeconomy strategy and only 49 regions have adopted a roadmap or a similar document. Furthermore, 35.7% of these have a low level of bioeconomy maturity, missing the opportunity to fully exploit the potential of their resources [7,8,9].
Regional support for the bioeconomy growth in Europe is ensured in most cases by the Smart Specialization Strategies (S3), a tool within the Cohesion Policy setting priority areas for competitive development based on the local economic framework [10]. Despite this, lack of a common definition/classification of bioeconomy and its inclusion in an integrated policy framework are the major obstacles to its complete fulfilment [7]. Indeed, the General Regulation of Common Provisions on European Structural and Investment Funds (EU Reg. 1303/2013) entrusts S3 with the prerequisite for using available resources to strengthen research, technological development and innovation [11] according to this key enabling sector crucial for local competitiveness. Although this process is based on mapping and SWOT analysis or similar, it is unknown whether the investment priorities were selected to measure performance indicators and consider the long-term impact of regional investments on bio-based industry trends.
Measuring the impact of the bioeconomy makes it possible to benchmark the performance of bio-based products and promotes sustainable transitions based on a plethora of economic, social, and technological indicators capable of orienting policymakers towards those applications with higher innovation potential. Defined as the ability of a specific sector to implement modernization processes, the innovation potential measurement can be applied to dynamic sectors with a high capacity for speed market-pull solutions [12]. Several key performance indicators have been analysed to assess the bioeconomy’s impact at the European and national levels and, according to a recent study of the Joint Research Council—JRC, the most commonly used include the economic (turnover, value-added, investments, exports of goods) and the social dimension (employment) [13]. The JRC methodology addresses several challenges for measuring the size of the bioeconomy and its contribution to a sustainable green transition, proposing a synthesis of peer-balanced bio-based input and output approaches. However, as a significant limitation, this study does not consider the technological dimension, such as the R&D expenditures and scientific publications, crucial for assessing the whole socio-economic and technological impact of the bioeconomy, reflecting regional features and peculiarities. Other publications provide a systematic approach to quantifying the socio-economic performance of the European bioeconomy [14,15] by considering official statistics (i.e., Eurostat) as a data source offering a publicly available and consolidated time series harmonized across the EU Member States. D’Adamo et al. introduce the “socio-economic indicator for the bioeconomy” based on turnover, added value and employment (mainly from Eurostat data) and rank the leading Member States [16] with a higher engagement in boosting bioeconomy growth. D’Adamo et al. further proved the new indicator in a specific Italian case study [17]. However, they analyzed a limited set of indicators and quantified the socio-economic impact of the bioeconomy without measuring the full innovation potential. Although relevant in this area, both studies do not use these indicators to model decision-making tools on regional investment priorities consistent with local resources and the sector’s development mega-trends.
High-yielding bio-based applications with the highest innovation potential are considered strategic to target regional funds and boost sustainable development. From a holistic perspective, this study intends to propose a methodology for orienting regional green investments by expanding the parameters considered to quantify the innovation potential of bioeconomy applications. The use of a Multi-Criteria Decision Analysis (MCDA) approach supports the measurement of the present value of the regional bioeconomy and identifies the five most strategic competitive applications (food/feed, biochemicals/pharmaceuticals, biofuels/bioenergy, biopolymers, wood/paper) considering eight criteria, a set of parameters describing the performance of the bio-based applications to be compared according to three different macro-areas (economic, social, and technological). The development of an MCDA approach allows the accurate measurement of its impact and elaborates long-term prospects for evolution by ranking the bio-based applications according to their innovation potential. Furthermore, this study provides a methodology that can be replicated in other geographic contexts allowing for greater objectivity of the evaluation than standard methodologies. With appropriate adjustments (especially for project identification and funding opportunities), this model could also be applied to non-EU countries.
Since the main challenge in measuring the bioeconomy’s value is strictly dependent on its boundaries [13], the study considers applications in which biomass is transformed into bio-based products with high added value, excluding the primary sector or biomass flow. The methodology developed was validated with a multidisciplinary approach considering economic, social and technological aspects in a case study of the Lombardy region in Northern Italy, where a strategy for the bioeconomy is still missing.

1.2. Towards a Bioeconomy Strategy for the Lombardy Region

Recognizing the bioeconomy as one of the engines for the green transition, Italy has set a Strategy for the Bioeconomy (BIT II), updated in 2019, focused on increasing by 15% the current performance of the Italian Bioeconomy by 2030. Based on European strategy, the BIT II considers both primary and manufacturing sectors and bioelectricity production as part of bioeconomy boundaries. This national strategy provides a global vision of the bioeconomy in the entire Italian peninsula and sets general objectives without focusing on the individual regions’ strengths and weaknesses [18]. Despite this recognition and the booming of bio-based sectors, some Italian regions are just starting the process of setting out a regional bioeconomy strategy, and the majority do not have a strategy capable of quantifying and monitoring the impacts of the bioeconomy and orienting local financial policies towards applications with higher added-value for regional competitiveness.
Among Italian regions, Lombardy boasts one of the most developed production systems in Italy and Europe, with a GDP of 391 billion EUR in 2019, about 22% of Italy’s GDP [19], characterized by a plurality of traditional sectors, such as agriculture, livestock and advanced manufacturing, including biotechnology and chemistry. These last two sectors represent 29% and 31% of the national industry, mobilizing 9200 and 60,000 employees respectively [20]. Lombardy hosts one-fifth of Italian biochemistry, 42% of pharmaceutical operators and 31% of the chemical sector, led by Milan, where over 13,000 businesses are active [21].
Intending to strengthen economic, social and territorial potential, the Cohesion Policy is the leading investment and development tool of the European Union from which the investment priorities and the National and Regional Operational Programs (ROP) are defined. In Lombardy, the 2014–2020 ROP sets an operational plan in which ERDF funds are allocated at the local level, providing investment funds for almost one billion euros (970,474,516 euros) to support smart, sustainable and inclusive growth. The transition to the green economy absorbs over 60% of the total investments, dedicated to strengthening research, technological development and innovation (Axis 1, 349.2 million, equal to 36% resources), the transition towards a low-carbon economy (Axis 4, 194.6 million, equal to 20% resources), and sustainable urban development (Axis 5, 60 million, equal to 6% resources) [22].
Lombardy is a virtuous national case regarding the bioeconomy and biobased applications [16] with enormous innovative potential and biomass availability. With this in mind, the Lombardy Region has implemented several initiatives to increase Lombard entrepreneurship and sustainable development under its industry-driven S3. The Lombard S3, launched in 2014, supports and promotes regional innovation policies, identifying priorities and emerging technological areas in which investments can be concentrated [20]. The bioeconomy, which in Lombardy does not have a dedicated strategy, is included in the update S3 2021–2027, integrated with “Sustainability Ecosystem”, a pillar that aims to promote sustainable transition for the development of green and organic processes and products through the conversion of waste and biomass [21]. At the same time, Lombardy has implemented the Regional Development Program (2018–2023), which made sustainability one of the five priorities of the actions to be carried out by the Regional Government. This document encourages initiatives to implement projects based on the S3 guidelines and gives visibility to good bioeconomy practices in Lombardy [22]. Although the commitment of the Lombardy Region to favour the transition towards a sustainable and bio-based economy, the lack of a dedicated strategy for the bioeconomy based on current and prospective applications and socio-economic impact indicators leads to an obstacle to its development, limiting the impact of investments on the Lombard production sector. On the other hand, a synergic and targeted orientation of regional investments, mainly through the ROP, could substantially contribute to the biobased sector’s development. Based on this consideration, this study aims to measure the innovation potential of the bioeconomy in Lombardy, providing public authorities with a direct quantification of its added value and guidelines for the orientation of ERDF funds in the medium to long term.

2. Materials and Methods

The methodology developed in this study combines the qualitative and quantitative analysis of economic, social and technological sources with a multi-criteria decision analysis approach to support the assessment of the impact of the bioeconomy in Lombardy today and in the long term. Based on the construction of five inventories, the method, potentially replicable in any region, provides a measure of the innovation potential of the bioeconomy for supporting the decision-making processes of regional authorities.

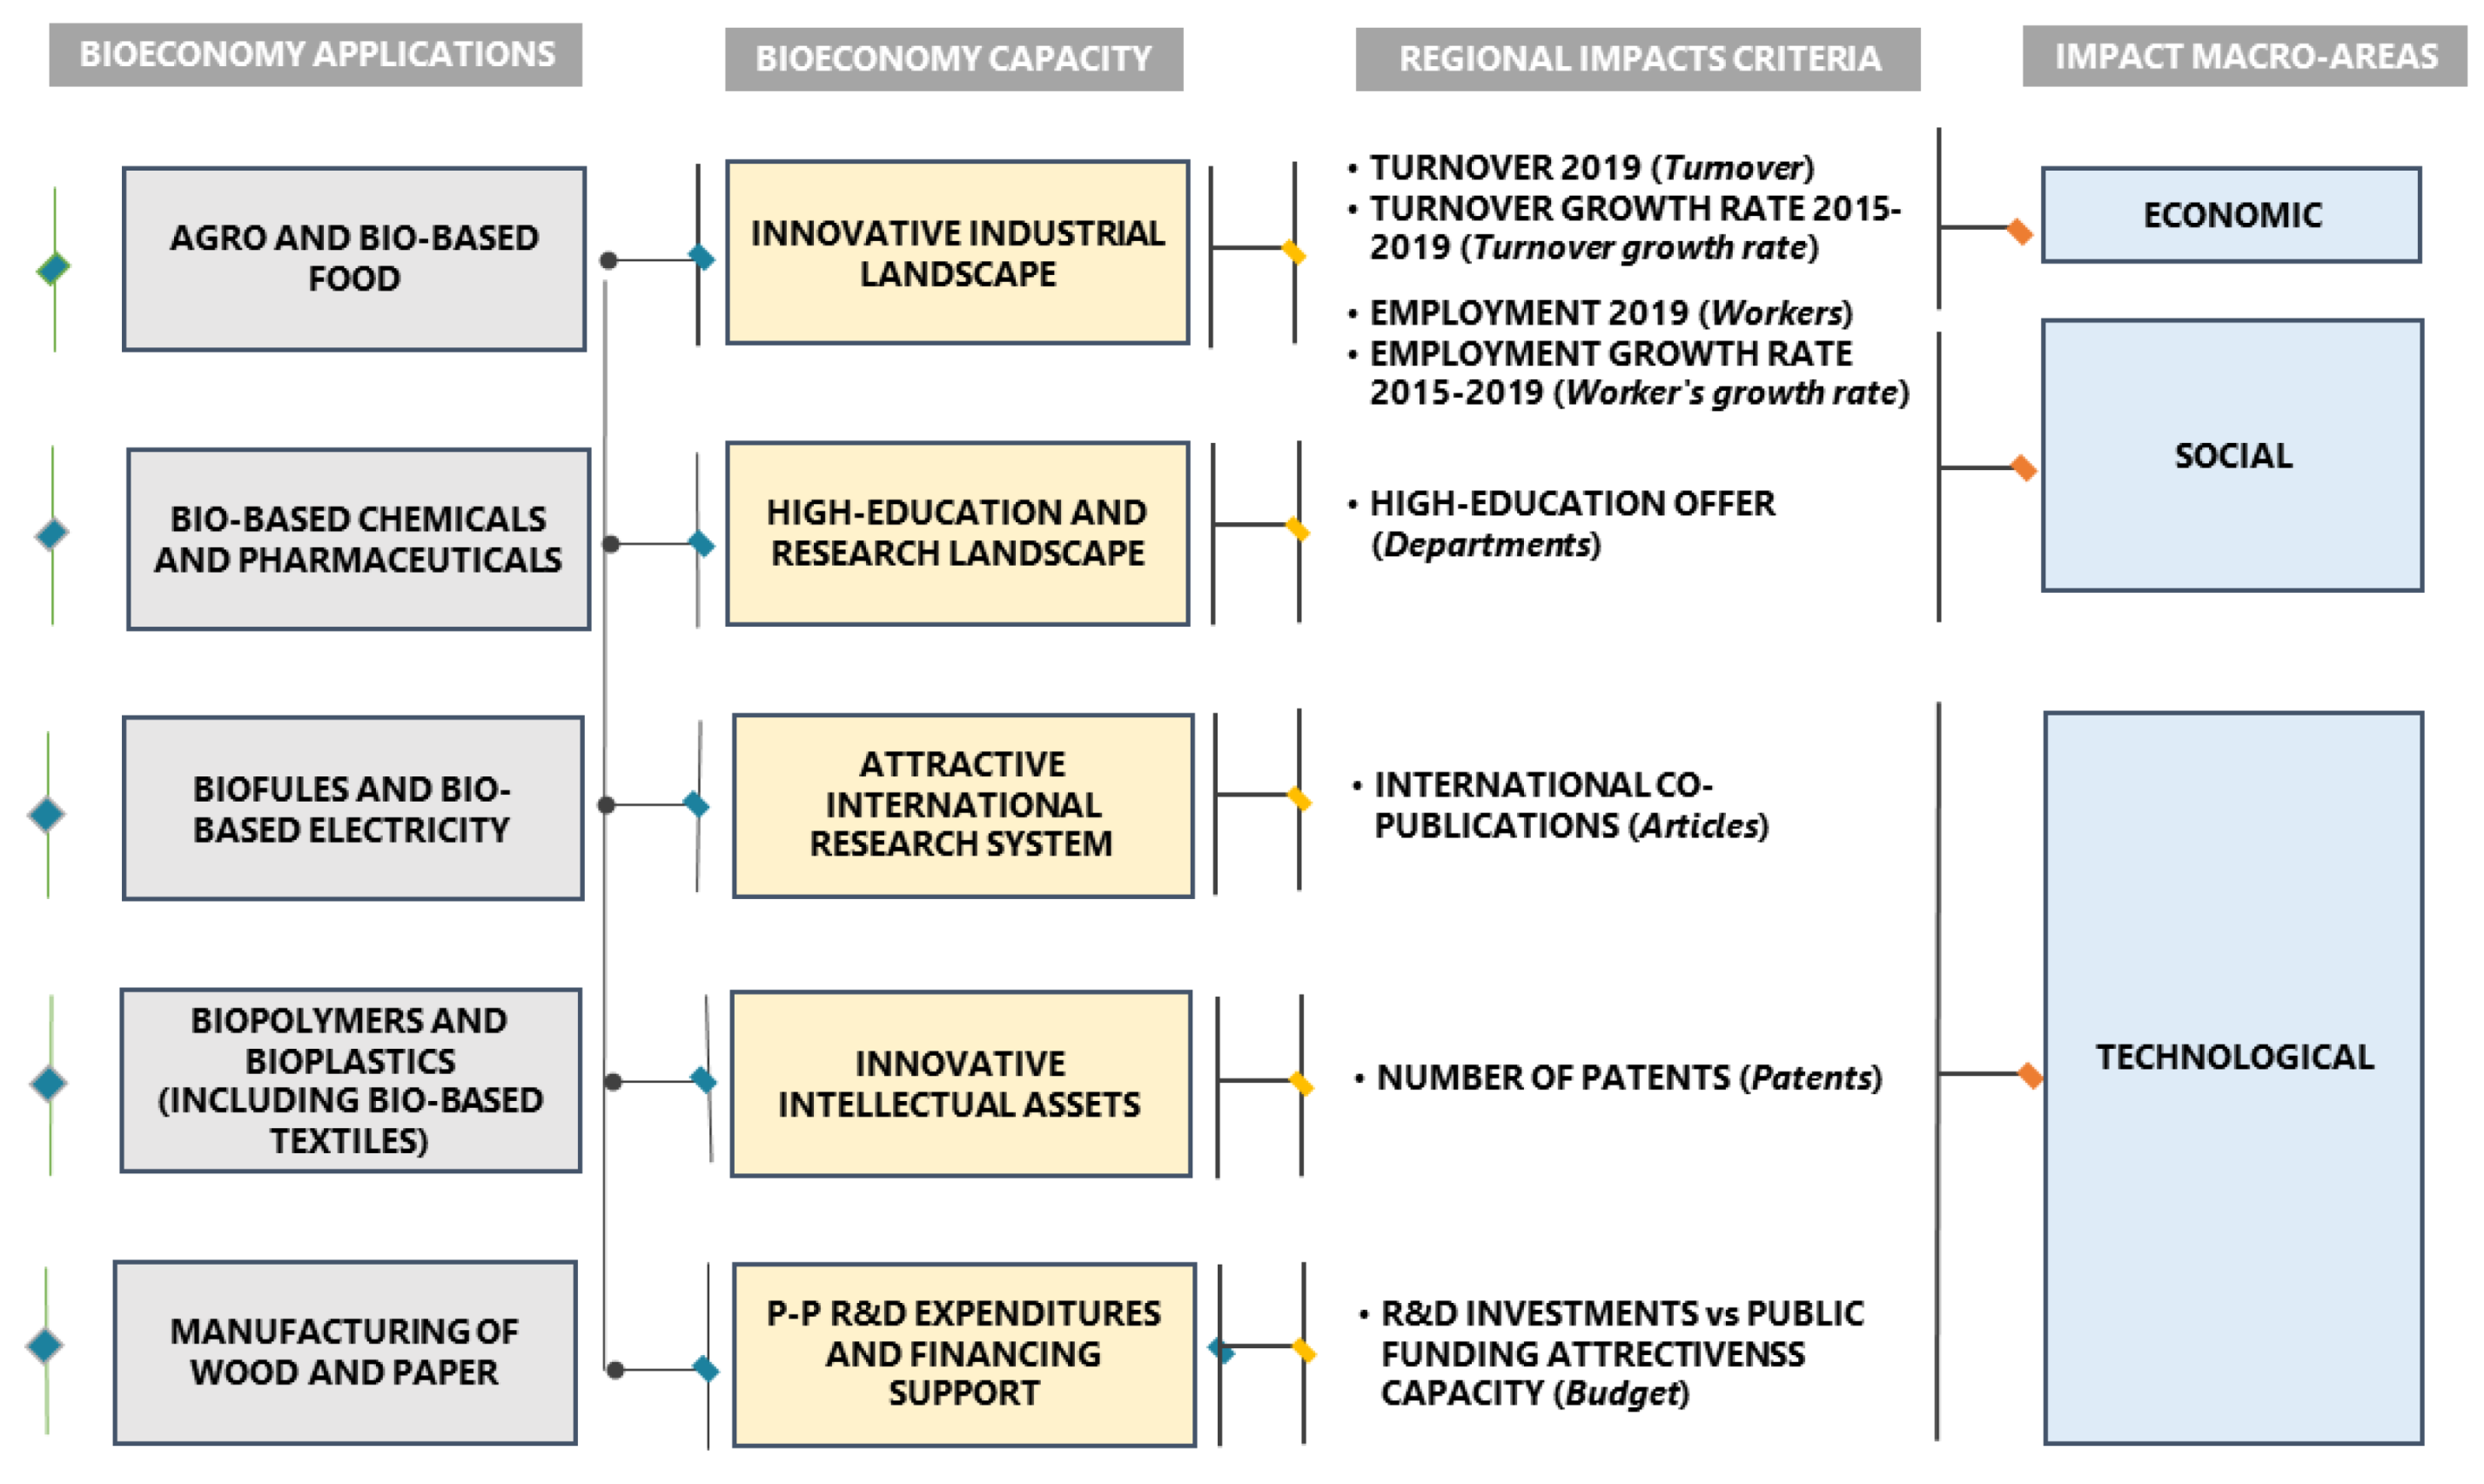
2.1. Bioeconomy Applications and Regional Inventories Design

The European Commission considers in its reports ten different bio-based applications [23]. However, clearly defining the boundaries of the bioeconomy is a crucial aspect in measuring its impact. Not all bioeconomy applications are entirely bio-based, and others use bio-based materials to a minor extent in their manufacturing process or do not imply a transformation of the primary bio-based product [13]. To accurately measure the innovation potential of the bioeconomy, this study exclusively considers the applications in which biomass is transformed into bio-based products with high added value, excluding primary production. The main regional productive activities were also considered to select the representative applications of the bioeconomy in Lombardy. This process led to the identification of five bio-based applications for reference, each assigned to a different ID, described as follows:
  • Agro and bio-based food and feed (briefly AGROFOOD and assigned to the ID x1): refers to feed and functional food obtained from bio-based materials, including waste and/or microorganisms. It also refers to agricultural practices based on bio-based techniques and products (e.g., fertilizers). Food and feed derived from common agricultural practices are not included in this definition;
  • Bio-based chemicals and pharmaceuticals (BIOCHEMICALS, x2): refers to bulk (biofuels excluded) and fine chemicals, pharmaceuticals and cosmetics derived from bio-based materials, including waste and/or microorganisms;
  • Biofuels and bio-based electricity (BIOFUELS, x3): refers to fuels and electricity obtained from bio-based sources. Hydroelectric power and wind energy are not included in this definition;
  • Biopolymers and bioplastics (including bio-based textiles) (BIOPOLYMERS, x4): refers to polymers and plastics obtained from bio-based materials, waste and/or microorganisms. Biopolymers used for textiles applications, also called bio-based textiles, have been included in the definition;
  • Wood and paper manufacturing (WOOD, x5): refers to wood and paper manufacturing, including bio-based sustainable innovation for by-product exploitation. Complex biorefineries based on wood and paper to extract high-value compounds are included in the definition.
The economic, social and technological values for each bioeconomy application were analyzed by integrating various sources resulting in five inventories describing the regional BIOECONOMY CAPACITY, as shown in Figure 1. All inventories refer to 2014–2020, corresponding to the last European programming period, except the innovative industrial landscape inventory, which refers to 2015–2019 due to a lack of data availability. In total, eight criteria were selected from each data set for implementation of the MCDA, as described in Section 2.2. These criteria can be divided into three macro-areas, economic, social and technological, that fully describe the innovation potential of each bio-based application.

2.1.1. Innovative Industrial Landscape

The construction of the datasets containing companies operating in the bioeconomy sector in the Lombardy region is supported by the interpolation of databases from Italian Chamber of Commerce data. Only companies with at least one operating office in the Lombardy region were taken into consideration. The process carried out in this study comprises two steps:
  • A first research level to identify industries operating in the five selected sectors in Lombardy. We based our research on the official statistical classification of economic activities of the European Community (NACE rev.2) and specific keywords for each sector. Table 1 summarizes the NACE code included in the research.
  • Refining of the research by analyzing the core business of each activity.
This analysis selected 200 companies (SMEs and large industries) producing goods and services in the bioeconomy sector (excluding primary goods producers).
The parameters used for data classification are:
  • Geographic area: according to the company registered office; results are classified according to twelve areas based on the Lombard province’s distribution (Milan, Bergamo, Varese, Monza and Brianza, Pavia, Mantua, Brescia, Cremona, Lodi, Como, Lecco, Sondrio);
  • Company size: according to the turnover achieved from 2015 to 2019, results are classified according to five company types:
    -
    MICRO. Companies achieving less than 2 million euros
    -
    SMALL. Companies achieving between 2 and 9.9 million euros
    -
    MEDIUM. Companies achieving between 10 and 49.9 million euros
    -
    MEDIUM-LARGE. Companies achieving between 50 and 99.9 million euros
    -
    LARGE. Companies achieving over 100 million euros
  • Employees number: according to the employee’s number achieved from 2015 to 2019, results are classified according to five company types:
    -
    From 0 to 9 employees
    -
    From 10 to 49 employees
    -
    From 50 to 249 employees
    -
    From 250 to 1000 employees
    -
    Over 1000 employees
  • Bioeconomy application: results are classified according to the five applications covered by the study.

2.1.2. Higher-Education and Research Landscape

Universities and research centres operating in the bioeconomy sector were selected according to their research groups and/or the presence of dedicated courses of study (degree, master or specialization school). This screening led to the identification of 39 departments, operating at seven universities and four public-private research centres.
The parameters used for data classification are
  • Entity name;
  • Entity type (research center or university);
  • Number of departments and units active in the bioeconomy field;
  • Bioeconomy application.

2.1.3. Attractive International Research System

A systematic analysis of the literature on Scopus—a database of citations and abstracts with over 25,000 titles [24]—was applied to identify scientific articles, focusing on literature published from January 2014 to April 2021 by at least one author affiliated with a Lombard university or research center. Articles were identified by specific queries selected in the title, abstract or keyword chosen by the publication’s authors, as illustrated in Table 2. The parameters used for data classification are
  • Title;
  • Author;
  • Publication year;
  • Bioeconomy application.

2.1.4. Innovative Intellectual Assets

A systematic analysis by Scopus, which indexes more than 13 million patents of the World Intellectual Property Office, European Patent Office, USPTO, Japanese Patent Office and the UK Intellectual Property Office of registered patents, resulted in 41 registered patents from January 2014 to April 2021. The screening focused on patents with at least one inventor and/or applicant operating in Lombardy, using criteria shown in Table 2.
The parameters used for data classification are
  • Bioeconomy application;
  • Inventor/applicant affiliation.

2.1.5. Public-Private R&D Expenditure and Financing Support

The analysis of R&D expenditure supported by public financial instruments (regional, national, European) resulted in 229 projects participated by Lombard universities, public and private research centres from 2014 to 2020 in the five applications of the bioeconomy considered by the study. Data collection was based on an analysis of European, national and regional repositories as follows:
  • Regional ERDF funds: according to a selection of six of the most representative calls for proposals published from 2014 to 2020 and bioeconomy funding, 108 R&D projects have been identified, as shown in Table 3.
  • Cariplo Foundation funds: Cariplo Foundation is a private philanthropic body that annually finances 1000 projects conducted by non-profit organizations for about 150 million euros. Funding screening in the bioeconomy and circular economy area from 2014 to 2020 resulted in 80 projects.
  • Horizon 2020 funds: according to CORDIS (Community Research and Development Information Service), the primary source for identifying European projects, 41 projects with at least one beneficiary operating in the Lombardy region have been identified. The selection criteria are shown in Table 4.
The parameters used for data classification are
  • Financing type (grant or loan)
  • Years;
  • Project title;
  • Coordinator name;
  • Lombard beneficiary;
  • Expenditure;
  • Grants amount;
  • Loans amount;
  • Bioeconomy application.

2.2. Multi-Criteria Decision Analysis

A quantitative-qualitative analysis of the inventories was conducted to measure the impact of the Lombard bioeconomy according to different levels of econometric, sectorial and social analysis. Among the plethora of information obtained from constructing the five inventories, the most relevant and indicative indicators for implementing the MCDA approach have been chosen.
Multi-Criteria Decision Analysis (MCDA) provides a guided framework for evaluating multiple and conflicting options for policy and other decisions impacting society, economy and environment, defining preferences between alternatives based on pre-established criteria. A common framework guiding public policy is the Cost-Benefit Analysis (CBA), assessing all the costs and benefits of alternative options. In other words, this method seeks to value the expected impacts of an option in monetary terms, based on a well-developed economic theory of valuation, in turn, based on willingness to pay or to accept. Despite being widely applied in public policy, CBA is sometimes criticized because it doesn’t consider impacts that cannot readily be quantified on a scale of monetary values, such as the social and technical impact [29]. Therefore, compared to the standard CBA method, the MCDA has the advantage of including economic, social and technological criteria weighted according to the objective, thus assuming a different relevance in the decision-making process.
In the present study, the MCDA supports the identification of bioeconomy applications with the highest impact on the competitive growth of the Lombardy system, particularly the innovation potential of applications for which more focused ERDF investments could be dedicated. The MCDA is based on two main elements, options and criteria. Options correspond to the bioeconomy applications to be compared and/or ranked, while criteria represent the parameters used to measure the options’ performance. A numeric value represents the performance of each option against each criterion. The MCDA methodology follows the steps listed below:
  • Definition of options (bioeconomy applications), criteria and assignment of values to options for each criterion;
  • Options scoring;
  • Weights to the different criteria are assigned to reflect their relative importance in the decision;
  • Calculating the overall weighted score for each option;
  • Results analysis.
The calculations were performed with R Studio © version 1.4.11.03, open-access software, making this methodology highly reproducible and easily adaptable to the specific needs of each study. A limited number of studies using R for the MCDA implementation have been published so far, therefore in this study, the literature [30,31,32] has been supplemented with several functions from R packages (mainly MCDA, tidyverse, ahpsurvey, and scales) to define a complete step-by-step code in order to evaluate the innovation potential of the bioeconomy at the regional level through an MCDA methodology.
The complete R code is available in Appendix A.

2.2.1. Options and Criteria Definition

The five applications of the bioeconomy identified in Section 2.1 were considered as options and classified according to their innovation potential described by eight criteria—identified with a specific ID—divided into economic, social, and technological areas.
Criteria in the economic impact area are as follow:
  • Turnover 2019 (shortened as Turnover and assigned to ID c1): economic indicator measuring the total amount of revenues recorded during the accounting year 2019 by the selected companies and deriving from the sale of goods produced and/or from the provision of services.
  • Turnover growth rate 2015–2019 (shortened to T_growth, c2): change in turnover in the last five years (2015–2019) expressed as a percentage for each of the applications considered, calculated as:
Turnover   growth   rate = Turnover   2019 Turnover   2015 Turnover   2015 100
Criteria belong in the social impact area are as follow:
  • Employment 2019 (shortened as Workers, c3): total number of employees in 2019 of the companies in each bio-based application.
  • Employment growth rate 2015–2019 (shortened to W_growth, c4): change in employees in the last five years (2015–2019) expressed as a percentage for each of the applications considered, calculated as:
Workers   growth   rate = Worker   2019 Worker   2015 Worker   2015 100
  • Higher-education offer (shortened to Departments, c5): number of universities departments and research groups in public and private centers that carry out research activities and/or give study courses in the bioeconomy field.
Criteria in the technological impact area are as follow:
  • International co-publications (shortened to Articles, c6): number of articles published between 2014 and 2020 in scientific journals with at least one Lombard author for each study bio-based application.
  • Number of registered patents (shortened to Patents, c7): number of patents filed by natural or legal persons operating in the Lombardy region between 2014 and 2020 for each bio-based application. It is an indicator of innovation at the company level.
  • R&D investments vs. Public funding attractiveness capacity (shortened to Budget, c8): investments in research projects at the regional, national and European level in 2014–2020 by public and private Lombard bodies for each bio-based application.
The performance matrix or table obtained is a 5 × 8 table comprising five bio-based applications as options (rows) and eight criteria described above (columns). The values assigned according to the inventories described in Section 2.1 represent the performance of the option against each criterion.

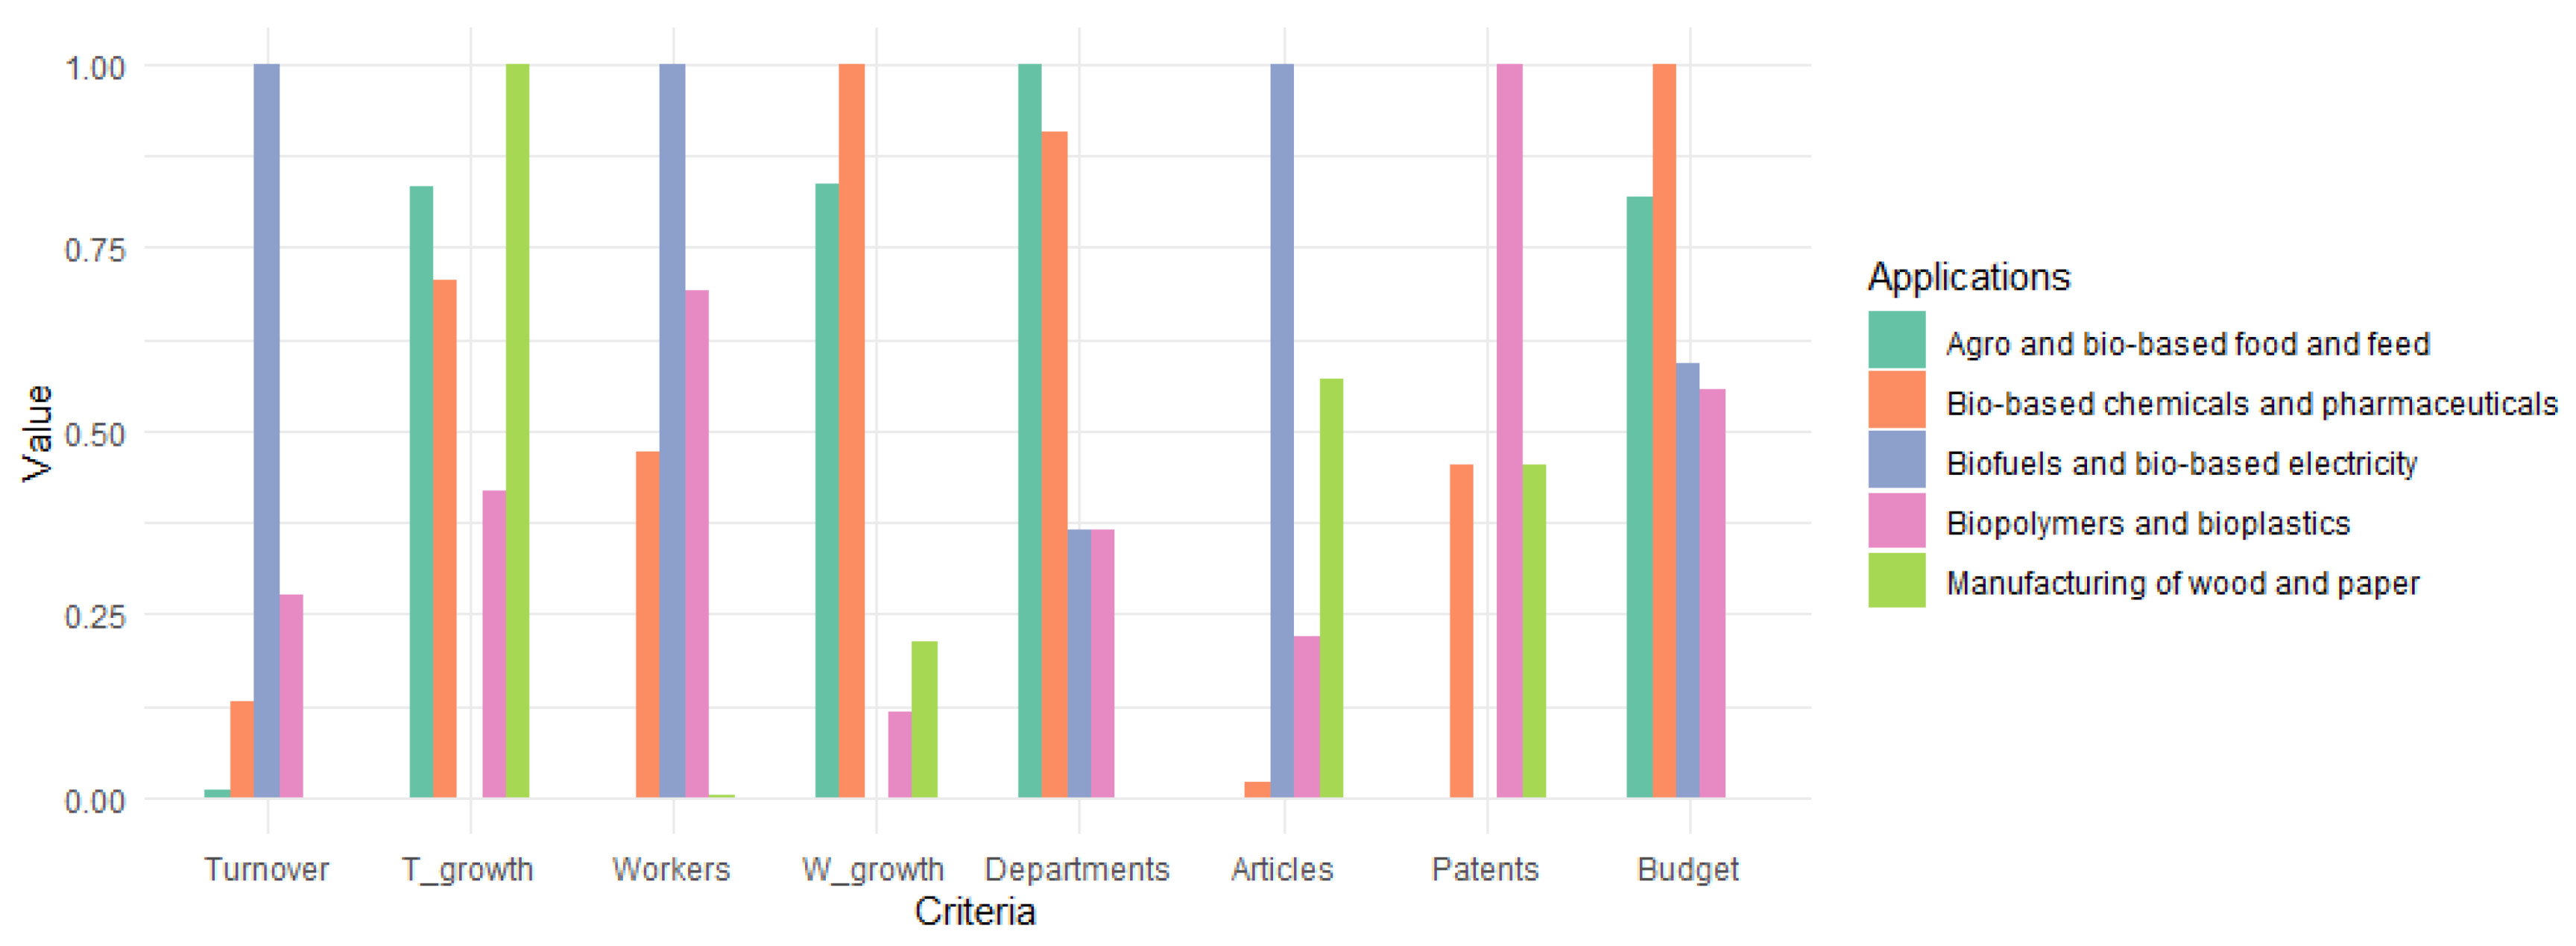
2.2.2. Options Scoring

Conventionally, the options are rated on a 0–1 or 0–100 scale so that the differences are consistent within each criterion, making the data easily comparable to each other [29,33]. The present study applies a 0–1 scale to the values according to a linear value function that assigns endpoints so that 0 is the worst-case and 1 is the best-case outcome. Average values are calculated according to a linear value function that proportionally allows the conversion of the values from the natural measurement scale to the 0–1 scale, according to the following function, where BC represents the best-case outcome and WC the worst-case outcome, while y represents the transformed value on a 0–1 scale and x the value from the natural measurement scale:
y = x WC BC WC
In this study, all the criteria are maximized, i.e., worst result corresponds to the minimum value in the performance matrix (and will be assigned to 0), while the best result corresponds to the maximum value (and will be assigned to 1). On the contrary, some studies could require the minimization of some criteria when the worst-case outcome corresponds to the highest value (and will be assigned to 0). Calculations were performed on R with the scales and the MCDA package, according to the steps below:
  • Create the performance table in Excel as a matrix and rename columns (criteria) and rows (options) with their respective IDs;
  • Rescale the matrix values according to a linear value function applied for each criterion, with 0 corresponding to the lowest value for each criterion and 1 corresponding to the highest.

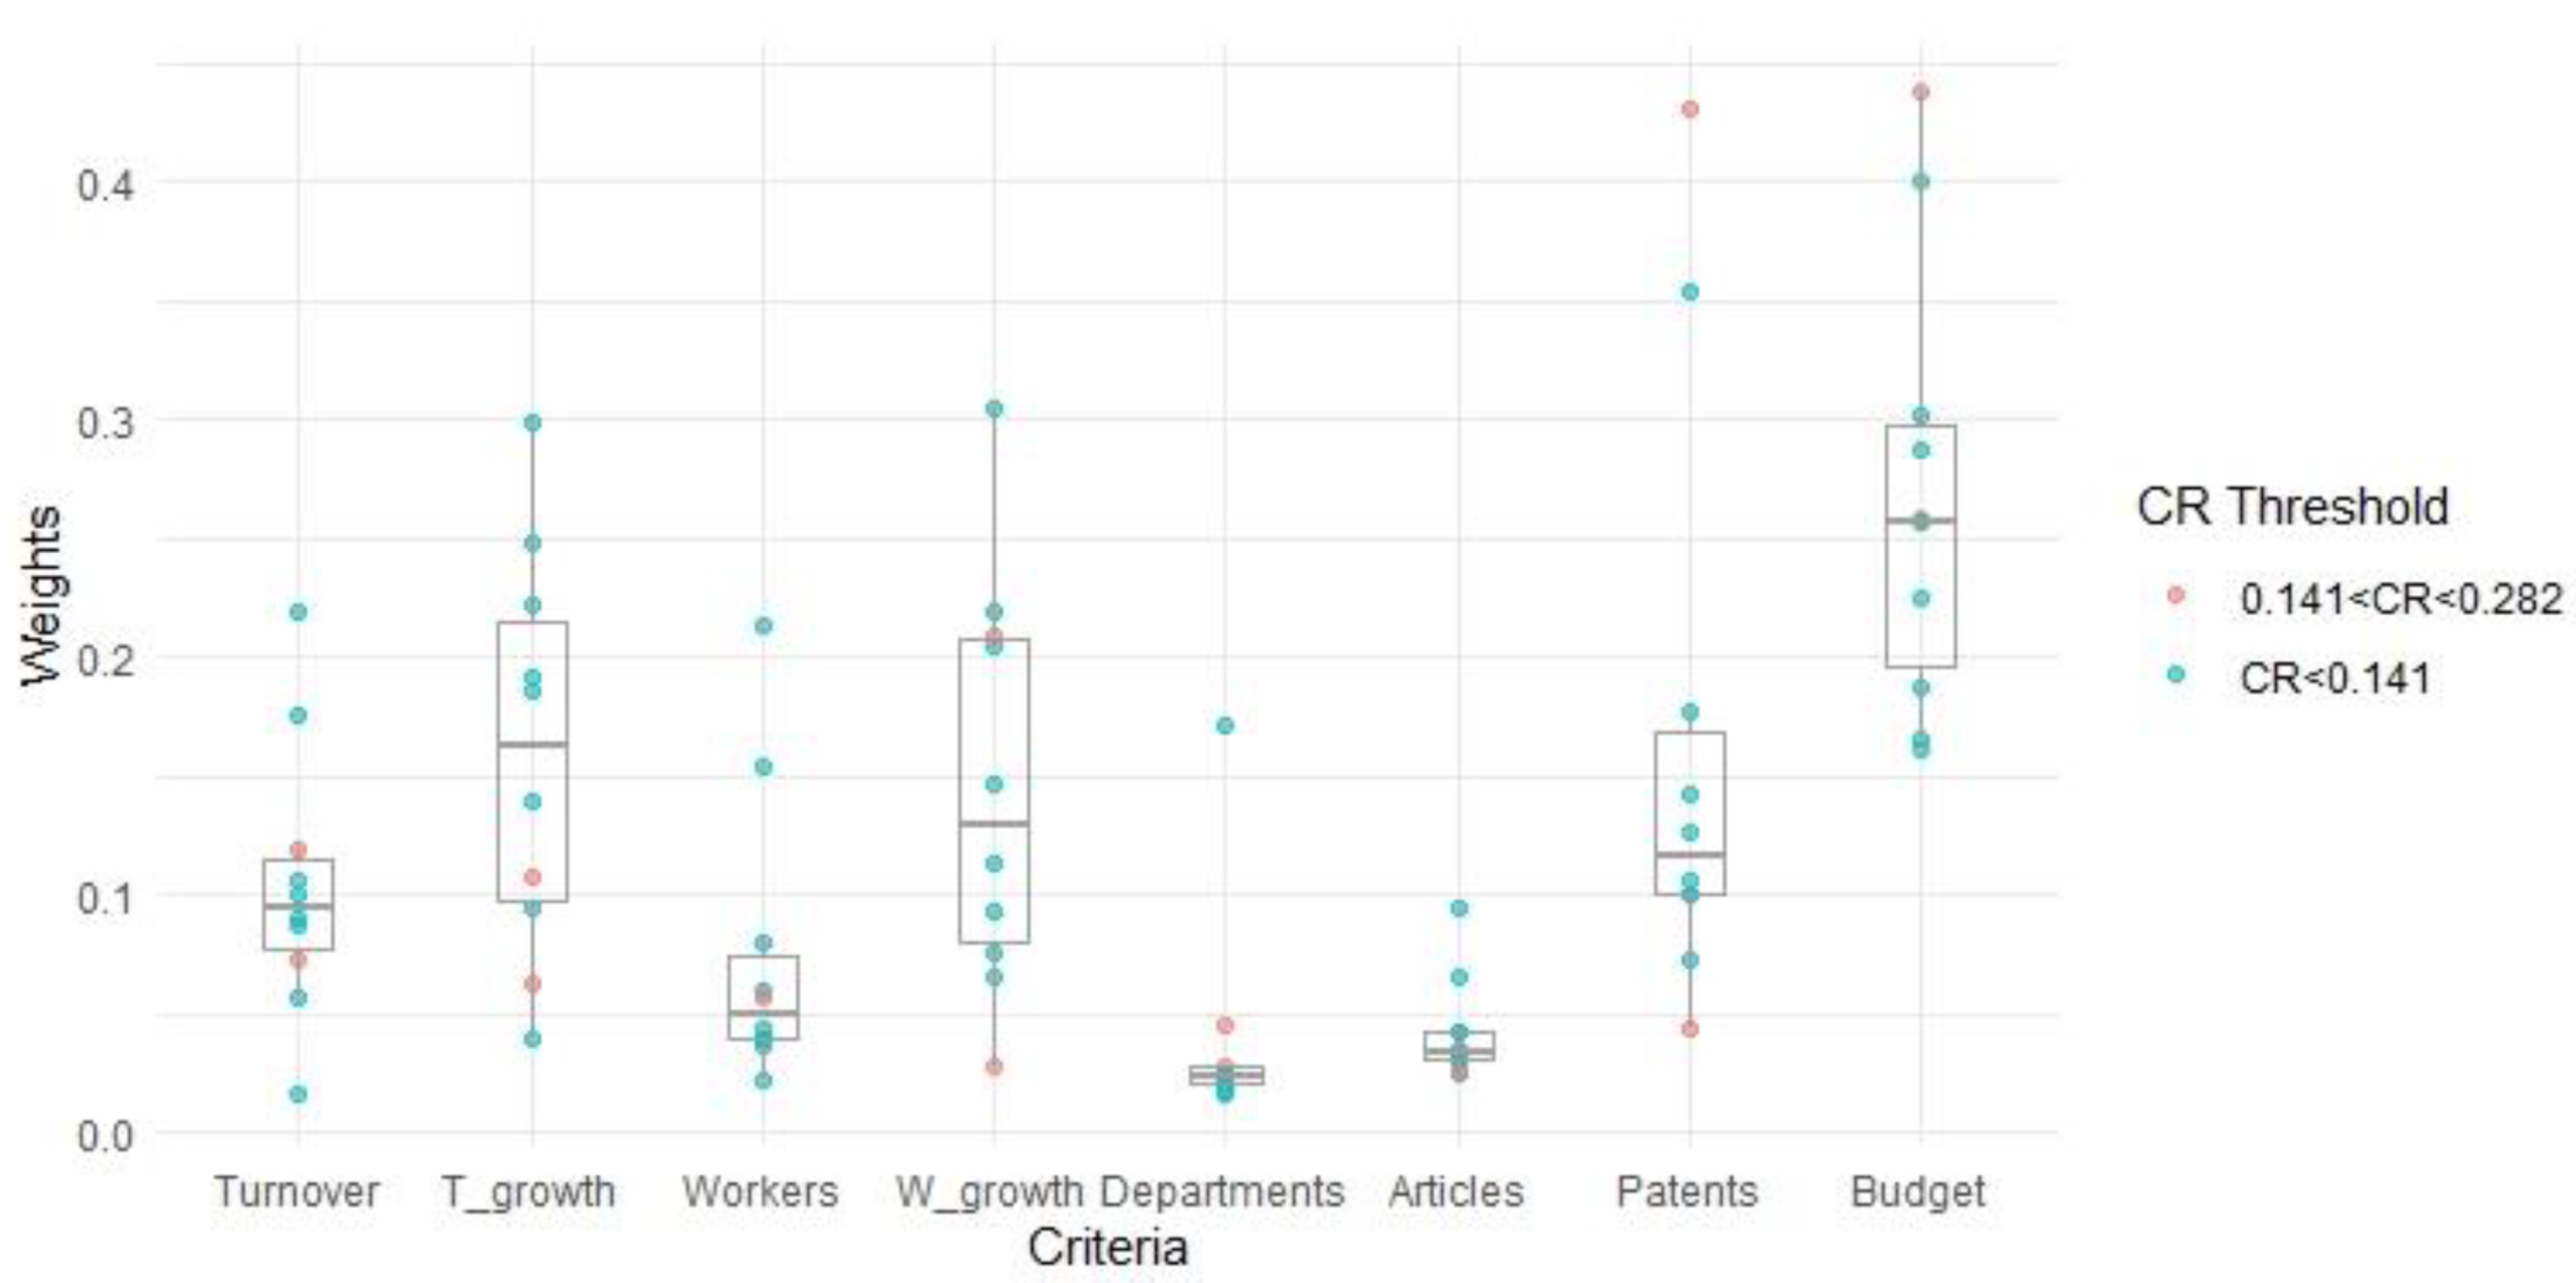
2.2.3. Allocation of Weights to the Criteria

The Analytical Hierarchical Process (AHP) methodology, developed by Saaty [34], was applied to assign weights to each criterion. This methodology is based on pairwise comparisons among the selected criteria, which make it possible to convert subjective evaluations of relative importance (answering the question “How important is criterion A compared to criterion B?”) into a series of overall scores (or weights). In this study, this attribution results from the judgment of 10 experts (academic or industrial researchers, project managers in the biotechnology sectors, policymakers) interviewed using a model questionnaire provided by Goepel [35]. Bioeconomy experts took part in the survey, including academic researchers (2), industrial representatives and project managers (6), and policymakers (2). The coding of judgment into a nine-point intensity scale, as defined by Goepel (2013) and used in the present study, is shown in Table 5.
The AHP calculation algorithm provided in the same model was not used to provide a methodology that could be run entirely on R software.
Therefore, starting from the experts’ questionnaire, weights calculation was performed on R employing some of the functions provided by the ahpsurvey package, as described by Cho, 2018 [31] and adjusting the methodology according to the goal of the study, resulting in the following steps:
  • Answers of each expert are turned into a results matrix for each comparison in pairs. The values in each AHP matrix express the expert’s preferences regarding the criterion reported in one row versus the criterion reported in the column.
The number of columns and rows in the matrix is therefore equal to the number of criteria. An example of the final AHP matrix for participant P1 is shown in Table 6.
2.
The individual preference (or weight) estimate of each expert for each criterion is calculated as the eigenvector of each matrix resulting in the so-called “individual weights”.
3.
The consistency ratio for the matrix of individual judgments is calculated to measure the consistency of judgments compared to pure random judgment. This value can be calculated according to equation (4), where λmax is the maximum eigenvalue of the pairwise comparison vector, n is the number of attributes, and RI is a value relative to the number of criteria [31]:
CR = ( λ max   n n 1 ) ( 1 RI )
Conventionally, a CR < 0.1 is considered acceptable. However, as Wedley (1993) [34] reported, acceptable CR values can be changed depending on the size of the matrix. The larger the matrix size, the more difficult it is to collect expert judgments with CR not exceeding 0.1 and, therefore, higher CR values should be considered. For a matrix of size 8, Wedley (1993) declares a value < 0.141 acceptable and a value < 0.282 tolerable.
4.
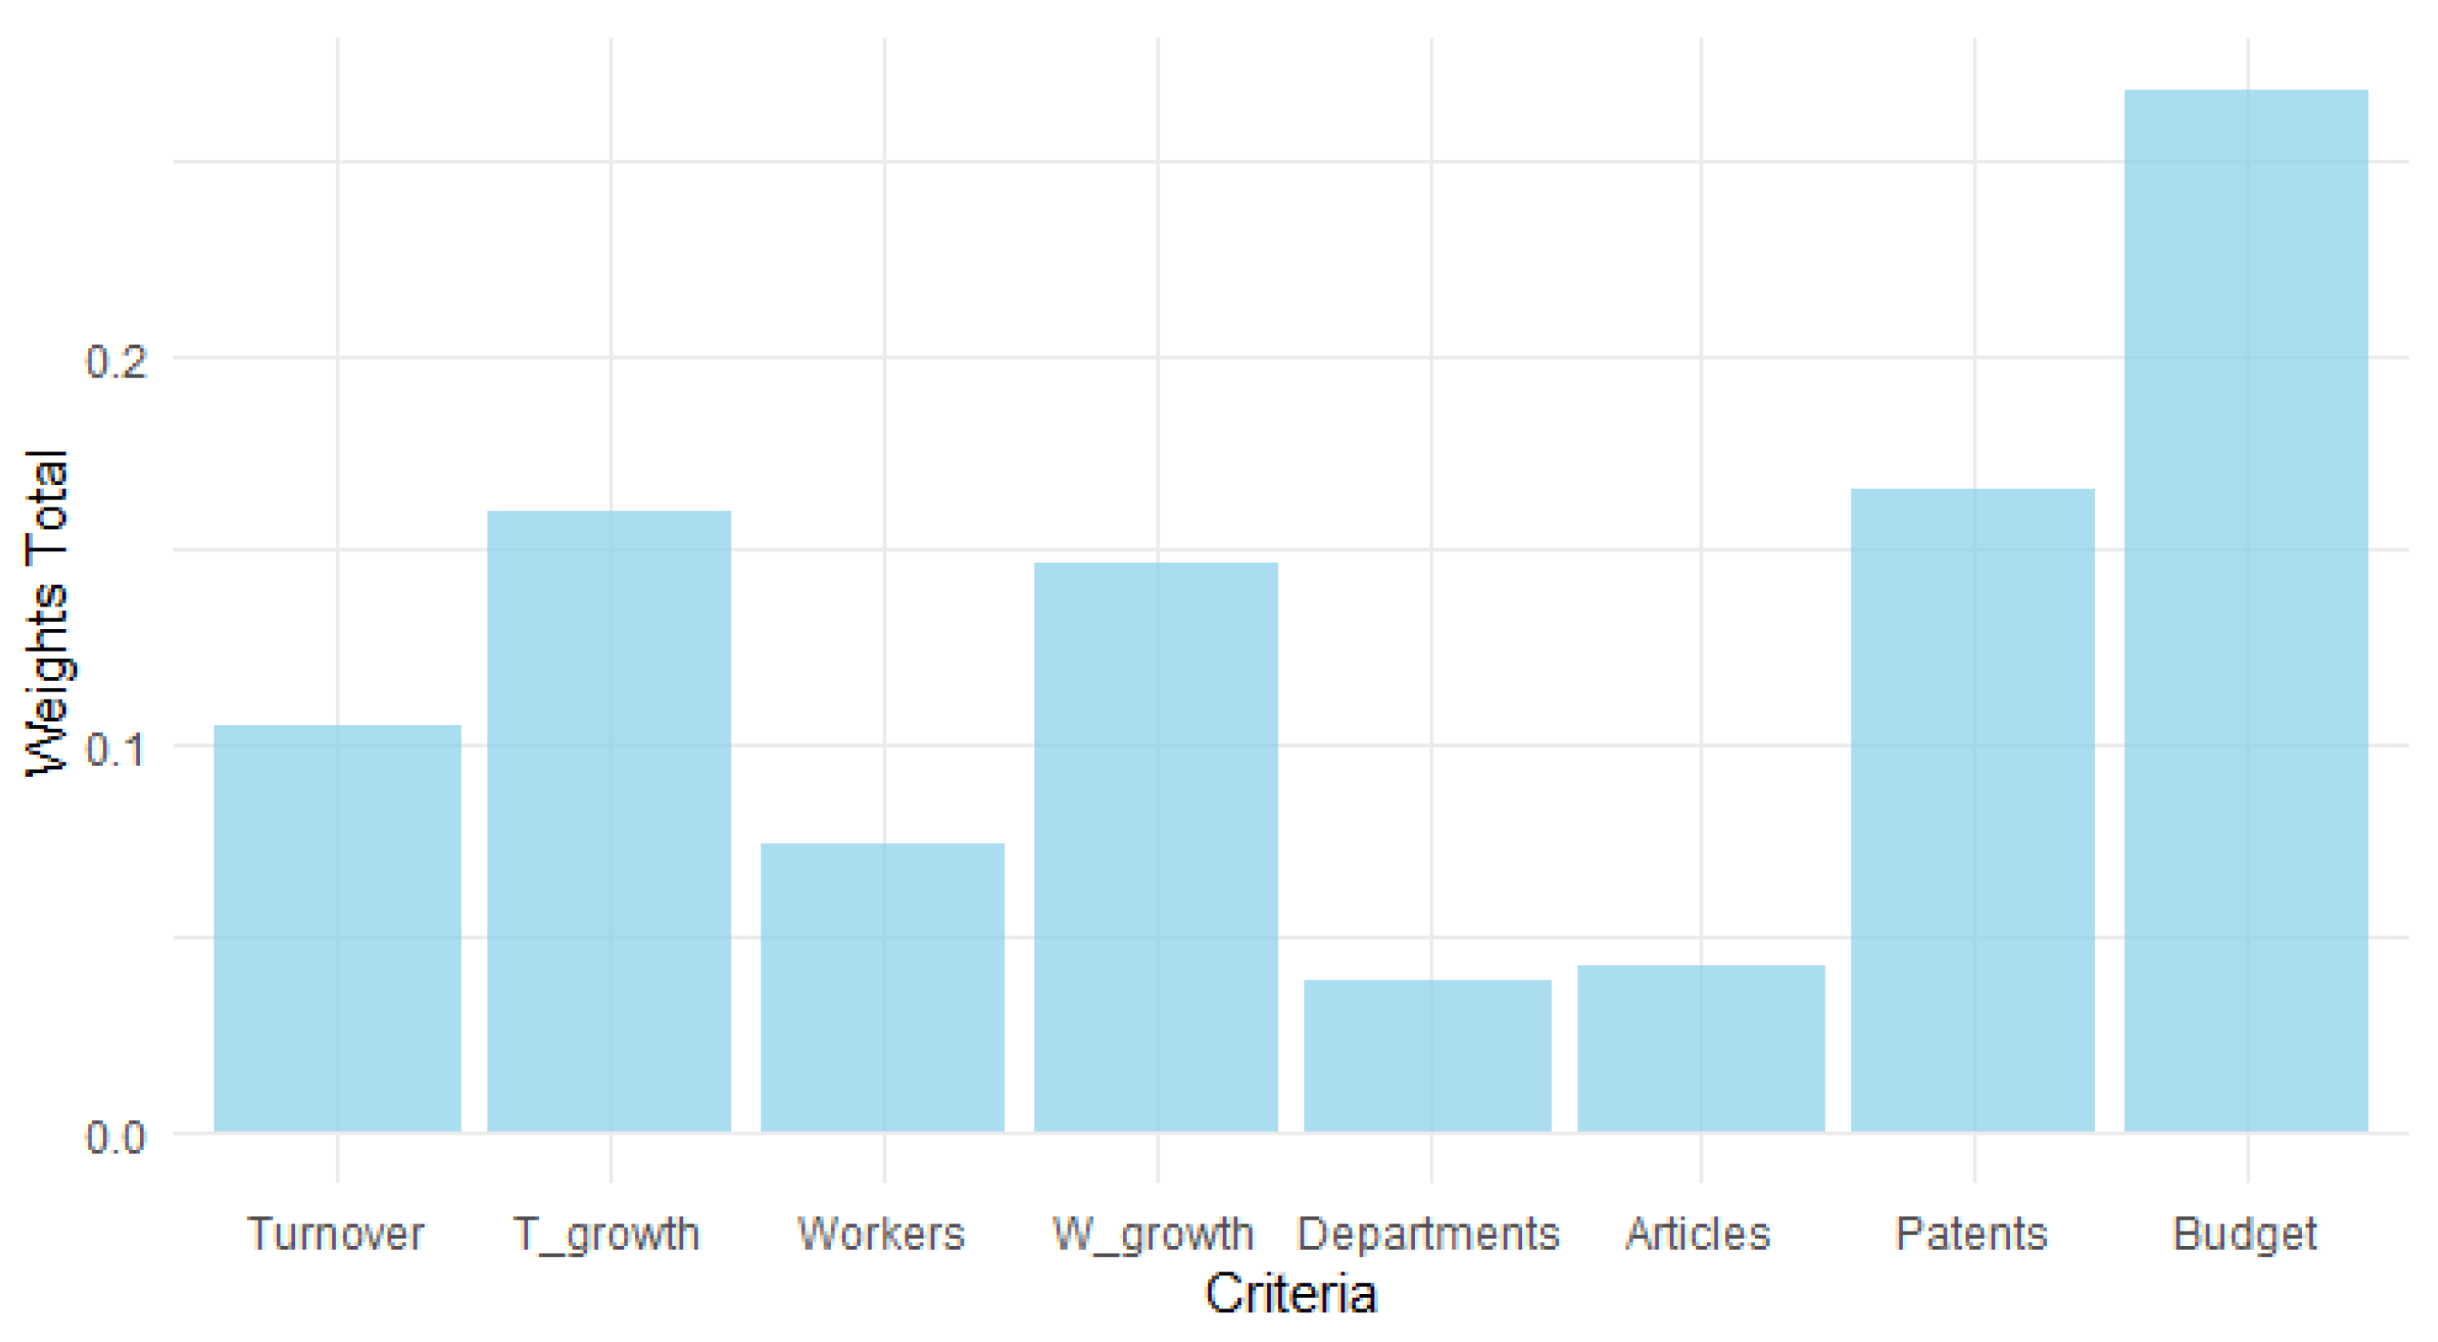
The calculation of the final weights for each criterion, also defined as “aggregated weights” of all decision-makers, is based on the arithmetical average of individual weights. The standard deviation between the individual weights was also calculated to assess the variability between individual priorities. Considering that all the judgment matrices have a CR, which was at least tolerable, all the matrices were included in this calculation.

2.2.4. Overall Weighted Scores Calculation

The overall performance of each option is calculated as the weighted average of its score for each criterion. In other words, each performance value is multiplied for its weight, then the products related to the same options are summed together to obtain the overall score for that option. Given the score for option i on criterion j (sij), the weight for each criterion (wj) and the total number of criteria (n), equation (4) calculates the total score for an option (TSi) given as follows: [29]:
TSi = j = 1 n wi sij
The MCDA package of R was employed to evaluate the overall and partial score for each macro-area of each options’ criteria (economic, social and technological).

2.2.5. Sensitivity Analysis

Sensitivity analysis was performed to measure how much the uncertainty in the output of a model (i.e., the ranking of the final options) is affected by the uncertainty in its input factors (i.e., criteria weights) [36]. In this study, each weight was modified by 25% from the weight value calculated according to the AHP model [37]. The code developed ad hoc for this study, shown in Appendix A, allows increase and decrease of each criterion by 25% while keeping constant (equal to 1) the sum of the weights as required by the AHP method.

2.3. Limitations of the Study

Despite adopting a systematic procedure, some limitations need to be considered when analyzing data, drawing conclusions and replicating this approach in other geographic and thematic contexts. Manual screening of sources by authors may result in minor data selection errors, which are considered negligible given the large number of items identified for each inventory. The low number of interviewed experts could increase the subjectivity of assessing weights. However, subjectivity bias in assigning weights to the criteria in the MCDA were contained thanks to experts with heterogeneous backgrounds. Finally, it is important to consider that the bio-based applications and, consequently, the MCDA are region-specific; therefore, a bibliographic search of relevant applications in a specific region is essential in case of method replication in a different area.

3. Results

3.1. Inventories Quantitative Analysis

The present study analyzes 200 companies and producers of goods and services from enhancing second-generation agri-food by-products to obtain biobased materials alternative to fossil ones, excluding the primary sector. With a total of 49.5 billion euros of turnover and 43,000 employees in 2019 (Workers), SMEs dominate the competitive landscape (145), followed by industries and corporates (55).
Biochemicals application ranks first by units (58), followed by Biopolymers (54), Biofuels (40), Agrofood (35) and Wood (13). According to the NACE definition, companies operate mainly in the production of plastics, organic and basic chemicals (54.5% NACE C 10–33); followed by research and development in the industrial biotechnology field (19.5% NACE M70-72); and treatment and valorisation of urban, industrial and organic waste (11% NACE 36–38). The remaining companies are engaged in trading in chemicals (9% NACE G46-47); energy production (3.5% NACE D 35); packaging (1% NACE N82); and biofuels/bioenergy (1.5% NACE F42, B6, H52). In terms of geographical distribution, two-thirds of the companies are based in the provinces of Milan (70), Bergamo (27), Varese (18), Monza-Brianza and Pavia (16 respectively), and Mantua (12), followed by Brescia, Cremona, Lodi, Como, Lecco and Sondrio (the remaining 41). With a stable annual turnover of around 50 billion euros from 2015 to 2019 (T_Growth), the bioeconomy sector in Lombardy has seen rapid growth in SME revenues. The results of Micro-SMEs (≤2 million euros/year) and SMEs (from 2 to 9.99 million/year), representing 50% of the industrial sector (113 out of 200 companies), grew respectively by 42.18% and 38.44% in 2019 compared to 2015. A positive trend gave impetus to new employment, recording an increase of 7.7%, from 40,030 in 2015 to 43,114 employees in 2019, driven by Micro-SMEs, whit a 121% growth in 2019 compared to 2015 (W_growth). In 2019 there was a constant growth of the share capital + 12% (in median value) compared to the previous year and, overall, a result of more than ten percentage points compared to 2015.
The return of assets (ROA), obtained from the ratio between EBIT (earnings before interest and taxes) and total assets before taxes, reveals companies' growing operational efficiency in generating profits. The average ROA of the Lombard sector, a useful measure to evaluate a company in terms of the interest of a possible shareholder or investor, increased by 19% (in median value) in 2019 compared to the previous year, driven by companies operating in the collection and treatment of waste (NACE code E, +13%) and chemicals production (NACE code G, +11%). The industrial ecosystem of the bioeconomy invests in innovation with market-oriented projects, a general propensity of the 200 companies that encourages shareholders to increase the share capital, which has grown 2.5 times (in median value) from 2015 (115,000 euros) to 2019 (286,240 euros). The rate of return on risk capital, or the return of equity contributed by shareholders (ROE), grew by 46% in the waste collection and treatment sector (NACE code E38, 88% ROE in 2019), 11% in organic basic chemical production (NACE code C20, 8% ROE in 2019) and 6% in research and development of industrial biotechnology (NACE code M72, ROE 58% in 2019).
The analysis of intellectual property rights (Patents) in the five areas of interest of the bioeconomy resulted in 41 registered patents owned by Lombard entities. The Biopolymers manufacturing application dominates the sample (16), followed by Biochemicals and Wood (10 each), Agrofood and Biofuels (five each).
Lombardy R&D expenditure in the bioeconomy (Budget) also describes the ability of the public–private system to attract ERDF, national and European funding in the 2014–2020 period. With an expenditure of around 500 million euros supported by average funding of 72% (357 million euro), the present study identified a sample of 229 projects with at least one partner operating in Lombardy, focused on bio-based goods production.
At the regional level (108 projects), the ERDF funds led by Axis 1 (Research and innovation) support services, the industrialization of research results, and public–private networks to develop new sustainable solutions in the priority areas defined by the regional Smart Specialization Strategy (S3). Basic and applied research benefit from the Cariplo Foundation funding programs (80 projects); finally, at the European level, Horizon 2020 is the primary reference measure (41 projects) with the Bio-Based Industries (H2020-BBI-JTI) and Sustainable Food Security (H2020-SFS) programs. The three-year period 2016–2018 proves to be the period with the highest ratio between ERDF funding opportunities (four calls for proposals with a total financial endowment of 258 million euros) and participation of the beneficiaries (55% of the total projects financed with 271 million euros expenses). R&D investments in the bio-based chemicals/pharmaceutical and bio-based food/feed sectors are confirmed as driving forces for the bioeconomy, absorbing 33% and 27%, respectively, followed by the biofuels and biopolymers and bioplastics sectors (20% and 18%), wood and paper (2%). Concerning the Lombard high-education and research offer in bioeconomy, including the activation of degree courses, specialization schools, and research groups, 39 departments and individual units belong to 7 universities and 4 public and private research centres (Departments). The agri-food/feed sector has the highest percentage of units (33%), followed by the bio-based chemicals and pharmaceuticals sector (31%), biopolymers and biofuels (15.5% each) and wood processing and paper (5%).
Finally, to measure the international attractiveness of the Lombard research system, a systematic analysis of the literature (Articles) published in peer-reviewed journals was conducted, resulting in 375 papers from 2014 to 2021 (up to March). The three-year 2018–2020 was the most prolific, totalling 55% of the papers (205), dominated by studies on wood and paper applications (69 of 94), bio-based biofuels (53 of 133, which also represents the sector overall with the highest number of papers), followed by biopolymers (30 of 62), agro-food/feed (25 of 42) and biochemicals (28 of 44).

3.2. Multi-Criteria Decision Analysis (MCDA) Quantitive Analysis

Inventories design and quantitative data analysis enabled implementation of the MCDA performances matrix, as illustrated in Table 7, as a part of step 1 of the MCDA. Furthermore, the normalization of the values according to a 0–1 scale requested by step 2 of the methodology led to the final performance matrix facilitating the comparison of the results, as shown in Table 8. Data reported in Table 8 was used for further calculation and the full implementation of the MCDA.
The absolute normalized performance of the alternatives for each criterion (shown in Figure 2 and reported in Table 8) reveals the strengths and weaknesses of each bioeconomy application.
Biofuels application totals the maximum value (1) in three criteria: turnover, employees (Workers), and number of international scientific co-publications (Articles), closely followed by Biochemicals leading R&D investments (Budget) and the employment growth rate (W_growth). Agrofood, biopolymers and wood applications total the maximum value in only one criterion, respectively in higher-education offer (Departments), number of registered patents (Patents), and turnover growth rate (T_growth).
These considerations refer to the normalized absolute value of each option against each criterion, providing preliminary indications of the applications’ relevance. However, these data are insufficient to define the ranking of the options since the definition of weights for each criterion substantially contribute to the final score calculation.
As foreseen by step 3 of the MCDA methodology, ten experts with different backgrounds were interviewed to assign weights to each criterion according to their relevance in defining the innovation potential of bio-based applications. A summary of the priorities of each individual interviewed and their relative weight, calculated with the ahp.indpref function, is shown in Figure 3.
Mixing boxplot and scatter plot, the graph proves the weights heterogeneity given by the different respondents and their consistency ratio.
All ratings on Turnover, employment (Workers), Higher-education offer (Departments) and international co-publications (Articles) criteria share values close to or substantially lower than 0.1, but have a low interquartile range, suggesting that respondents have a high level of agreement. On the contrary, turnover growth rate (T_growth), employment growth rate (W_growth), number of registered patents (Patents) and R&D investments (Budget) record median value higher than 0.1, with the weight assigned to the latter criterion exceeding 0.2. These criteria also show the highest interquartile ranges, with T_ growth and W_growth ranking first for the greatest heterogeneity. In summary, the experts agree in determining the weight of criteria considered less important in assessing the bio-based applications innovation potential. At the same time, the disagreement is greater for criteria with a higher final weight as a possible consequence of the involvement of experts with different backgrounds (entrepreneurs, researchers, policymakers). Finally, considering the colors of the jitter graphs, it can be observed that most of the priorities of the interviewees fall within the CR limit considered acceptable for an 8 × 8 performance matrix (CR <0.141 corresponding to blue points). All the individual judgments respect the tolerance limit (CR <0.282 corresponding to the pink points) that indicate a general consistency in the priorities envisaged. Therefore, considering that all judgments have tolerable CR, all matrices were included in calculating the final scores.
The results of the weights’ attribution obtained from the individual priorities’ arithmetic average are shown in Figure 4. The highest weight was assigned to R&D investments (Budget = 0.26814075), followed by the protection of intellectual property (Patents = 0.16562722), growth in turnover (T_growth = 0.15936269) and employment (W_growth = 0.14592823). The lowest weight was assigned to the high-education offer (Departments = 0.03920736) and the number of international co-publications (Articles = 0.04292915). The weights assigned to turnover (Turnover = 0.15936269) and employees (Workers = 0.14592823) cover intermediate values.
The total scores for the five identified bio-based applications make it possible to rank options from the best to the worst-performing and identify innovation potential concerning the three macro-impact areas (social, economic, technological). With an overall score of 0.6872006, the Biochemicals application ranks first by regional impact, followed by Agrofood, Biopolymers and Biofuels, with a score of 0.5141269, 0.5029931 and 0.3948341, respectively. The manufacturing of wood and paper sector closes the ranking with a total score of 0.2901114, more than halved compared to the top-ranked application. The highest positioning of biochemical in the ranking of innovation potential applications is due to the R&D investments (Budget) criterion, accounting for 39% of the overall score, as shown in Figure 5. Further relevant parameters are the employment growth rate (W_growth) and the turnover growth rate (T_growth), accounting for 21% and 16%. On the other hand, the abundance of international publications (Articles) criterion affecting the innovation potential can be considered marginal.
Investment in R&D and attractive financing capacity (Budget) is the central criterion affecting the innovation potential also for Agrofood, Biofuels and Bioplastics applications, accounting for 43%, 40% and 30%, respectively. On the contrary, the turnover growth rate (T_growth) proves to be a driving force for the development of the Wood application, which represents 55% of the overall score, followed by IP protection (Patents, 26%) and employment generation capacity (W_growth, 10%).
The partial score for each impact macro-category (economy, social, technological), shown in Figure 6, proves the dominant positioning of Biochemicals application, in the first place, except for the economy category, for which Wood stands out. Concerning the social macro-category, the overall ranking is preserved except for the Biofuels application, which ranks third after Agrofood. Finally, the technological impact is driven by the Biochemicals application, but Biopolymers closely follows, with a similar score.

Sensitivity Analysis

The sensitivity analysis tests the variance of the final result for each option (sectors of the bioeconomy) as ±25% of each criterion varies, as illustrated in Figure 7.
The Agrofood application, in second place in the baseline scenario, ranks third when the weights for turnover growth rate (T_growth) or abundance of registered patents (Patents) criteria increase, or due to a decrease in the weights of R&D investment (Budget), or employment relevance (Workers and W_growth), allowing Biopolymers application to take the second position in the final ranking.
Important changes can also be observed for the Biofuels, and Wood applications as the turnover growth rate (T_growth) increase or the R&D expenditure (Budget) decrease. These two applications have a similar overall score for these changes, highlighting their strong dependency on these two criteria. To sum up, changes in the weight of a single criterion have a limited effect on the result. In contrast, hypothetical simultaneous changes in the values of two or more criteria could result in a major disruption in the ranking of the final application, although always leaving the first and last position unchanged. The results, remaining constant despite the changes in the criteria weights, represent an indicator of the reliability of the analysis.

4. Discussion

4.1. Innovation Potential of the Bioeconomy in Lombardy

The relevance and innovation potential of the Lombard bioeconomy for regional competitive development are described in the study by the ability of bio-based applications—exploiting side streams and renewable biological materials to replace fossil-based products—to generate economic, social and technological impacts.
The regional industry’s market competitiveness is measured by quantifying the bioeconomy ecosystem in terms of its ability to generate value and preserve it over time, also thanks to investments in innovation responding to global challenges.
With 200 companies operating in Lombardy, the bioeconomy sector mobilizes 49.5 billion euros in turnover in 2019, generally confirming stability since 2015 and highlighting extraordinary growth results for SMEs. With an increase in turnover from 2019 to 2015 of 42.18% and 38.44%, respectively, the micro (≤2 million/year) and small (from 2 to 9.9 million/year) companies represent the economic development engine of the regional bioeconomy. The analysis of the economic impact of the bioeconomy in Lombardy reveals a growing operational efficiency of companies in generating profits, as emerges from the analysis of ROA. These economic indicators demonstrate the relevance of the Lombard bioeconomy sector not only at the regional level but also for the whole Italian territory, supporting the choice of Lombardy as a case study.
The impact of the bioeconomy on Lombardy’s competitive system is also significant when considering the social impact. With 39 departments distributed over 11 universities and research centres, Lombard public and private institutions offer an excellent higher-education offer, training professional, competent and specialized operators whose employment is rapidly increasing. From 2015 to 2015, the bioeconomy employment grew by 7.7%, demonstrating its dynamism and innovation potential.
Regarding technological impact, with over 493 billion euros of R&D expenditure in 2014–2020, public and private operators in the bioeconomy sector prove to be among the most advanced and attractive at the regional level. Many international scientific co-published Lombard authors (375) also testify to intense research activity, but despite the considerable excellence, the low number of patents (41) reflects the difficulties in addressing the patent protection path and capitalizing on the investment. These data follow the results obtained by D’Adamo et al. in a precedent study [17] which identified Lombardy as a virtuous Italian region in the bioeconomy sector, showing values higher than the national benchmark when considering socio-economic indicators.
However, measuring the bioeconomy cannot ignore the complexity of its multiple applications, resulting in a detailed analysis of the five main industrial applications through eight different economic, social and technological criteria. Combining the analysis of different inventories with an MCDA approach, the methodology developed in this paper identified bio-based chemicals/pharmaceuticals, followed by bio-based agri-food and bioplastics/biopolymers as the most impact-driving applications and with the most outstanding innovation potential.
Biochemistry is one of the leading bioeconomy applications of the Lombard economy, mainly focused on the production of fine chemicals with a particular interest in phytoextracts as nutraceuticals and functional cosmetics. The majority of companies mapped by the study (58) is composed of producers of bio-based chemicals (from renewable biomasses and microorganisms) and operators committed to reducing their environmental impact, employing greener processes (e.g., using enzymes to replace polluting steps or toxic reagents) and integrating the production process with downstream recovery in a circular perspective. Among the emblematic cases at the international level, Bellini Spa has developed Harolbio, the first innovative lubricating oil of vegetable origin, mainly from agricultural waste, representing a revolution in lubrication that led to sensitizing the market to the environment and workers’ health.
With a total investment of 161 billion euro accounting for over 30% of the regional R&D expenditure, the biochemical application also leads the bioeconomy research sector. Consistently with the industrial sector, half of the funded projects aim to produce greener high-value-added compounds as nutraceuticals, cosmetics, and molecules with pharmaceutical activity mainly obtained as phytoextracts or from waste recovery.
Agrofood application, including bio-based feed and functional food and innovative and green cultivation techniques, follows the biochemical sector of innovation potential generated in the Lombardy region. The 2015–2019 turnover performance of Agri-food companies increased by 17% (from 1.25 to 1.47 billion euros), and the 2015–2019 employment recorded +19% (from 2100 to 2500 employees) demonstrate a high capacity of socio-economic value generation for Lombardy. Organic waste and wastewater treatment to obtain bio-based fertilizers in agriculture is the most widespread application, followed by algae cultivation to develop functional foods. As an exemplary case, Agromatrici Srl develops solutions to enhance organic waste and sewage sludge for recovering nutrients and renewable fertilizers production by combining circular economy and smart farming approaches.
Furthermore, biopolymers in Lombardy boast cases of excellence in numerous and versatile applications, including textile, automotive, and green building. Among the successful cases, Vegea Srl promotes sustainability by enhancing marc grapes for cruelty-free biopolymers for fashion, furniture, and automotive products. In the same sector, Montello SpA is considered an excellent European case of post-consumer plastic packaging recycling (up to 200,000 tons/year) and urban organic waste (up to 600,000 tons/year) from which is obtained biogas, energy electric, thermal, biomethane, and high-quality organic fertilizer. Concerning other bio-based applications, the biopolymers sector stands out for several patents (16), with a focus on the application in the medical field (e.g., adhesive biopolymers, biocompatible scaffolds for tissue regeneration, biocompatible medical devices, carriers for drug delivery), reflecting its ability to develop innovative products that find a real-life application on the market. The global market of polymers for biomedical applications is witnessing exponential growth, and it is expected to reach USD 2834.46 Million by the end of 2025 at a Compound Annual Growth Rate (CAGR) of 22.18% [38]. Lombard institutions and companies, following world trends, are therefore trying to position themselves in this developing market.
Finally, it is interesting to discuss the reason behind the low ranking position of the biofuels sector. As demonstrated by the low investment level in R&D projects, especially since 2016, this is probably a consequence of a saturated industry lacking innovation. Huge investments have probably supported an exponential development of this sector which is now letting up, resulting in a drop in turnover of −11.71%.

4.2. Deploying Bioeconomy Innovation Potential in Lombardy

The transition to sustainable and circular production and consumption patterns is an unstoppable process, supported in Europe by a synergic policy and investments measures implementing the European Green Deal [39], a roadmap for reducing net greenhouse gas emissions by at least 55% by 2030 compared to 1990 levels and to make Europe the first climate-neutral continent by 2050. An integral part of the strategies to implement the 2030 Agenda and the Sustainable Development Goals of the United Nations, the European Green Deal represents an unprecedented tool to ensure decarbonization in all sectors of the economy, from agriculture to industry, transport and energy [40].
Thanks to the European Green Deal, local policies will support investments that guarantee that green transition occurs in all European regions, overcoming disparities and penalties when using resources. In this context, the EU Cohesion Policy is a key tool to achieve these objectives, capable of integrating multiple actions for a green economy, such as Research and Innovation Strategies for Smart Specialization, Circular economy and Bioeconomy roadmaps. Despite the central role of the bioeconomy in achieving the Green Deal objectives, a Roadmap for Lombardy bioeconomy growth is absent, missing the opportunity to channel investments in applications with more significant social, economic and technological impact. Furthermore, according to the sector’s mega-trends, the instrumental value sectorial Roadmap exceeds the temporal dimension of programming and impacts regional development in a medium-long term perspective. The development of a coherent and effective roadmap is built on quantifying the current and prospective innovation potential of the bioeconomy through a standardized and replicable methodology. The interviewed experts agree that measuring the innovation potential of an emerging sector such as the bioeconomy cannot be separated from assessing R&D expenditure and the capability to protect and commercially exploit research results.
According to the European Commission recommendations for the deployment of bioeconomy in the EU [41], the Lombardy Bioeconomy Roadmap is driving innovation potential by:
1.
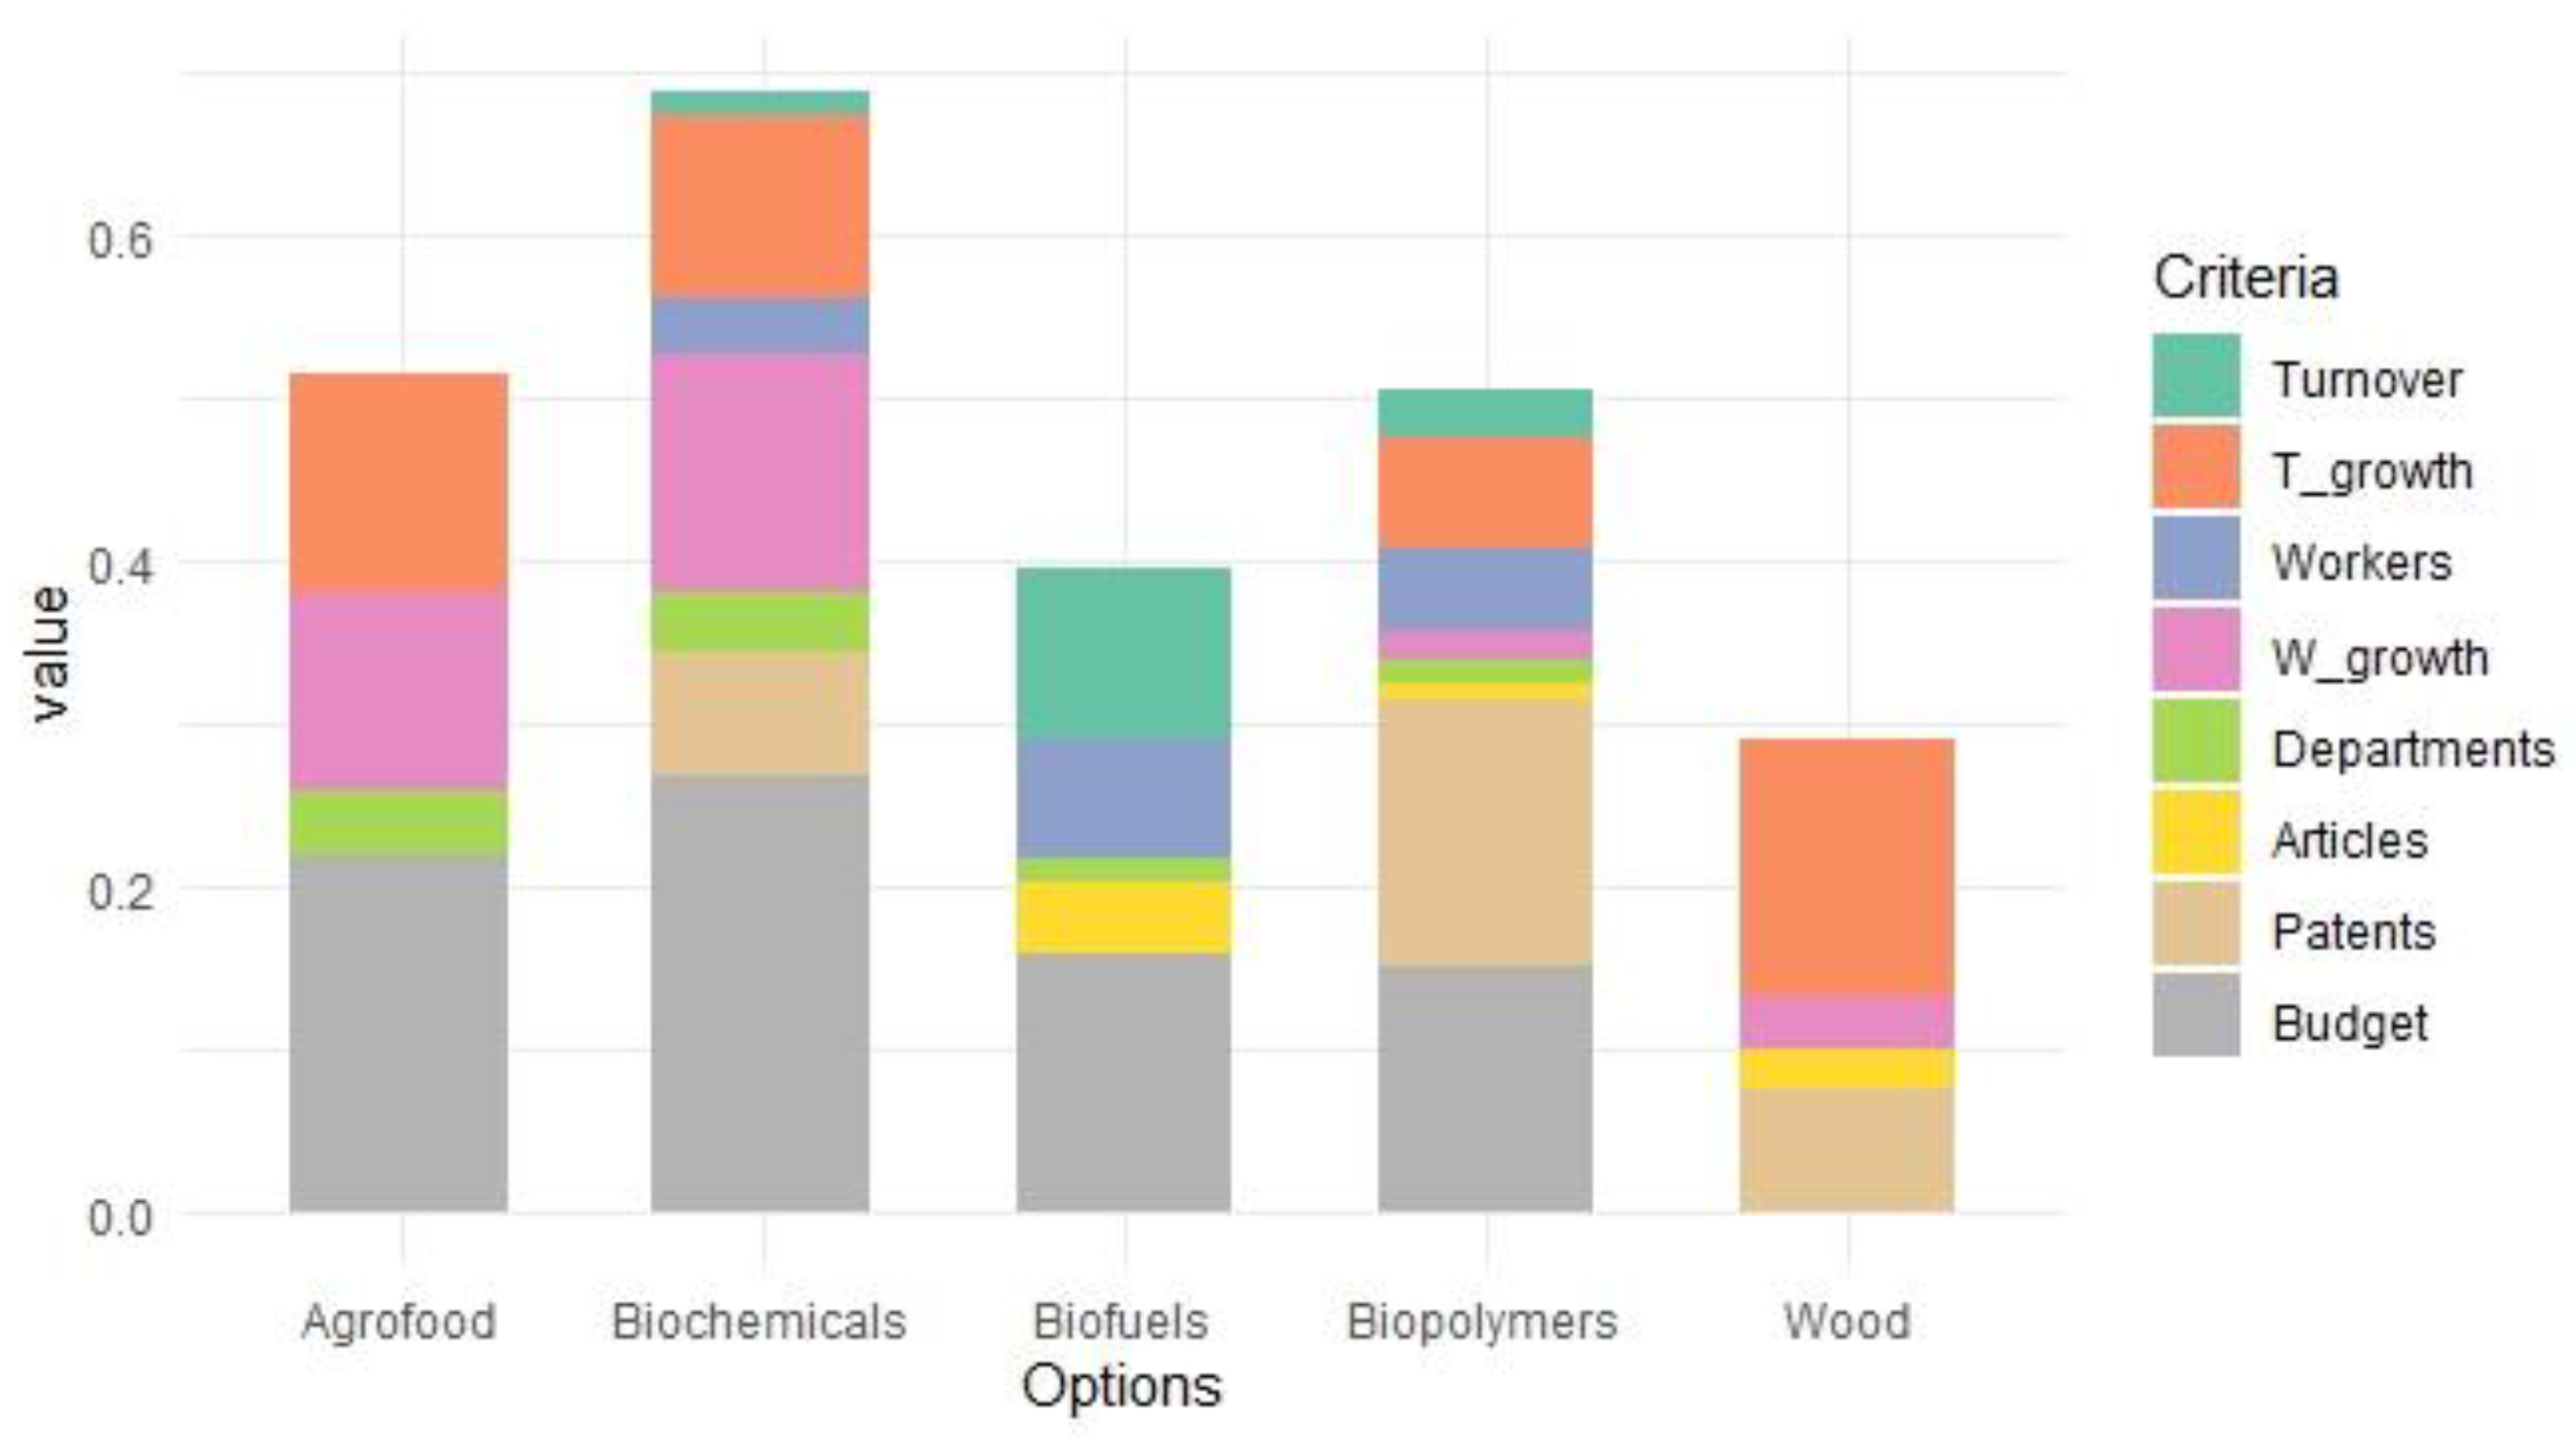
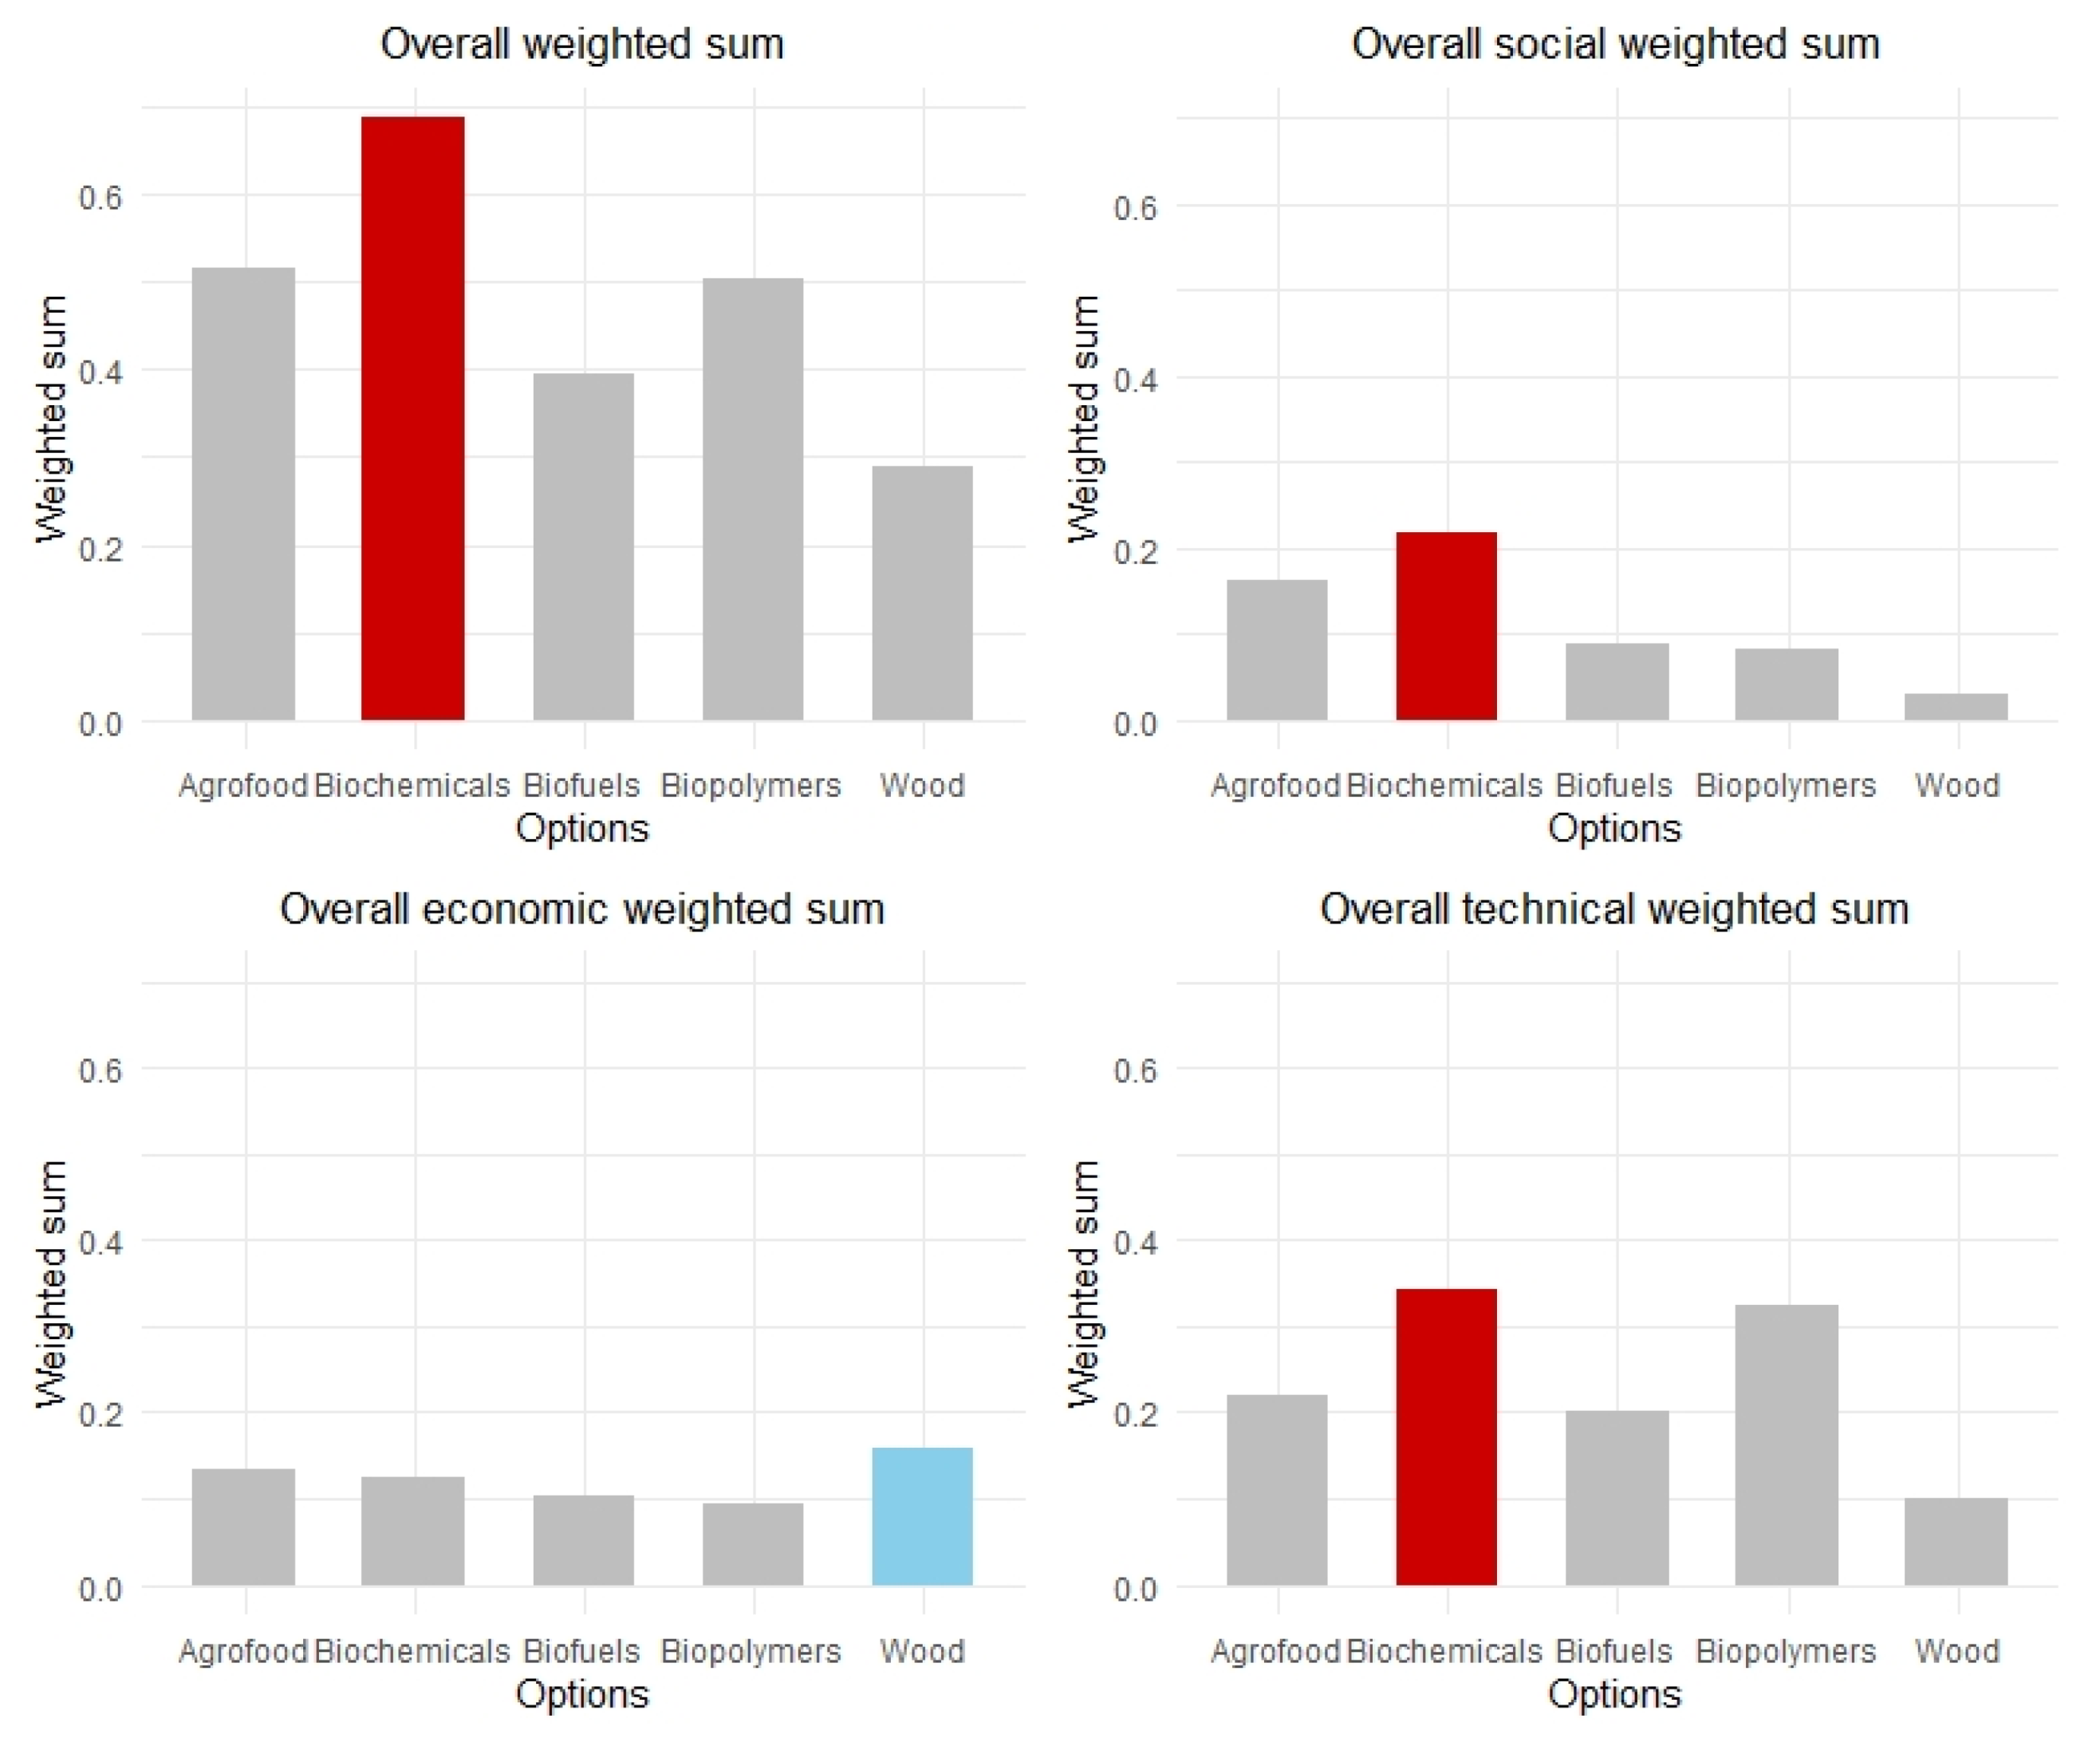
Driving green investments by economic, social, technological impacts measurement. The growing attention to environmental and zero-emission issues entails dedicating significant ERDF funds to the bioeconomy. Investment priorities should be settled based on the great variety of bio-based applications and their current and prospective innovation potential, as well as their socio-economic and technological impact on companies, institutions and citizens. The MCDA methodology applied in this study provides a ranking of the bio-based applications with the highest innovation potential, with the Biochemicals, Agrofood, and Biopolymers applications taking the first places. R&D funded projects in the Biochemicals and Agrofood area cover 60% of the total bioeconomy resources; in contrast, biopolymers application, despite its relevance for Lombardy—especially in terms of patented inventions—covers less than 20%. ERDF investment focused on boosting green biomaterials and bioplastic should be intensified to meet the growing market demand.
2.
Boosting industry-driven innovation beyond TRL 5 towards market exploitation. A greener and more sustainable economy is founded on an ecosystem populated by SMEs with high innovation potential interested in testing new products in a real environment but requiring intensive capital. The ROA and ROE data and the growing rate of capitalization of SMEs demonstrate the high profitability of the sector. Incentives to accelerate mature projects beyond TRL 5 towards industrial exploitation, combined with equity, could encourage ventures to shorten the time for placing biobased products on the market.
3.
Strengthen patentable innovation and licensing measures. IP protection reveals the sector’s propensity to develop an R&D innovation from the lab to the market, creating products with real-life applications. To date, a limited number of patents is held by Lombard institutions or companies, despite the unanimous experts’ opinion of the relevance of this parameter in measuring the innovation potential of the bioeconomy sector. The administrative process for patenting requires specialized legal figures and a prohibitive investment discouraging SMEs from undertaking this process.
4.
Enhancing start-up and SMEs credit access. SMEs and micro-SMEs account for over 50% of the industrial bioeconomy sector, with micro-SMEs driving its growth. Micro-SMEs in the bioeconomy grew 42.18% in turnover and 121% in employees from 2015 to 2019. Improving access to credit and finance for businesses for this rapidly developing sector could give further impetus to its growth, guiding the green transition of Lombard companies and promoting employment and investment in human resources.

5. Conclusions

Investments in green innovations have the proven potential to drive the transition of regional economies towards achieving the goals of the European Green Deal. Regions play a crucial role in shaping a low-carbon economy, and a regional bioeconomy roadmap, based on quantifying its applications’ current and prospective innovation potential, is essential to reach this goal. With a turnover of 49.5 billion euros and 43,000 employees in 2019, the Lombard bioeconomy sector is one of the most developed at the national and European level, although a dedicated Roadmap is not yet available. By building five inventories measuring the bioeconomy capacity in Lombardy and developing an MCDA methodology, this study measured the innovation potential of five different bio-based applications. As a result of this analysis, bio-based chemicals and pharmaceuticals application is one of the leading bioeconomy applications of the Lombard economy, mainly focused on the production of fine chemicals with a particular interest for phytoextracts as nutraceuticals and functional cosmetics. It is followed by the agri-food and biopolymers applications, both characterized by a significant level of innovation potential and high market demand.
Finally, this paper provides some important recommendations on how to model a bioeconomy strategy, which can be summarized as follows (1) Driving green investments by economic, social, technological impacts measurement, (2) Boosting industry-driven innovation beyond TRL 5 towards market exploitation, (3) Strengthen patentable innovation and licensing measures, (4) Enhancing start-up and SMEs credit access.
While this paper considers some limitations, including the subjectivity of some procedures, its methodology is highly replicable, thus providing an evidence-informed policy to develop an effective and coherent bioeconomy strategy at the regional level.

Author Contributions

Conceptualization, F.G., S.D. and I.R.; methodology, F.G., S.D. and I.R.; software, S.D.; validation, F.G., S.D. and I.R.; formal analysis, F.G., S.D. and I.R.; investigation, F.G., S.D. and I.R.; resources, F.G., S.D. and I.R.; data curation, F.G., S.D. and I.R.; writing—original draft preparation, F.G., S.D. and I.R.; writing—review and editing, F.G., S.D. and I.R.; visualisation, F.G., S.D. and I.R.; supervision, F.G., S.D. and I.R.; project administration, I.R.; funding acquisition, I.R. All authors have read and agreed to the published version of the manuscript.

Funding

This research was funded by the Lombardy Green Chemistry Association as the technical coordinator of the Bioeconomy Pilot of the Vanguard Initiative in the context of the Pilot’s 2021 Plan.

Institutional Review Board Statement

Not applicable.

Informed Consent Statement

Informed consent was obtained from all subjects involved in the study.

Data Availability Statement

The R-code presented and employed in this study is available in Appendix A.

Acknowledgments

The study was carried out in the context of the Action Plan 2021 of the Bioeconomy Pilot of the Vanguard Initiative. Authors thank the Lombardy Green Chemistry Association to provide support through market data and mapping promising business models produced by the Vanguard initiative’s Bioeconomy Pilot.

Conflicts of Interest

The authors declare no conflict of interest.

Appendix A

This appendix contains the R code employed for the MCDA implementation.
Sustainability 13 11709 i001 Sustainability 13 11709 i002 Sustainability 13 11709 i003 Sustainability 13 11709 i004

References

  1. European Council. European Council Meeting (10 and 11 December 2020)—Conclusions. 2020. Available online: https://www.consilium.europa.eu/media/47296/1011-12-20-euco-conclusions-en.pdf (accessed on 19 August 2021).
  2. European Commission. The Just Transition Mechanism—Publications Office of the EU. Available online: https://op.europa.eu/en/publication-detail/-/publication/5469b951-3744-11ea-ba6e-01aa75ed71a1/language-en (accessed on 20 August 2021).
  3. Carus, M.; Dammer, L. The circular bioeconomy—Concepts, opportunities, and limitations. Ind. Biotechnol. 2018, 14, 83–91. [Google Scholar] [CrossRef]
  4. European Commission. Innovating for sustainable growth. Off. J. Eur. Union 2012. [Google Scholar] [CrossRef]
  5. Ronzon, T.; M’barek, R.; Sanchez Lopez, J.; Avraamides, M. Brief on Jobs and Growth of the EU Bioeconomy 2008–2017; European Commission: Brussels, Belgium, 2020. [Google Scholar]
  6. Wydra, S. Measuring innovation in the bioeconomy—Conceptual discussion and empirical experiences. Technol. Soc. 2020, 61, 101242. [Google Scholar] [CrossRef]
  7. Haarich, S. Bioeconomy Development in EU Regions—Final Report; Publications Office of the European Union: Luxembourg, 2017. [Google Scholar]
  8. Lier, M.; Aarne, M.; Kärkkäinen, L.; Korhonen, K.T.; Yli-Viikari, A.; Packalen, T. Synthesis on Bioeconomy Monitoring Systems in the EU Member States—Indicators for Monitoring the Progress of Bioeconomy; Natural Resources Institute Finland: Helsinki, Finland, 2018; Volume 38. [Google Scholar]
  9. Ronzon, T.; Piotrowski, S.; Tamosiunas, S.; Dammer, L.; Carus, M.; M’barek, R. Developments of economic growth and employment in bioeconomy sectors across the EU. Sustainability 2020, 12, 4507. [Google Scholar] [CrossRef]
  10. European Commission. National/Regional Innovation Strategies for Smart Specialisation (RIS3); European Commission: Brussels, Belgium, 2013. [Google Scholar]
  11. European Parliament and Council. Regulation (EU) No. 1303/2013 of the European Parliament and of the Council. Off. J. Eur. Union 2013. Available online: https://eur-lex.europa.eu/legal-content/EN/TXT/HTML/?uri=CELEX:32013R1303&from=it (accessed on 20 August 2021).
  12. Valitov, S.M.; Khakimov, A.K. Innovative potential as a framework of innovative strategy for enterprise development. Procedia Econ. Financ. 2015, 24, 716–721. [Google Scholar] [CrossRef] [Green Version]
  13. Kuosmanen, T. How Big Is the Bioeconomy? Reflections from an Economic Perspective; Publications Office of the European Union: Luxembourg, 2020. [Google Scholar]
  14. Ronzon, T.; Piotrowski, S.; M’Barek, R.; Carus, M. A systematic approach to understanding and quantifying the EU’s bioeconomy. Bio-Based Appl. Econ. 2017, 6, 1–17. [Google Scholar] [CrossRef]
  15. Kardung, M. Development of the circular bioeconomy: Drivers and indicators. Sustainability 2021, 13, 413. [Google Scholar] [CrossRef]
  16. D’Adamo, I.; Falcone, P.M.; Morone, P. A new socio-economic indicator to measure the performance of bioeconomy sectors in Europe. Ecol. Econ. 2020, 176, 106724. [Google Scholar] [CrossRef]
  17. D’Adamo, I.; Falcone, P.M.; Imbert, E.; Morone, P. Exploring Regional Transitions to the Bioeconomy Using a Socio-Economic Indicator: The Case of Italy. Econ. Polit. 2020, 1–33. [Google Scholar] [CrossRef]
  18. Giorgetti, G.; Morassi, P.; Vigna, G. BIT II—Bioeconomy in Italy: A New Bioeconomy Strategy for a Sustainable Italy; Comitato Nazionale per la Biosicurezza, le Biotecnologie e le Scienze della Vita, Presidenza del Consiglio di Ministri: Roma, Italy, 2019. [Google Scholar]
  19. Lombardy Region. Research & Innovation in Lombardy Region. Available online: https://bit.ly/3E199Qb (accessed on 13 July 2021).
  20. Lombardy Region. Biotechnology and Chemical. Available online: https://bit.ly/3G6vb66 (accessed on 13 July 2021).
  21. Lombardy Green Chemistry Association. D.T1.1.1 Inventory of Policy Instruments: Regional Reports about State-of-the-Art Strategies, Policies and Clusters Related to Bioeconomy—Lombardy Region; Lombardy Green Chemistry Association: Milano, Italy, 2018. [Google Scholar]
  22. Lombardy Region. ERDF ROP 2014–2020. Available online: https://www.fesr.regione.lombardia.it/wps/portal/PROUE/FESR/english (accessed on 31 August 2021).
  23. Ronzon, T.; Santini, F.; M’Barek, R. The Bioeconomy in the European Union in Numbers. Facts and Figures on Biomass, Turnover and Employment; Joint Research Centre-Institute for Prospective Technological Studies, European Commission: Sevilla, Spain, 2015. [Google Scholar]
  24. Content Coverage Guide—Scopus. Available online: https://www.researchgate.net/publication/330161507_Scopus_Content_Coverage_Guide (accessed on 31 August 2021).
  25. Lombardy Region. R&D Line for Aggregations. Available online: https://www.fesr.regione.lombardia.it/wps/portal/PROUE/FESR/Bandi/DettaglioBando/Agevolazioni/linea-res-aggregazioni. (accessed on 30 August 2021).
  26. Lombardy Region. Call for Activation of an Experimental Program Aimed at Defining the Agreements for Research, Development and Innovation. Available online: https://www.fesr.regione.lombardia.it/wps/portal/PROUE/FESR/Bandi/DettaglioBando/Agevolazioni/accordi-ricerca-sviluppo-innovazione (accessed on 30 August 2021).
  27. Lombardy Region. Smart Fashion and Design. Available online: https://www.fesr.regione.lombardia.it/wps/portal/PROUE/FESR/Bandi/DettaglioBando/Agevolazioni/bando-smart-fashion-and-design (accessed on 30 August 2021).
  28. Lombardy Region. Call HUB Research and Innovation. Available online: https://www.fesr.regione.lombardia.it/wps/portal/PROUE/FESR/Bandi/DettaglioBando/agevolazioni/call-hub-ricerca-innovazione (accessed on 30 August 2021).
  29. Department for Communities and Local Government. Multi-Criteria Analysis: A Manual; Department for Communities and Local Government: London, UK, 2009. [Google Scholar]
  30. Bigaret, S.; Hodgett, R.E.; Meyer, P.; Mironova, T.; Olteanu, A.L. Supporting the multi-criteria decision aiding process: R and the MCDA package. EURO J. Decis. Process. 2017, 5, 169–194. [Google Scholar] [CrossRef] [Green Version]
  31. Cho, F. Analytic hierarchy process for survey data in R. Vignettes Ahpsurvey Package (Ver 0.2.1) 2019, 26, 1–24. Available online: https://escholarship.org/uc/item/4366g5pv (accessed on 19 August 2021).
  32. Aragon, T.; Dalnoki-Veress, F.; Shiu, K. Deriving Criteria Weights for Health Decision Making: A Brief Tutorial; UC Berkeley; Center for Infectious Diseases and Emergency Readiness: Berkeley, CA, USA, 2012; pp. 1–11. [Google Scholar]
  33. Steele, K.; Carmel, Y.; Cross, J.; Wilcox, C. Uses and misuses of multicriteria decision analysis (MCDA) in environmental decision making. Risk Anal. 2009, 29, 26–33. [Google Scholar] [CrossRef] [PubMed]
  34. Saaty, T.L. The Analytic Hierarchy Process; McGrwa-Hill: New York, NY, USA, 1980. [Google Scholar]
  35. Goepel, K.D. Implementing the analytic hierarchy process as a standard method for multi-criteria decision making in corporate enterprises—A new AHP excel template with multiple inputs. Proc. Int. Symp. Anal. Hierarchy Process 2013. [Google Scholar] [CrossRef] [Green Version]
  36. Saltelli, A.; Tarantola, S.; Chan, K. A role for sensitivity analysis in presenting the results from MCDA studies to decision makers. Decis. Anal. 1999, 8, 139–145. [Google Scholar] [CrossRef]
  37. Cobuloglu, H.I.; Büyüktahtakin, I.E. A stochastic multi-criteria decision analysis for sustainable biomass crop selection. Expert Syst. Appl. 2015, 42, 6065–6074. [Google Scholar] [CrossRef]
  38. GlobeNewswire. Biopolymers for Medical Applications Market Research Report. Available online: https://www.globenewswire.com/news-release/2020/11/04/2119740/0/en/Biopolymers-for-Medical-Applications-Market-Research-Report-by-Type-by-Source-by-Application-Global-Forecast-to-2025-Cumulative-Impact-of-COVID-19.html (accessed on 19 August 2021).
  39. European Commission. The European Green Deal, COM(2019) 640 Final. 2019. Available online: https://eur-lex.europa.eu/legal-content/EN/TXT/HTML/?uri=CELEX:52019DC0640&from=IT (accessed on 19 August 2021).
  40. Department of Economic and Social Affairs. Transforming Our World: The 2030 Agenda for Sustainable Development. Available online: https://sdgs.un.org/2030agenda (accessed on 19 August 2021).
  41. European Commission. Deploying the Bioeconomy in the EU: A Framework Approach for Bioeconomy Strategy Development; European Commission: Brussels, Belgium, 2021. [Google Scholar]
Figure 1. Flow chart to measure the innovation potential of bio-based applications. The data used in MCDA derive from the mapping of bioeconomy capacity (inventories) described in eight criteria organized in three macro-impact areas (economic, social and technological). Regional impact criteria are shown in the full name and abbreviated name (in parentheses).
Sustainability 13 11709 g001
Figure 2. Bar plot showing the performances on each criterion for each application.
Sustainability 13 11709 g002
Figure 3. Boxplot and jitter plot account for individual priority and its weighting and consistency ratio.
Sustainability 13 11709 g003
Figure 4. Overall weights.
Sustainability 13 11709 g004
Figure 5. Overall scores divided by each criterion contribution.
Sustainability 13 11709 g005
Figure 6. The partial score for each category. The highlighted bar represents the bio-based sector that ranks first for that category.
Sustainability 13 11709 g006
Figure 7. Sensitivity analysis results. Each graph refers to one criterion and shows how the total score for each bio-based application changes for a 25% increase or decrease in the weight of that criterion concerning the base scenario.
Sustainability 13 11709 g007
Table 1. Company search criteria, NACE code and keywords used in web searches for bio-based applications.
ApplicationsNACE Code
AGROFOODC10-C12, C20, E38, G46-47, M70-M72
BIOCHEMICALSC10, C19, C20, C21, C28, E38, G46, M70-M71
BIOFUELSB6, C20, C25, C27, C28, D35, E38, G46, M70-72
BIOPOLYMERS C10, C13-C15, C20, C22, E38, G46, M72, N82
WOODC16, C17, C20, C22, E38, M72
NACE codes descriptive of the bio-based sector as below:
B—Mining and quarrying
C—Manufacturing
D—Electricity, gas, steam, air conditioning supply management and remediation activities
E—Water supply; sewerage; waste
F—Construction
G—Wholesale and retail trade; repair of motor vehicles and motorcycles
H—Transporting and storage
M—Professional, scientific, technical activities
N—Administrative and support service activities
Table 2. Entry query strings for article search in Scopus.
ApplicationQuery String
Agrofood (TITLE-ABS-KEY(agro circular economy) OR TITLE-ABS-KEY(agro bioeconomy) OR TITLE-ABS-KEY(bio-based food) OR TITLE-ABS-KEY(bio-based feed)) AND (AFFILCITY(Bergamo) OR AFFILCITY(Brescia) OR AFFILCITY(Como) OR AFFILCITY (Cremona) OR AFFILCITY (Mantova) OR AFFILCITY (Milan) OR AFFILCITY (Monza) OR AFFILCITY(Lecco) OR AFFILCITY(Lodi) OR AFFILCITY(Pavia) OR AFFILCITY(Sondrio) OR AFFILCITY(Varese)) AND PUBYEAR > 2013 AND PUBYEAR < 2022
Biochemicals(TITLE-ABS-KEY(circular economy chemicals) OR TITLE-ABS-KEY(circular economy pharmaceuticals) OR TITLE-ABS-KEY(bioeconomy chemicals) OR TITLE-ABS-KEY(bioeconomy pharmaceuticals) OR TITLE-ABS-KEY(bio-based chemicals) OR TITLE-ABS-KEY(bio-based pharmaceuticals)) AND (AFFILCITY(Bergamo) OR AFFILCITY(Brescia) OR AFFILCITY(Como) OR AFFILCITY (Cremona) OR AFFILCITY (Mantova) OR AFFILCITY (Milan) OR AFFILCITY (Monza) OR AFFILCITY(Lecco) OR AFFILCITY(Lodi) OR AFFILCITY(Pavia) OR AFFILCITY(Sondrio) OR AFFILCITY(Varese)) AND PUBYEAR > 2013 AND PUBYEAR < 2022
Biofuels(TITLE-ABS-KEY(biofuel) OR TITLE-ABS-KEY(bio-based electricity) OR TITLE-ABS-KEY(circular economy biofuel) OR TITLE-ABS-KEY(bioeconomy biofuel) OR TITLE-ABS-KEY(circular economy electricity) OR TITLE-ABS-KEY(bioeconomy electricity)) AND (AFFILCITY(Bergamo) OR AFFILCITY(Brescia) OR AFFILCITY(Como) OR AFFILCITY (Cremona) OR AFFILCITY (Mantova) OR AFFILCITY (Milan) OR AFFILCITY (Monza) OR AFFILCITY(Lecco) OR AFFILCITY(Lodi) OR AFFILCITY(Pavia) OR AFFILCITY(Sondrio) OR AFFILCITY(Varese)) AND PUBYEAR > 2013 AND PUBYEAR < 2022
Biopolymers(TITLE-ABS-KEY(biopolymers) OR TITLE-ABS-KEY(bioplastics) OR TITLE-ABS-KEY(bio-based textiles)) AND (AFFILCITY(Bergamo) OR AFFILCITY(Brescia) OR AFFILCITY(Como) OR AFFILCITY (Cremona) OR AFFILCITY (Mantova) OR AFFILCITY (Milan) OR AFFILCITY (Monza) OR AFFILCITY(Lecco) OR AFFILCITY(Lodi) OR AFFILCITY(Pavia) OR AFFILCITY(Sondrio) OR AFFILCITY(Varese)) AND PUBYEAR > 2013 AND PUBYEAR < 2022
Wood(TITLE-ABS-KEY(wood circular economy) OR TITLE-ABS-KEY(wood bioeconomy) OR TITLE-ABS-KEY(bio-based wood) OR TITLE-ABS-KEY(paper circular economy) OR TITLE-ABS-KEY(paper bioeconomy) OR TITLE-ABS-KEY(bio-based paper)) AND (AFFILCITY(Bergamo) OR AFFILCITY(Brescia) OR AFFILCITY(Como) OR AFFILCITY (Cremona) OR AFFILCITY (Mantova) OR AFFILCITY (Milan) OR AFFILCITY (Monza) OR AFFILCITY(Lecco) OR AFFILCITY(Lodi) OR AFFILCITY(Pavia) OR AFFILCITY(Sondrio) OR AFFILCITY(Varese)) AND PUBYEAR > 2013 AND PUBYEAR < 2022
Table 3. R&D projects funded by the Lombardy Region through ROP ERDF 2014–2020 Axe 1 in bioeconomy.
YearCall for Proposal Titlen. Project
2015R&D line for MPMI (FRIM FESR 2020)7
2016R&D Line for Aggregations [25]15
2016Call for activation of an experimental program aimed at defining the agreements for research, development and innovation [26]11
2016Smart Fashion and Design [27]3
2017–2020Innodriver-S3 (multiple cut-off supporting R&D cooperation, patenting, boosting SMEs participation in Horizon2020)63
2019Call HUB Research and Innovation [28]9
Table 4. Screening criteria for Horizon 2020 funded projects identification.
Application DomainsField of Science
Industrial Technologies”, “Fundamental research”, “Climate Change and Environment”, “Energy”, “Food and Natural Resources”.“agricultural biotechnology”, “agricultural sciences”, “agriculture”, “agriculture, forestry, and fisheries”, “animal feed”, “bio-catalysis”, “biochemical engineering”, “biochemical research methods”, “biochemistry”, “bio-composites”, “bioeconomy”, “bioelectrochemistry”, “biofuels”, “biological sciences”, “biomass”, “biomaterials”, “biomolecules”, “bioplastics”, “bioprocessing technologies”, “bioreactor”, “bioremediation”, “biosensors”, “cell biology”, “environmental biotechnology”, “environmental sciences”, “enzymes”, “industrial biotechnology”, “marine biology”, “medical biotechnology”, “microbiology”, “molecular biology”, “natural resource management”, “natural sciences”, “pollution”, “proteins”, “recycling”, “renewable energy”, “sustainable agriculture”, “sustainable development”, “sustainable economy”, “sustainable transport”, “waste management”, “water management”.
Programme
Horizon 2020
Start date–End date
January 2014–December 2020
Organization country
Italy
Table 5. Codification of the verbal judgments on a nine-point intensity scale [35].
Intensity of importanceDefinitionExplanation
1Equal importanceTwo elements contribute equally to the objective
3Moderate importanceExperience and judgment slightly favour one element over another
5Strong ImportanceExperience and judgment strongly favour one element over another
7Very strong importanceOne element is favoured very strongly over another, and its dominance is demonstrated in practice
9Extreme importanceThe evidence favouring one element over another is of the highest possible order of affirmation
2,4,6,8 can be used to express intermediate values
Table 6. Example of an AHP matrix for participant number 1.
c1c2c3c4c5c6c7c8
c113137521
c21/31119531/3
c31111/23731
c41/31215421
c51/71/91/31/511/31/71/9
c61/51/51/71/4311/51/7
c71/21/31/31/27511
c813119711
Table 7. Performance matrix for MCDA.
TurnoverT_GrowthWorkersW_GrowthDepartmentsArticlesPatentsBudget
Agrofood1,259,727,570.0016.712509.0018.9713.0042.005.00133,009,053.40
Biochemicals5,307,528,261.0012.369183.0022.2912.0044.0010.00161,011,760.80
Biofuels34,648,292,071.00−11.7116,627.002.076.00133.005.0098,628,155.32
Biopolymers 10,166,206,195.002.5812,264.004.456.0062.0016.0093,376,062.67
Wood880,723,524.0022.422531.006.342.0094.0010.007,965,573.76
Table 8. Normalized performance matrix.
TurnoverT_GrowthWorkersW_GrowthDepartmentsArticlesPatentsBudget
Agrofood0.0112240.83269800.8358061000.817031
Biochemicals0.1310960.7052450.4727310.9090910.0219780.4545451
Biofuels10100.363636100.592387
Biopolymers 0.2749820.4186930.6909620.1177050.3636360.2197810.55807
Wood010.0015580.21117700.5714290.4545450
Publisher’s Note: MDPI stays neutral with regard to jurisdictional claims in published maps and institutional affiliations.

