1. Introduction
Global warming resulting from greenhouse gas emissions is a major global challenge that must be jointly addressed by human society in the 21st century. Since 2020, many countries have faced increasing pressure to reduce carbon emissions to achieve the goals that are set out in the Paris Agreement. China has committed to peak carbon dioxide emissions by 2030 and to achieving carbon neutrality in 2060 by developing a low-carbon economy. Meanwhile, developed countries in the European Union and North America are also promoting changes in energy consumption and low-carbon industries [
1,
2,
3]. There is a need for a joint effort by all of society to reduce carbon emissions. It is especially necessary for industry sectors to actively respond to environmental policies. As reducing carbon emissions is becoming increasingly difficult, enterprises are finding that greater costs are involved in reaching the reduction goals that are set by governments. Therefore, governments should introduce appropriate environmental policies to encourage carbon reductions in enterprises. As a practical application of Pigouvian taxes, carbon taxes have generally been considered by academia and governments as an effective policy instrument for reducing carbon emissions [
4,
5]. Currently, Ireland, Switzerland, Denmark, Finland, and Norway have imposed carbon taxes at different rates on carbon emissions or consumption, with remarkable results [
6,
7,
8]. Scholars have also discussed the potential policy effects of imposing a carbon tax in China, the United States, and South Africa, which are countries that have not imposed carbon taxes. It is widely accepted that carbon emission reductions that are induced by carbon taxes will improve the overall social welfare of these countries [
9,
10,
11,
12]. In addition, carbon taxes have a strong regulatory constraining effect, and more countries may consider adopting a carbon tax to stimulate carbon emission reductions [
13].
The pressure to produce carbon emission reductions and green innovation due to environmental regulations is the main driving force for addressing global warming [
14]. Relevant studies attached much importance to the pressure on carbon emission reductions due to carbon taxes [
15,
16]. However, as an effective form of environmental regulation, carbon taxes can lead enterprises to carry out green innovation by changing the cost‒benefit mechanism, as well as their competitive status in the market [
17]. The carbon taxes that were already implemented or studied in theoretical research were mainly based on the total carbon emissions during production or consumption. In our view, space for improvement exists in the form of carbon taxes that change the cost–benefit mechanism for an even stronger green-innovation-inducing effect. Based on extant carbon taxes, this study proposed a unit progressive carbon tax design to maximize the green-innovation-inducing effect of carbon taxes. The unit progressive carbon tax that was proposed in this study allows governments to determine the carbon tax rate according to the units of carbon emissions produced by an enterprise. Enterprises with higher carbon emissions units meet the criteria for a higher tax rate, while those with lower carbon emissions receive a lower tax rate. Through the unit progressive carbon tax design, the pressure for emission reductions transforms the motivation of green innovations for carbon emission units to accurately reflect the low-carbon technology (LCT) level of enterprises [
6]. When measured in terms of carbon emission units, the LCT of enterprises directly determines the carbon emission costs, strengthening the motivation to reduce costs and gain a competitive market advantage through green innovation. A progressive tax rate is a generally applied form of tax that has the advantage of adjusting the vertical tax burden, which can precisely stimulate the green innovation of enterprises with different LCT stocks [
18]. Thus, it is necessary to discuss the green-innovation-inducing effect of unit progressive carbon tax and its policy implications in academic research.
Based on the existing carbon tax, this study proposed a policy design with an explicit green innovation orientation to maximize the green-innovation-inducing effect of carbon taxes by directly linking the carbon emission costs of enterprises with their LCT level. To analyze this policy’s effect on green innovation, we introduced a dynamic evolutionary game model to describe the policy effect of a unit progressive carbon tax on changing the enterprises’ green innovation strategies. Using the equilibrium state of the model, this study applied MATLAB R2018b to create a numerical simulation to visually present the policy effects. In the numerical simulation, we analyzed the policy sensitivity of heterogeneous enterprises in LCT, as well as the progressive effect of carbon tax rates. Meanwhile, existing studies proposed that factors such as the cost of green innovation and the amount of carbon reduced will affect the green-innovation-inducing effect of environmental policies [
19,
20]. This study also analyzed the influence of the costs of green innovation and carbon emission reductions on the inducing effect of the unit progressive carbon tax and considered whether changing the carbon tax policy can effectively address the reduction in the green innovation of enterprises caused by these factors.
The remainder of this paper is arranged as follows:
Section 2 provides a review of the relevant literature and elaborates on the research context of this study.
Section 3 describes the dynamic evolutionary game model that was used to analyze the green innovation strategies of heterogeneous enterprises that develop LCT under the unit progressive carbon tax model and provides the result of the evolutionarily stable strategy (ESS).
Section 4 describes how MATLAB R2018b was used to simulate the green-innovation-inducing effect of the unit progressive carbon tax.
Section 5 presents the discussion and conclusion.
2. Literature Review
Carbon taxes were first proposed in 1990 as a specific environmental policy instrument to reduce the carbon emissions that are caused by fossil fuel consumption. However, the expected effect of the policy is controversial regarding managing global warming [
21,
22,
23,
24]. With the development of relevant research and the actual implementation of carbon taxes in some countries, the carbon emission reductions that were influenced by this policy have been widely approved. Subsequently, scholars gradually shifted their research focus from analyzing the effect of a carbon tax to optimizing the carbon tax design [
25,
26,
27]. This study emphasized maximizing the green-innovation-inducing effect of a carbon tax through a new carbon tax design. The related literature can be summarized according to the following three aspects: the traditional policy effects of a carbon tax, the green-innovation-inducing effect of a carbon tax, and optimizing the carbon tax design.
2.1. Traditional Policy Effect of Carbon Taxes
As an effective environmental regulation, a carbon tax aims to abate the carbon emissions of society by raising the carbon emission costs of enterprises [
28]. Carbon taxes were shown to effectively reduce carbon emissions in Norway, Ireland, Denmark, and Switzerland [
6,
7,
8,
29]. However, a carbon tax has not been imposed in more countries because of the negative effects on economic growth. Governments must occasionally choose whether to sacrifice economic growth to reduce carbon emissions through a carbon tax [
28,
30]. Additionally, the implementation of a carbon tax may cause an individual or regional tax inequity, which prohibits governments from using carbon tax as a common policy instrument [
8,
9,
31,
32]. However, some scholars pointed out that the benefits that are generated by a carbon tax outweigh the economic costs from the perspective of overall social welfare; thus, carbon taxes should be further promoted globally [
33,
34]. Governments can minimize the economic costs that are associated with carbon emission reductions and ameliorate the overall social welfare through the rational utilization of fiscal revenue from the carbon tax [
5,
10,
35].
The introduction of the perspective regarding overall social welfare meant that the economic cost was no longer an obstacle to the implementation of a carbon tax. Subsequently, researchers paid increasing attention to comprehensively assessing the policy effects of carbon taxes [
36,
37]. Carbon taxes can encourage the widespread use of renewable energy, especially when the fiscal revenue from a carbon tax is used to subsidize bioenergy [
38]. A carbon tax is regressive on different income distributions, which will distort the environmental benefits of the tax [
39]. Due to the uncertainty of climate change, a carbon tax policy could be a more effective environmental policy instrument than the carbon trading scheme [
40]. The carbon tax rate can significantly affect emission reductions, and governments must set a higher rate to further abate emissions at the national level. However, policymakers favor a moderate tax rate [
41].
Increasing numbers of scholars have suggested that governments should adopt a carbon tax to simultaneously achieve greater emission reductions and mitigate global warming. Many assessments suggested that optimizing the design of a carbon tax can improve the effect of reducing emissions and reduce the negative impact on economic growth [
42]. For instance, a dynamic carbon tax policy is more effective than a static policy [
43]. A carbon tax policy is expected to be adopted by more governments. Consequently, optimizing the carbon tax design, as well as the assessment of the policy effects, is the most important research direction in this field [
44]. Following these directions, this study highlighted the green-innovation-inducing effect of a carbon tax by using a unit progressive carbon tax that links the carbon tax to LCT in enterprises.
2.2. Green-Innovation-Inducing Effect of Carbon Tax
The emission-reducing effects of a carbon tax are primarily realized by restricting carbon emissions in production and consumption and by promoting green innovation [
45]. Since green innovation is essential in a low-carbon economy, the effect of inducing green innovation via a carbon tax, as a typical environmental policy instrument, has become an academic focus since the beginning of the 21st century [
46,
47]. Popp [
48] introduced green innovation as an endogenous variable in a model analysis and found that a carbon tax mainly stimulated the green innovation of enterprises via cost savings. Factors such as the learning-by-doing effect, the uncertainty of policies, and knowledge stock can also affect the green-innovation-inducing effect of a carbon tax by influencing the cost mechanism [
14,
15,
49,
50]. Acemoglu et al. [
51] established a dirty–clean analysis framework with endogenous innovation in an endogenous economic growth model and concluded that the government could encourage the green innovation of enterprises by imposing a carbon tax on dirty input and subsidizing clean research and development (R&D). Based on this classical framework, researchers found that a series of factors, including the fungibility of dirty and clean inputs, the diminishing returns of research input, and the path-dependence of innovation, may influence the green-innovation-inducing effect of a carbon tax [
52,
53,
54].
Because macro models cannot internalize green innovation into the decision making of enterprises or reflect the competitive market advantages of green innovation, some scholars used microeconomic models to analyze the green-innovation-inducing effect of a carbon tax. Stimulating the market demand for low-carbon products is an important precondition for the green-innovation-inducing effect of a carbon tax [
55,
56]. Game theory models provide a series of tools for studying the green-innovation-inducing effect of a carbon tax. In the game models, researchers found that factors such as consumer preference for green products, household consumption, inter-period uncertainty, and the costs of innovation could significantly affect the green-innovation-inducing effect of a carbon tax [
20,
57,
58,
59]. Additionally, the green-innovation-inducing effect of a carbon tax was shown through an empirical study. Based on the theoretical and empirical research, optimizing the design of the carbon tax and maximizing the green-innovation-inducing effect of the carbon tax were the main approaches that were taken in related studies [
19,
60]. While studying the impact of a unit progressive carbon tax on the green innovation of enterprises, we introduced a dynamic evolutionary game model and introduced the path dependence of innovation and competitive advantage in the market, as well as the costs of innovation and the amount of carbon reduced, into the analysis of policy effects. This enabled a detailed evaluation of the green-innovation-inducing effect of a unit progressive carbon tax.
2.3. Optimizing the Design of Carbon Taxes
Both minimizing the negative economic impacts of a carbon tax and maximizing the green-innovation-inducing effect of the carbon tax depend on continuous optimization of the carbon tax design. Several scholars have conducted studies in this field. Gerlagh et al. [
61] studied the optimal carbon tax in terms of policy intensity and determined that the policy intensity will gradually improve with the development of industries’ LCT. Wu et al. [
62] proposed a strategy wherein governments should encourage enterprises to substitute traditional energy with low-carbon energy by imposing a progressive tax. Chen and Hu [
43] proposed a policy portfolio that combined a dynamic carbon tax and a static subsidy to encourage enterprises to increase investments in green innovation. Zhou et al. [
63] proposed imposing an increasing block carbon tax to weaken the regressive nature of carbon taxes in terms of income distribution and maximize the effects of the carbon tax on emission reductions. Sun et al. [
64] suggested that governments could impose a carbon tax by applying different tax rates to different industrial sectors to achieve an equilibrium between carbon emission reductions and social welfare targets. These studies showed that a progressive carbon tax is drawing more attention regarding the optimization of carbon tax design. This study further linked the carbon tax with the LCT of enterprises, clearly emphasized the green-innovation-inducing effect of a carbon tax, and attempted to maximize the innovation-inducing effect through a progressive tax rate.
The traditional effects of a carbon tax policy, which primarily underline reducing the emissions of enterprises in response to the policy constraints, were theoretically and empirically verified. However, the potential negative economic effects of a carbon tax have prevented more governments from imposing such carbon taxes. After assessing the effects of a carbon tax from the perspective of overall social welfare, related studies have suggested that optimizing the design of a carbon tax could weaken or even eliminate the negative economic effects. Beyond the traditional policy effects of a carbon tax, the focus on the green-innovation-inducing effect of this study will be helpful for comprehensively understanding the benefits of a carbon tax to society’s welfare. Simultaneously, the carbon tax design, which emphasizes the units of carbon emissions and a progressive tax rate, differs from the existing studies in terms of optimizing the traditional carbon tax design, which still follows the idea of imposing a fixed carbon tax according to the total amount of carbon emissions. Finally, compared with studies that also discussed the innovation-inducing effect of a carbon tax, this study simultaneously included the competitive advantages that are obtained from green innovation and the green innovation path dependence into the game model, which were analyzed using macro- and microeconomic models, respectively. The findings regarding the marginal decreasing effects of an increasing tax rate and the policy effects of managing innovation costs or variation in the amount of carbon reduced may be useful for improving carbon tax policies.
3. Model
3.1. Assumptions and Variables
Following the hypothesis regarding the path dependence of green innovation, enterprises with different LCT stocks exhibit differences in their carbon emission unit levels and innovation abilities (see
Table 1).
Furthermore, in accordance with previous studies, the following assumptions were made in this study:
Assumption 1. Enterprise 1 (which has high LCT stocks) and enterprise 2 (which has low LCT stocks) are the two representative game participants. Both are from industries that emit large amounts of greenhouse gases or consume large amounts of fossil energy during production and whose green innovation is of great importance to the low-carbon economic transition. Each of them plays a complete information dynamic Stackelberg game in which green innovation brings market-leading advantages in accordance with the market advantage of innovation put forth by Acemoglu [65]. Based on the classical Stackelberg game model, is the market’s inverse demand function, is the basic market demand, is the price elasticity of , is the total production, is the production of enterprise 1, is the production of enterprise 2, and is the market price. Assumption 2. The strategies of enterprises 1 and 2 were set as follows: {green innovation; non-innovation}. Furthermore, is used to describe the probability of choosing the corresponding strategy, all of which are functions of time . In a dynamic evolution game model, enterprises 1 and 2 adjust their probability of selecting a concrete strategy according to the benefits and the strategies of their rivals until they attain an ESS.
Assumption 3. The cost of production is for enterprise 1 and for enterprise 2. Due to the heterogeneity in their LCT stocks, enterprise 1 has fewer units of carbon emissions than enterprise 2, i.e., . Green innovation will cause a unit reduction for enterprise 1 and for enterprise 2. R&D investment is for enterprise 1 and for enterprise 2, following the classical A–J assumption, where and are the coefficients of innovation costs [66]. The heterogeneity in LCT stocks shows that . Assumption 4. The two agents select a green innovation strategy under the unit progressive carbon tax that is implemented by the government. The unit progressive carbon tax determines the tax rate according to carbon emission units. The tax rate of enterprise 1 is and that of enterprise 2 is ; is lower than because .
The carbon dioxide or other greenhouse gases an enterprise emits during the production process is typically considered a negative externality. Imposing a unit progressive carbon tax attaches an additional cost to carbon emissions, which distorts the original cost–profit function. Green innovation may not only help enterprises to minimize carbon emission costs but also obtain a leading position over the competition. Theoretically, a progressive carbon tax rate can stimulate enterprises with different carbon emission unit levels toward innovation under the above assumptions.
3.2. Dynamic Evolution Game Model of the Unit Progressive Carbon Tax
This section presents the dynamic evolution model that was used to examine how the unit progressive carbon tax affects enterprises with different LCT stocks and green innovation strategies. When governments impose a unit progressive carbon tax on carbon emission units, green innovation will not only provide an enterprise with a leading position but will also minimize carbon emission costs. Thus, there are two additional factors that stimulate the game agent to select the innovation strategy. However, green innovation is not the best choice; the non-innovation strategy involves no R&D investment and no risk of failure. Rationally, the deciding principle should still be to maximize benefits. According to the previous assumptions, the different cost–profit situations for the potential strategy profiles of enterprises 1 and 2 were as follows.
Strategy Profile 1: Enterprise 1 carries out green innovation and enterprise 2 does not. Under such a profile, enterprise 1 acquires its leading advantage in the market through green innovation. By solving the Stackelberg dynamic game model, the equilibrium quantities and prices of enterprises 1 and 2 can be obtained according to the following equations (the solved example is listed in
Appendix A):
The carbon emissions of enterprise 1 after green innovation are
, the carbon tax to be paid is
, and the cost of green innovation is
. Enterprise 2 maintains its current carbon emissions, the carbon tax to be paid is
, and no cost of green innovation is recorded. In summary, the revenue equations of enterprises 1 and 2 are
Strategy Profile 2: Enterprise 2 carries out green innovation and enterprise 1 does not. With this profile, enterprise 2 acquires the leading advantage in the market through green innovation. By solving the Stackelberg dynamic game model, the equilibrium quantities and prices of enterprises 1 and 2 can be obtained using the following equations:
Enterprise 1 does not have to bear the R&D cost burden for green innovation and only pays the carbon tax
according to its carbon emissions. Enterprise 2 achieves carbon emission reductions of
through green innovation, and it incurs the R&D cost
and pays the carbon tax
. In summary, the revenue equations of enterprises 1 and 2 are
Strategy Profile 3: Both enterprises 1 and 2 carry out green innovation. With this profile, both enterprises directly compete in the market using green innovation, and neither has the leading advantage. By solving the Stackelberg game model, the equilibrium quantities and prices of enterprises 1 and 2 can be obtained using the following equations:
Through green innovation, enterprise 1 achieves a carbon emissions reduction of
, incurs the cost of green innovation
, and the carbon tax decreases to
Enterprise 2 also cuts its carbon emissions by
, the cost of innovation is
, and the carbon tax after reducing its emissions is
. In summary, the revenue equations of enterprises 1 and 2 are
Strategy Profile 4: Neither enterprise 1 nor enterprise 2 carry out green innovation. With this profile, they have neither superiority in green innovation nor the first advantage in market competition. By solving the Stackelberg game model, the equilibrium quantities and prices of enterprises 1 and 2 can be obtained using the following equations:
Without the R&D cost of green innovation, enterprise 1 only pays the carbon tax
according to its original carbon emissions, and no R&D costs or tax savings from reducing emissions are recorded. Similarly, enterprise 2 only pays the carbon tax
, without R&D costs or tax savings from its emission reductions. In summary, the revenue equations of enterprises 1 and 2 are
The payoff matrices of the game participants with different green innovation strategy profiles are shown in
Table 2.
3.3. Analytical Solution to the Dynamic Evolutionary Game Model
At time t, the probability of enterprise 1 (i.e., the participant with high LCT stocks) selecting the strategy of green innovation is x (0 ≤ x ≤ 1), and the probability of selecting non-innovation is 1 − x. At time t, the probability of enterprise 2 (i.e., the participant with low LCT stocks) selecting the strategy of green innovation is y (0 ≤ y ≤ 1), and the probability of selecting non-innovation is 1 − y. Under the unit progressive carbon tax, an increase in the probability of green innovation of an enterprise shows that the carbon tax can encourage investment into green innovation. Increases in the probability of green innovation of both enterprises 1 and 2 show that a carbon tax can effectively promote green innovation at a social level.
In the evolutionary game model of a unit progressive carbon tax, the green innovation strategies of enterprises 1 and 2 change over time. Assuming
x in period
t, the expected revenues of enterprise 1 when engaging and not engaging in green innovation in the period
t + 1, respectively, are calculated as follows:
Therefore, the expected revenue equation of enterprise 1 in period
t + 1 is
Assuming that the probability of green innovation of enterprise 2 (which has low LCT stocks) in period
t is
y, the expected revenues of enterprise 2 when engaging and not engaging in green innovation in period
t + 1 are, respectively,
Therefore, the expected revenue equation of enterprise 2 in period
t + 1 is
To simplify the calculation, we assumed that
. According to the calculation method of the replicated dynamic equation, we obtained the replicated dynamic equation of enterprise groups with high LCT stocks, which is
(the derived Equation (A7) is listed in
Appendix B).
Let . The equilibrium points of the replicated dynamic equation of enterprise 1 are .
Similarly, the replicated dynamic equation of enterprises with low LCT stocks is
(the derived Equation (A8) is listed in
Appendix B).
Let . The equilibrium points of the replicated dynamic equation of enterprise 2 are .
Equations (A7) and (A8) show that under the condition of a unit progressive carbon tax and assuming
, the Jacobian matrix of the dynamic game model of groups of enterprises with heterogeneous LCT stocks can be calculated, which is
(the derived Equation (A9) is listed in
Appendix B).
If, at the equilibrium point,
and
, we can obtain an ESS according to the work of Friedman [
67]. The
and
at the equilibrium points can be calculated using Equation (A9) to obtain
Table 3.
Table 3 illustrates that the {green innovation; green innovation} strategy profile was the only ESS in the dynamic evolution game model. The unit progressive carbon tax could significantly increase the innovation probability of all enterprises with different LCT stocks in a certain situation. The green-innovation-inducing effect of the policy and the influence of heterogeneity were demonstrated in the numerical simulation.
4. Numerical Simulation
MATLAB R2018b was used to perform numerical simulations according to the dynamic evolutionary game model equilibrium. It analyzed whether a unit progressive carbon tax imposed by governments could increase the innovation probability of both enterprises 1 and 2. Simultaneously, our study focused on how the LCT stocks influenced the evolutionary paths of enterprises under the same environmental policy. Furthermore, it considered how the LCT innovation cost and amount of carbon reduction interacted with the green-innovation-inducing effect of the unit progressive carbon tax.
Due to the advantages of its LCT stocks, this study assumed that enterprise 1 had lower initial carbon emissions, a lower innovation cost coefficient, and a greater carbon reduction than enterprise 2. Therefore, the carbon tax rate imposed on enterprise 1 was lower than that imposed on enterprise 2.
Table 4 shows the specific numerical values. The parameter values of the market demand function were consistent with the previous study, where
[
63,
68]. In this section, we analyzed the evolutionary paths of enterprises under the unit progressive carbon tax.
4.1. Analysis of the Policy Efficiency
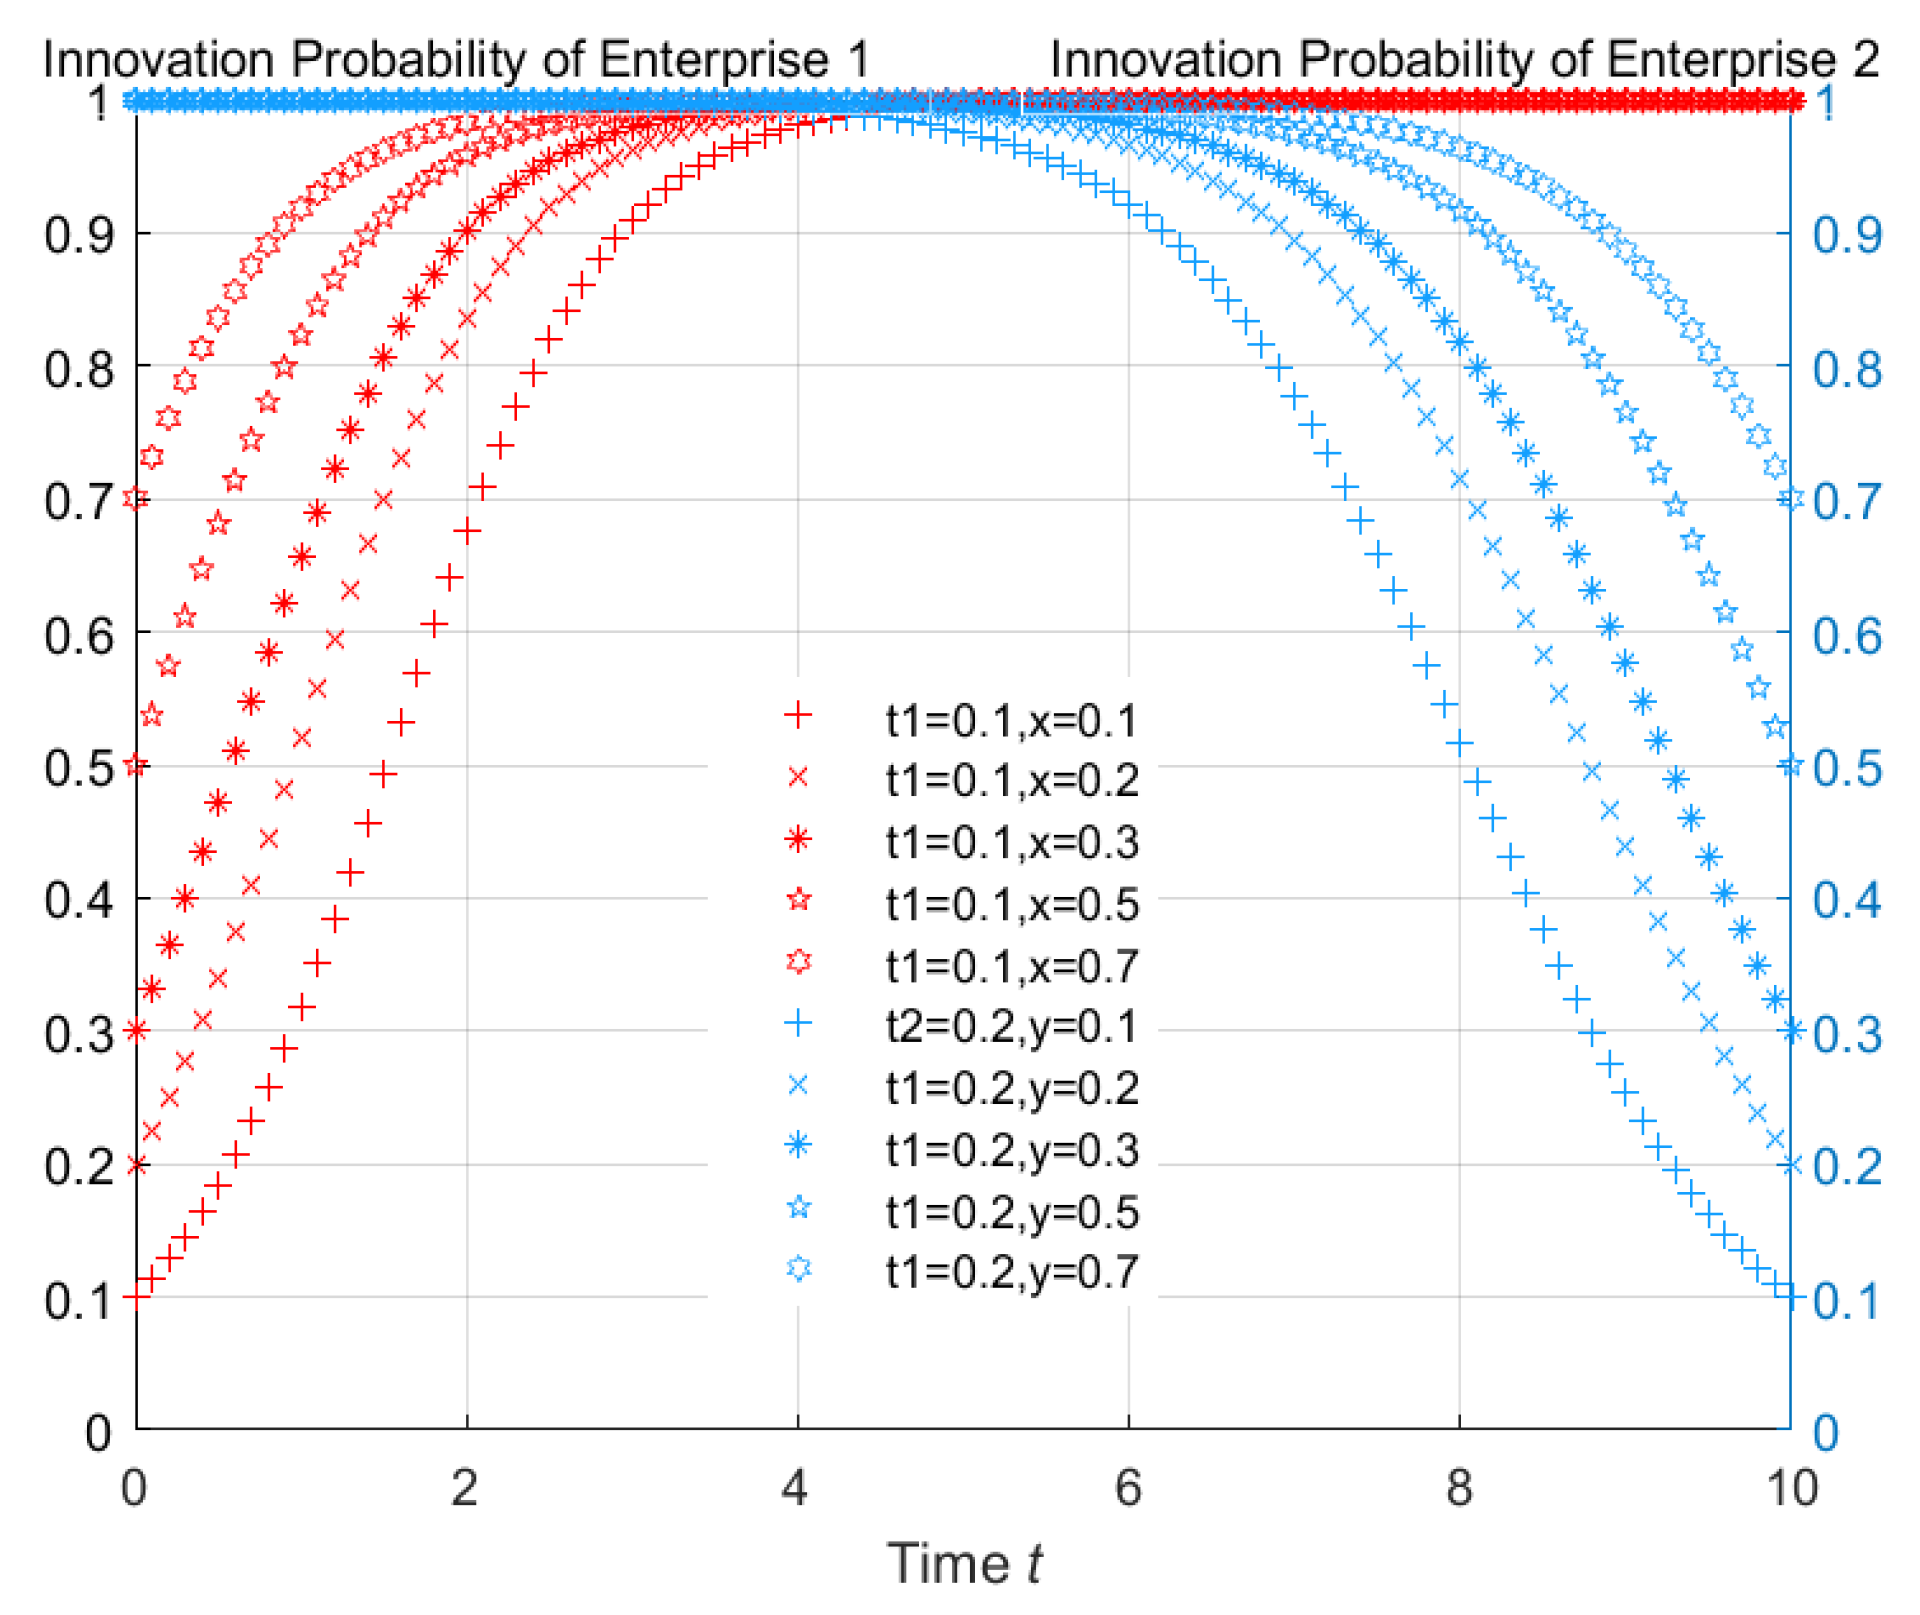
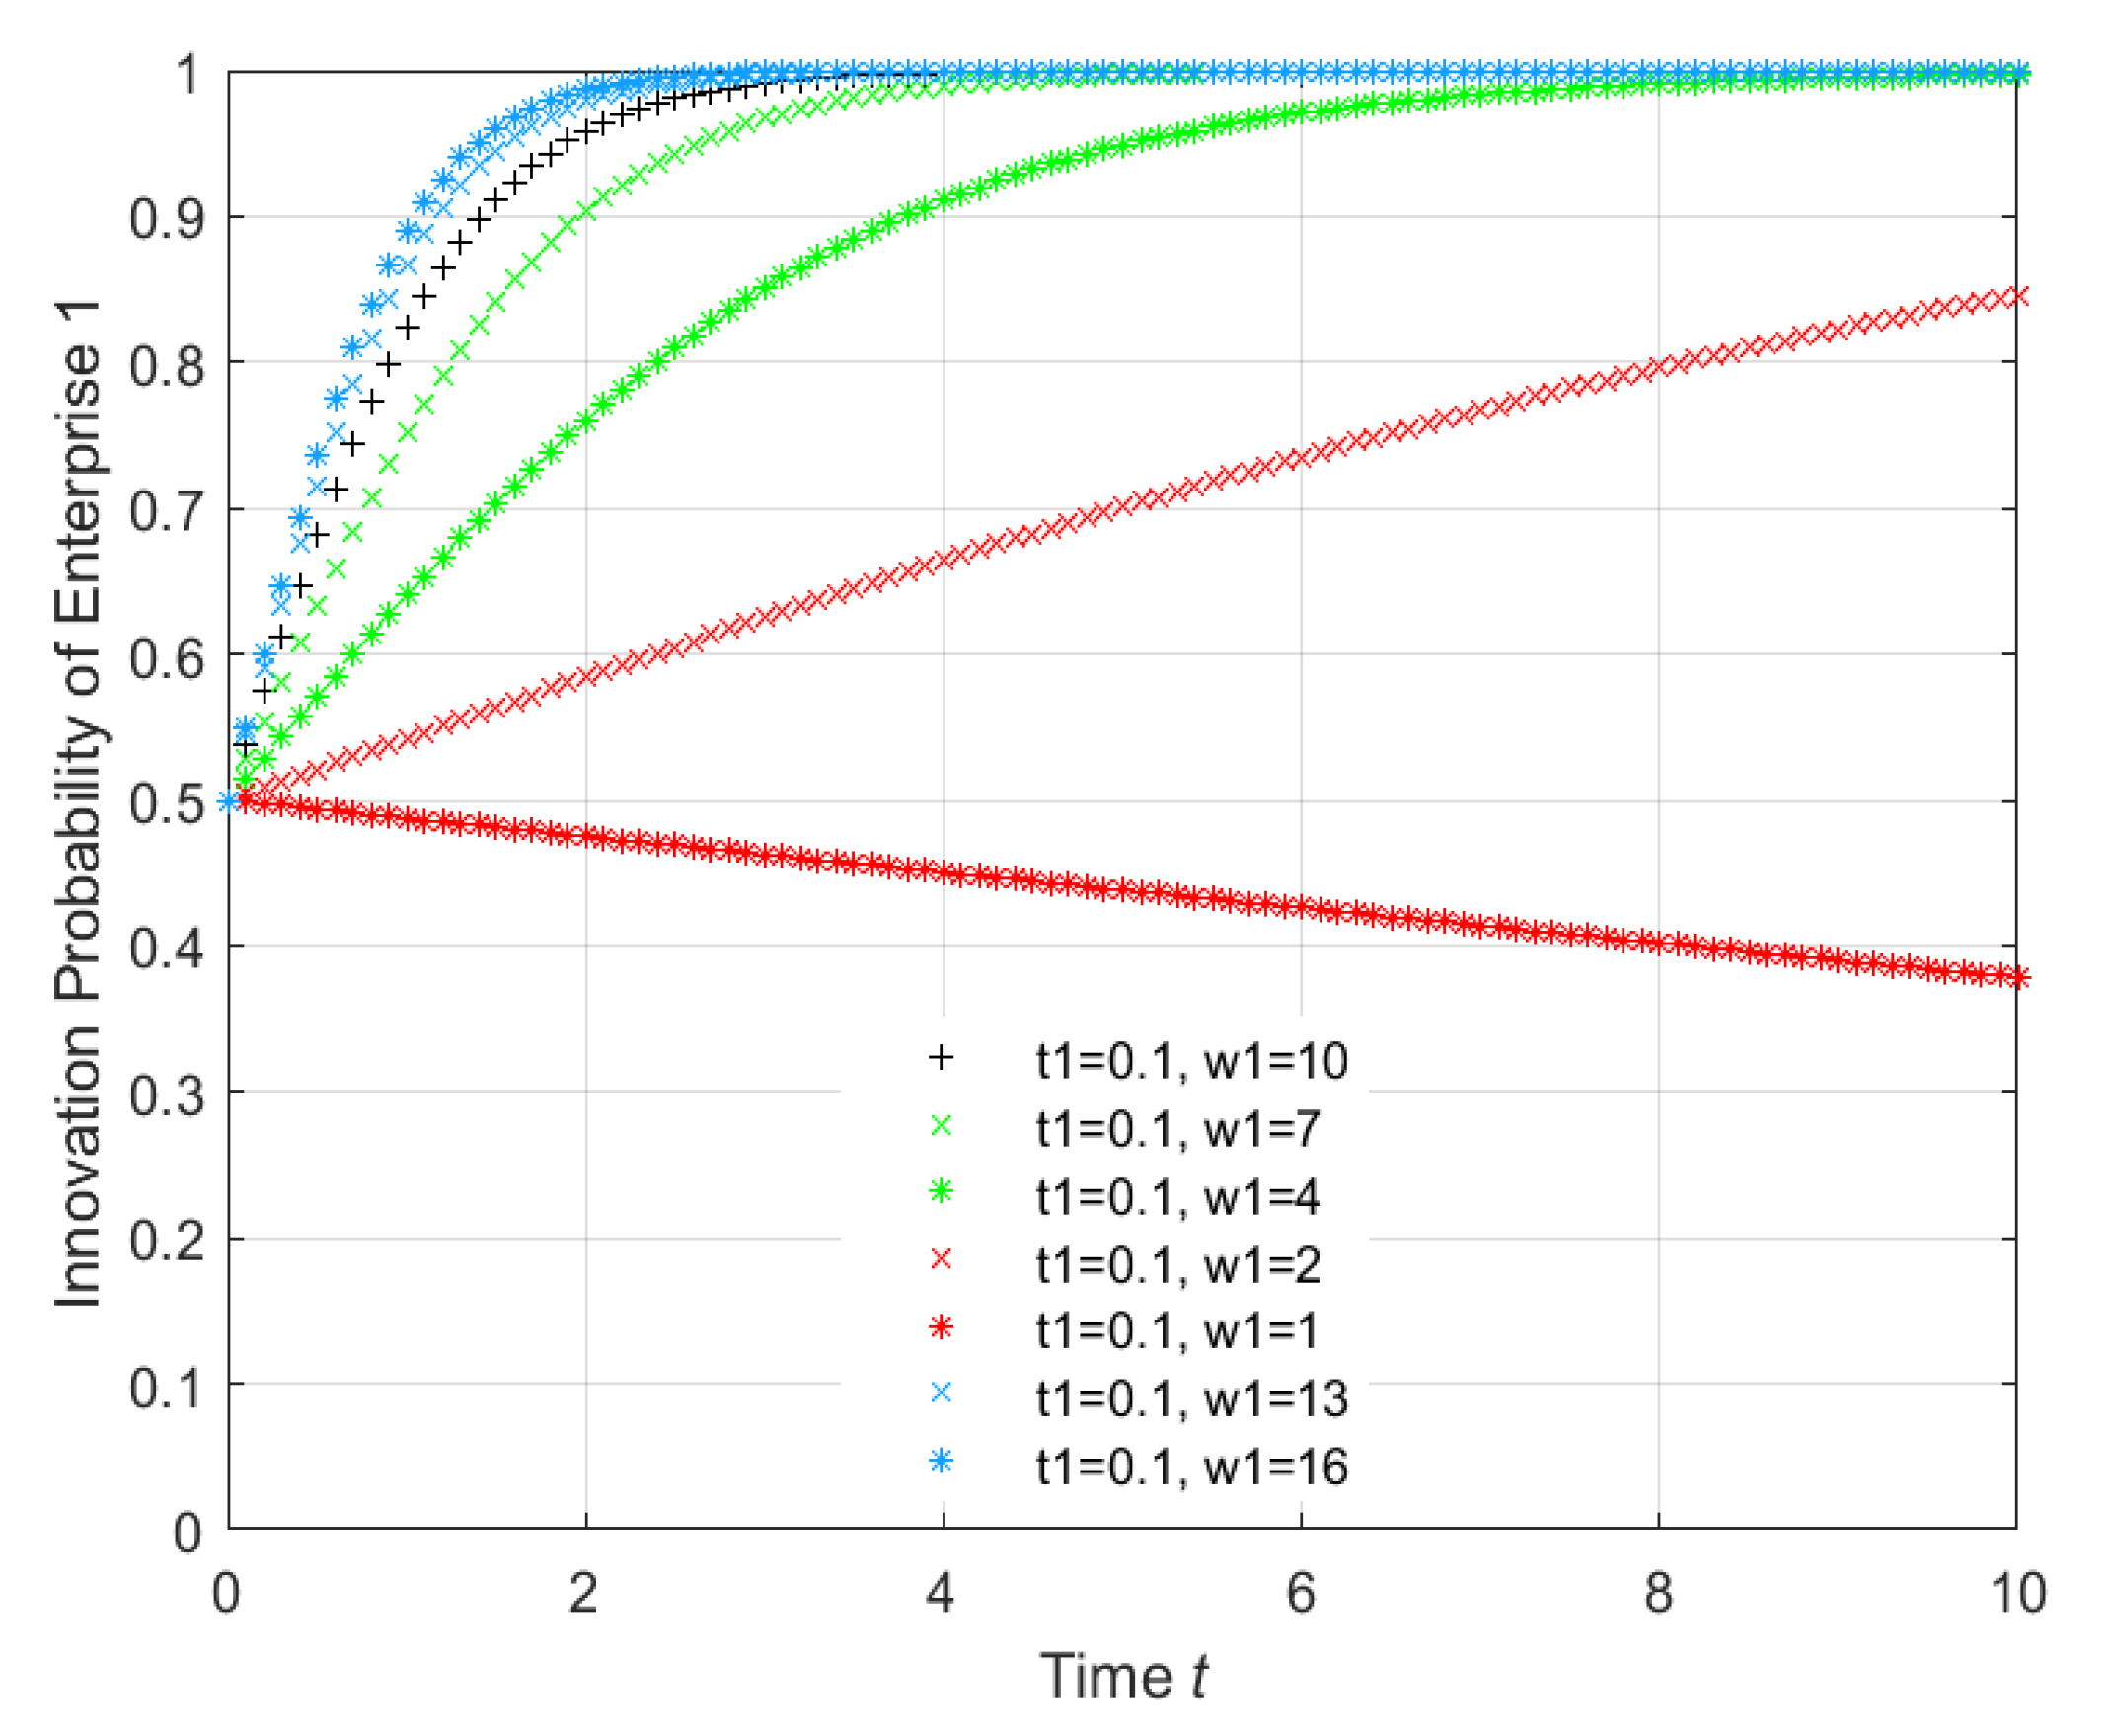
Figure 1 shows that if a government imposed a unit progressive carbon tax on enterprises 1 and 2 according to the units of carbon emissions, the innovation probability of enterprises 1 and 2 will converge to 1, whether the initial innovation probability was low (x, y < 0.5) or high (x, y > 0.5). An improved policy effect was achieved for a higher innovation probability, which meant that the convergence was more rapid, and the convergence time was shorter. The unit progressive carbon tax could significantly improve the green innovation level by making the innovation probability of both enterprises converge to 1 according to the ESS of the dynamic evolutionary game model. At the same time, the evolutionary path of enterprise 1 converged to 1 at a more rapid speed than that of enterprise 2, even if the carbon tax rate of enterprise 1 was lower than that of enterprise 2. Enterprise 1, with its high LCT stocks, was more sensitive to the unit progressive carbon tax than enterprise 2, which had low LCT stocks. The carbon tax added the carbon emission costs to the enterprises, and enterprise 1 could save more carbon tax expenditure than enterprise 2 in terms of the higher carbon reductions associated with their high LCT stock advantage. Thus, enterprise 1 had a much stronger motivation to carry out green innovation than enterprise 2 under the unit progressive carbon tax. Additionally, the unit progressive carbon tax could create fiscal revenue for governments, which could be used to subsidize green innovation.
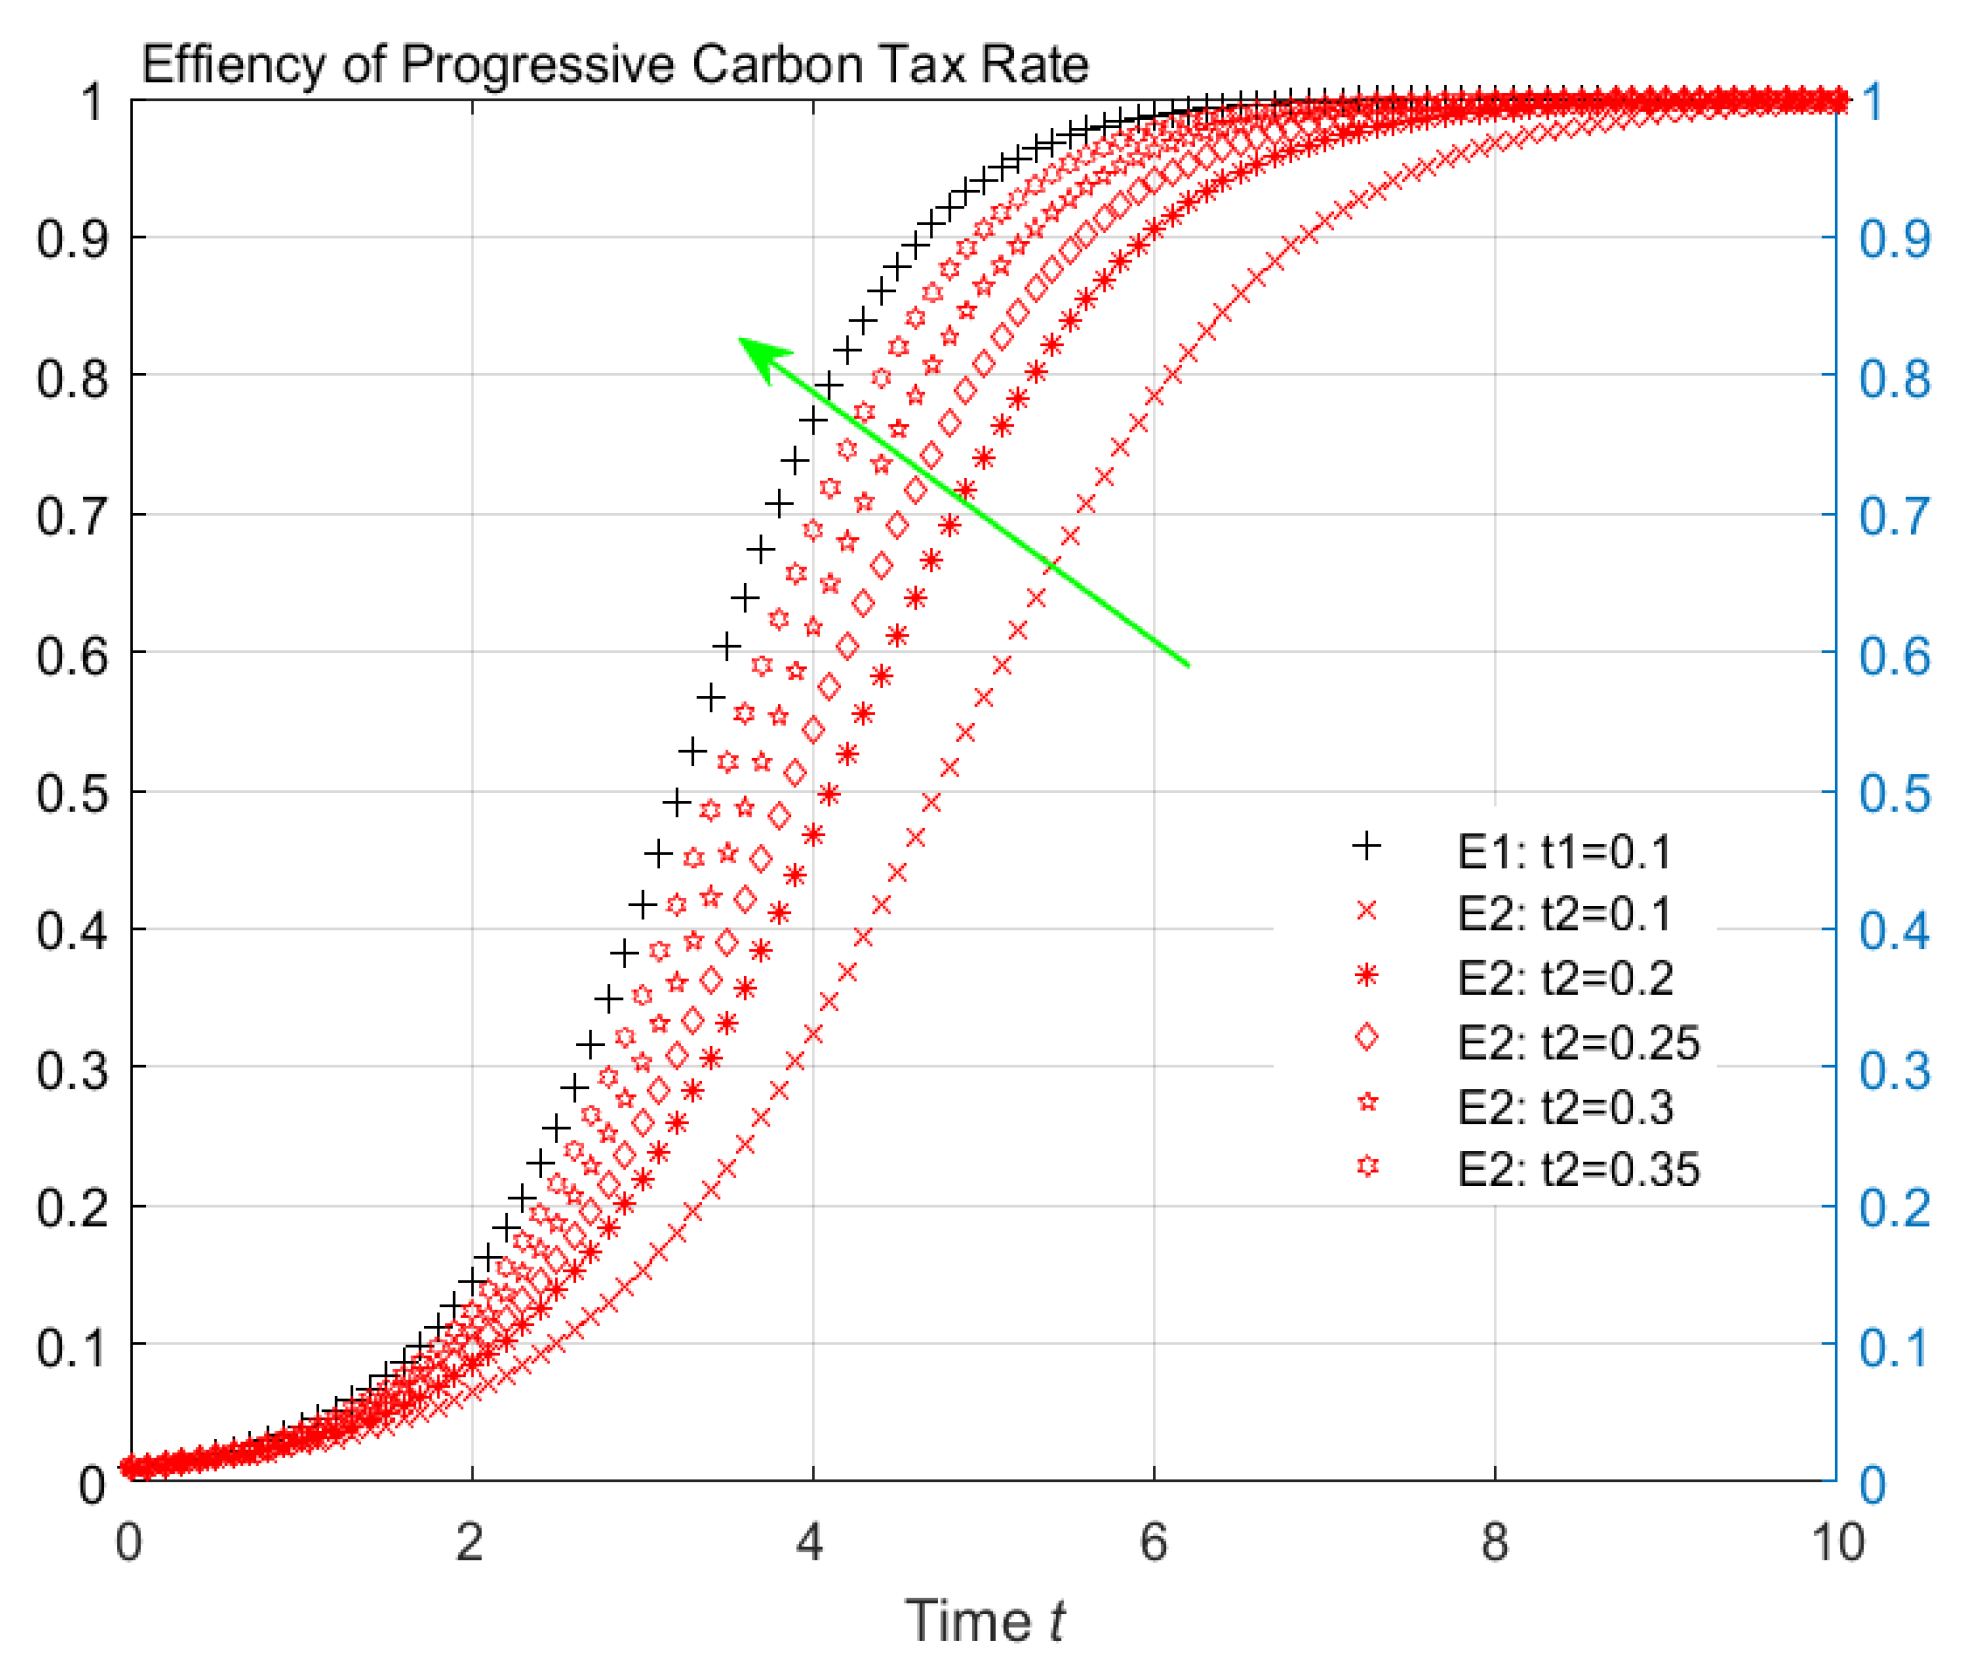
Figure 2 compares the efficiency of the fixed and progressive carbon tax rates. First, under the condition that the carbon tax rate for enterprise 1 (E1) and enterprise 2 (E2) was 0.1, the speed of enterprise 2’s convergence to 1 was much slower than that of enterprise 1. When the tax rate for enterprise 2 increased to 0.2, 0.25, 0.3, and 0.35, the speed of convergence was approximately equal to that of enterprise 1. Thus, the progressive carbon tax rate based on units of carbon emissions was more efficient than the fixed tax rate, especially for stimulating enterprises with low amounts of LCT stocks to innovate with. Finally, as depicted by the green arrow, the policy effect of the unit progressive carbon tax had a significant marginal decreasing tendency toward the tax rate, which meant that the acceleration of the convergence speed that was caused by increasing the tax rate was smaller than the amplitude of the increase in the tax rate itself. Therefore, policymakers should not increase the magnitude of the progressive rate all the time.
4.2. Influence of the Innovation Cost Coefficient on the Green-Innovation-Inducing Effect
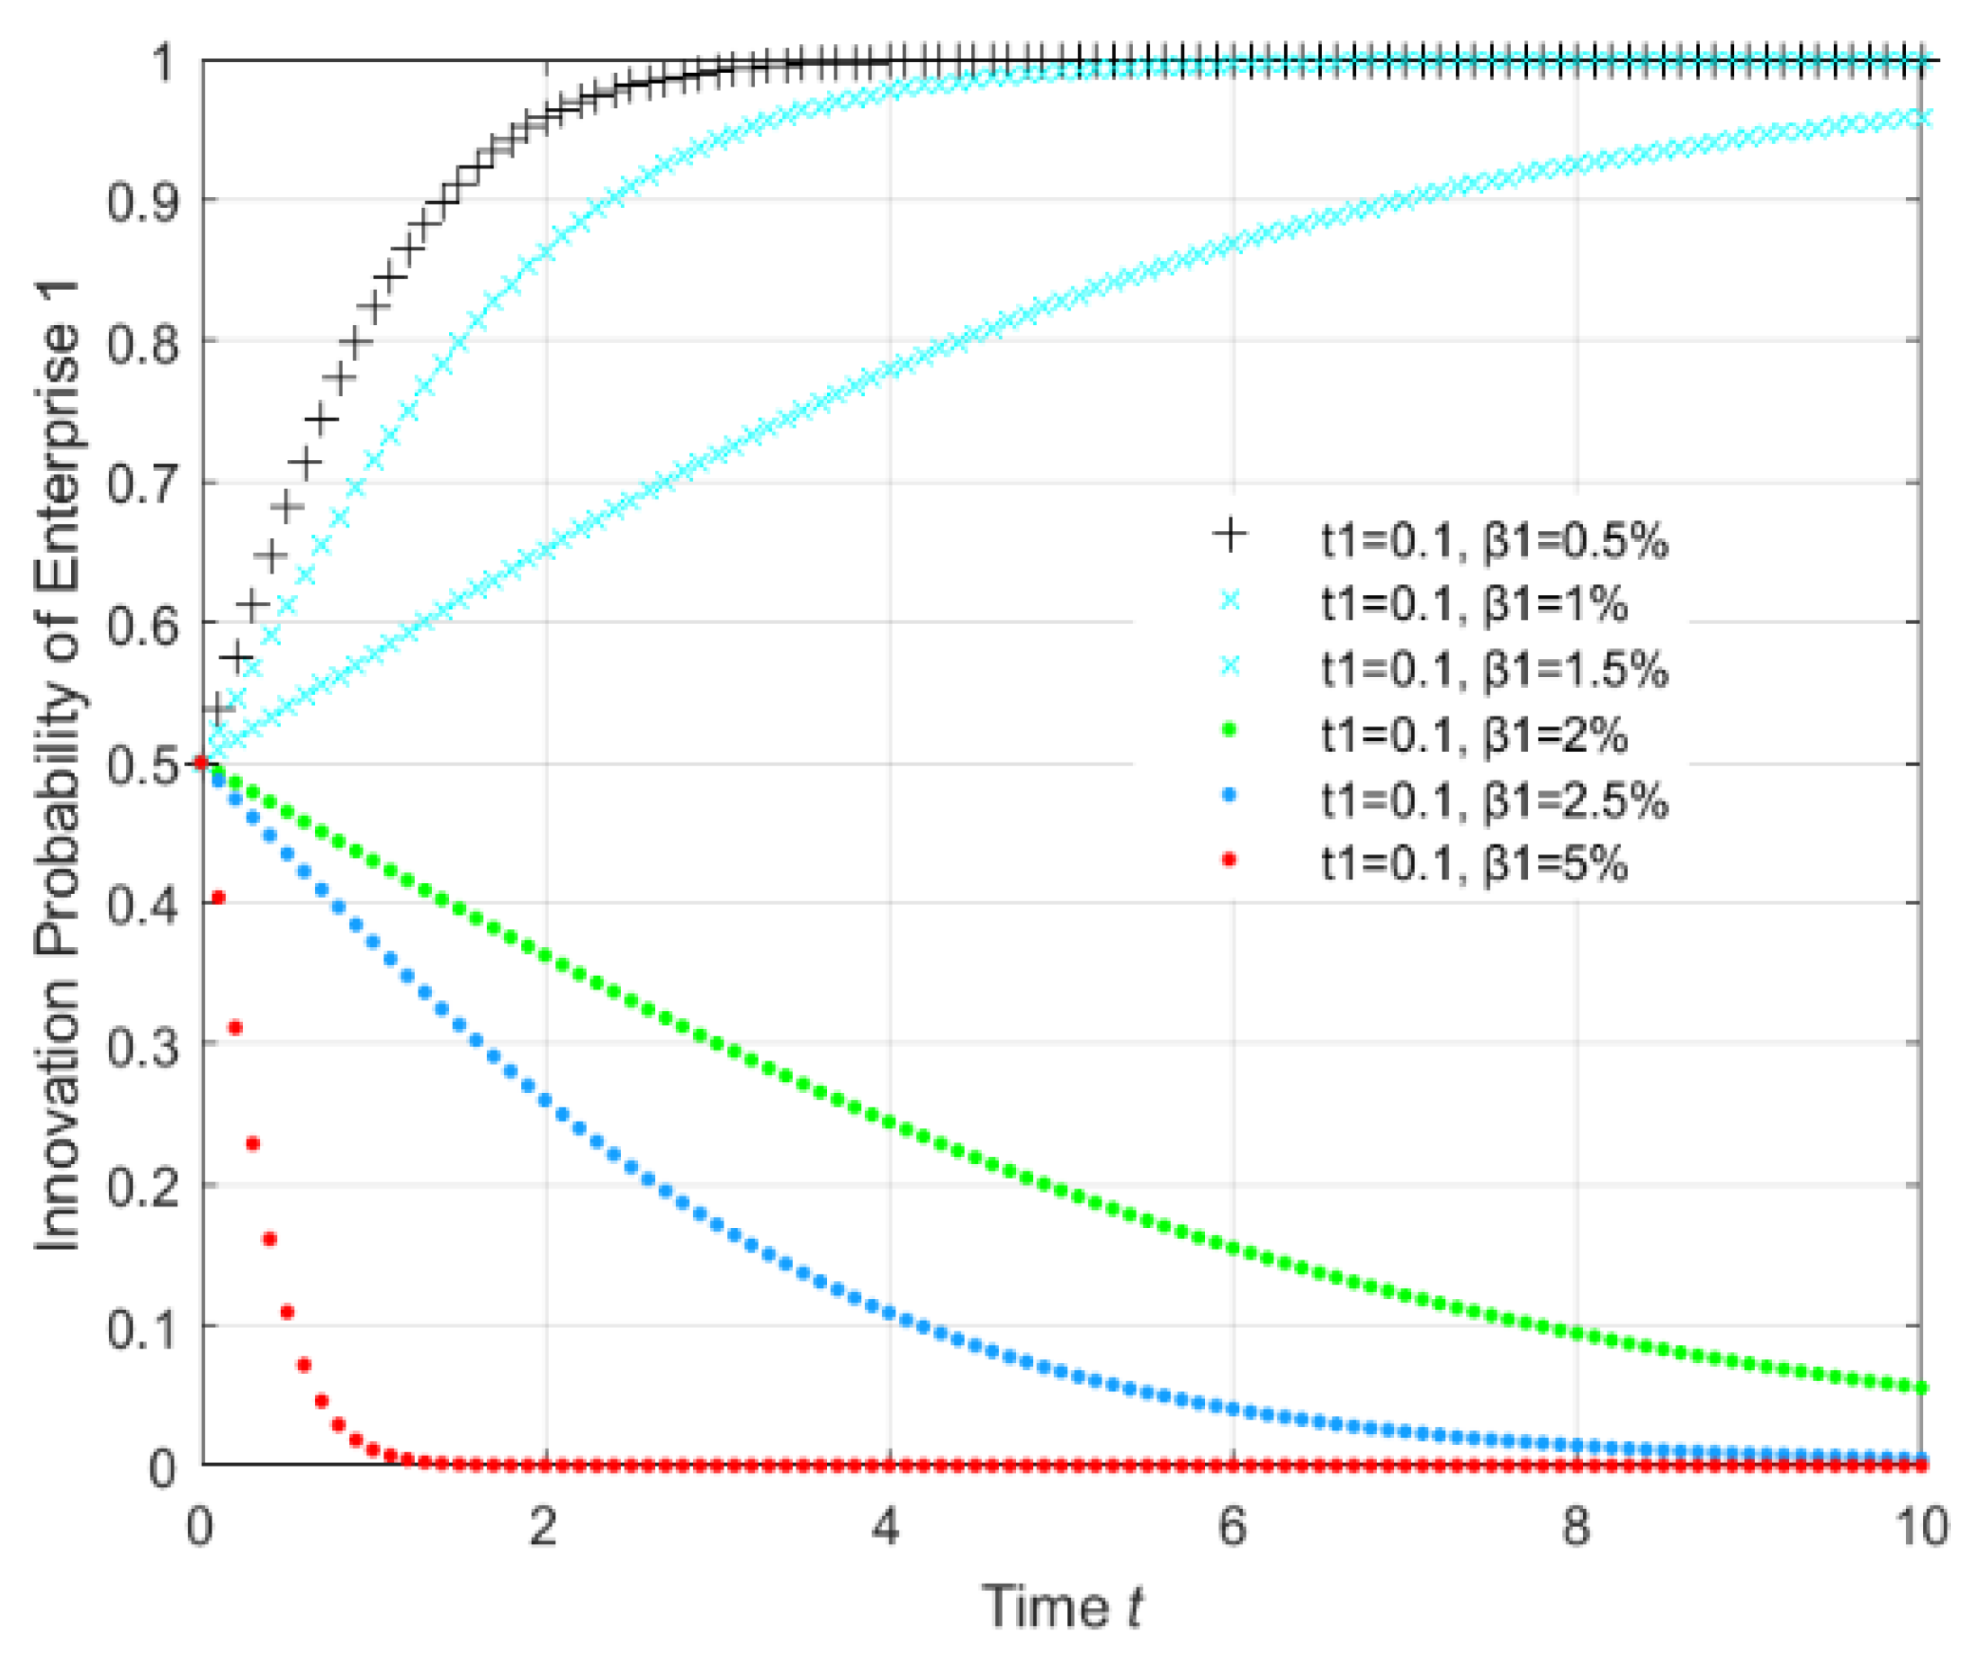
The cost of green innovation is the most important factor when enterprises make green innovation decisions. In this section, we examined how the innovation cost coefficient affected the innovation probability of an enterprise and the innovation-inducing effect of the unit progressive carbon tax. Initially, we focused on the situation in which a government imposed a unit progressive carbon tax. As enterprise 1 was more sensitive to the unit progressive carbon tax, it was taken as an example for analysis based on the premise that it is a risk-rational enterprise (x = 0.5). In
Figure 3, the innovation cost coefficient
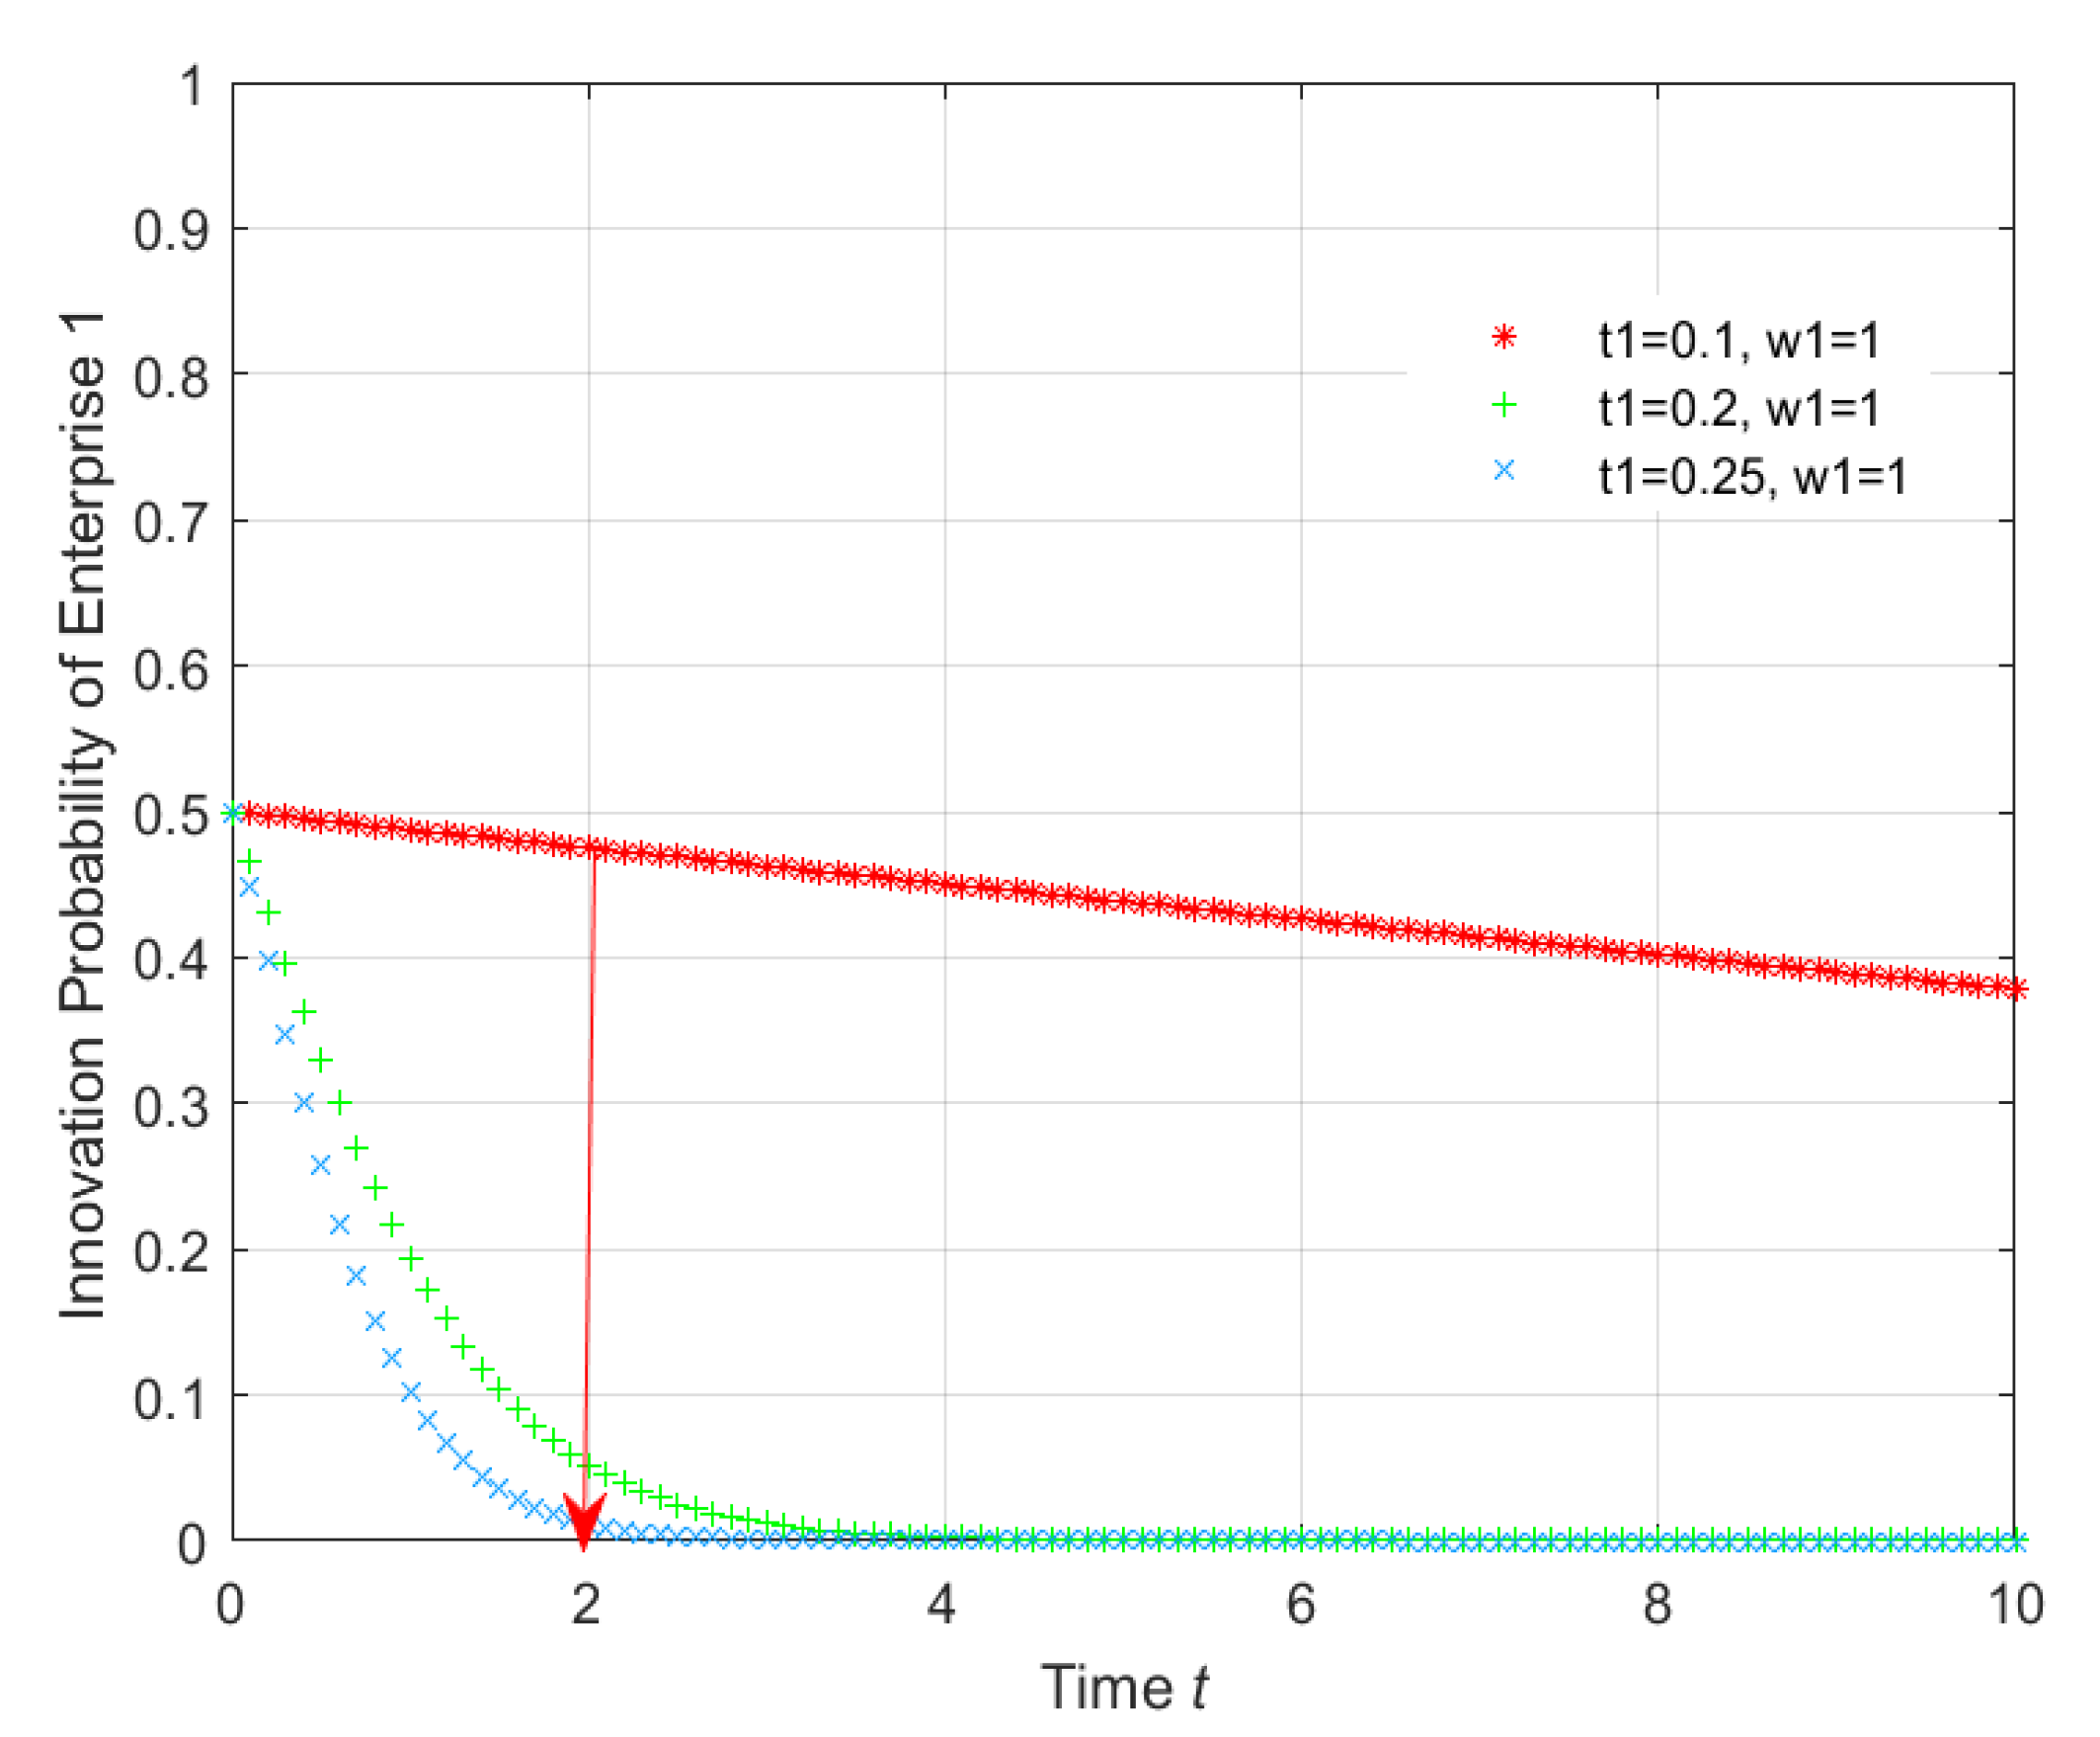
increased from the initial level to 5%, the evolutionary path of enterprise 1 converged to 1 at an increasingly slow speed in the first stage, and then the evolutionary path finally went in the opposite direction and converged to 0. This illustrated that the green-innovation-inducing effect of the unit progressive carbon tax was negatively affected by increasing innovation costs. Furthermore, the innovation-inducing effect was invalid when the innovation cost coefficient was above a certain level.
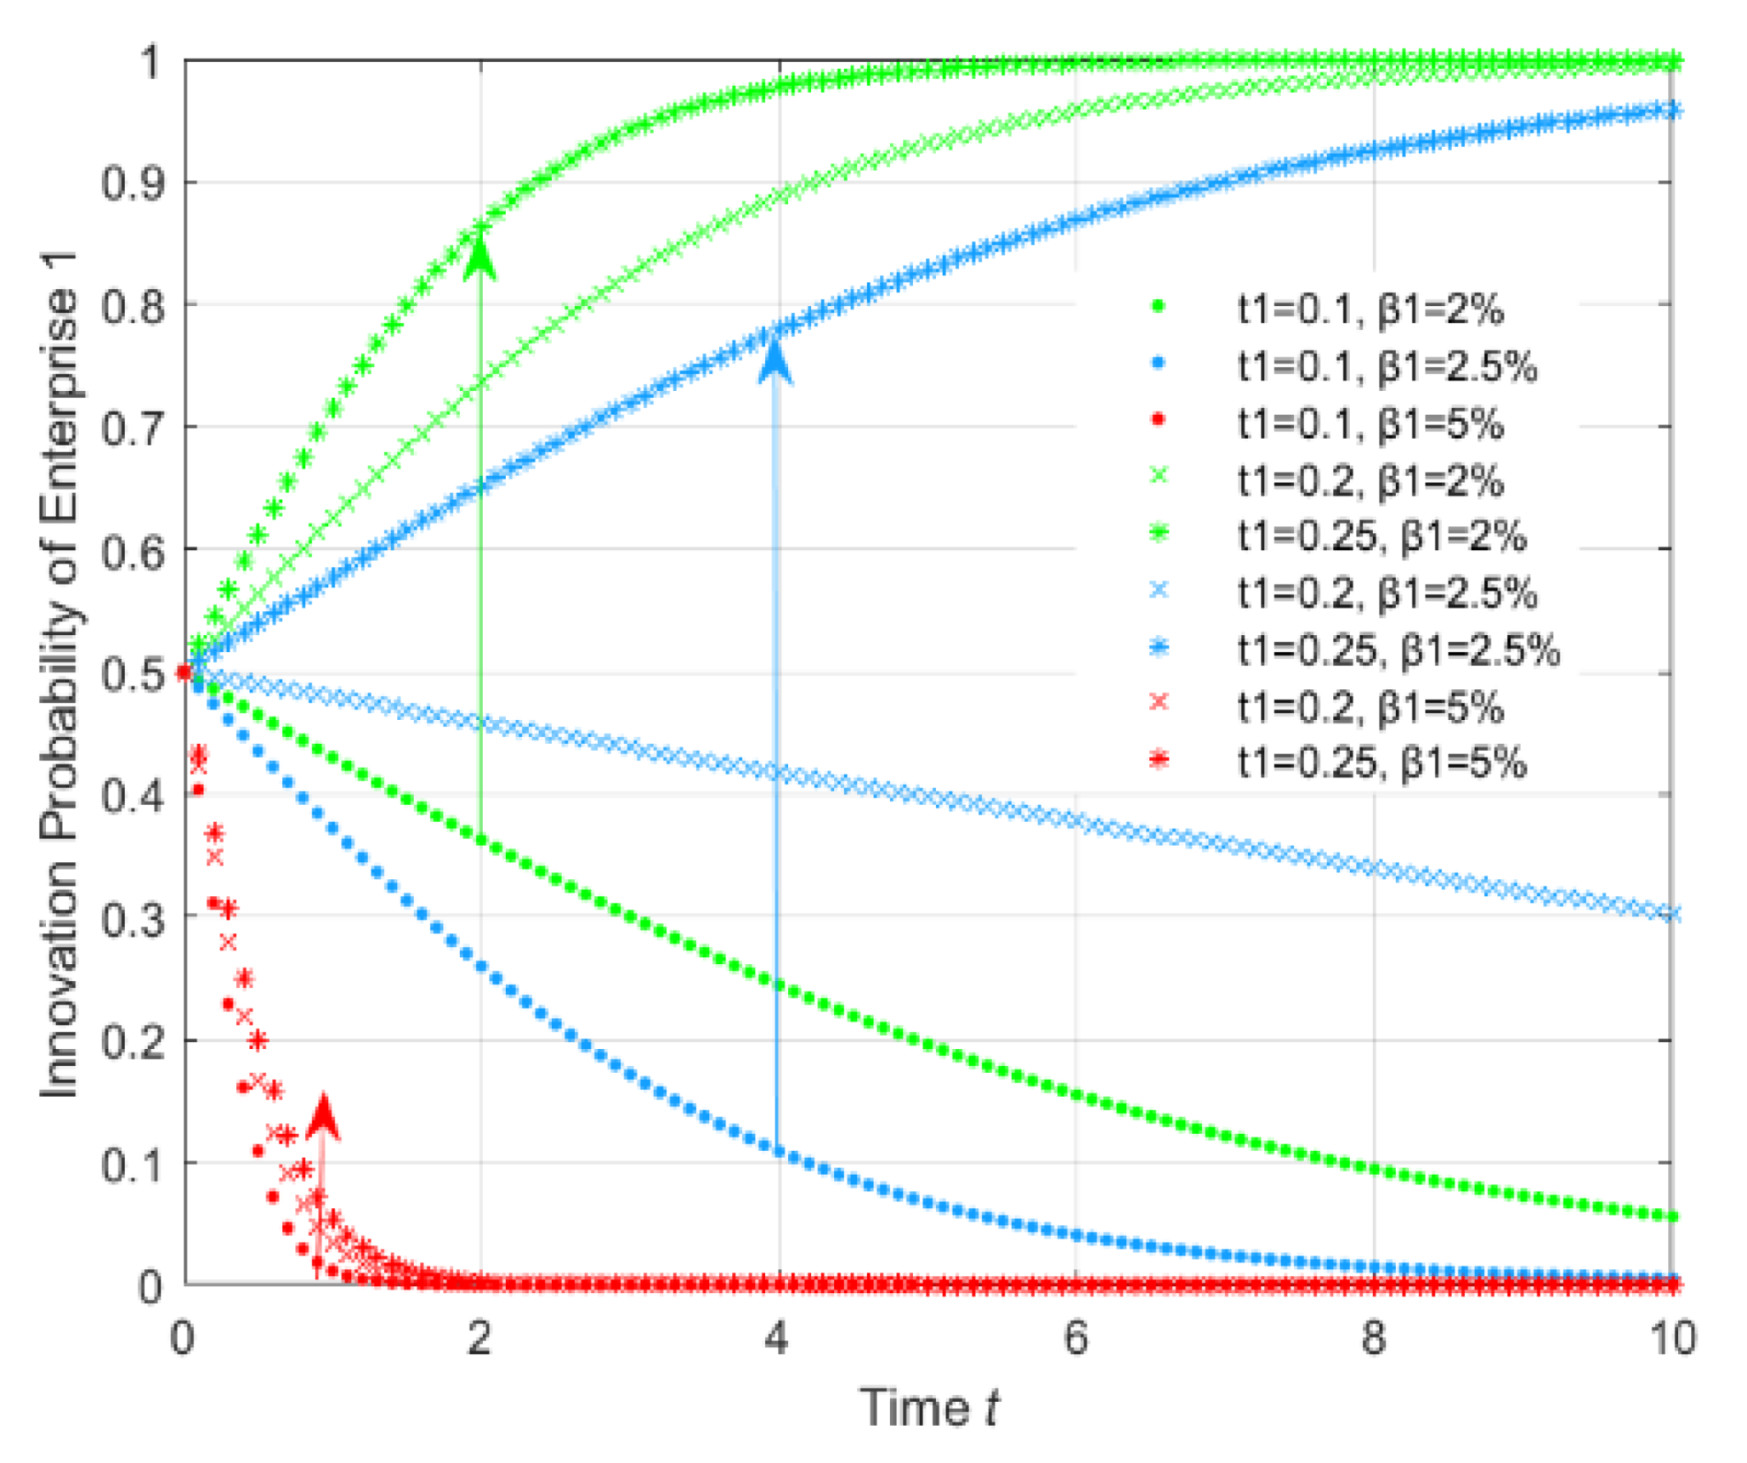
Figure 4 shows whether increasing the tax rate helped with managing high innovation cost coefficients. When
was equal to 2, 2.5, or 5%, the final innovation probability of enterprise 1 was lower than the initial level (x = 0.5). If the government increased the tax rate from 0.1 to 0.25%, the innovation probabilities of
and
will converge to a higher level or even to 1. However, in an extremely bad situation in which
, increasing the tax rate was an almost ineffective measure. Thus, the innovation cost coefficient had a negative influence on the policy effect, which could be managed by increasing the tax rate in a general situation. However, in an extremely bad situation, the carbon tax policy was invalid, which meant that the government should consider introducing other environmental policy instruments. This finding can assist with understanding why green transition in some industries is so slow and why other policy instruments, such as innovation subsidies, are necessary for these industries.
4.3. Influence of the Carbon Reduction on the Green-Innovation-Inducing Effect
In this section, we give the results of the influence of the amount of carbon that was reduced, which could affect the innovation costs and carbon reduction revenue. As shown in
Figure 5, after the simulated government imposed a unit progressive carbon tax based on units of carbon emissions, the amount of carbon reduced increased from 10 to 16, and there was limited improvement in the evolutionary path. However, when the amount of carbon reduced decreased from 10 to 1, the evolutionary path of enterprise 1 deteriorated to a lower level and even went in the opposite direction. When the amount of carbon reduction was high, the increase in the reduction amount had a minimal positive influence on the green innovation choices of enterprises. However, a decrease in the amount of carbon reduction had a significantly negative influence on the green innovation evolutionary path of the enterprise, and the innovation probability went in the opposite direction. Therefore, the difficulty of reducing carbon was also a key factor in the green innovation decisions of enterprises from different industries.
Figure 6 shows that increasing the carbon tax rate was an effective measure when the carbon reductions were at an extremely low level (
). This result demonstrated that increasing the carbon tax rate continued to deteriorate the green innovation probability of enterprises to zero if
. Thus, a progressive carbon tax was useless when carbon reduction was at an extremely low level. When the amount of carbon reduction was extremely low, green innovation could not help enterprises to obtain the advantage of saving carbon emission costs. Increasing the tax rate put a greater carbon emissions burden on the enterprise, resulting in the enterprise sacrificing green innovation to save on R&D investment. These insights can assist in understanding why some traditional industries that experience extreme difficulty in reducing carbon emissions do not engage in a green transition.
5. Discussion and Conclusions
Based on the idea of amplifying the effect of a carbon tax by optimizing the policy design, this study proposed a unit progressive carbon tax with a clear green innovative orientation. Unlike the existing carbon tax, which imposes a fixed total amount of carbon tax, the unit progressive carbon tax determines the tax rate according to the units of carbon that are emitted by enterprises. Furthermore, the results of the dynamic game model and numerical simulation demonstrated that a unit progressive carbon tax could stimulate the green innovation of enterprises with heterogeneous LCT stocks, even if the innovation probability of enterprises was initially extremely low. Moreover, the green innovation evolution path of an enterprise with low LCT stocks was close to the green innovation evolution path of the enterprise with high LCT stocks under the unit progressive carbon tax.
The result of the dynamic evolutionary game model of a unit progressive carbon tax showed that {green innovation, green innovation} was the only ESS and that the unit progressive carbon tax could promote the green innovation of enterprises with heterogeneous LCT stocks. The results of the model analysis confirmed the effectiveness of green innovation induced by a unit progressive carbon tax in accordance with the Porter hypothesis. The unit progressive carbon tax, which determines the tax rate based on units of carbon emissions, could effectively stimulate the green innovation of enterprises from industries with high carbon emissions. Currently, China is on the way to peak carbon dioxide emissions and achieving carbon neutrality, while the European Union and the United States are actively exploring industrial upgrades and a transition of energy consumption. Imposing the unit progressive carbon tax on some industries should be considered by these governments. Therefore, the unit progressive carbon tax can encourage the low-carbon economic transition in these countries by stimulating green innovation, which may be the key step to fulfilling this promise of the Paris Agreement.
The numerical simulation that was performed using MATLAB R2018b showed that, regardless of the level of original willingness for green innovation, enterprises with heterogeneous LCT stocks always converged to green innovation strategies under the unit progressive carbon tax. A stronger original willingness of green innovation and a higher speed of convergence could be observed. Enterprises with advantages in LCT stocks tended to be more sensitive to the unit progressive carbon tax because such enterprises could save more carbon tax costs through green innovation. Governments should pay more attention to the differences in the policy sensitivity of enterprises with heterogeneous LCT stocks in practice. Additionally, governments can also encourage enterprises with advantages in green innovation to adopt the leading role through a differentiated carbon tax to boost the transformation in some industries. Compared with a fixed carbon tax, the progressive tax rate was more effective in ameliorating the evolutionary path of green innovation of enterprises with low LCT stocks. Governments should take progressive tax rates into account more frequently when imposing a carbon tax. However, the improvement effect of increasing the tax rate was marginally diminishing. Therefore, governments should rationally determine the degree of the progression in practice instead of always raising the tax rate.
Under the framework of a unit progressive carbon tax policy, the evolutionary paths of the green innovation of enterprises continuously deteriorated with an increase in the cost coefficient of green innovation. Consequently, the situation was finally reversed, and enterprises completely abandoned green innovation. When the cost was extremely high, increasing the carbon tax rate was an invalid policy option. Consistent with previous studies, the coefficient of green innovation cost remained an important factor that influenced the green innovation of enterprises, even under the policy of a unit progressive carbon tax. Governments should consider the cost coefficient of the green innovation of enterprises in different sectors when assessing the effectiveness of a carbon tax. For sectors with higher cost coefficients, the government can ameliorate their paths of green innovation by raising the tax rate. For sectors with extremely high cost coefficients, the carbon tax policy will be invalid. Under such situations, the introduction of other policy instruments will be necessary.
With a decline in the amount of carbon reductions, the green innovation evolutionary path deteriorated, indicating that both the speed and time were negatively affected to a certain extent. Owing to the advantage of carbon tax cost savings, there was no reversal of green innovation choice. When imposing the unit progressive carbon tax, governments must realize that the difficulties of reducing carbon emissions differ across various sectors. The unit progressive carbon tax is more appropriate for sectors with significant effects. For the sectors with poor effects, a single carbon tax policy is not an appropriate choice because the carbon tax can only impose a higher cost that neutralizes the advantage in market competition and the carbon emission cost savings brought about by green innovation. Ultimately, enterprises will sacrifice green innovation to save on R&D investments.
Future research should discuss the interaction effect between the unit progressive carbon tax and green innovation subsidies for stimulating green innovation. The green innovation subsidy is the policy that is most frequently implemented by governments to encourage green innovation. The unit progressive carbon tax and green innovation subsidy may not only achieve an overlapping policy effect but are also suitable for different situations. In addition, the unit progressive carbon tax could be introduced into the computable general equilibrium model to analyze the positive influence of the unit progressive carbon tax on economic growth and social welfare through green innovation. Here, the influence of a carbon tax on economic growth and social welfare are the most important topics that are considered by scholars and policymakers.


