Abstract
Pork is one of the proteins of greatest demand worldwide. This study has evaluated the environmental sustainability of pig production by applying the life cycle assessment methodological framework. The system boundaries include feed production, pig production, slaughtering, and slaughterhouse by-product management. Within this context, three scenarios have been proposed: the first related to the management of slaughter by-products in an open dump, the second contemplates a model for using these by-products in a rendering plant, and a third where the environmental burden of slaughterhouse co-products is portioned according to economic allocation. The primary data collected correspond to the period of 2019 for the facilities of a producer in a coastal province of Ecuador. Three functional units were used—“1 kg of pig carcass at the slaughterhouse gate”, “1 kg pig live weigh at the farm gate”, and “1 kg of feed at the plant gate”. The impact categories included were global warming, fossil depletion, marine eutrophication, ozone layer depletion, particulate matter formation, photochemical oxidation formation, and terrestrial acidification. The results revealed that the production of ingredients for feed is the largest contributor to the environmental burden of pig and pork. The rendering of slaughter by-products that avoid the production of other fats and proteins results in a lower environmental impact than the other scenarios in almost all categories.
Keywords:
environmental impact; pig; pork; LCA; carbon footprint; meat; food; rendering; feed; animal by-products 1. Introduction
1.1. Sustainability and Pig and Pork Production
The livestock sector worldwide affects nutrition and human health, guaranteeing subsistence and reducing poverty [1]; however, a significant impact is attributed to the environment since it is responsible for 18% of global greenhouse gas emissions [2,3]. The livestock sector demands a large amount of resources such as tracts of land [4], water, and energy [5,6], which affect soils, biodiversity, and water systems, especially by altering the biogeochemical cycles of nitrogen, phosphorus, and carbon, which favors the growth of algae, accelerating eutrophication and promoting the spread of bacteria in surface waters [6]. A large part of this problem is associated with animal nutrition [7]. Livestock and agricultural plantations in the food sector are the main factors responsible for the change in land use, deforestation, and loss of biodiversity caused by the extensive area devoted to forage production and the expansion of pastures; change in global climate due to greenhouse gas emissions during the enteric fermentation process and manure handling; change in water use and pollution and loss of terrestrial and marine ecosystems, due to the excessive use of fertilizers with nutrients (N and P) [8] and pesticides used in forage crops and grasslands [9]. It should be noted that livestock waste is also responsible for soil organic carbon sequestration [10]. Furthermore, the application of certain practices regarding livestock management may help the removal of carbon from the atmosphere and store it in the soil [11]. Animal welfare also contributes to the conditions of the production system since proper management reduces the mortality rate and the use of antibiotics [1].
By 2029, world meat production is expected to be 13% higher than in the base period 2017–2019 [7]; the biggest driver is expected to come from developing countries [12]. It is estimated that the consumption of poultry meat represents 50%, pork 28%, beef 16%, and sheep meat 6% [13]. Chicken meat is the most demanded and preferred by consumers since it is the lowest-cost protein in relation to the rest of the meats mentioned [14]. Pork is the second in demand, but with moderate growth in the next 5 years due to the outbreak of the African Fever Plague (ASF) in China and Vietnam [13].
In 2019, world production of pork reached a volume of 124 million tons, 1.5% more than in 2018; this led to pork being the most consumed meat in 2019, with a world per capita consumption of 15.6 kg/year [15], being the locations with the highest consumption Hong Kong, China, Taiwan, South Korea, the United States, and the European Union.
Pig production is responsible for 9% of global emissions from livestock [16]. Pig production generates environmental effects such as the excretion of excess nitrogen and phosphorus, altering the living conditions of aquatic systems [17].
Since China is the country where approximately 50% of pigs are raised globally [18], this production is attributed to the primary source of GHGs in the food supply chain in this country, since it requires several resources such as the animals themselves, facilities for their accommodation, feed, agriculture, machinery, slaughter, solid and liquid waste management, transportation, among others [19]. Pig production is associated with environmental interventions mostly linked to feed production and manure generation [2].
1.2. Overview of the Environmental Performance of Pig and Pork
Life cycle assessment (LCA) is a standardized methodological framework that allows the identification of environmental hotspots and the comparison between systems, processes, or products with a similar function, offering valuable information in decision making to analyze and include opportunities for improvement [20].
For evaluating the environmental performance of pig and pork production, LCA methodology has been commonly used. Table 1 presents a summary of LCA studies performed for pig and pork production. The selection of the LCA studies was based on the Scopus database [21]. Keywords used for the search were “life cycle assessment” and “pig”. Relevant studies were selected using the following criteria: the studies are focused on live or carcass weight, that is, studies with a functional unit associated with pig or pork mass, and that they have a cradle-to-farm-gate or cradle-to-slaughterhouse-plant-gate approach. Some have taken a cradle-to-farm-gate approach (live weight pig), while others have taken a cradle-to-slaughtering-gate approach (pork). Most studies include feed production, pig production (different growth phases), and manure management. Impact categories selected may vary among studies; however, most studies include at least climate change (GWP), terrestrial acidification (TAP100), and eutrophication potential (EP). Studies of this animal production have been carried out mainly for several European countries, The United States, and China, and to a lesser extent in Latin American countries, particularly for Cuba and Brazil. Most of the analyzed studies agree that feed production is the stage with the greatest contribution from the categories of impacts included.

Table 1.
Summary of life cycle assessment studies of pig and pork production published in academic journals.
1.3. Pig Production in South America
Pig production has evolved in terms of the modernization of farms in the last decade in Latin American countries to satisfy the demand of the growing population, as is the case of Ecuador, which in 2016 increased its technical production by 44% in relation to 2010 [42]. According to the last agricultural census of Ecuador published in 2017 [42], it was shown that the pig population was 1,115,473 pigs, with an estimated consumption that went from 7.3 kg/person-year in 2010 to 10 kg/person-year in 2016. Pig production contributed 8% to the Ecuadorian agricultural GDP in 2017 [42].
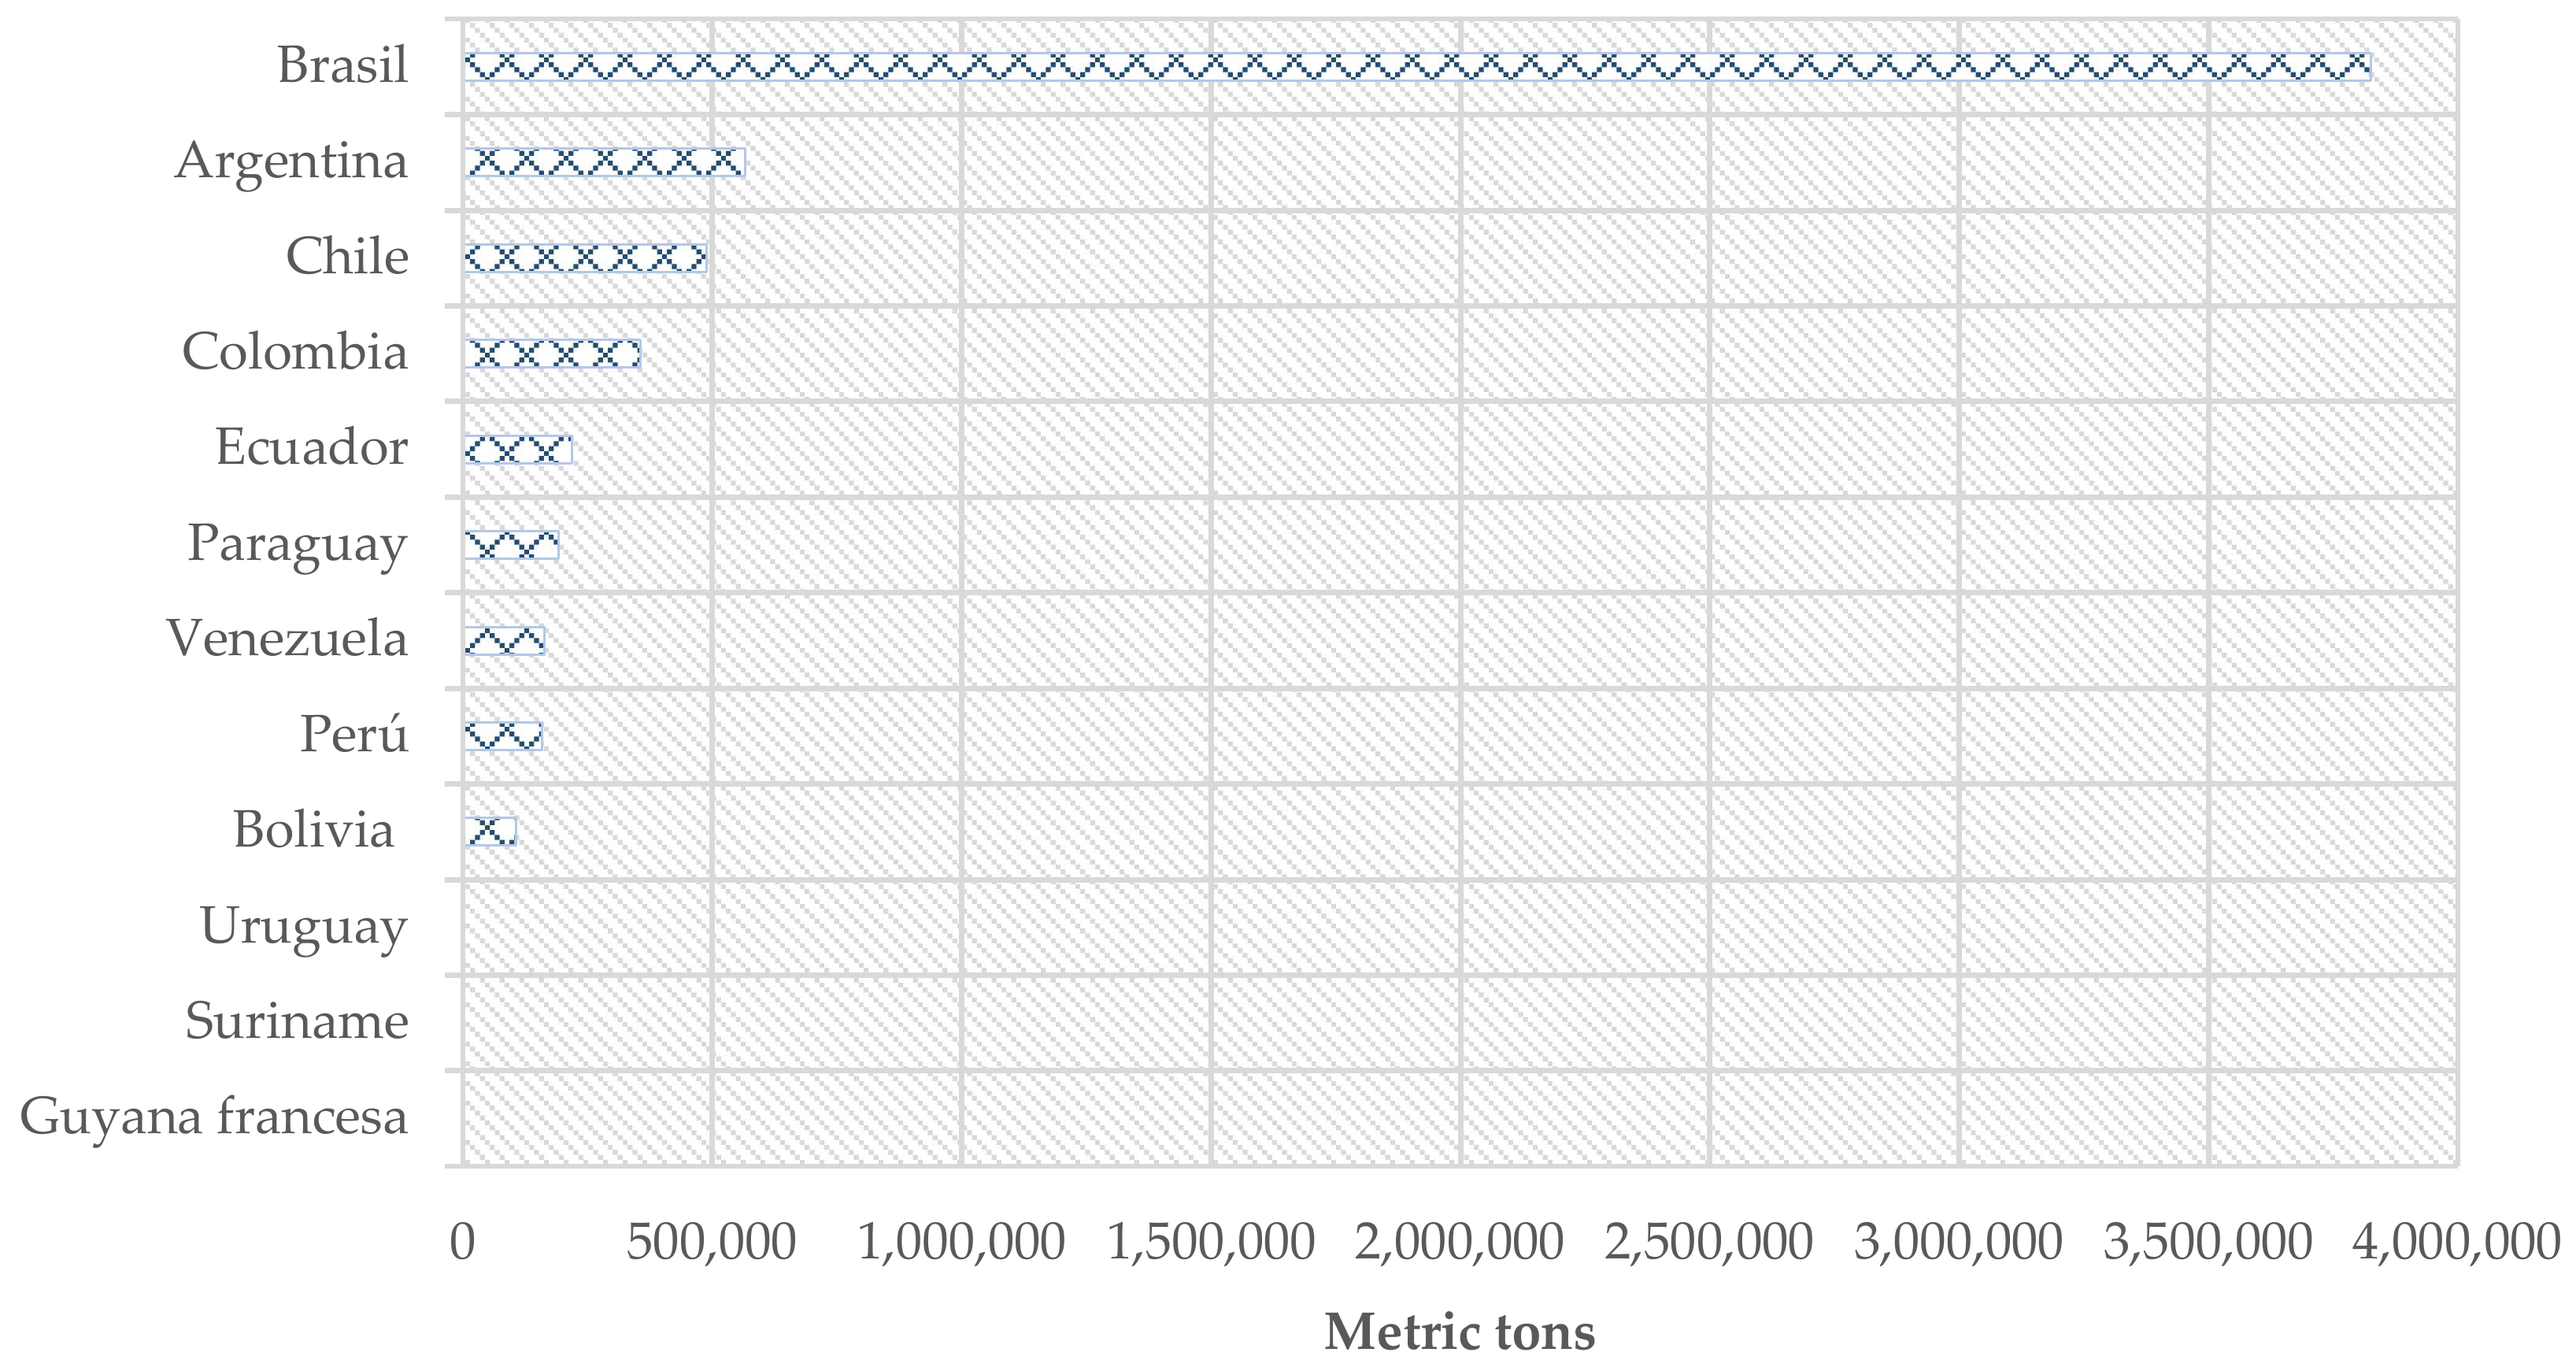
In Figure 1, according to data from the USDA (United States Department of Agriculture), Brazil was the leading producer of pork in South America with 3,824,682 metric tons in 2017. Ecuador was the fifth-greatest producer with 218,110 metric tons [15].
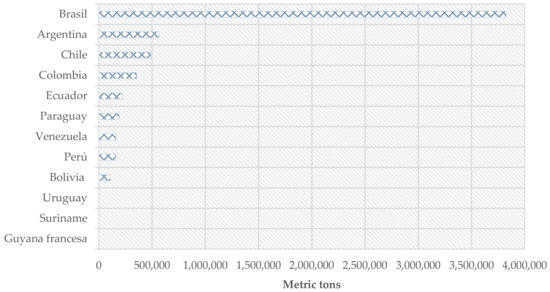
Figure 1.
Pork meat production in South America in metrics tons in 2017 [15].
The growth in meat production of the Andean region is associated with both population and per capita consumption increase. Nowadays, pork is an essential source of protein in the region. There is no evidence of peer reviewed LCA studies of pig or pork production for this region. Furthermore, LCA results may vary depending on site-specific practices and methodological choices. Therefore, it is crucial to develop studies to evaluate the environmental performance of animal and meat production in countries in the Andean region.
1.4. Goal of the Study
This study aims to evaluate the environmental performance of Ecuadorian pig production and pork processing using the LCA methodology. The study will serve as a basis for identifying environmental hotspots in the pig value chain and providing life cycle inventory data to realize studies regarding the environmental sustainability of Ecuadorian diets. Alternatives for environmental improvement based on the hotspot identification will be discussed.
2. Methods
2.1. Scope
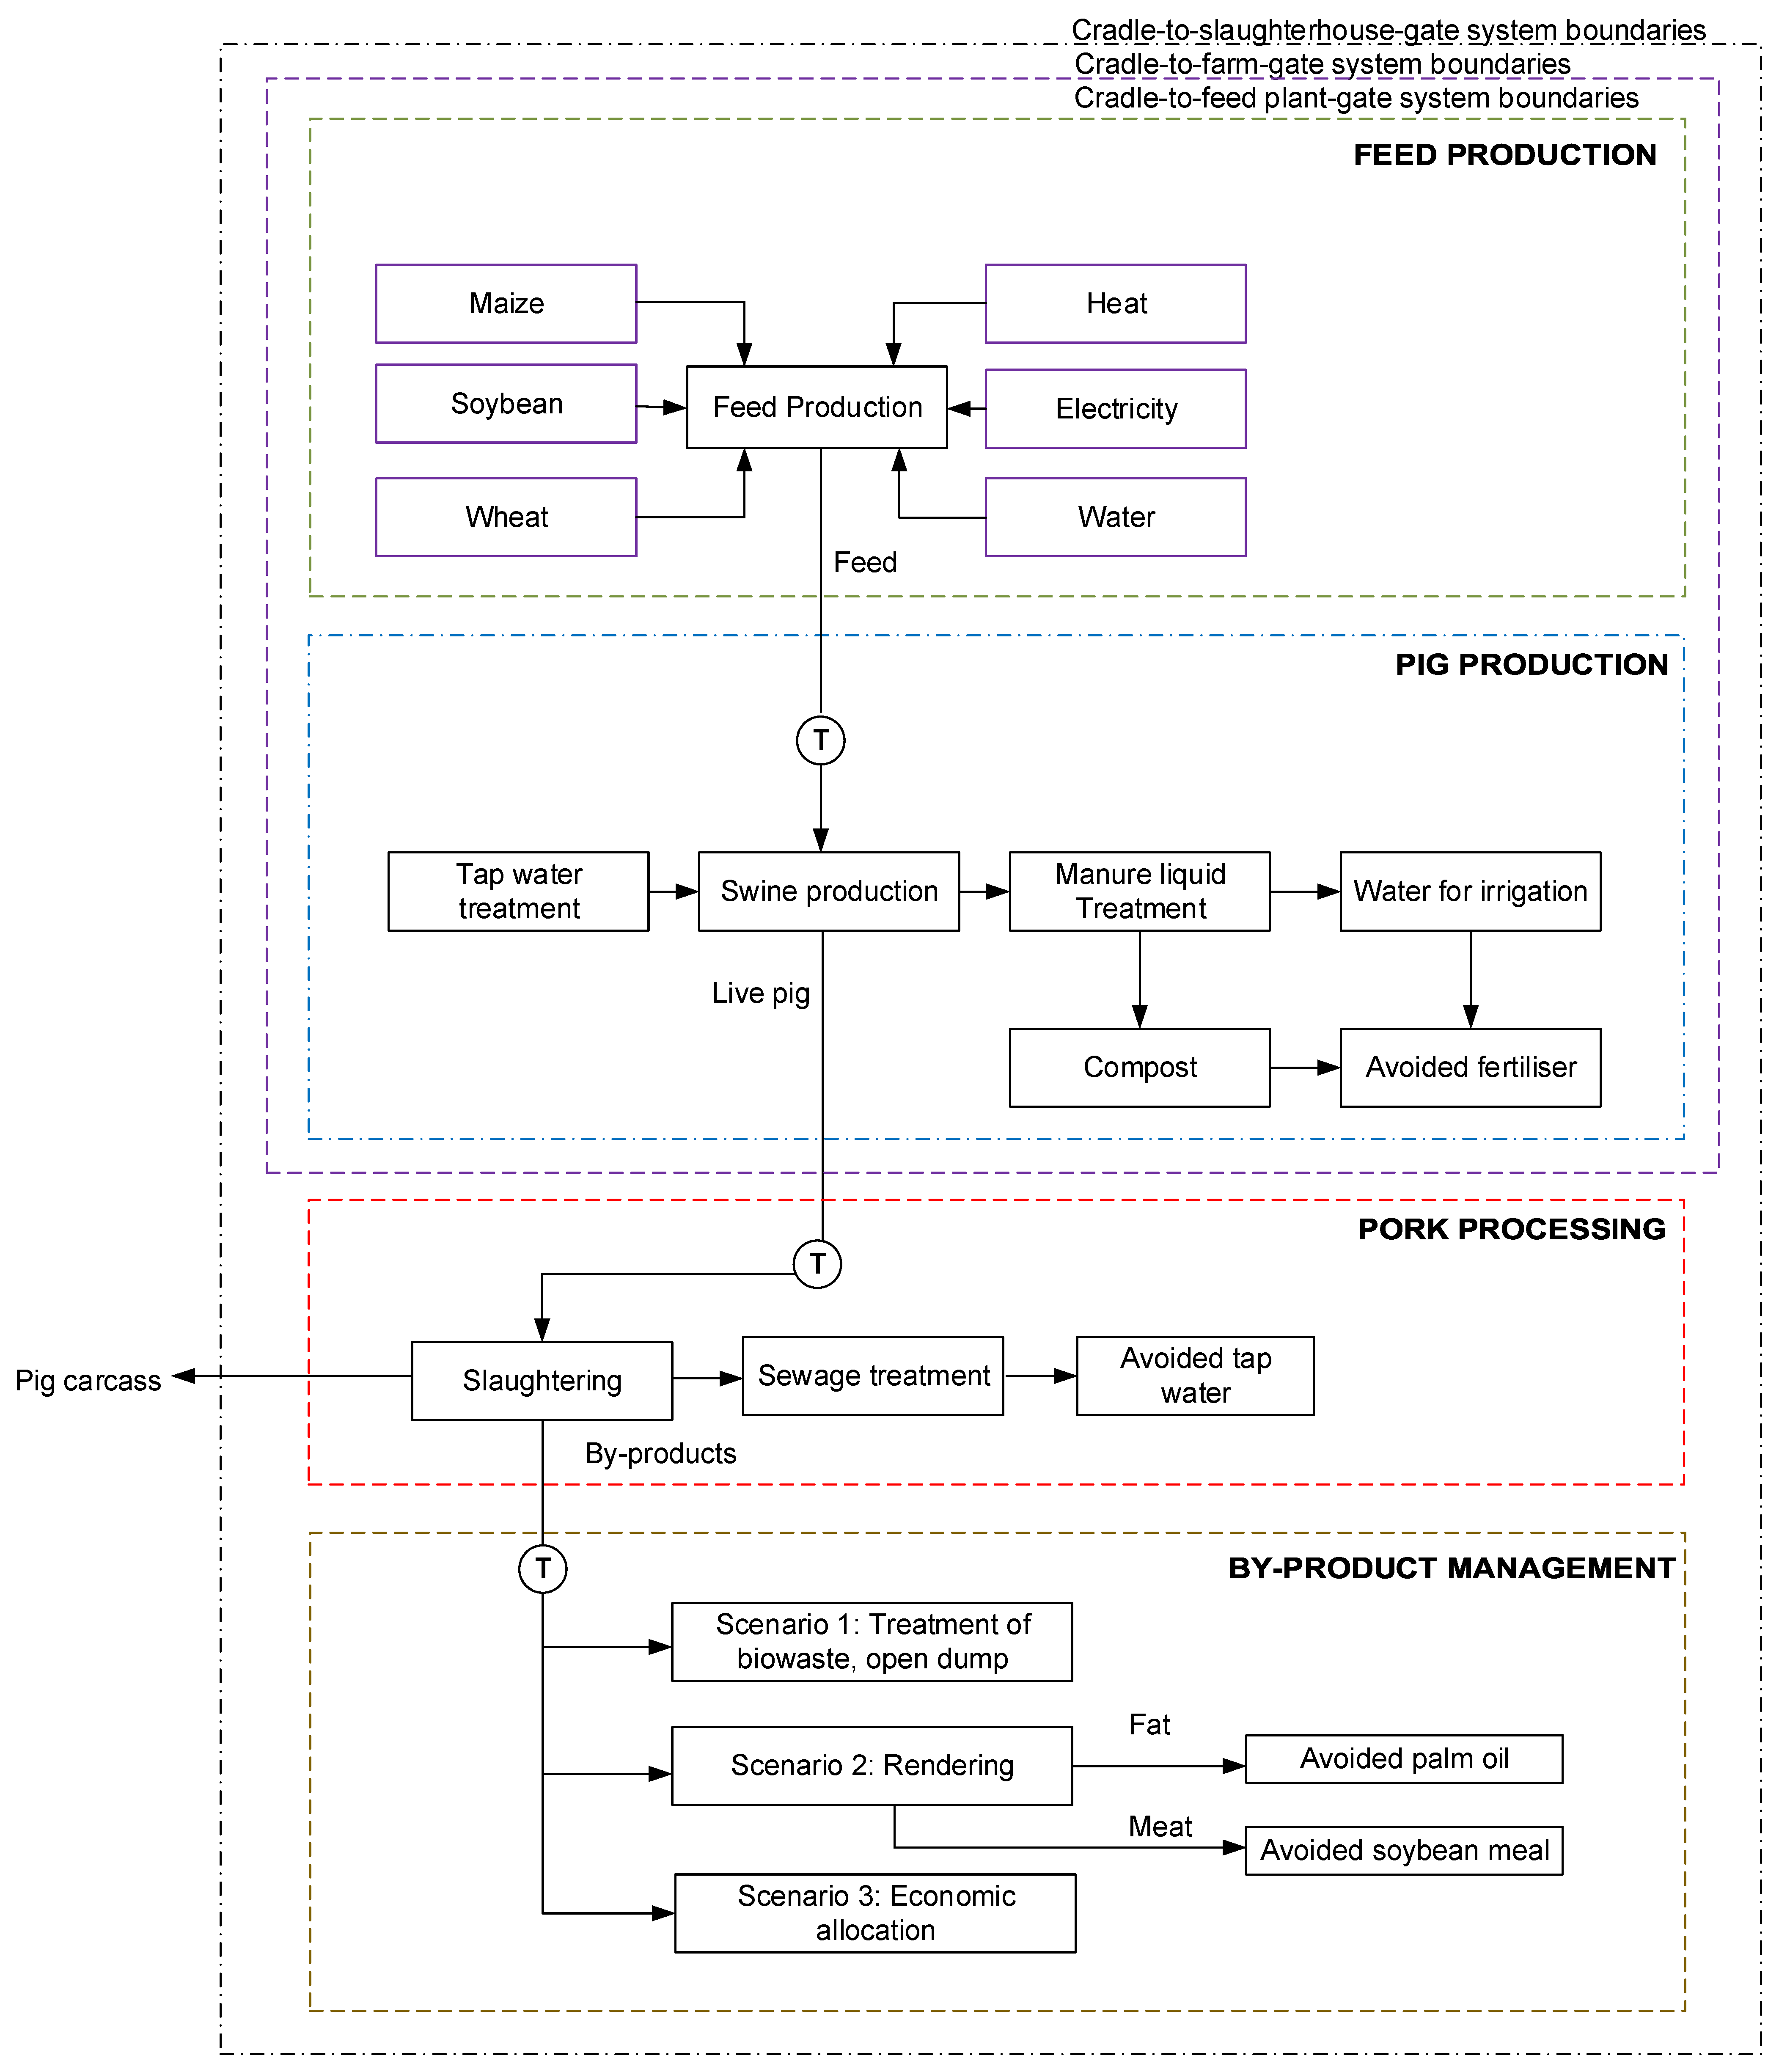
This study includes three technical systems in Ecuador, the feed system with a cradle-to-feed-plant-gate scope, the pig system, which has a cradle-to-farm-gate scope; and the pork system, which has a cradle-to-slaughterhouse-gate scope (Figure 2). Data were obtained for the year 2019.
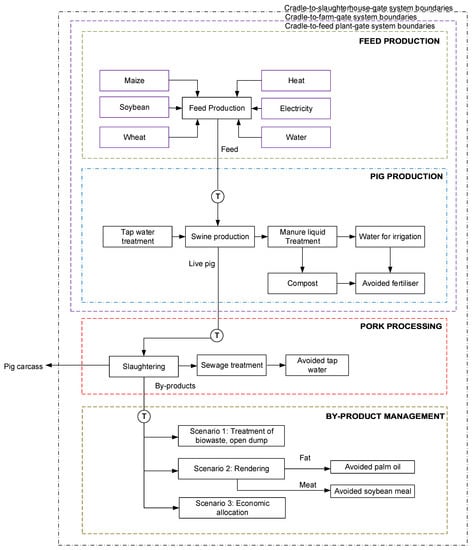
Figure 2.
System boundaries (T: Transport).
The functional units of each technical system are 1 kg of feed at the feed-plant gate, 1 kg of live weight at the farm-gate, 1 kg pig carcass at the slaughterhouse gate.
2.2. Life Cycle Inventory Analysis
The primary data for the inventory analysis were provided by the technical staff of a pig farm and a slaughtering plant of a corporate group. Most of the product flows of the foreground system are primary data. Background data and natural flows are derived from calculations and life cycle inventory databases as described in Section 3.
2.3. Life Cycle Impact Assessment
The calculations were performed using OpenLCA v1.10.3 [43]. Environmental impact assessment indicator results were calculated according to the ReCiPe method hierarchical perspective v1.3 [44] using the following impact categories: Global Warming Potential (GWP), Fossil Depletion Potential (FDP), Marine Eutrophication Potential (MEP), Ozone Depletion Potential (ODP), Particulate Material Formation Potential (PMFP), Photochemical Oxidants Formation Potential (POPF) and Terrestrial Acidification Potential (TAP100). The indicator results for the impact category Global Warming Potential can also be called Carbon Footprint.
3. Results
3.1. Life Cycle Inventory Analysis
3.1.1. Feed Production
About 50% of the content of the feed is imported; in particular, wheat and soybeans are imported from Peru and Argentina, respectively. The general formulation was obtained from the supplier of the farm. Only the ingredients composing more than 1% in mass are considered. The final formulation includes national maize (47.78%), wheat (24.05%), imported soybean meal (23.14%), and palm oil (1.74%) (Table 2). Data for water, energy, electricity, and heat used in the manufacturing of feeds were derived from a study that includes the inputs and outputs for a feed production system [45]. Table 2 presents the inputs and outputs of the feed production system. Life cycle inventories for the production of feed ingredients, water, and heat were derived from Ecoinvent databases. Life cycle inventory for electricity production in Ecuador was derived from [46,47].
Table 2.
Inputs and outputs of the feed production system.
3.1.2. Pig Production
The pig production system includes swine production, water treatment, wastewater treatment, and solid waste treatment.
Swine Production
Data were obtained for a pig farm that has a weekly production of 980 pigs with an average weight of 110 kg. The annual production of pigs on this farm is approximately 50,960 pigs (5600 TM), which represents 4.47% of the total population of pigs nationwide in 2016 [48]. It is located in a coastal province, in a sector with an altitude between 35 m to 52 m. Its natural vegetation cover is basically of the dry scrub type moderately altered, and there are several agro-industrial farms around it.
The pig farm has all the production phases, divided by biosecurity issues into two areas. The first area is reproduction, which includes the rearing of piglets, maternity, and gestation. The second area comprises growth and fattening. The farm manages the hybrid breeds in the female sheds: Landrace and Large White, and in the male sheds, only the Duroc breed. Table 3 presents a description of the pig production system.
Table 3.
Description of each phase of the pig production system.
Data on energy consumption for pumping, transport, lighting, manure generated, feed, water, and fuel were obtained from the historical data of the pig farm. Vitamins and antibiotic drugs were not included, given that their impact was considered to be not very significant [20]. Incineration is widely used as a biosecurity method for pig disposal corpses [20]. The farm has an artisanal incinerator for death; however, there are no data on the emissions of this system. Therefore, an incineration process from Ecoinvent databases was used [49].
The direct emissions of CH4 to air from both enteric fermentation and manure storage and the direct and indirect emissions from manure management of N2O were calculated under the Tier 1 method proposed by the Intergovernmental Panel on Climate [50].
Gasoline is used to transport personnel, and gas is used to operate the incinerator. The detergent is used to clean sheds and areas, and the lime is applied to neutralize odors in sheds once they have been disinfected.
Transport from the feed plant to the pig farm was also considered, the distance being 152 km. Life cycle inventories for producing inputs such as petrol, propane, detergent, lime were derived from Ecoinvent databases [49]. Life cycle inventories of the treatment of outputs such as hazardous waste, waste mineral oil, and biowaste were derived from Ecoinvent databases [49]. Table 4 presents the inputs and outputs of the swine production.
Table 4.
Inputs and outputs of swine production based on the production of 1 kg live pig.
On-Farm Water Treatment
The pig farm has a water storage reservoir of 750 m3 supplied by an irrigation canal. The farm also has a water treatment plant that includes three stages coagulation, flocculation, and disinfection. The following chemical agents are used during this process: polyaluminium chloride, flocculants, and sodium hypochlorite (Table 5). Once the water is treated, the effluent is stored in a pool, which has a capacity of 400 m3, and from there, it is pumped to the farm sheds. Diesel is used for the pump. Life cycle inventory for the production inputs such as chlorine, polyaluminium chloride, aluminum sulfate, and diesel, including combustion, were derived from Ecoinvent databases [49].
Table 5.
Inputs and outputs associated with water treatment on farm based on 1 m3 treated water.
On-Farm Wastewater Treatment
Each shed on the farm has a drainage and collection system for solids, which are gradually removed during shed cleaning. These gravity drains pass to a storage pool, unifying the different discharges. The same discharges are subsequently pumped towards the solids separator, where the larger diameter solids are removed. The liquid passes to the oxidation system composed of anaerobic, facultative, and aeration ponds. The treated effluent is pumped for the irrigation of pastures within the farm facilities. The use of this treated effluent avoids the use of nitrogen fertilizer.
The solid with a humidity of 25 to 40% is removed from the separator is placed on a platform to lose moisture after five days. A microbial complex and rice chaff are introduced in those wastes for composting. The compost is sold. Enzymes help accelerate the breakdown of organic matter. The elaboration compost substitutes the use of synthetic fertilizers (N, P2O5, and K2O). Table 6 and Table 7 present the inputs and outputs of the wastewater treatment and solid waste treatment. Life cycle inventories for the production of enzymes and fertilizer were derived from Ecoinvent databases [49]. Life cycle inventory for the electricity [28] supply in Ecuador was derived from [46,47]. Life cycle inventories for the production of rice husk and fertilizer (N, P2O5, and K2O) were derived from Ecoinvent databases [49].
Table 6.
Inputs and outputs associated with on-farm wastewater treatment based on the treatment of 1000 kg liquid manure.
Table 7.
Inputs and output for the solid waste treatment on farm based on the treatment of 1 kg solid manure.
3.1.3. Pork Processing
The pork system includes slaughtering and wastewater treatment.
Slaughtering
At the end of the fattening period, the pigs are transported to the slaughterhouse. The slaughterhouse is located in the province of Santa Elena, approximately 20 km from the pig farm. The slaughtering process begins with the reception of the pigs in a stabling area. The carcasses and viscera are subjected to post-mortem inspection to verify their quality and subsequent weighting and classification.
Table 8 presents the inputs and outputs associated with the slaughtering process. Life cycle inventories for the production of inputs such as water, diesel (including combustion), propane (including combustion), and ammonia were derived from Ecoinvent databases [49]. The treatment of slaughterhouse waste and slaughter by-products by open dump was derived from [49]. Life cycle inventory for the electricity supply in Ecuador was derived from [46,47].
Table 8.
Inputs and output for the slaughtering based on 1 kg pig carcass.
Wastewater Treatment
The discharges from the plant are initially collected in a catchment cistern, where it is pumped into the pretreatment. The effluent goes to a homogenization basin to regulate the pH and the pollutant load through a submerged aerator and pumps to drive to the primary treatment. In this treatment, there is a dissolved air flotation unit (DAF) with chemical treatment, where the coagulant and flocculant are applied, that is, aluminum sulfate and polyaluminium chloride, respectively; these agents allow the destabilization of the matter and the formation of the floc favoring clarification of the discharge. Subsequently, the effluent leaving this unit passes into the biological treatment of low-load active sludge (with prolonged aeration) with nitrification process—denitrification and secondary clarification with lamellar decantation. The plant has green areas within its facilities and uses this treated effluent for the irrigation of these areas. In this way, this treatment avoids the use of drinking water for irrigation in the plant. Table 9 presents the inputs and outputs for the wastewater treatment system. Life cycle inventory for systems such as aluminum sulfate and polyaluminium chloride, municipal solid waste management, and avoided tap water were derived from Ecoinvent databases [49].
Table 9.
Inputs and outputs for the wastewater treatment based on the treatment of 1 m3 wastewater.
3.1.4. Slaughterhouse By-Product Management
The handling of by-products was evaluated according to three scenarios.
Scenario 1
Scenario 1 corresponds to the base case scenario. The main product of this stage is the pig carcass, which represents 79% of the live weight of the pig. However, other co-products are obtained, such as edible offal, fats, blood, mucous membrane, clean gut, and remains of pig carcass, which are currently taken to an open dump.
Scenario 2
A prospective system expansion is performed in which the animal by-products are processed by rendering. The inputs and outputs associated with the rendering are derived from [51]. Life cycle inventory for the production of inputs of the rendering process are derived from [49] and [46,47]. The system includes the displacement of soybean meal and palm oil by the rendering products. The life cycle inventories for the production of the displaced products are derived from [49].
Scenario 3
Scenario 3 corresponds to a situation where methodologically the allocation of the environmental burdens is based on the economic value of the co-products. Prices were provided by the producer (Table 8). The results of scenario 3 are not comparable to those of scenarios 1 and 2, as a different method of handling multifunctionality is used.
3.2. Life Cycle Impact Assessment
3.2.1. Feed Production
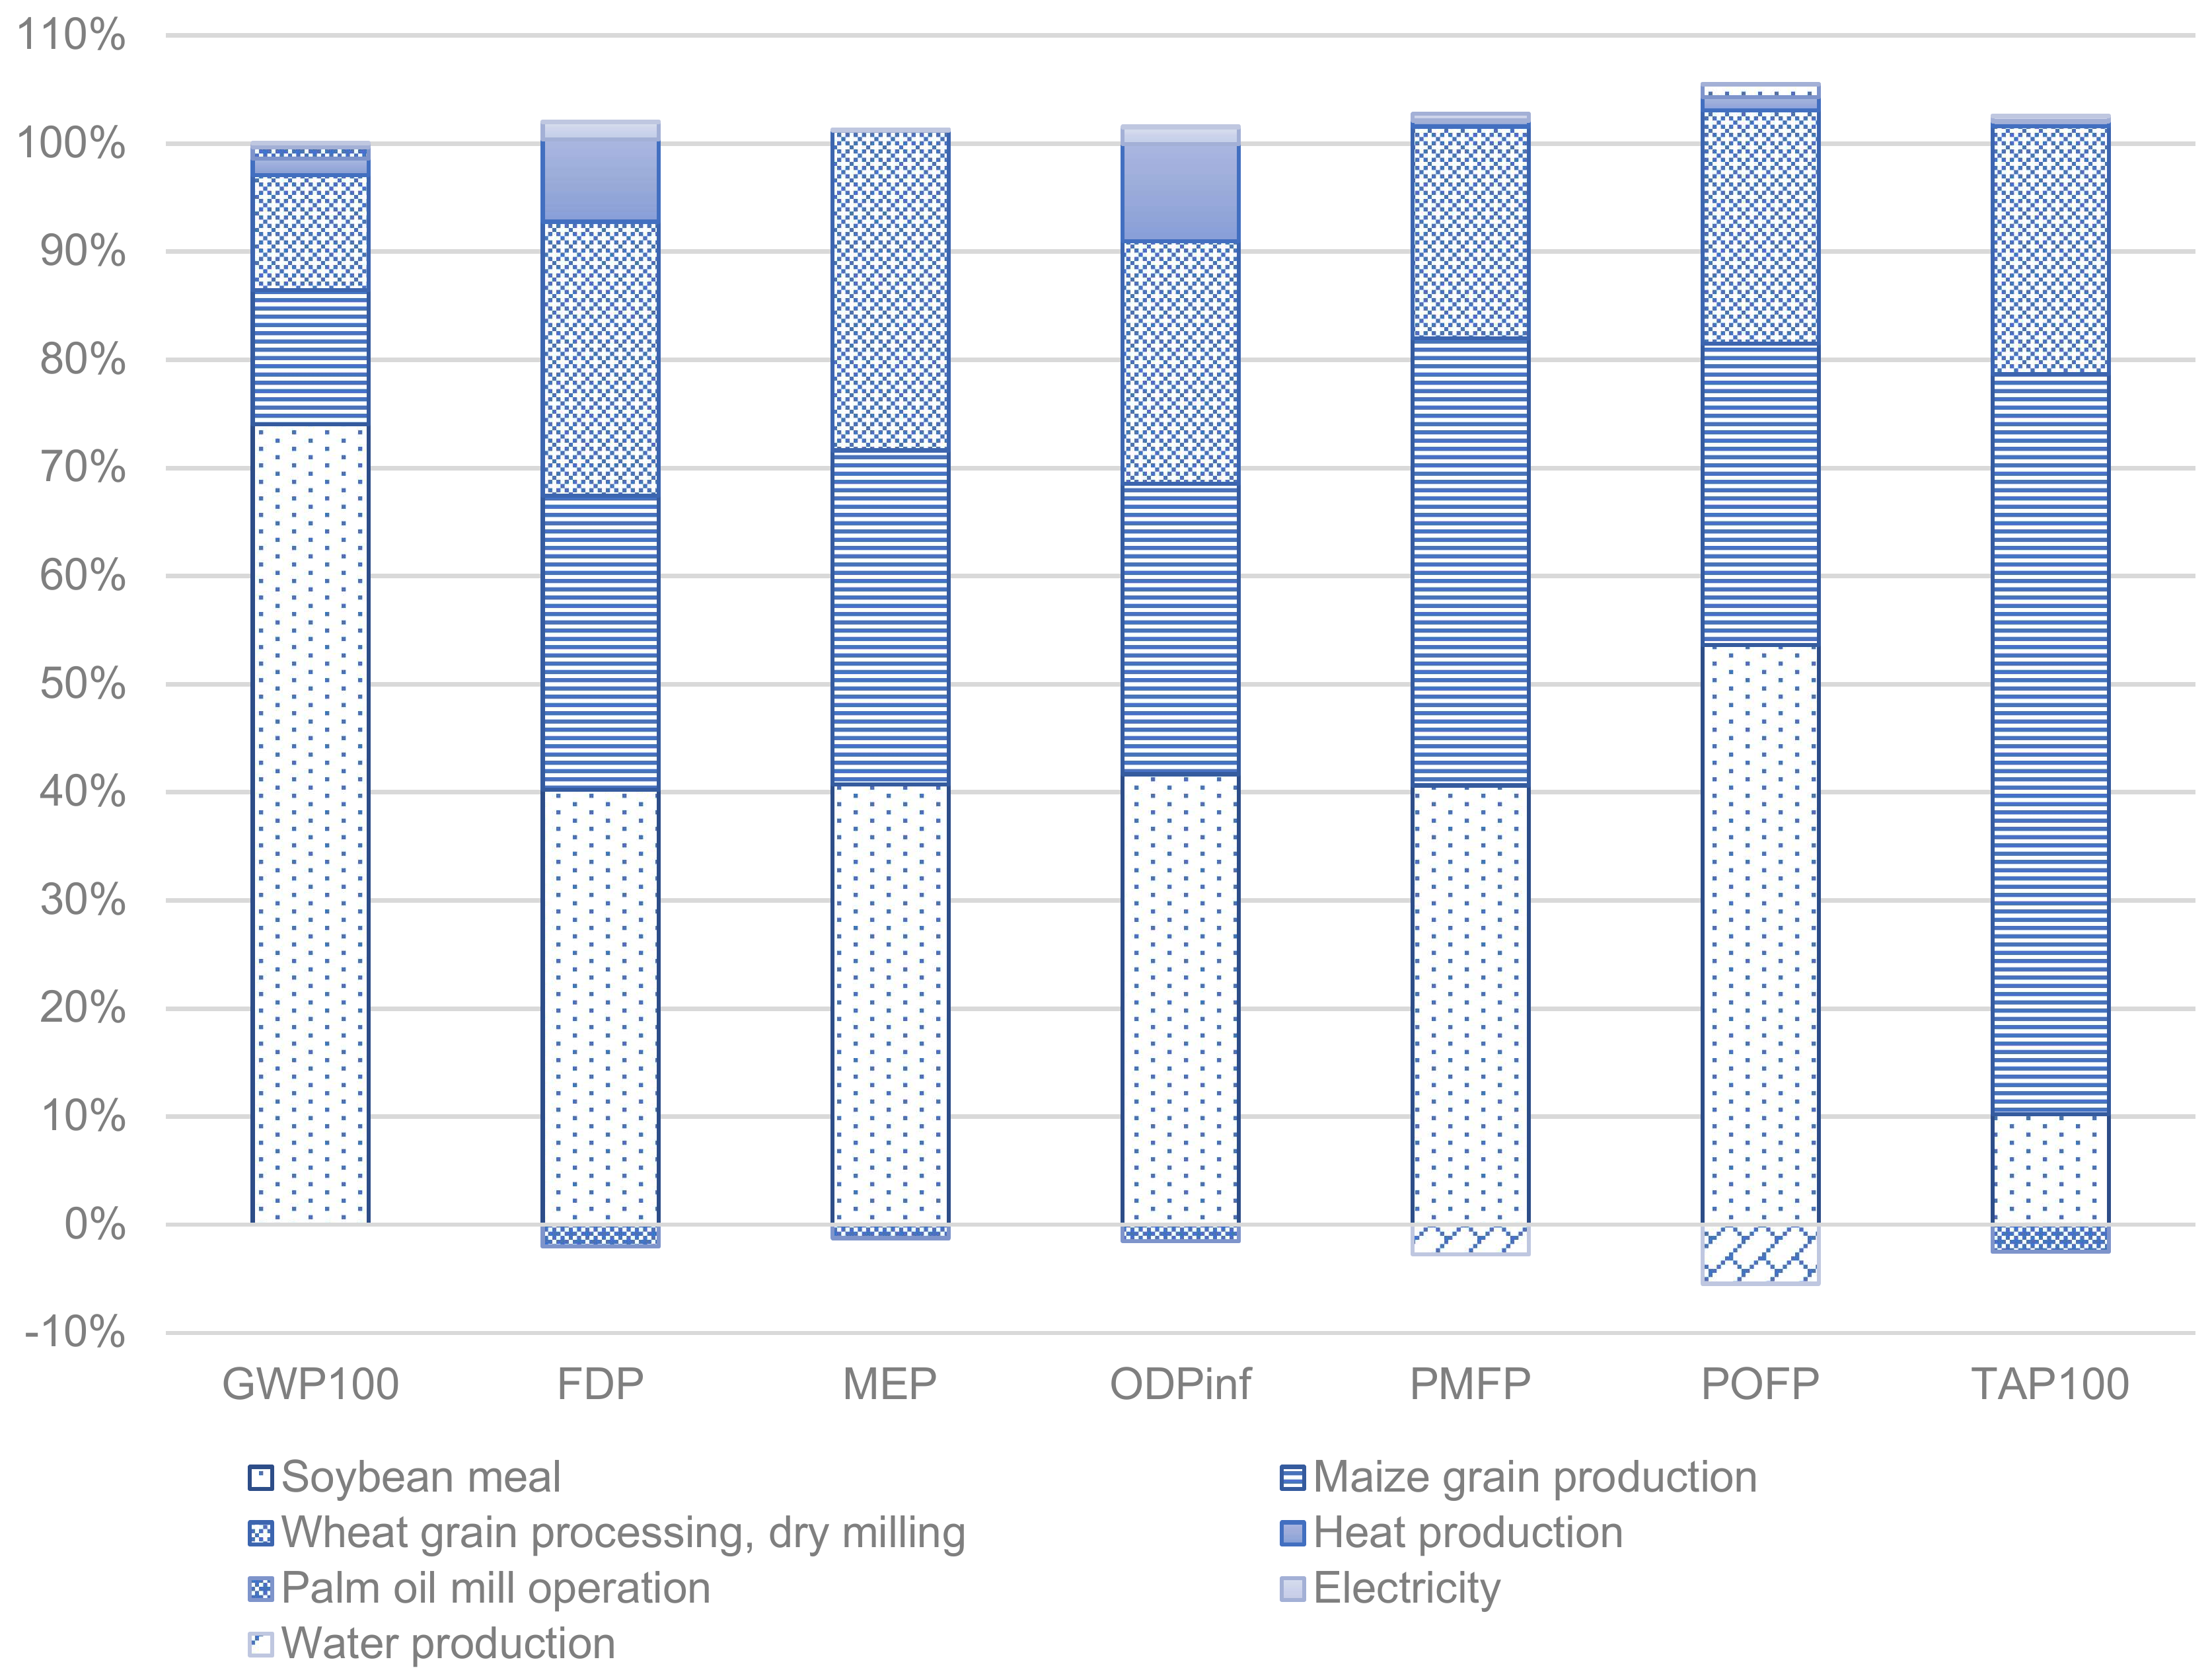
The potential environmental impacts of 1 kg of feed are presented in Table 10 for the impact categories evaluated. A contribution analysis is illustrated in Figure 3.
Table 10.
Characterized environmental impact indicator results of 1 kg feed at the feed-plant gate.
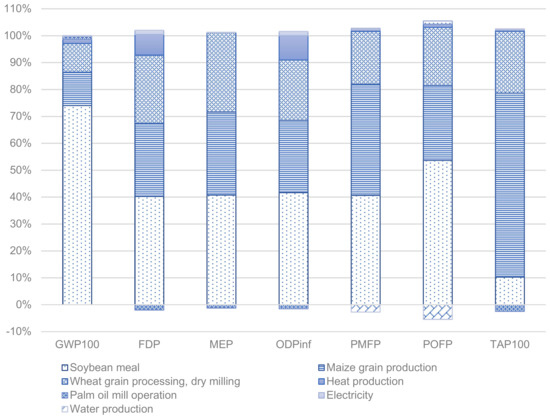
Figure 3.
Contribution analysis for feed production. Global Warming Potential (GWP), Fossil Depletion Potential (FDP), Marine Eutrophication Potential (MEP), Ozone Depletion Potential (ODP), Particulate Material Formation Potential (PMFP), Photochemical Oxidants Formation Potential (POPF), and Terrestrial Acidification Potential (TAP100).
The production of the soybean meal ingredient contributed the highest in six of the seven categories analyzed (GWP, FDP, MEP, ODP inf, and POFP), associated with the planting of the crop, which mainly derives from the generation of deforestation and the disappearance of biodiversity main, which represent 41.35% and 68.45%, respectively (Figure 3). This is because corn requires large amounts of nitrogen fertilizers. When applied to the soil form nitrates and ammonia escapes into the atmosphere, contributing to the formation of particles. The resources within the feed production, such as the heat used, electricity, and water use, have a low contribution to the categories analyzed.
3.2.2. Pig Production
Table 11 shows the results of the analyzed impact categories on pig production on the farm, and it can be noted that in the climate change category, it has a value of 3.64 kg CO2-eq/kg pig live.
Table 11.
Characterized environmental impact indicator results of 1 kg pig live weight at the farm gate.
In the GWP category, feed production contributes 69.98%, followed by manure management and enteric fermentation with 27.73% (Figure 4). Manure management is also present with low values in the ODPinf, PMFP, and POFP categories. The transport of the feed to the farm also represents intermediate values for the categories of FDP, ODFinf, PMFP, POFP, and TAP 100, associated with the use and combustion of the fuel used. Regarding the indicator of marine eutrophication, feed production contributes almost 100%. There is a negative contribution of 1.05% from wastewater treatment due to the avoidance of fertilizer products such as N. Manure management and enteric fermentation present negative values for the FDP, MEP, and TAP 100 categories.
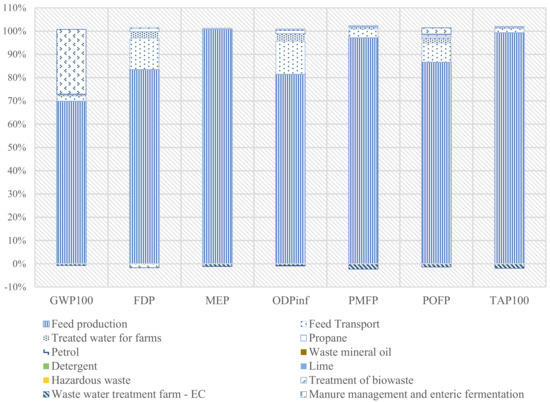
Figure 4.
Contribution analysis of pig production. Global Warming Potential (GWP), Fossil Depletion Potential (FDP), Marine Eutrophication Potential (MEP), Ozone Depletion Potential (ODP), Particulate Material Formation Potential (PMFP), Photochemical Oxidants Formation Potential (POPF), and Terrestrial Acidification Potential (TAP100).
3.2.3. Pork Processing
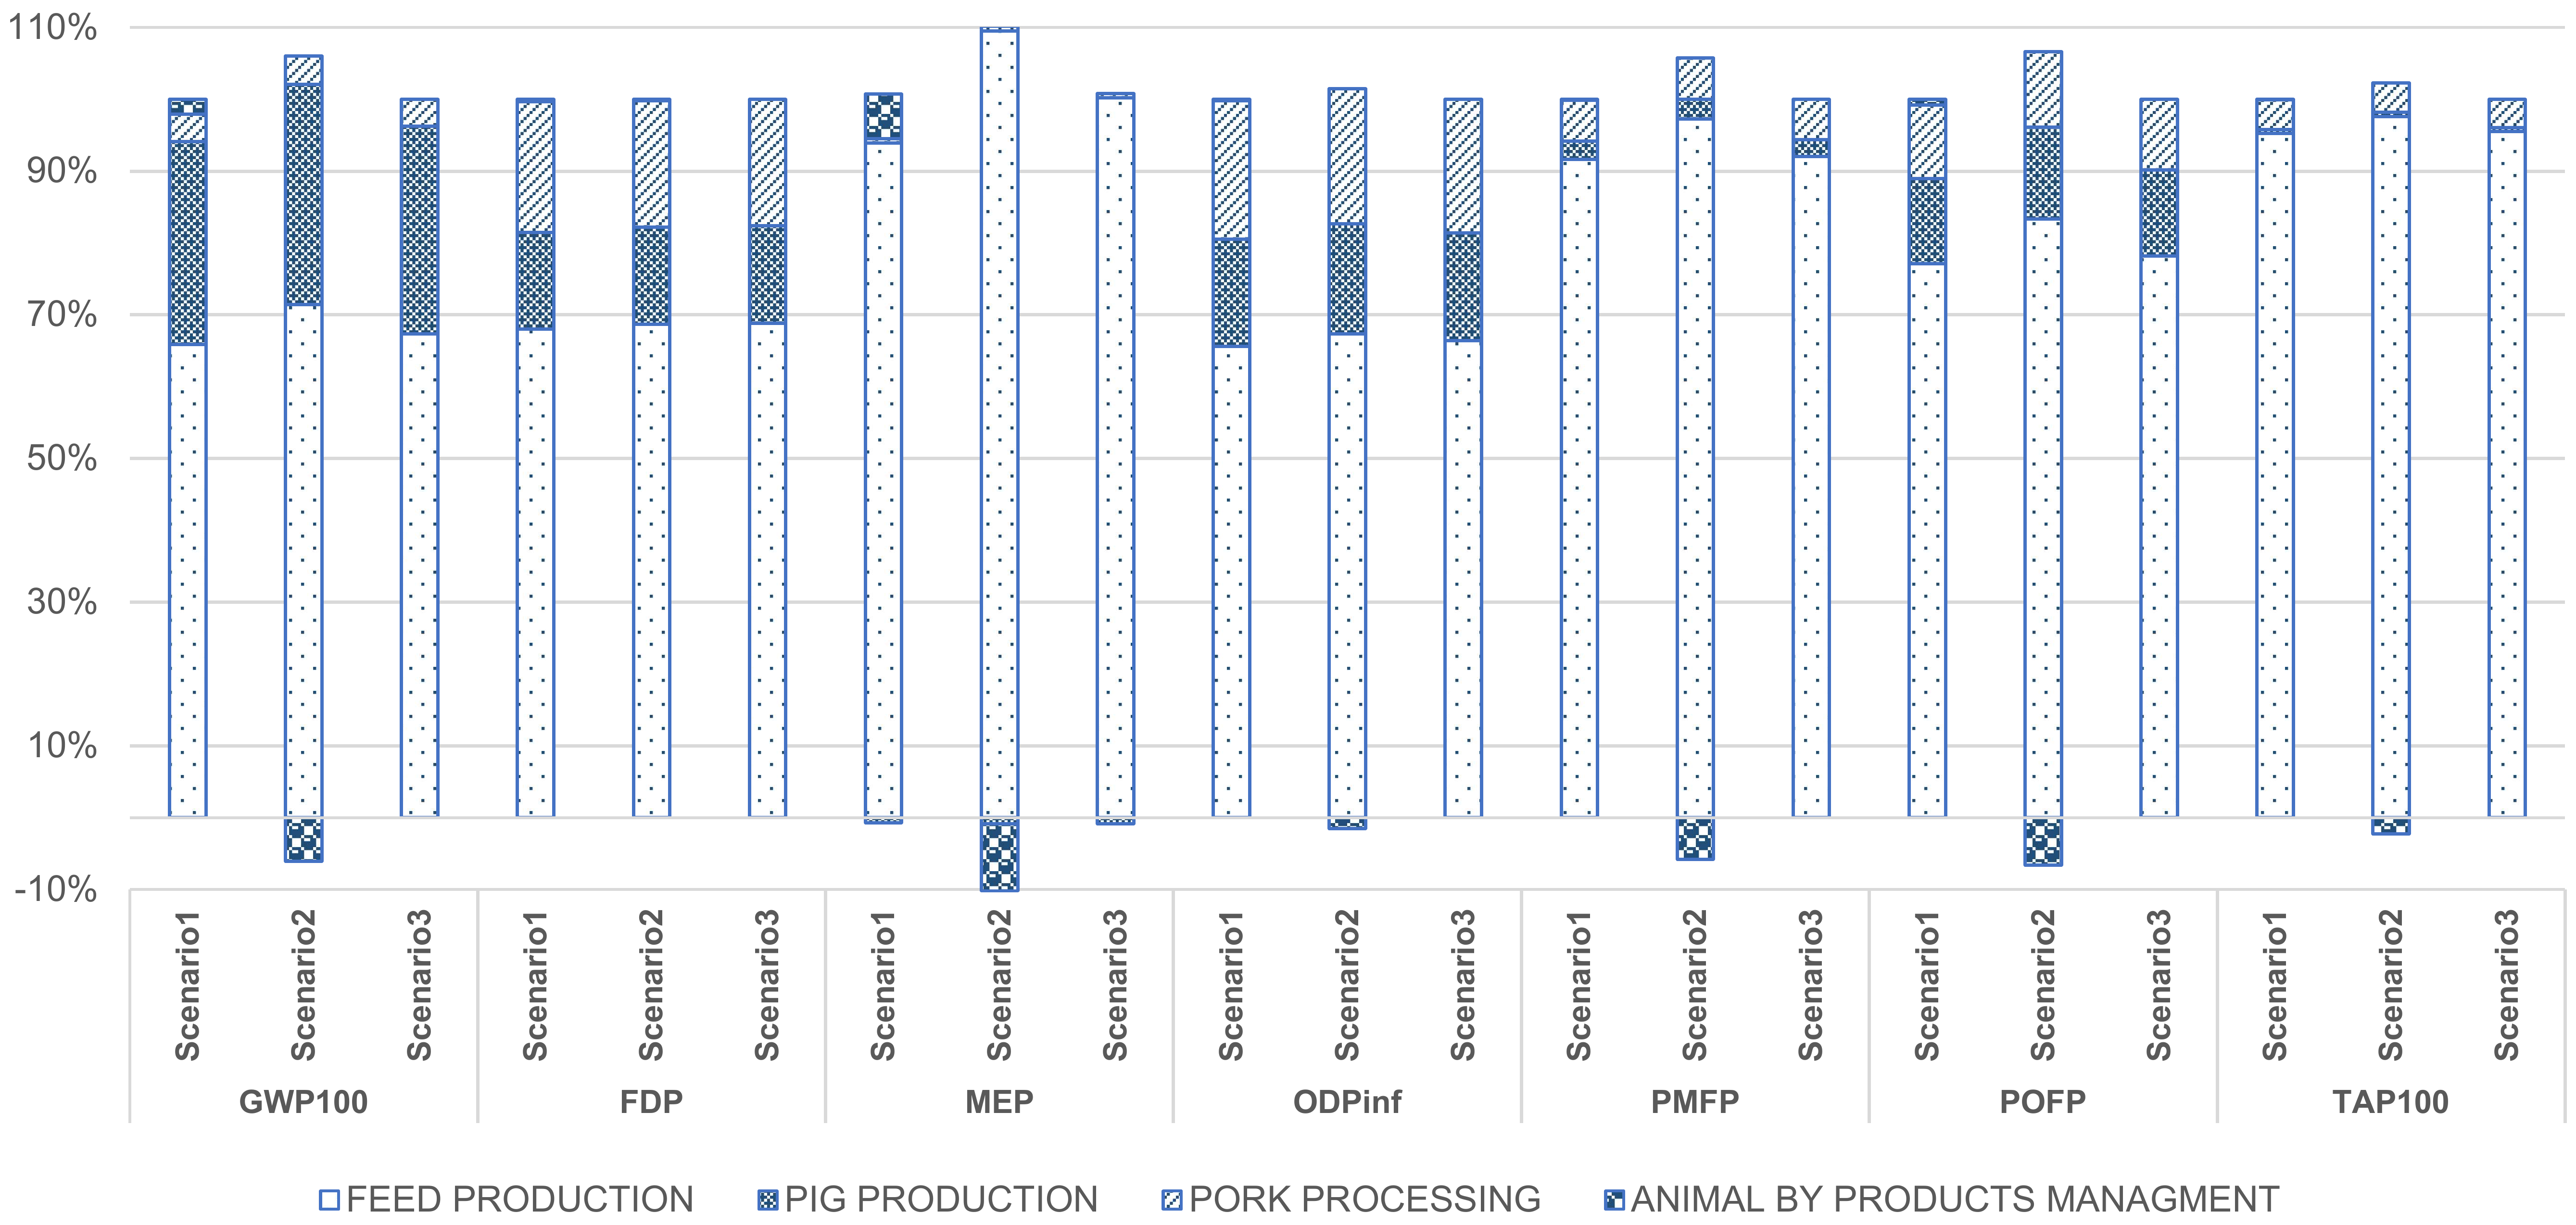
For all the indicators, scenario 2 presents the lowest results, because of the credits the system gains because of fats and proteins displacement. Scenario 1 is the one with the highest results (Table 12). The feed production represents the main contribution in the impact categories studied (Figure 5).
Table 12.
Characterized environmental impact indicator results of 1 kg pork at the slaughterhouse gate.
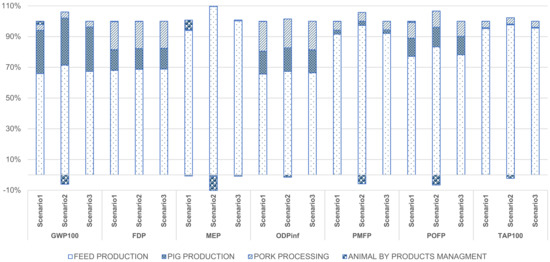
Figure 5.
Contribution analysis of pork production. Global Warming Potential (GWP), Fossil Depletion Potential (FDP), Marine Eutrophication Potential (MEP), Ozone Depletion Potential (ODP), Particulate Material Formation Potential (PMFP), Photochemical Oxidants Formation Potential (POPF) and Terrestrial Acidification Potential (TAP100).
Global Warming Potential—The results obtained in this category denote the greatest contribution in the feed production. In scenario 1, feed contributed 66%; in scenario 2, a partial increase of 71% is observed. The contribution to the Global Warming Potential of the production of pigs in the two scenarios is very similar (28% and 31%). In this stage, the contribution is due to methane gas and nitrous oxide generation from enteric fermentation and manure management. Regarding slaughtering, the contribution in all scenarios is less than 4%, with 3.81% in scenario 1 and 3.94% in scenario 2. Regarding scenario 2, slaughter by-product management by rendering generated a contribution of −6.05% in GWP due to palm oil and soybean meal displacement.
Fossil Depletion—This category is associated with the use of fuel for power generation, in the three scenarios, the greatest contribution is generated by the feed production, and all the results remain very similar, the feed production is at 68%, the pig production is 13%, and pork processing is approximately 18%. In scenarios 1 and 2, by-product management represents 0.30 and 0.22%, respectively.
Marine Eutrophication—The most remarkable contribution is feed production with 94%, more than 100%, and more than 100% for both scenarios. In scenario 1, slaughter represents 0.65%, in scenario 2—0.66%. In the handling of by-products of scenario 2 there is a negative contribution of 9.30% because of the avoidance of soy protein and palm oil.
Depletion of the Ozone Layer—In this category, the greatest contributors were feed and pork processing for the two scenarios. In the first and third scenarios, feed production had a contribution of 66%, while in the second, 67%. In scenario 1, pork processing had a contribution of 19.27%, and in scenario 2, 18.85%, with a contribution of −1.50% from the handling of by-products due to the displacement of products.
Formation of Particulate Matter. Given the nature of the feed production, it represents the highest contribution with more than 90% in both scenarios. In scenario 2, it should be noted that there is a contribution of −5.78% in the handling of slaughter by-products, displacing loads of proteins and fats. Food production handles different grains and other powdered raw that directly affect the generation of particulate matter, especially soybeans and corn, since both are responsible for approximately 79% of its result.
Formation of Photochemical Oxidants. This category, characterized by smog, has its greatest contribution in feed production, especially during soybean meal production. In scenario 1 the contribution of feed is 77%. In scenario 2 it has a contribution of 83%. Pig production has a contribution of 11.85% in scenario 1 and more than 12% in scenario 2. The pork processing stage has a contribution between 10% and 11% in both scenarios. The handling of by-products in scenario 2 contributes −6.62% because of the displacement of palm oil and soybean meal.
Terrestrial Acidification—In this category, feed production also has the highest contribution, with more than 95%, for both scenarios, with corn production being the highest contribution, with 65%. The use of chemical agents in crops and the combustion of fossil fuels are the main factors that have an incidence in this category. The contribution of pork processing for the 3 scenarios is similar at 4%. By-product management has a contribution of −2.26% and 0.08% for scenarios 1 and 2, respectively. As explained before, the negative value is due to the credits of the displacement of environmental loads of palm oil and soybean meal.
Scenario 3 does not represent a situation comparable to scenarios 1 and 2. Scenario 3 uses an economic allocation approach; thus, it does not include the total effect of the by-products. Scenarios 1 and 2 include the environmental effects of the by-products in the system; thus, the main product, pork, suffers the consequences of gain the credits of their occurrence. It should be noted that for the latter options, the results of the main product depend on the destiny of the by-products.
The results of the economic allocation correspond to 4.57 kg CO2-eq in climate change, where feed contributes 67.38% of this value, followed by pig production with 28.91% and slaughter with 3.71%.
4. Discussion
4.1. Comparison with Other Studies
Results of LCA are not easily comparable as the methodological choices and system characteristics may vary among different studies; however, a comparison of Global Warming Potential results (Carbon Footprint) is performed. Only this category is used for comparison since Climate Change is the greatest threat to sustainability nowadays. Results for live weight at the farm gate and pork at the slaughterhouse gate of each study are presented in Table 13.
Table 13.
Comparison with Global Warming Potential impact category indicator results of other studies.
From the different studies reviewed, it can be noted that in Europe, there is a greater number of investigations regarding LCA studies of pig production. There are differences among the results from studies. This may be related to different system limits, production practices, the functional unit, and waste management scenarios. For comparison, the results for the climate change indicator are classified in Table 13 according to the scope and their functional unit, that is, per kg of live weight (at the farm gate) and carcass weight (at the slaughterhouse gate).
The results in the literature range from 2.30 to 8.39 kg CO2-eq/1 kg live weight at the farm gate, and from 2.55 to 4.50 kg of CO2-eq/1 kg carcass weight at the slaughterhouse gate. Among the lowest results, the study by Monteiro et al. [23] should be highlighted, with values of 2.34 and 2.31 kg of CO2-eq for the conventional feeding and precise feeding scenarios, respectively. In this study, a simulation was carried out in the feeding with standardized ideal digestible amino acids in two scenarios: the first of the average amount of lysine and the second of the exact amount of lysine to enhance the use of proteins. In [41], the Good Agricultural Practice (GAP) scenario presented a value of 2.30 kg of CO2-eq, highlighting that including good practices in agriculture, such as the systematic introduction of intermediate crops whenever possible, allows the reduction of nitrate emissions.
Sagastume Gutierrez et al. [34] present the highest value, 8.39 kg of CO2-eq/ live weight. However, the author explains that this is because it included CO2 emissions due to pig metabolism (CH4, N2O, and NH3 emissions); without this inclusion, the value would be 3.5 kg CO2-eq. This study also showed that the greatest contribution to climate change was the production of pigs, with 61%, of which 58% resulted from the metabolism of farm animals.
Makara et al. [28] presented several scenarios with results ranging between 6.82–7.1 kg CO2-eq since it includes the rearing of pigs with fertilization using pig manure; A pig farming with the AMAK method (filtered solids used for fertilization), and a combined scenario with fertilization and AMAK.
In the present study, 3.61 kg CO2-eq/kg live weight was obtained, a value that is within the range of the literature review carried out, ranging from values of 2.30 to 8.39 kg CO2-eq, and below the average value of 4.92 kg CO2-eq.
In relation to the results at-the-slaughterhouse-gate, the LCA results from the literature (Table 13) correspond to a range between 2.55 and 4.50 kg CO2-eq. The GWP results for the scenarios presented in this study are above the highest value in the literature.
Devers et al. [39] presented the minimum and maximum results of the literature review. In that study, a comparison was made between two types of pig production with localities in Flanders and Western Cape. Those found in Flanders presented the lower value of the climate change indicator, highlighting that within the raw material of the feed, it uses 7% of wheat and wheat co-products, unlike the other locality in which this input represents 60%; likewise, the amount of wheat flour soy is lower. Another critical factor is that the feed conversion for the pigs in Flanders is 2.97, and for the Western Cape pigs, it is 3.45. This difference is very significant and due to diet and genetics.
4.2. Recommendations for Improvement
Feed production is the most critical stage of the studied system regarding environmental impact. In this study, it has been shown that the feed conversion index of pigs is 2.99, a value that is within the similar studies range from 2.5 to 3.0. Almost three times plant-based biomass as feed is needed to produce animal-based biomass, and it is during feed production that synthetic fertilizers are used. Therefore, mitigation measures in this stage should be prioritized. Regarding this stage, the diet can be reformulated, reducing raw materials such as corn and soybeans by replacing them with amino acids [38] or by-products that resemble the nutritional requirement of pigs in the different growth stages [39]. Feed formulations should be optimized considering not only nutritional and economic criteria, but also criteria to improve the environmental profile of animal production.
In the production of pigs on the farm, it is recommended to provide adequate management of the manure and discharges, using these residues for the generation of biogas, generation of fertilizers, and compost. In addition, improving their diet will allow optimizing feed conversion.
In slaughtering, the by-products generated at this stage should be used as food or feed. Rendering of any other way of producing useful products should be emphasized for inedible by-products. This allows the displacement of other products, thus improving environmental performance and moving towards sustainable strategies.
5. Conclusions
In this study, the LCA methodological framework has been used to assess the environmental sustainability of a pig and pork production system in Ecuador. This type of comprehensive evaluation of pig production, or any other production system, is necessary for the development of effective environmental improvement strategies.
Of the stages that were part of the scope of the study, feed production is the one with the highest contribution in the different categories analyzed, exceeding 65% of the contribution. The generation of manure management contributed 27.73% of climate change emissions. The slaughter process represented only 4 to 19% of global emissions, with the FDP and ODPinf categories being the most relevant, with contributions between 17 and 19%.
Regarding slaughtering by-product management, the by-products generated at this stage should be used as food or feed when possible. The scenario where system expansion was used to include the displacement of palm oil and soybean meal had the lowest results for almost all the categories, except for the fossil depletion, as rendering increased fuel consumption.
According to the results, there are opportunities to mitigate the environmental impact of pig and pork. Main strategies should be focused on feed production. This could be achieved by substituting the ingredients with relatively high environmental impacts with greener alternatives (e.g., replacing soybean meal with amino acids).
Author Contributions
Conceptualization, A.D.R.; Methodology, M.L.P. and A.D.R.; Investigation, M.L.P.; Writing—Original Draft Preparation, M.L.P.; Writing—Review and Editing, A.D.R.; Visualization, M.L.P.; Supervision, A.D.R.; Project Administration, A.D.R. All authors have read and agreed to the published version of the manuscript.
Funding
This research was funded by Escuela Superior Politecnica del Litoral, ESPOL, project code FIMCP-700-2020” and “The APC was funded by Escuela Superior Politecnica del Litoral, ESPOL.
Institutional Review Board Statement
Not applicable.
Informed Consent Statement
Not applicable.
Data Availability Statement
All data generated or analyzed during this study are presented or can be reproduced using that life cycle inventories that are presented and references indicated.
Acknowledgments
The authors wish to thank Escuela Superior Politecnica del Litoral, ESPOL for funding. The APC is covered by Escuela Superior Politecnica del Litoral, ESPOL.
Conflicts of Interest
The authors declare they have no competing interests.
References
- Dick, M.; Abreu da Silva, M.; Franklin da Silva, R.R.; Lauz Ferreira, O.G.; de Souza Maia, M.; Ferreira de Lima, S.; Borges de Paiva Neto, V.; Dewes, H. Environmental impacts of Brazilian beef cattle production in the Amazon, Cerrado, Pampa, and Pantanal biomes. J. Clean. Prod. 2021, 311. [Google Scholar] [CrossRef]
- Cherubini, E.; Zanghelini, G.M.; Alvarenga, R.A.F.; Franco, D.; Soares, S.R. Life cycle assessment of swine production in Brazil: A comparison of four manure management systems. J. Clean. Prod. 2015, 87, 68–77. [Google Scholar] [CrossRef]
- Zhou, H.M.; Dong, H.W.; Xin, Z.Z.; Zhu, W.Q.; Huang, Y.W. Carbon footprint assessment of a large-scale pig production system in Northern China: A case study. ASABE 2018 Annu. Int. Meet. 2018, 61, 1121–1131. [Google Scholar] [CrossRef]
- Davis, K.F.; Yu, K.; Herrero, M.; Havlik, P.; Carr, J.A.; Odorico, P.D. Historical trade-offs of livestock ’ s environmental impacts. Environ. Res. Lett. 2015. [Google Scholar] [CrossRef]
- McClelland, S.C.; Arndt, C.; Gordon, D.R.; Thoma, G. Type and number of environmental impact categories used in livestock life cycle assessment: A systematic review. Livest. Sci. 2018, 209, 39–45. [Google Scholar] [CrossRef]
- Tullo, E.; Finzi, A.; Guarino, M. Review: Environmental impact of livestock farming and Precision Livestock Farming as a mitigation strategy. Sci. Total Environ. 2019, 650, 2751–2760. [Google Scholar] [CrossRef] [PubMed]
- Escribano, A.J. Organic feed: A bottleneck for the development of the livestock sector and its transition to sustainability? Sustainility 2018, 10, 2393. [Google Scholar] [CrossRef] [Green Version]
- Poore, J.; Nemecek, T. Reducing food’s environmental impacts through producers and consumers. Science 2018, 360, 987–992. [Google Scholar] [CrossRef] [PubMed] [Green Version]
- Steinfeld, H.; Gerber, P.; Wassenaar, T.; Castel, V.; Rosales, M.; de Haan, C. La Larga Sombra del Ganado: Problemas Ambientales y Opciones; FAO: Rome, Italy, 2009; ISBN 9789253055715. [Google Scholar]
- Fellman, J.B.; Franz, E.H.; Crenshaw, C.L.; Elston, D. Global estimates of soil carbon sequestration via livestock waste: A STELLA simulation. Environ. Dev. Sustain. 2009, 11, 871–885. [Google Scholar] [CrossRef]
- Kleppel, G.S. Do Differences in Livestock Management Practices Influence Environmental Impacts? Front. Sustain. Food Syst. 2020, 4, 1–15. [Google Scholar] [CrossRef]
- OECD/FAO. OECD-FAO Agricultural Outlook 2017–2026; OECD Publishing: Paris, France, 2017; ISBN 9-7892-6427-5478. [Google Scholar] [CrossRef]
- OECD/FAO. OCDE-FAO Perspectivas Agrícolas 2020–2029. Available online: https://www.oecd-ilibrary.org/agriculture-and-food/ocde-fao-perspectivas-agricolas-2020-2029_a0848ac0-es (accessed on 27 March 2021).
- FAO; A.O. of the U.N. Perspectivas Alimentarias. Resúmenes de Mercado División de Comercio y Mercados. Available online: http://www.fao.org/3/CA5040ES/CA5040ES.pdf (accessed on 24 February 2021).
- Flores, S.C. Panorama y Perspectiva de la Produccion de Carne de Cerdo en Peru. Available online: http://repositorio.minagri.gob.pe/xmlui/bitstream/handle/MIDAGRI/721/Panorama_y_persp_produc_carne_cerdo%281%29.pdf?sequence=1&isAllowed=y (accessed on 24 February 2021).
- FAO. El Estado Mundial de la Agricultura y la Alimentación. Progresos en la Lucha Contra la Pérdida y el Desperdicio de Alimentos; FAO: Rome, Italy, 2019; Volume 32, ISBN 9-7892-5131-8546. [Google Scholar]
- Kebreab, E.; Liedke, A.; Caro, D.; Deimling, S.; Binder, M.; Finkbeiner, M. Environmental impact of using specialty feed ingredients in swine and poultry production: A life cycle assessment. J. Anim. Sci. 2016, 94, 2664–2681. [Google Scholar] [CrossRef]
- Wang, X.; Dadouma, A.; Chen, Y.; Sui, P.; Gao, W.; Jia, L. Sustainability evaluation of the large-scale pig farming system in North China: An emergy analysis based on life cycle assessment. J. Clean. Prod. 2015, 102, 144–164. [Google Scholar] [CrossRef]
- Zira, S.; Röös, E.; Ivarsson, E.; Hoffmann, R.; Rydhmer, L. Social life cycle assessment of Swedish organic and conventional pork production. Int. J. Life Cycle Assess. 2020, 25, 1957–1975. [Google Scholar] [CrossRef]
- Reyes, Y.A.; Barrera, E.L.; Valle, A.S.; Gil, M.P.; García, O.H.; Dewulf, J. Life Cycle Assessment for the Cuban pig production: Case study in Sancti Spiritus. J. Clean. Prod. 2019, 219, 99–109. [Google Scholar] [CrossRef]
- Scopus. Available online: https://www.scopus.com/search/form.uri?display=basic#basic (accessed on 19 December 2020).
- Soleimani, T.; Gilbert, H. Evaluating environmental impacts of selection for residual feed intake in pigs. Animal 2020, 14, 2598–2608. [Google Scholar] [CrossRef] [PubMed]
- Monteiro, A.N.T.R.; Garcia-Launay, F.; Brossard, L.; Wilfart, A.; Dourmad, J.-Y. Effect of feeding strategy on environmental impacts of pig fattening in different contexts of production: Evaluation through life cycle assessment. J. Anim. Sci. 2016, 94, 4832–4847. [Google Scholar] [CrossRef] [PubMed]
- Conti, C.; Costantini, M.; Fusi, A.; Manzardo, A.; Guarino, M.; Bacenetti, J. Environmental impact of pig production affected by wet acid scrubber as mitigation technology. Sustain. Prod. Consum. 2021, 28, 580–590. [Google Scholar] [CrossRef]
- Zheng, G.; Li, M.; Shen, Y.; Yu, B.; Chen, T.; Liu, X. Environmental impact and adaptation study of pig farming relocation in China. Environ. Impact Assess. Rev. 2021, 89, 106593. [Google Scholar] [CrossRef]
- Pexas, G.; Mackenzie, S.G.; Wallace, M.; Kyriazakis, I. Environmental impacts of housing conditions and manure management in European pig production systems through a life cycle perspective: A case study in Denmark. J. Clean. Prod. 2020, 253. [Google Scholar] [CrossRef]
- García-Gudiño, J.; Monteiro, A.N.T.R.; Espagnol, S.; Blanco-Penedo, I.; Garcia-Launay, F. Life cycle assessment of Iberian traditional pig production system in Spain. Sustainability 2020, 12, 627. [Google Scholar] [CrossRef] [Green Version]
- Makara, A.; Kowalski, Z.; Lelek; Kulczycka, J. Comparative analyses of pig farming management systems using the Life Cycle Assessment method. J. Clean. Prod. 2019, 241, 118305. [Google Scholar] [CrossRef]
- Bandekar, P.A.; Leh, M.; Bautista, R.; Matlock, M.D.; Thoma, G.; Ulrich, R. Life cycle assessment of alternative swine management practices. J. Anim. Sci. 2019, 97, 472–484. [Google Scholar] [CrossRef]
- Garcia-Launay, F.; Rouillon, V.; Faure, J.; Fonseca, A. Life cycle assessment of pig production systems of the noir de bigorre chain. Arch. Zootec. 2018, 67, 21–25. [Google Scholar] [CrossRef] [Green Version]
- Noya, I.; Villanueva-Rey, P.; González-García, S.; Fernandez, M.D.; Rodriguez, M.R.; Moreira, M.T. Life Cycle Assessment of pig production: A case study in Galicia. J. Clean. Prod. 2017, 142, 4327–4338. [Google Scholar] [CrossRef]
- Bava, L.; Zucali, M.; Sandrucci, A.; Tamburini, A. Environmental impact of the typical heavy pig production in Italy. J. Clean. Prod. 2017, 140, 685–691. [Google Scholar] [CrossRef]
- Reckmann, K.; Blank, R.; Traulsen, I.; Krieter, J. Comparative life cycle assessment (LCA) of pork using different protein sources in pig feed. Arch. Anim. Breed. 2016, 59, 27–36. [Google Scholar] [CrossRef] [Green Version]
- Sagastume Gutierrez, A.; Cabello Eras, J.J.; Billen, P.; Vandecasteele, C. Environmental assessment of pig production in Cienfuegos, Cuba: Alternatives for manure management. J. Clean. Prod. 2016, 112, 2518–2528. [Google Scholar] [CrossRef]
- Garcia-Launay, F.; van der Werf, H.M.G.; Nguyen, T.T.H.; Le Tutour, L.; Dourmad, J.Y. Evaluation of the environmental implications of the incorporation of feed-use amino acids in pig production using Life Cycle Assessment. Livest. Sci. 2014, 161, 158–175. [Google Scholar] [CrossRef]
- Luo, Y.; Stichnothe, H.; Schuchardt, F.; Li, G.; Huaitalla, R.M.; Xu, W. Life cycle assessment of manure management and nutrient recycling from a Chinese pig farm. Waste Manag. Res. 2014, 32, 4–12. [Google Scholar] [CrossRef] [PubMed]
- Reckmann, K.; Traulsen, I.; Krieter, J. Life Cycle Assessment of pork production: A data inventory for the case of Germany. Livest. Sci. 2013, 157, 586–596. [Google Scholar] [CrossRef]
- Ogino, A.; Osada, T.; Takada, R.; Takagi, T.; Tsujimoto, S.; Tonoue, T.; Matsui, D.; Katsumata, M.; Yamashita, T.; Tanaka, Y. Life cycle assessment of Japanese pig farming using low-protein diet supplemented with amino acids. Soil Sci. Plant Nutr. 2013, 59, 107–118. [Google Scholar] [CrossRef]
- Devers, L.; Kleynhans, T.E.; Mathijs, E. Comparative life cycle assessment of Flemish and Western Cape pork production. Agrekon 2012, 51, 105–128. [Google Scholar] [CrossRef]
- Pelletier, N.; Lammers, P.; Stender, D.; Pirog, R. Life cycle assessment of high- and low-profitability commodity and deep-bedded niche swine production systems in the Upper Midwestern United States. Agric. Syst. 2010, 103, 599–608. [Google Scholar] [CrossRef]
- Basset-Mens, C.; Van Der Werf, H.M.G. Scenario-based environmental assessment of farming systems: The case of pig production in France. Agric. Ecosyst. Environ. 2005, 105, 127–144. [Google Scholar] [CrossRef]
- Asociación de Porcicultores del Ecuador [ASPE]. Estadísticas Porcícolas. 2016. Available online: https://www.aspe.org.ec/index.php/informacion/12-estadisticas (accessed on 27 March 2021).
- Open Lca. Available online: https://www.openlca.org/ (accessed on 5 January 2021).
- Recipe Recipe. Available online: www.rivm.nl/en/life-cycle-assessment-lca/recipe (accessed on 5 January 2021).
- Ramirez, A.D. The Life Cycle Greenhouse Gas Emissions of Rendered Products. Ph.D. Thesis, Harper Adams University, Edgmond, UK, 2012. [Google Scholar]
- Ramirez, A.D.; Rivela, B.; Boero, A.; Melendres, A.M. Lights and shadows of the environmental impacts of fossil-based electricity generation technologies: A contribution based on the Ecuadorian experience. Energy Policy 2019, 125, 467–477. [Google Scholar] [CrossRef]
- Ramirez, A.D.; Boero, A.; Rivela, B.; Melendres, A.M.; Espinoza, S.; Salas, D.A. Life cycle methods to analyze the environmental sustainability of electricity generation in Ecuador: Is decarbonization the right path? Renew. Sustain. Energy Rev. 2020, 134, 110373. [Google Scholar] [CrossRef]
- Compendio estadístico, INEC. Available online: https://www.ecuadorencifras.gob.ec/compendio-estadistico-2016/ (accessed on 27 March 2021).
- Ecoinvent. Available online: https://www.ecoinvent.org/ (accessed on 5 January 2021).
- Dong, H.; Mangino, J.; McAllister, T.A.; Hatfield, J.L.; Johnson, D.E.; Bartram, D.; Gibb, D.; Martin, J.H. Chapter 10: Emissions from livestock and manure management. In 2006 IPCC Guidelines for National Greenhouse Gas Inventories; Institute for Global Environmental Strategies: Hayama, Japan, 2006. [Google Scholar]
- Ramirez, A.D.; Humphries, A.C.; Woodgate, S.L.; Wilkinson, R.G. Greenhouse gas life cycle assessment of products arising from the rendering of mammalian animal byproducts in the UK. Environ. Sci. Technol. 2012, 46, 447–453. [Google Scholar] [CrossRef] [PubMed]

Publisher’s Note: MDPI stays neutral with regard to jurisdictional claims in published maps and institutional affiliations. |
© 2021 by the authors. Licensee MDPI, Basel, Switzerland. This article is an open access article distributed under the terms and conditions of the Creative Commons Attribution (CC BY) license (https://creativecommons.org/licenses/by/4.0/).