
Reliability Evaluation of Lithium-Ion Batteries for E-Mobility Applications from Practical and Technical Perspectives: A Case Study

 ,
,  ,
,  ,
, 
 and
and 
Abstract
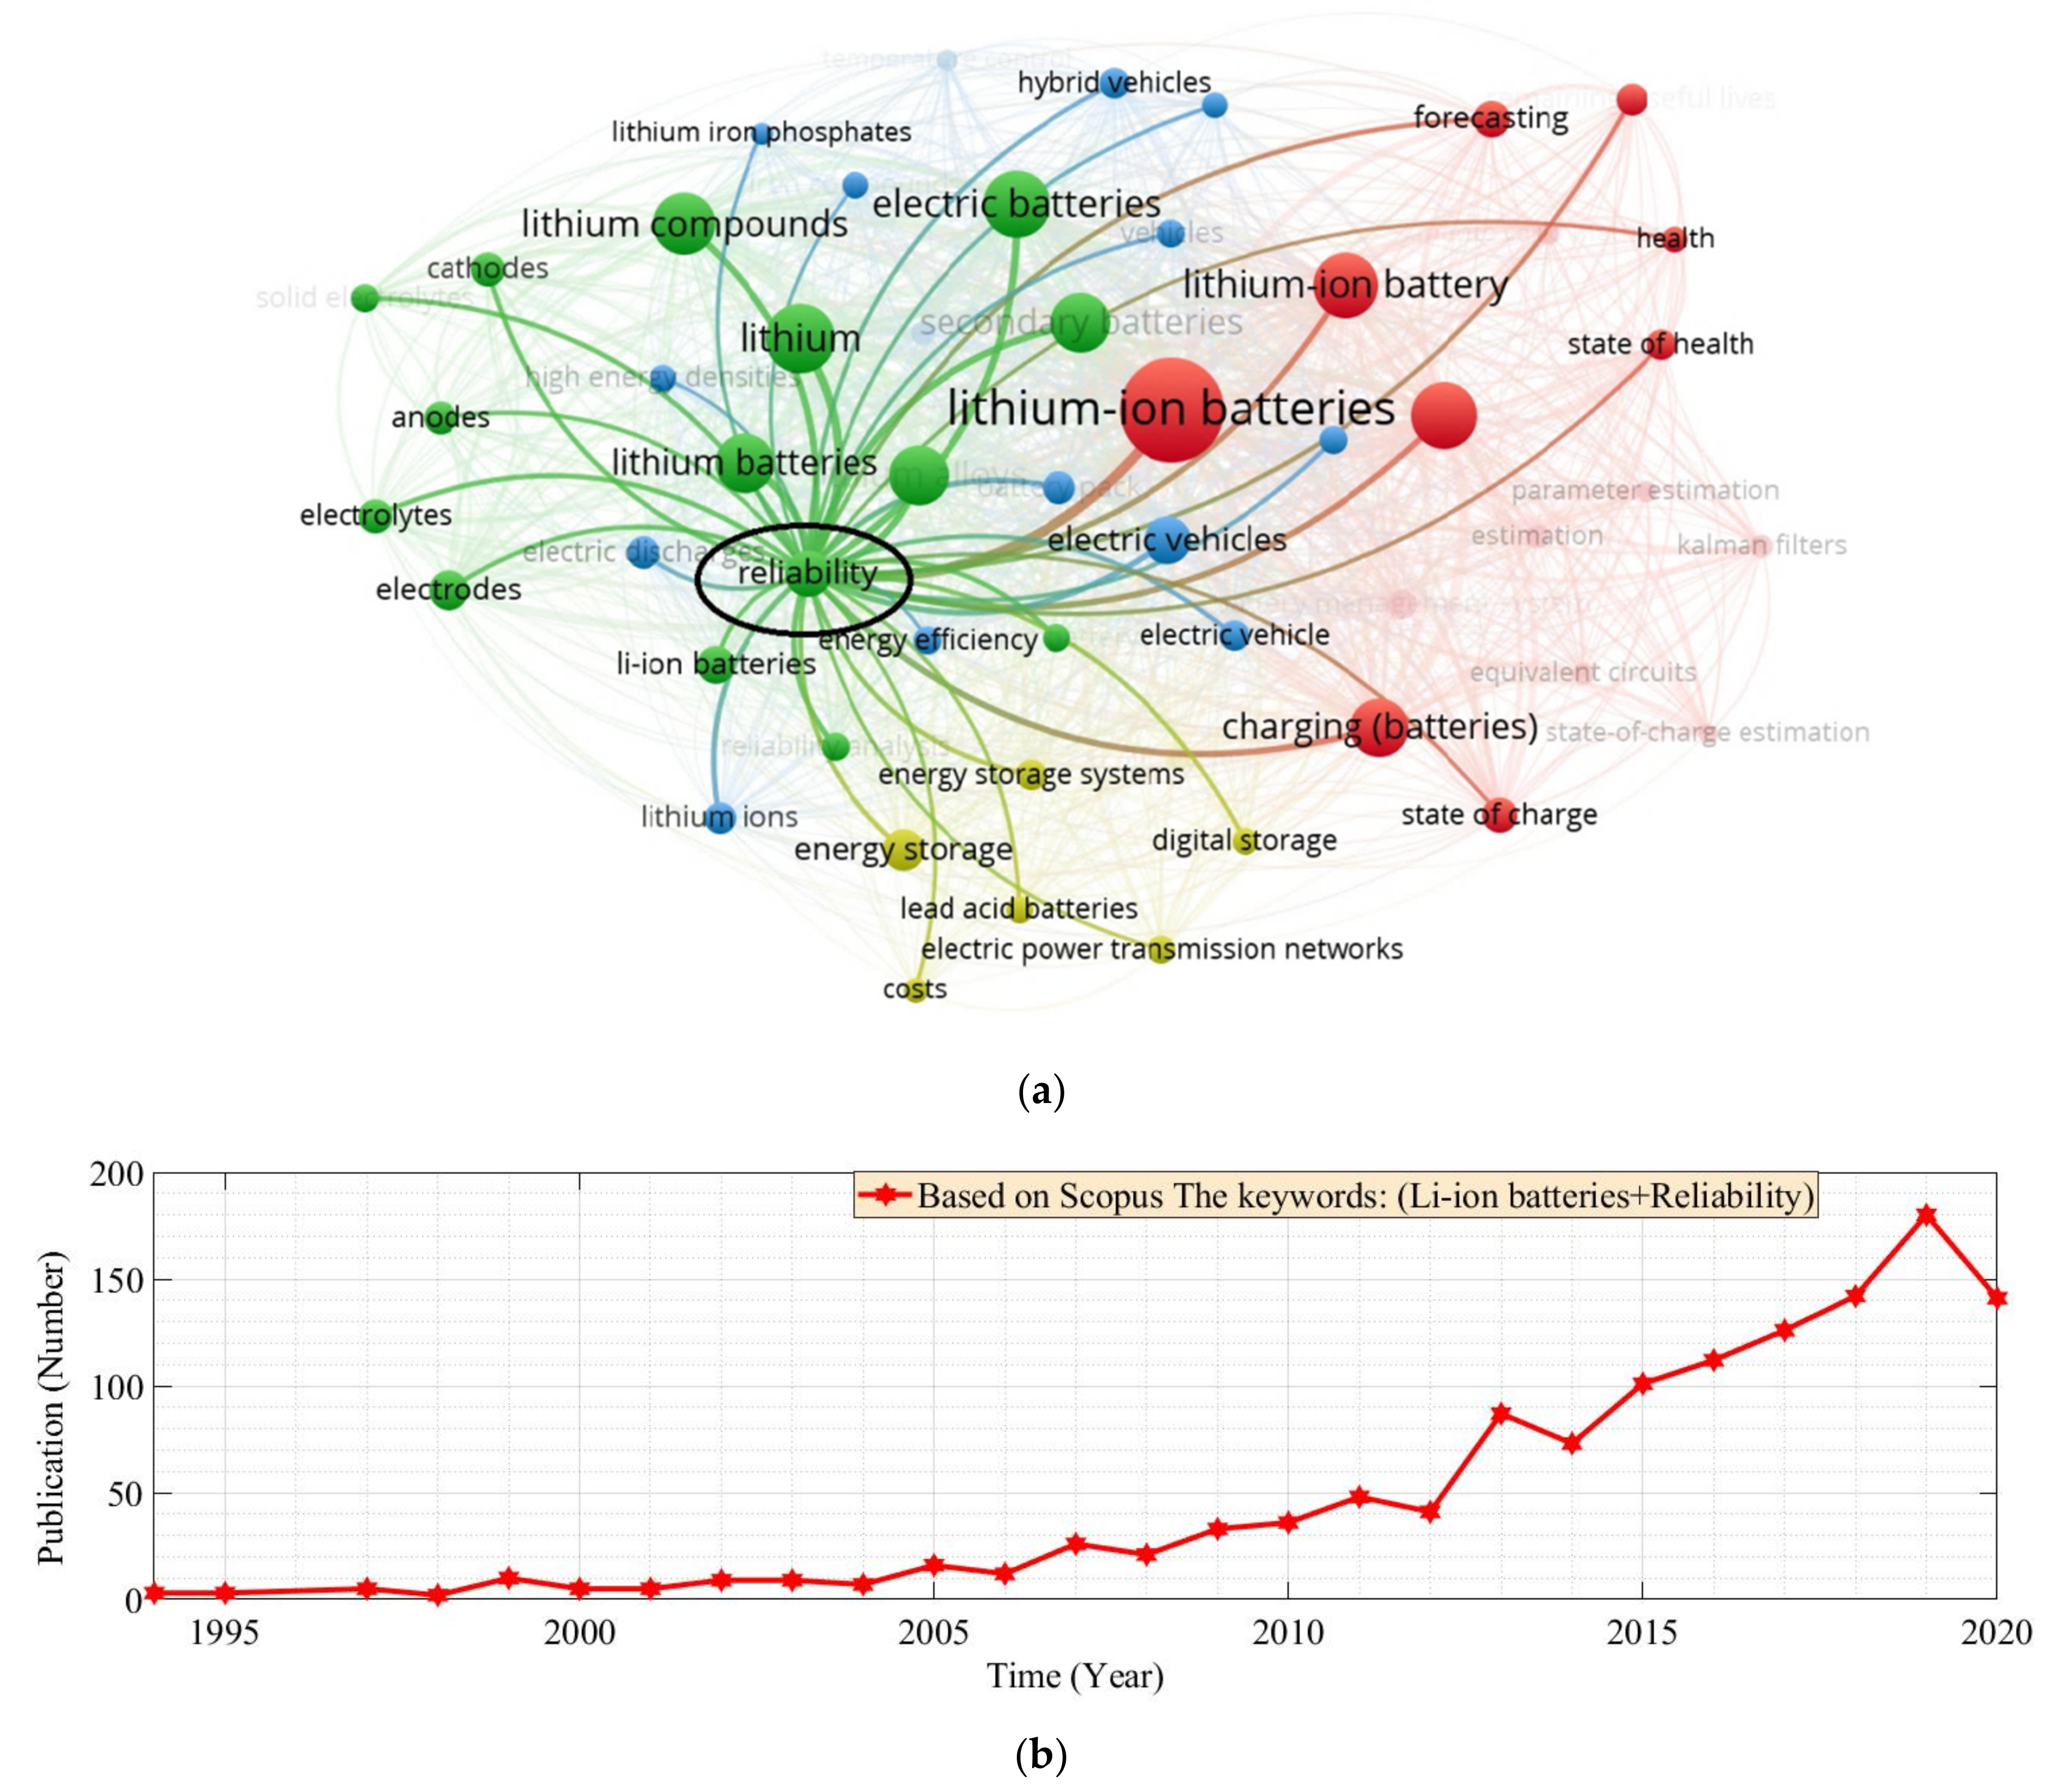
:1. Introduction
- reliability indicators and their connection with degradation modes, degradation mechanisms, and degradation conditions need to be taken into consideration;
- multi-degradation conditions (different temperatures and C-rates) of the Li-ion batteries need to be investigated as to their effect on the reliability indicators;
- the reliability of the Li-ion battery in terms of the time and frequency domains need to be considered;
- degradation conditions and their comparison from the reliability standpoint should be investigated.
- Investigating the concept of the reliability of Li-ion batteries;
- A comprehensive investigation of the degradation of Li-ion batteries in normal operation;
- The contribution of CF, PF, and open-circuit voltage to Li-ion batteries’ reliability;
- The role of the reliability indicators in the performance of Li-ion batteries.
2. Li-Ion Battery Technologies
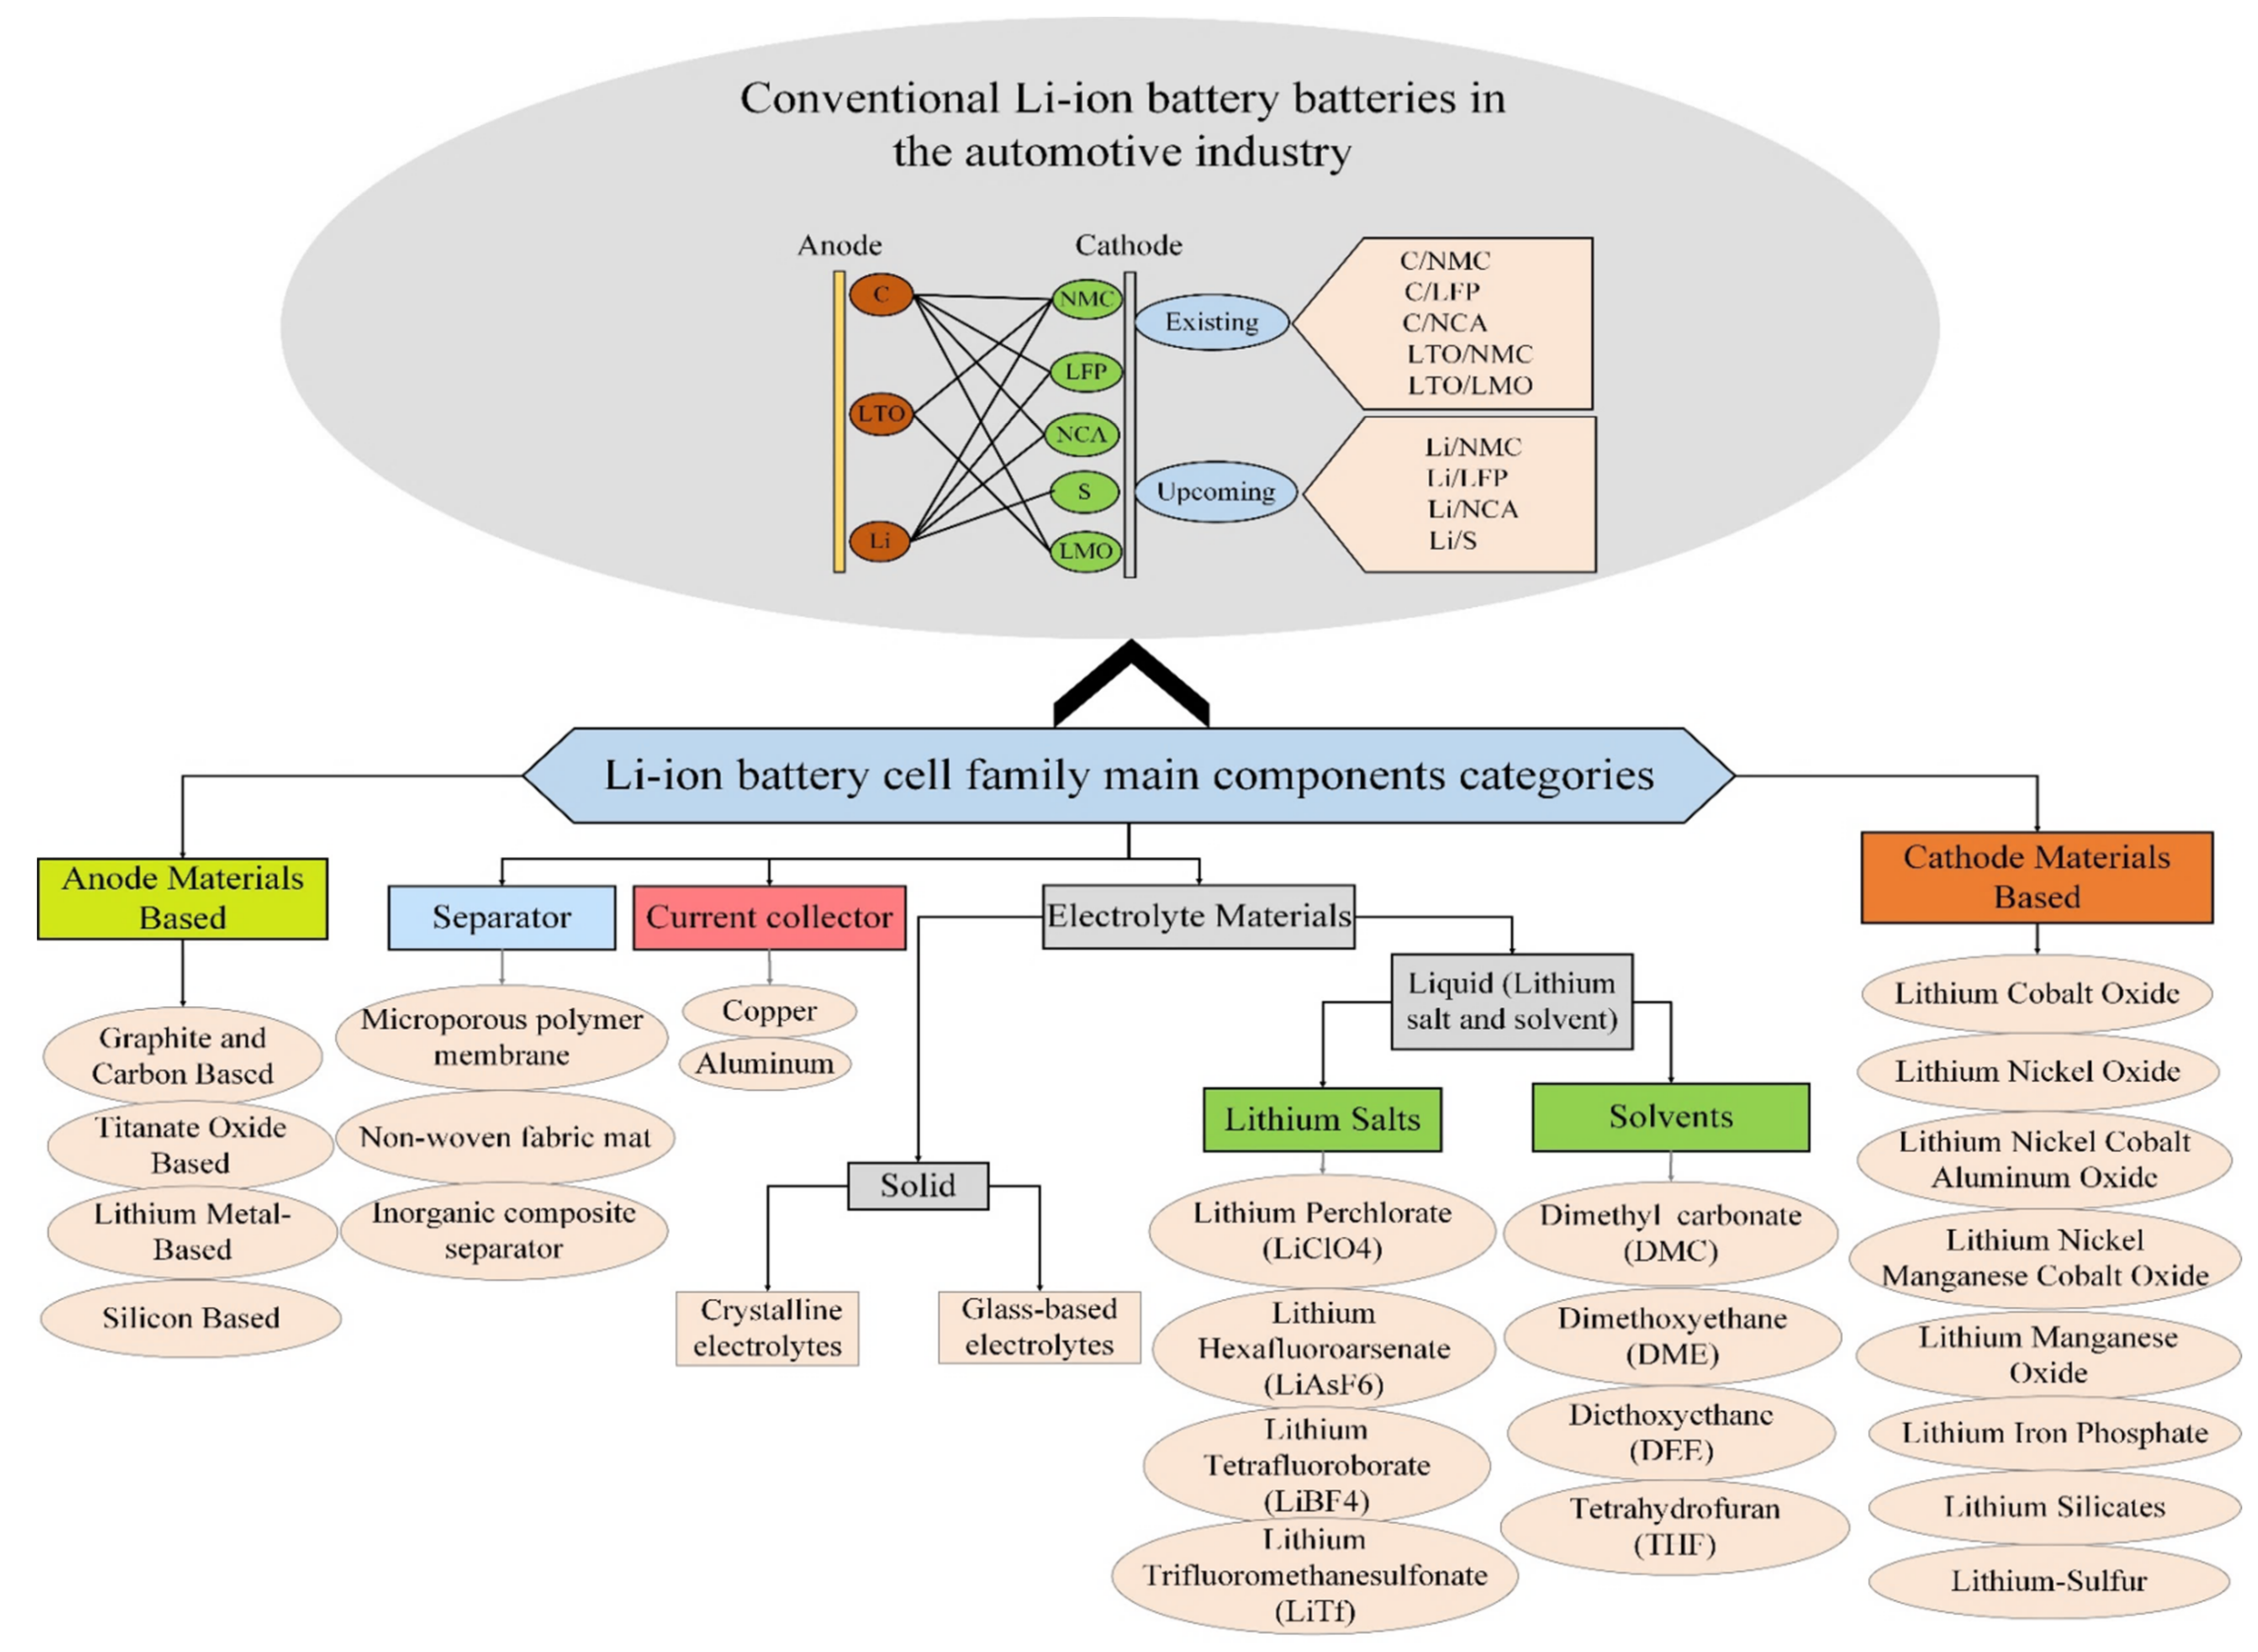
2.1. The Components of Li-Ion Batteries
2.2. The Physical Implementation of Li-Ion Batteries
2.3. Definitions Regarding Li-Ion Batteries
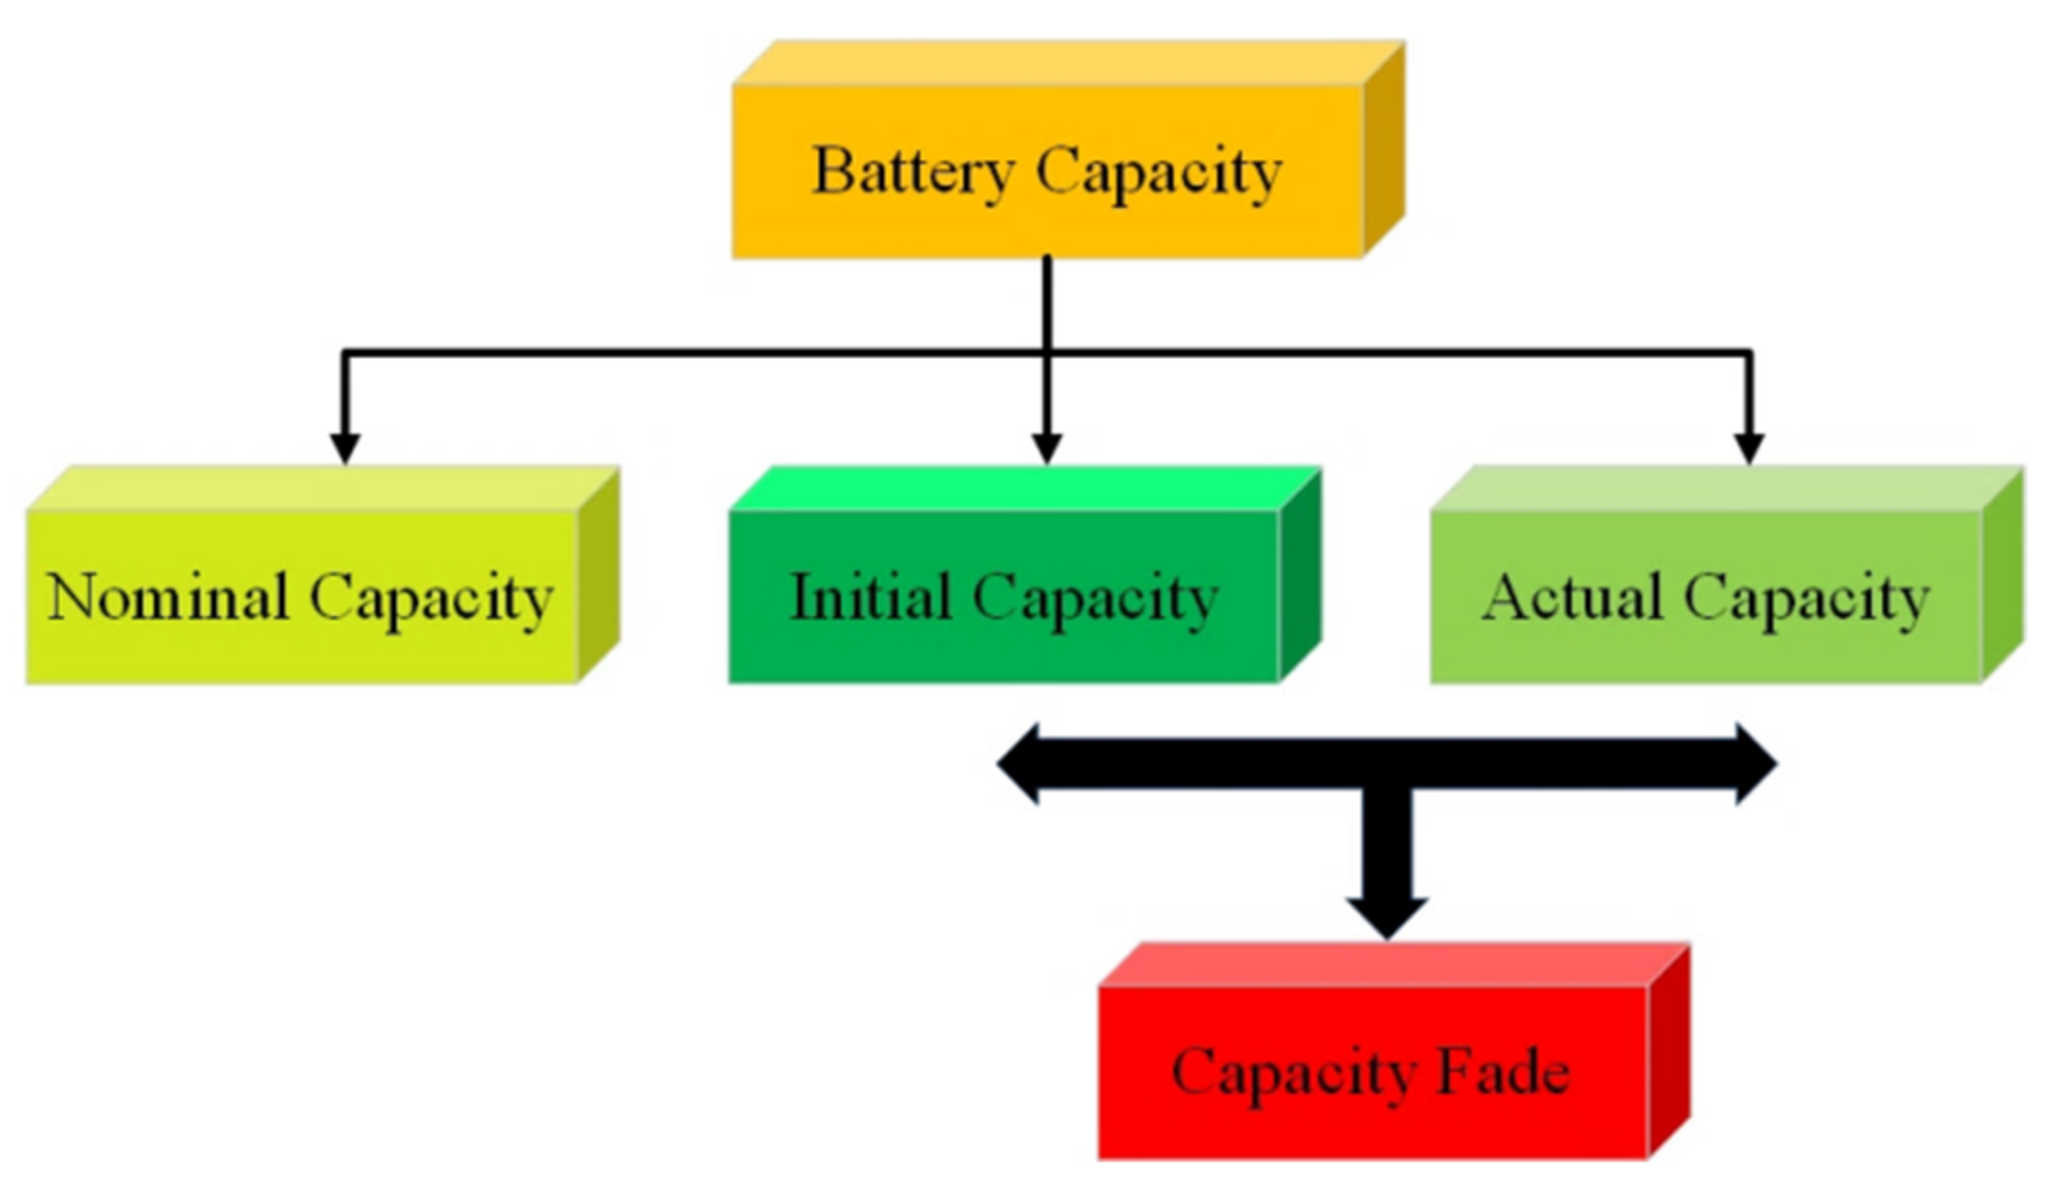
2.3.1. Voltage and Capacity
2.3.2. State of Charge and Depth of Discharge
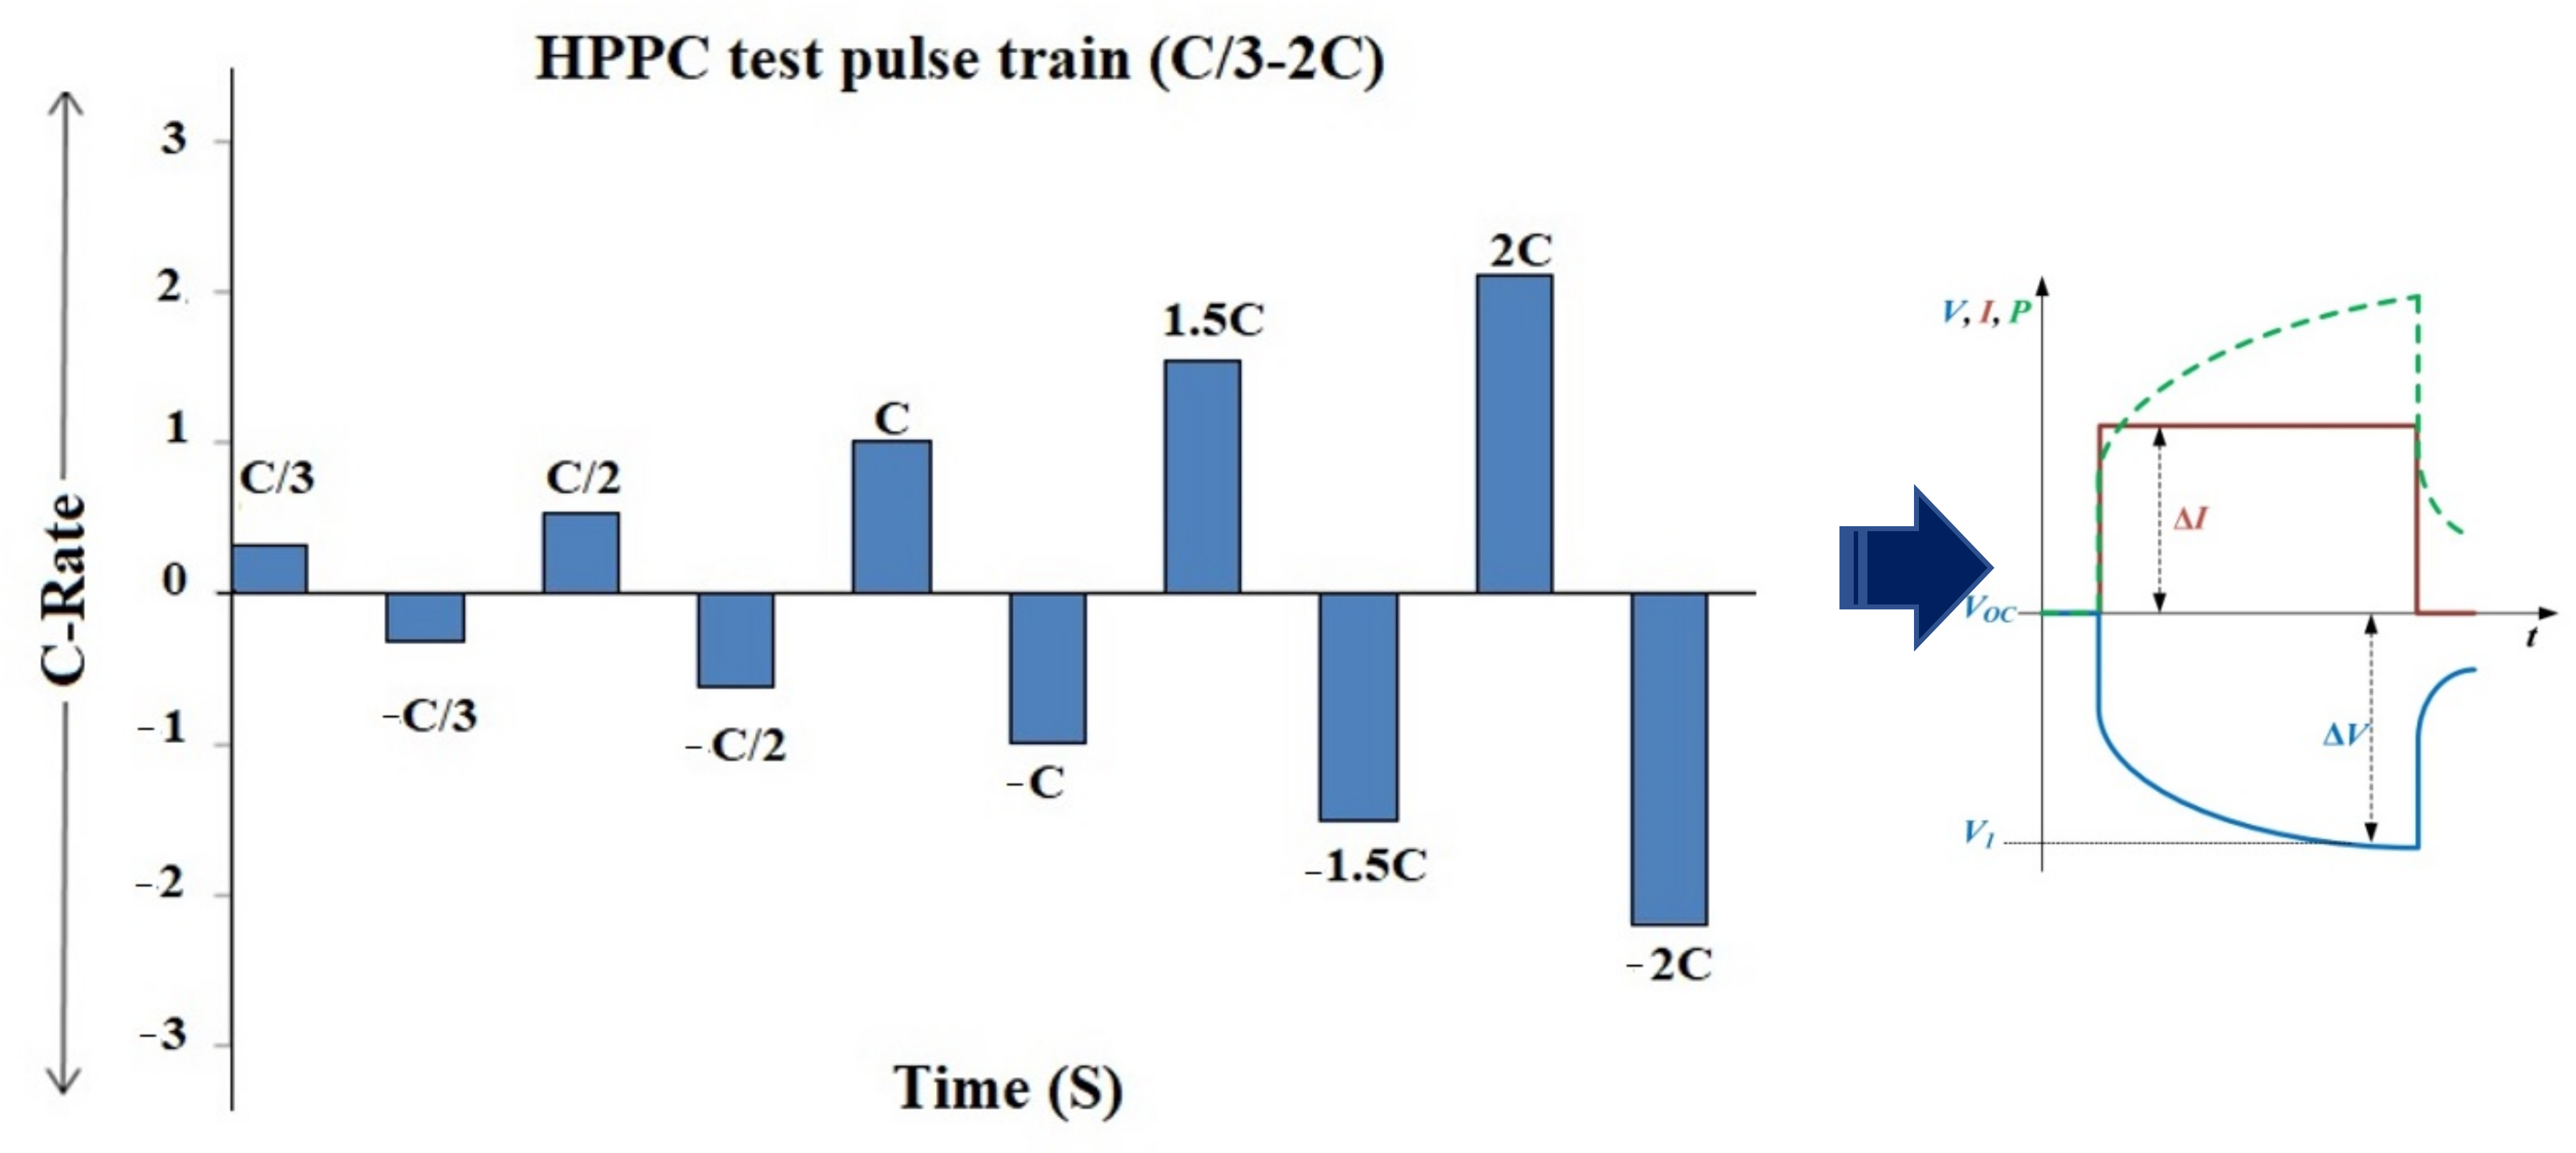
2.3.3. C-Rate
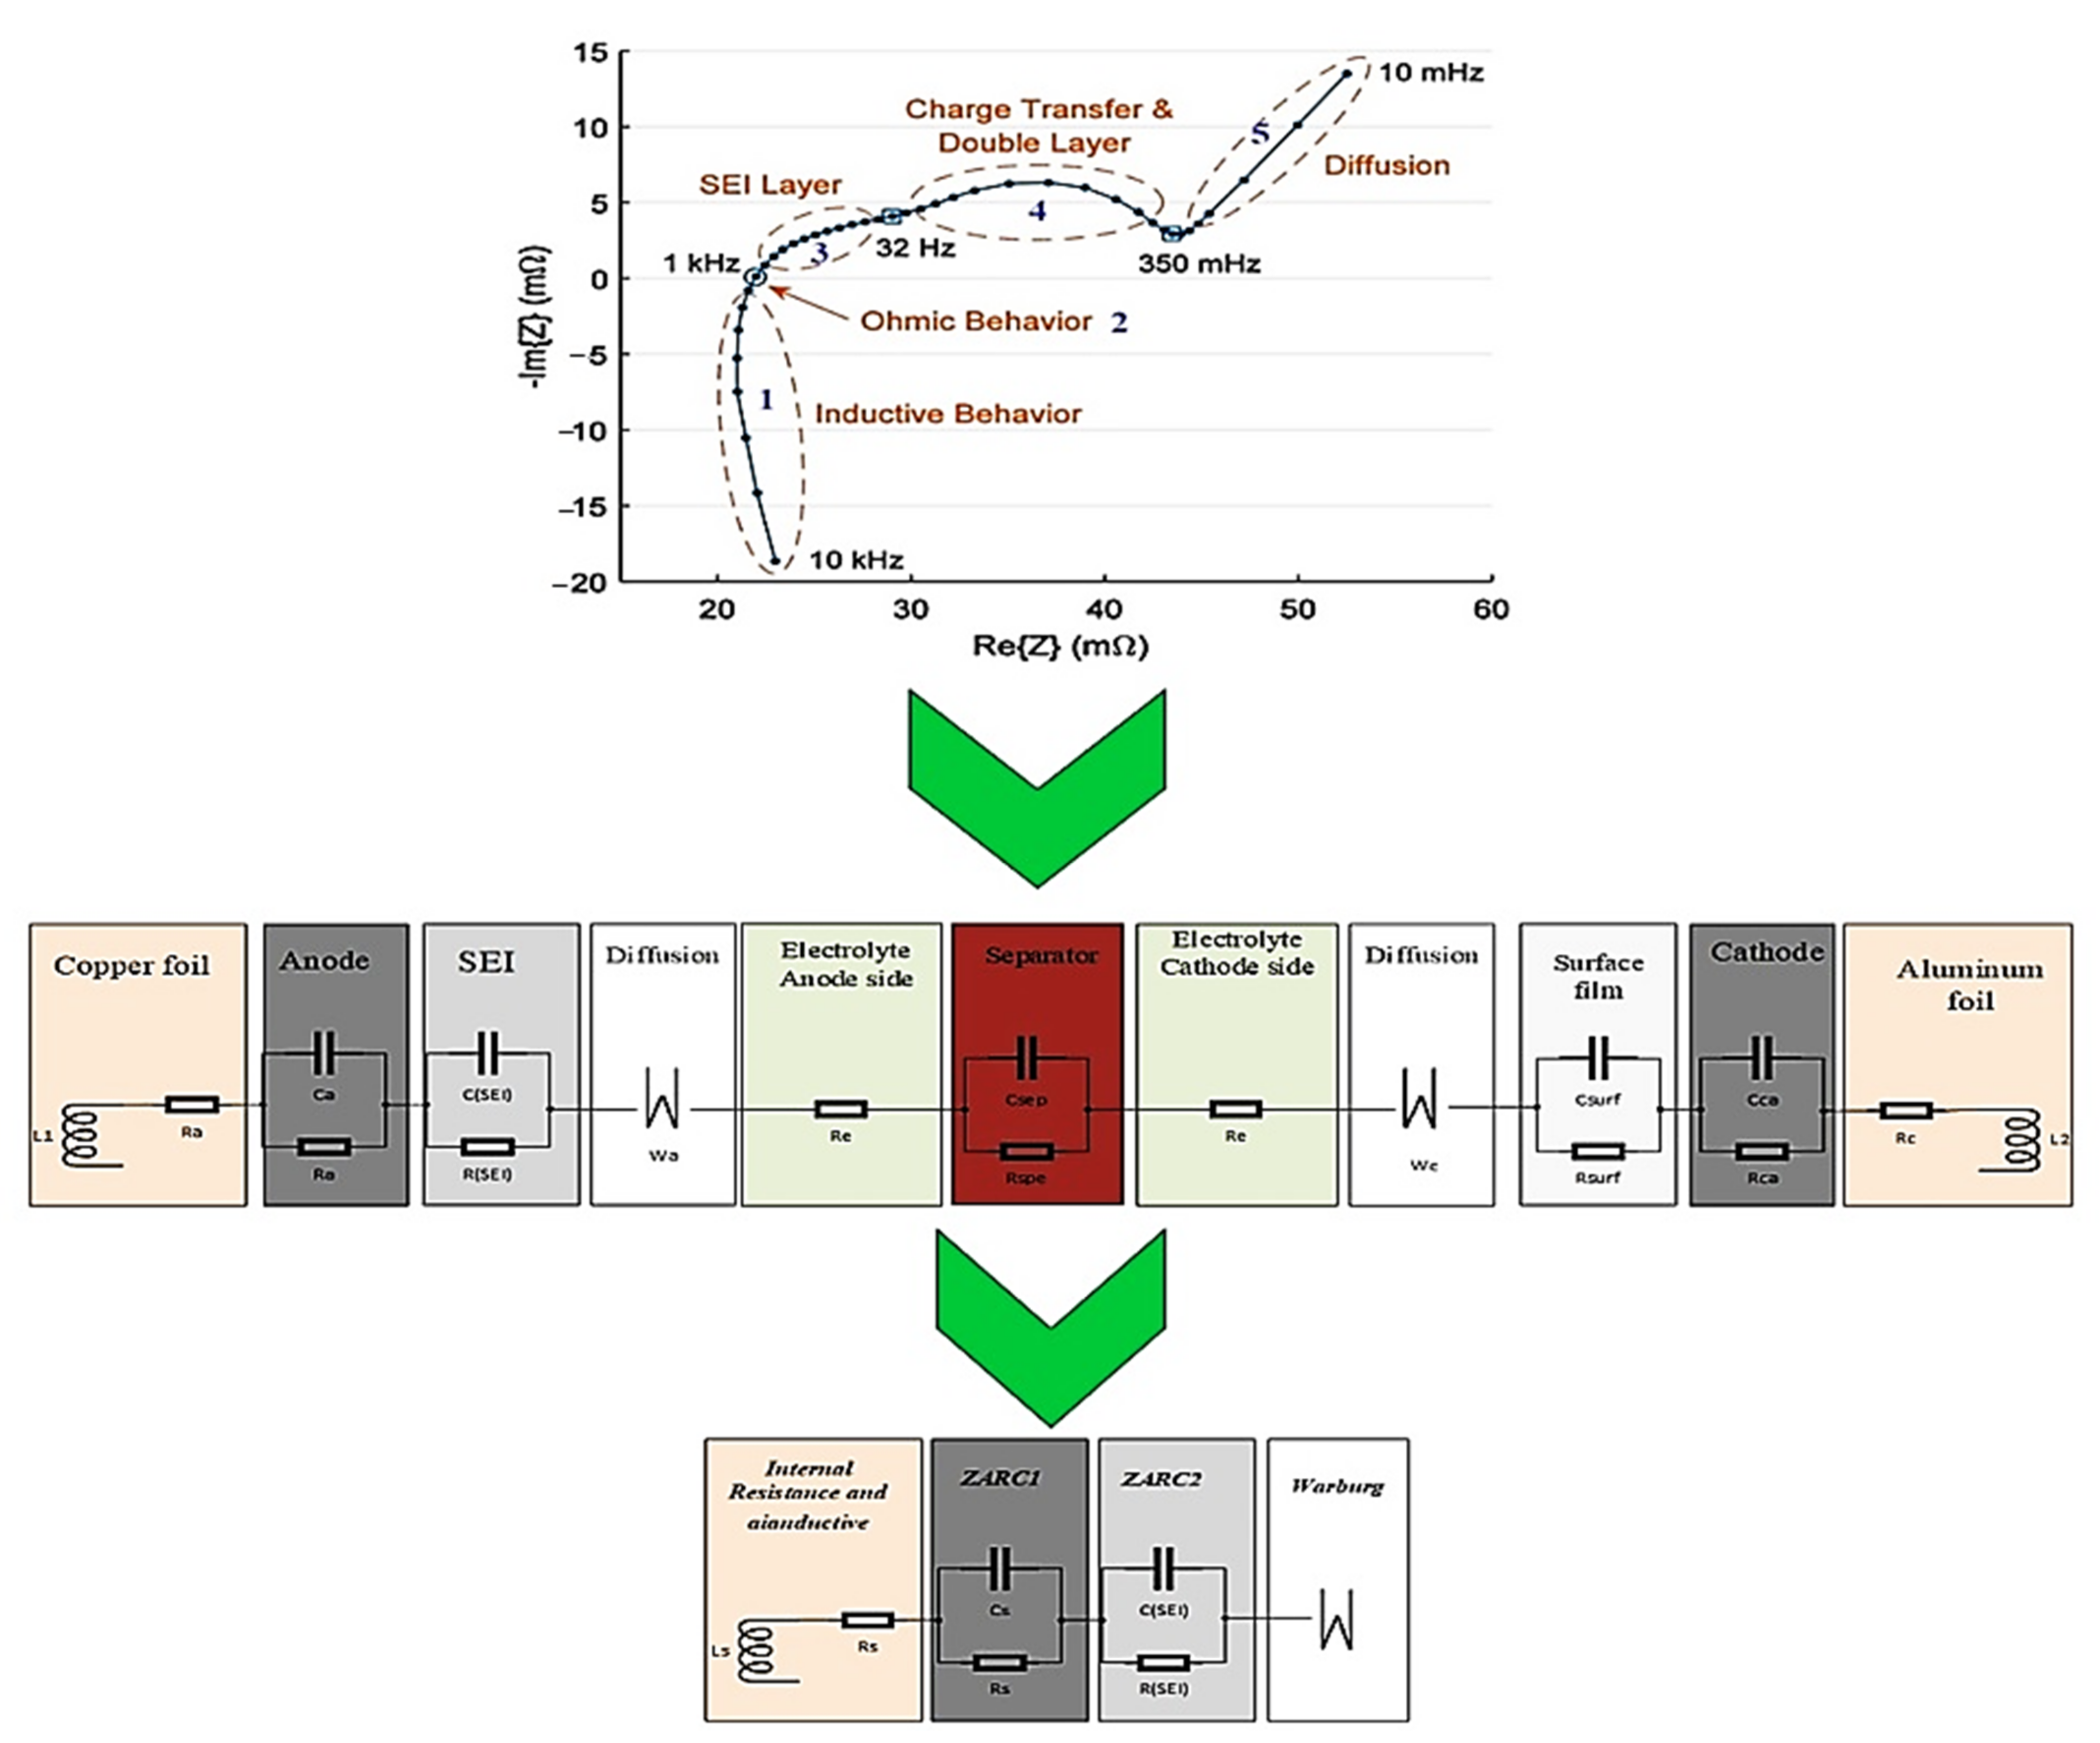
2.3.4. Internal Resistance
2.3.5. Energy and Power
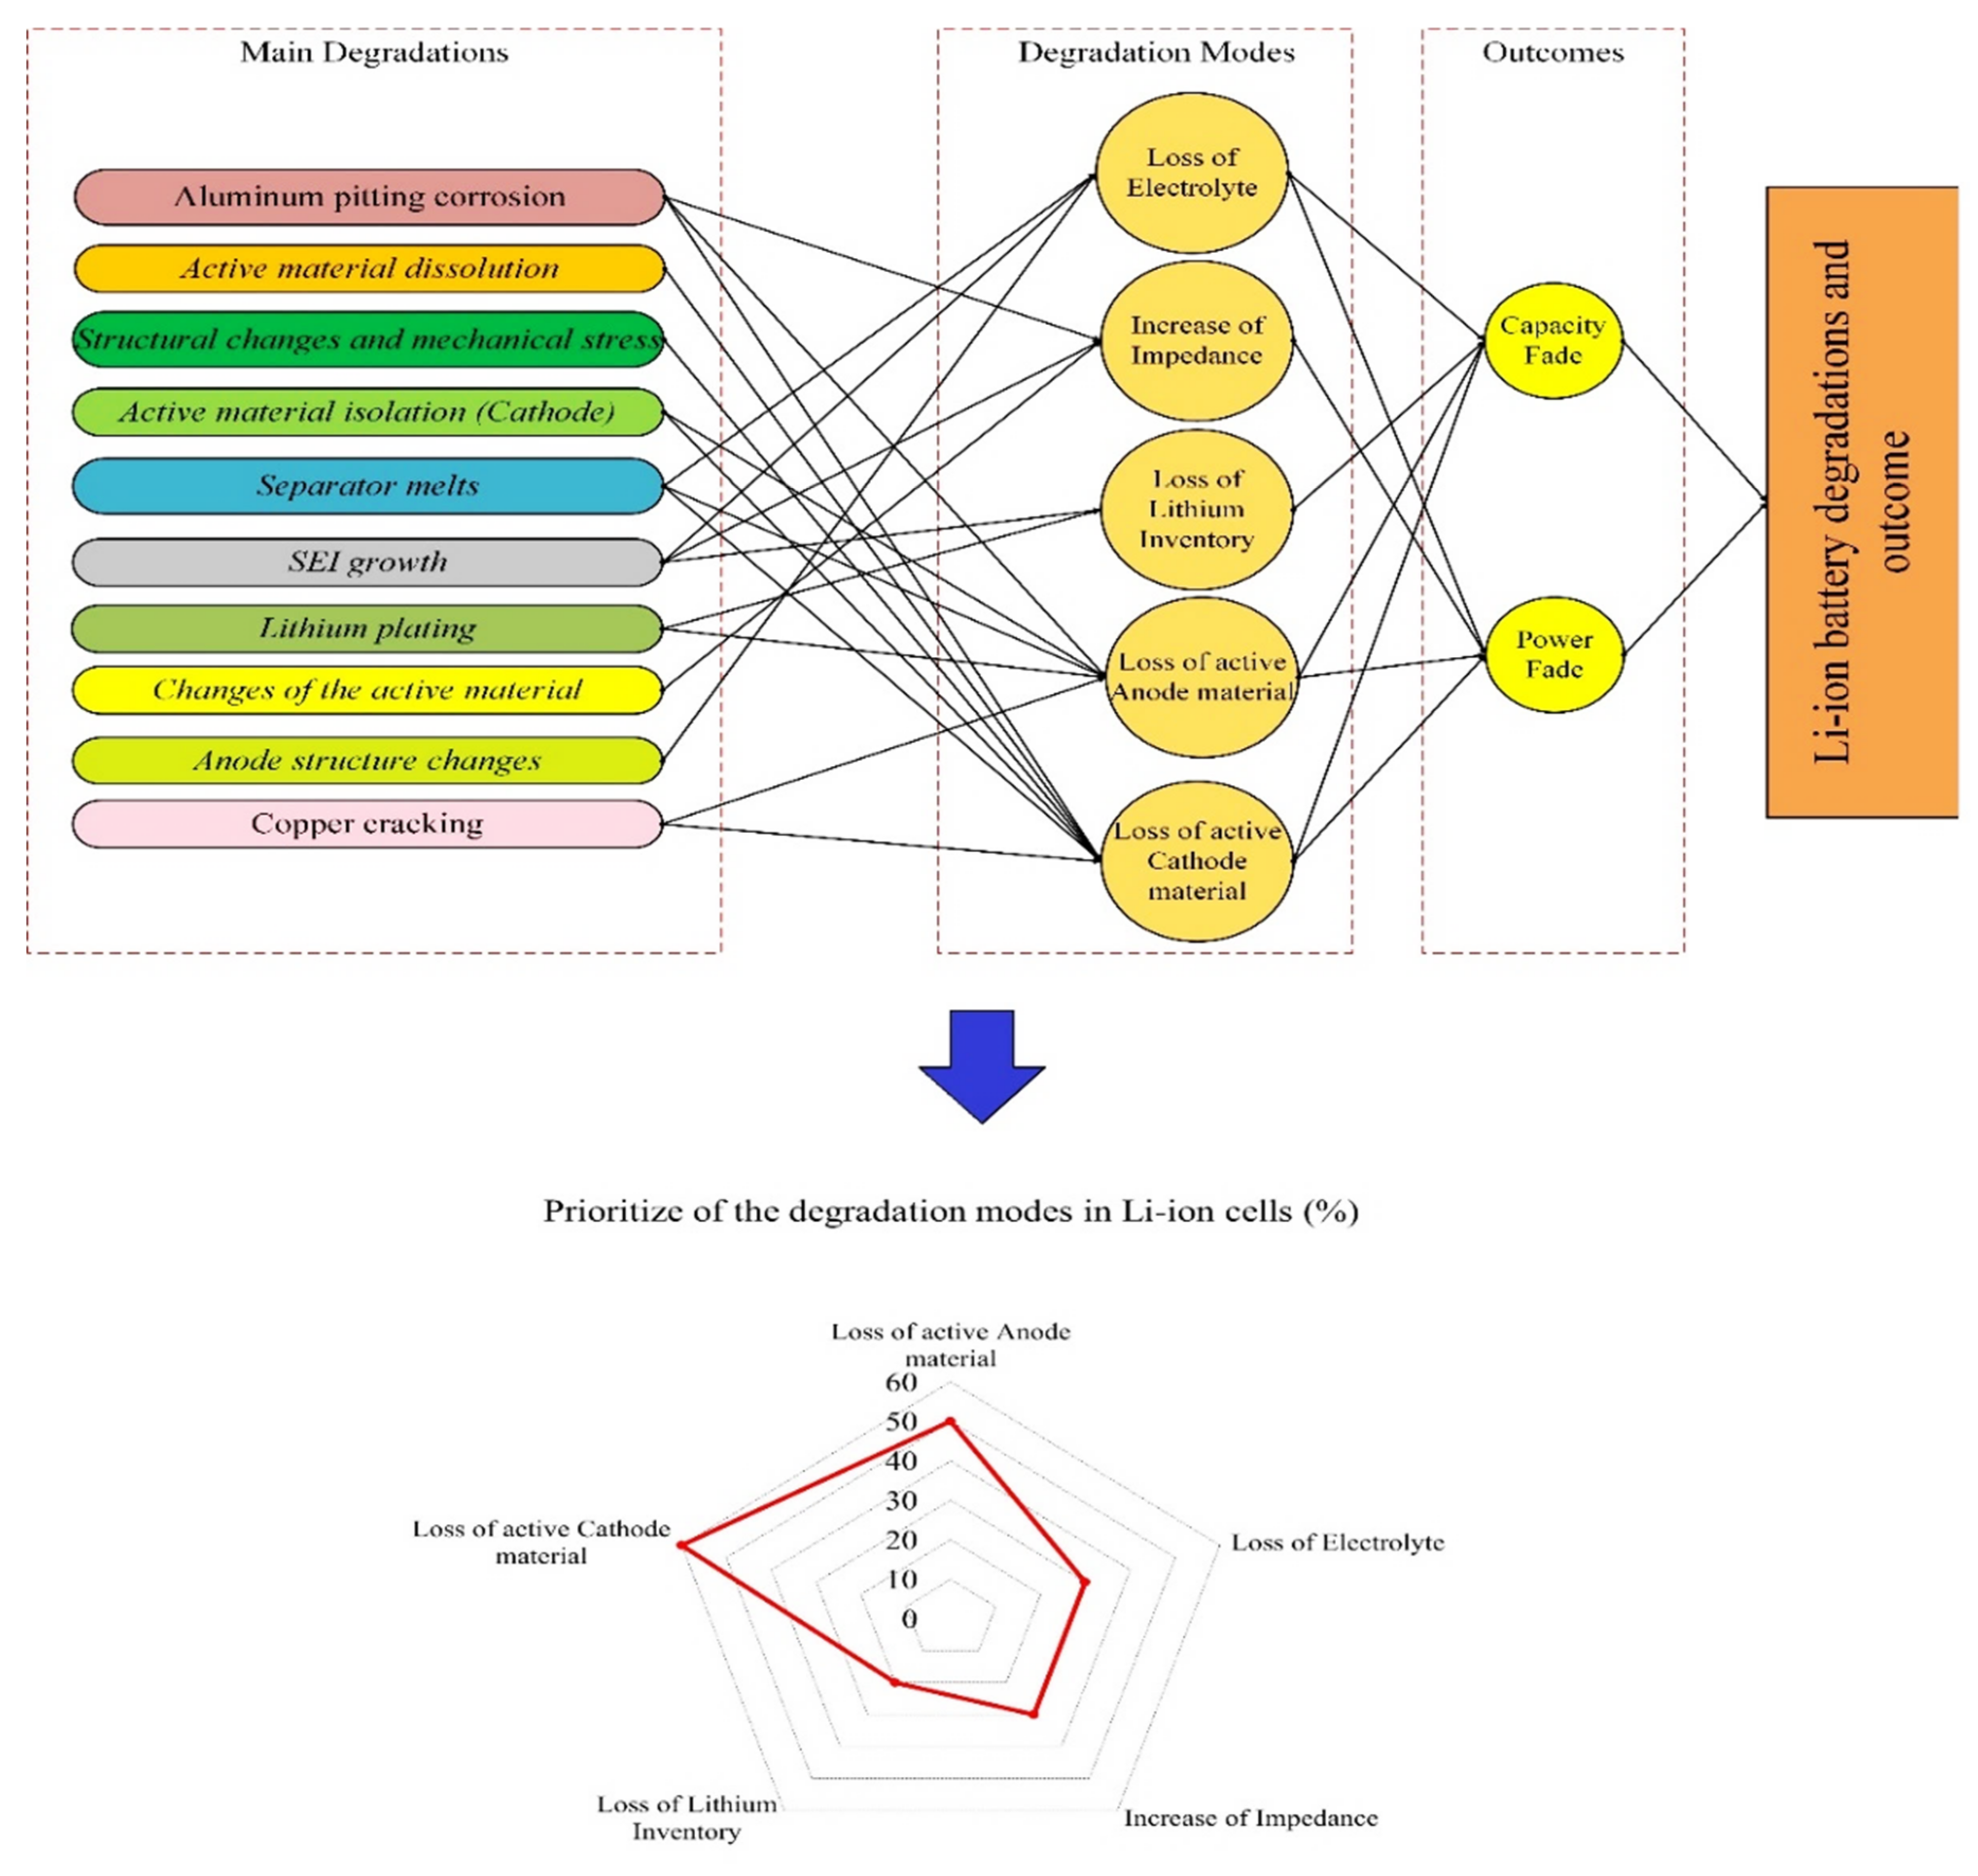
3. Degradation in a Li-Ion Battery; Its Causes and Outcomes
- High temperature;
- Low temperature;
- High discharge current;
- High charge current;
- Over-charge (high SoC);
- Over-discharge (Low SoC).
- Low/high temperature [5,36]: At low temperatures, the diffusion rate of lithium ions into graphite during the charging process becomes slow, and Li metal deposition on the surface of the negative electrode can take place with the risk of dendrite formation. This mechanism increases internal resistance and lithium plating (which can ultimately result in a short circuit between the electrodes). High temperatures accelerate the growth rate of the SEI layer on the anode, resulting in accelerated rates of LLI and an increase in the overall cell resistance.
- Over-charge/discharge [37,38]: During overcharging, active lithium is not available on the cathode side and there is no more room for lithium from the anode side. This increases the chance of lithium plating creation and internal heat generation (over-heating). Over-discharging increases the internal heat generation, and the anode potential enhances unusually which can lead to the anodic dissolution of the current collector from the anode side.
- High C-rate charge and discharge [39,40]: High charge and discharge currents lead to the same degradation reactions as over-discharge and over-charge. Moreover, high currents also increase the internal temperature and result in metallic lithium plating of the anode due to its limited ability to accept Li-ions at high rates.
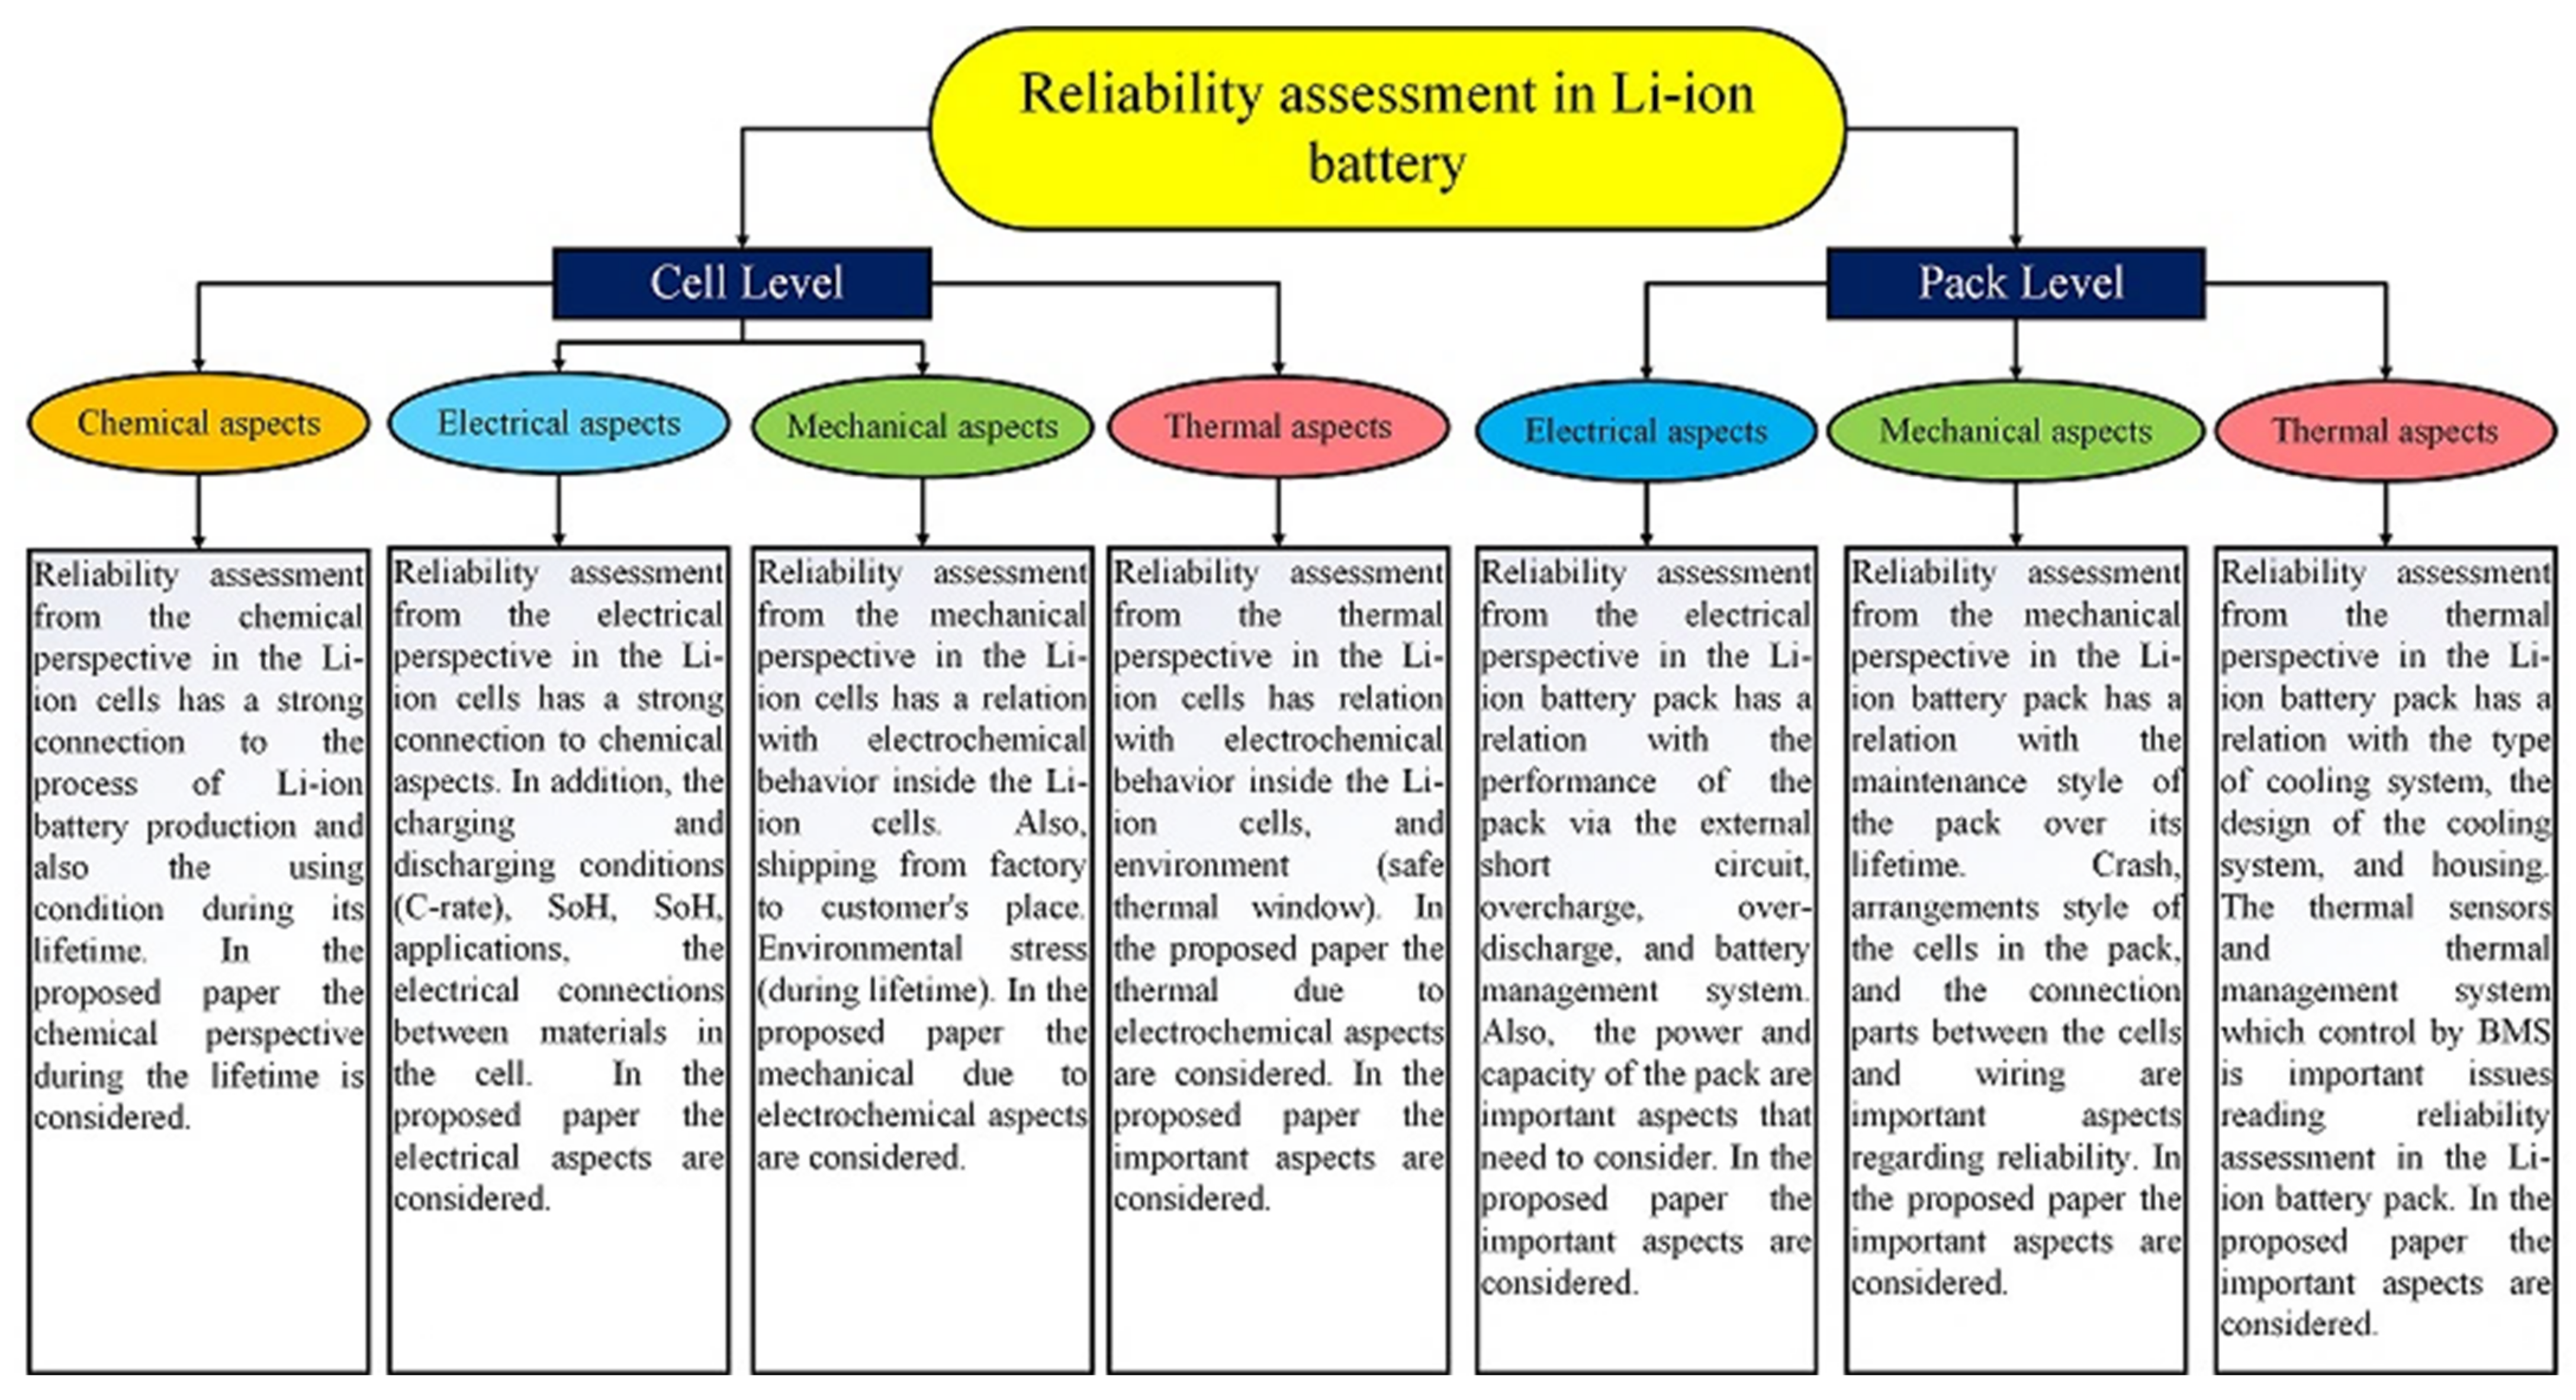
4. Reliability Appraisement for the Li-Ion Batteries
4.1. Definitions Regarding Li-Ion Batteries
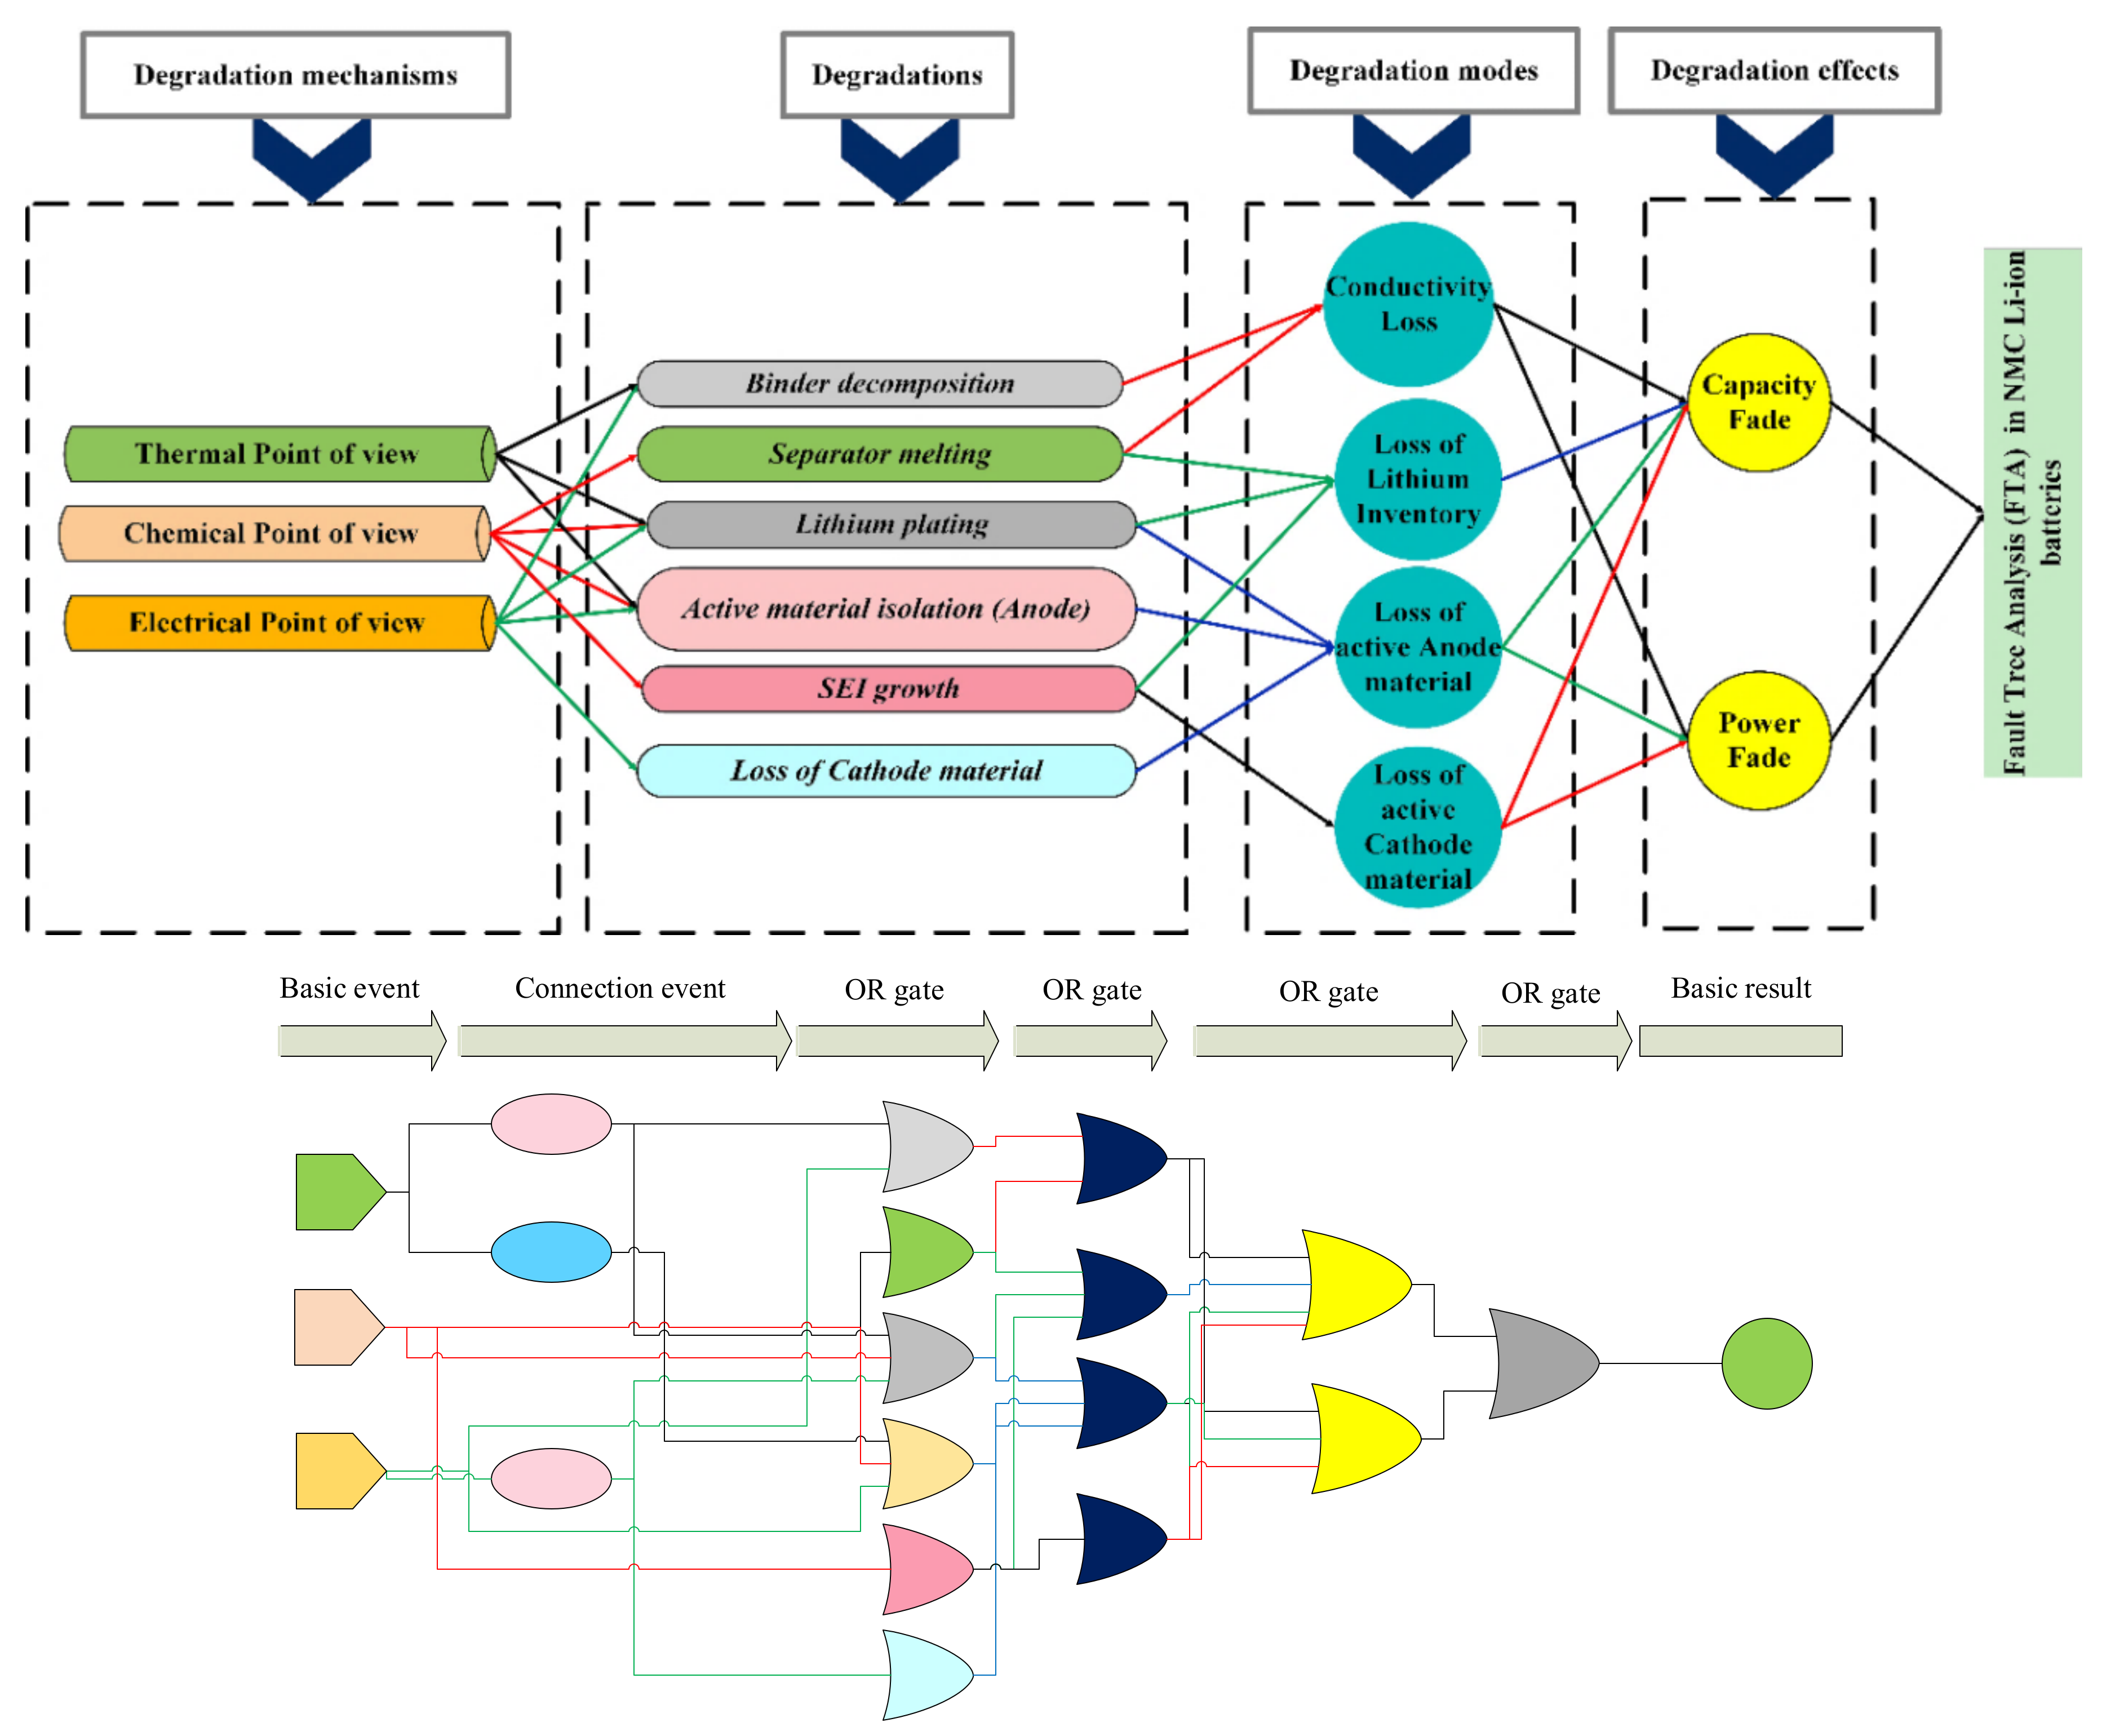
4.1.1. Fault Tree Analysis (FTA)
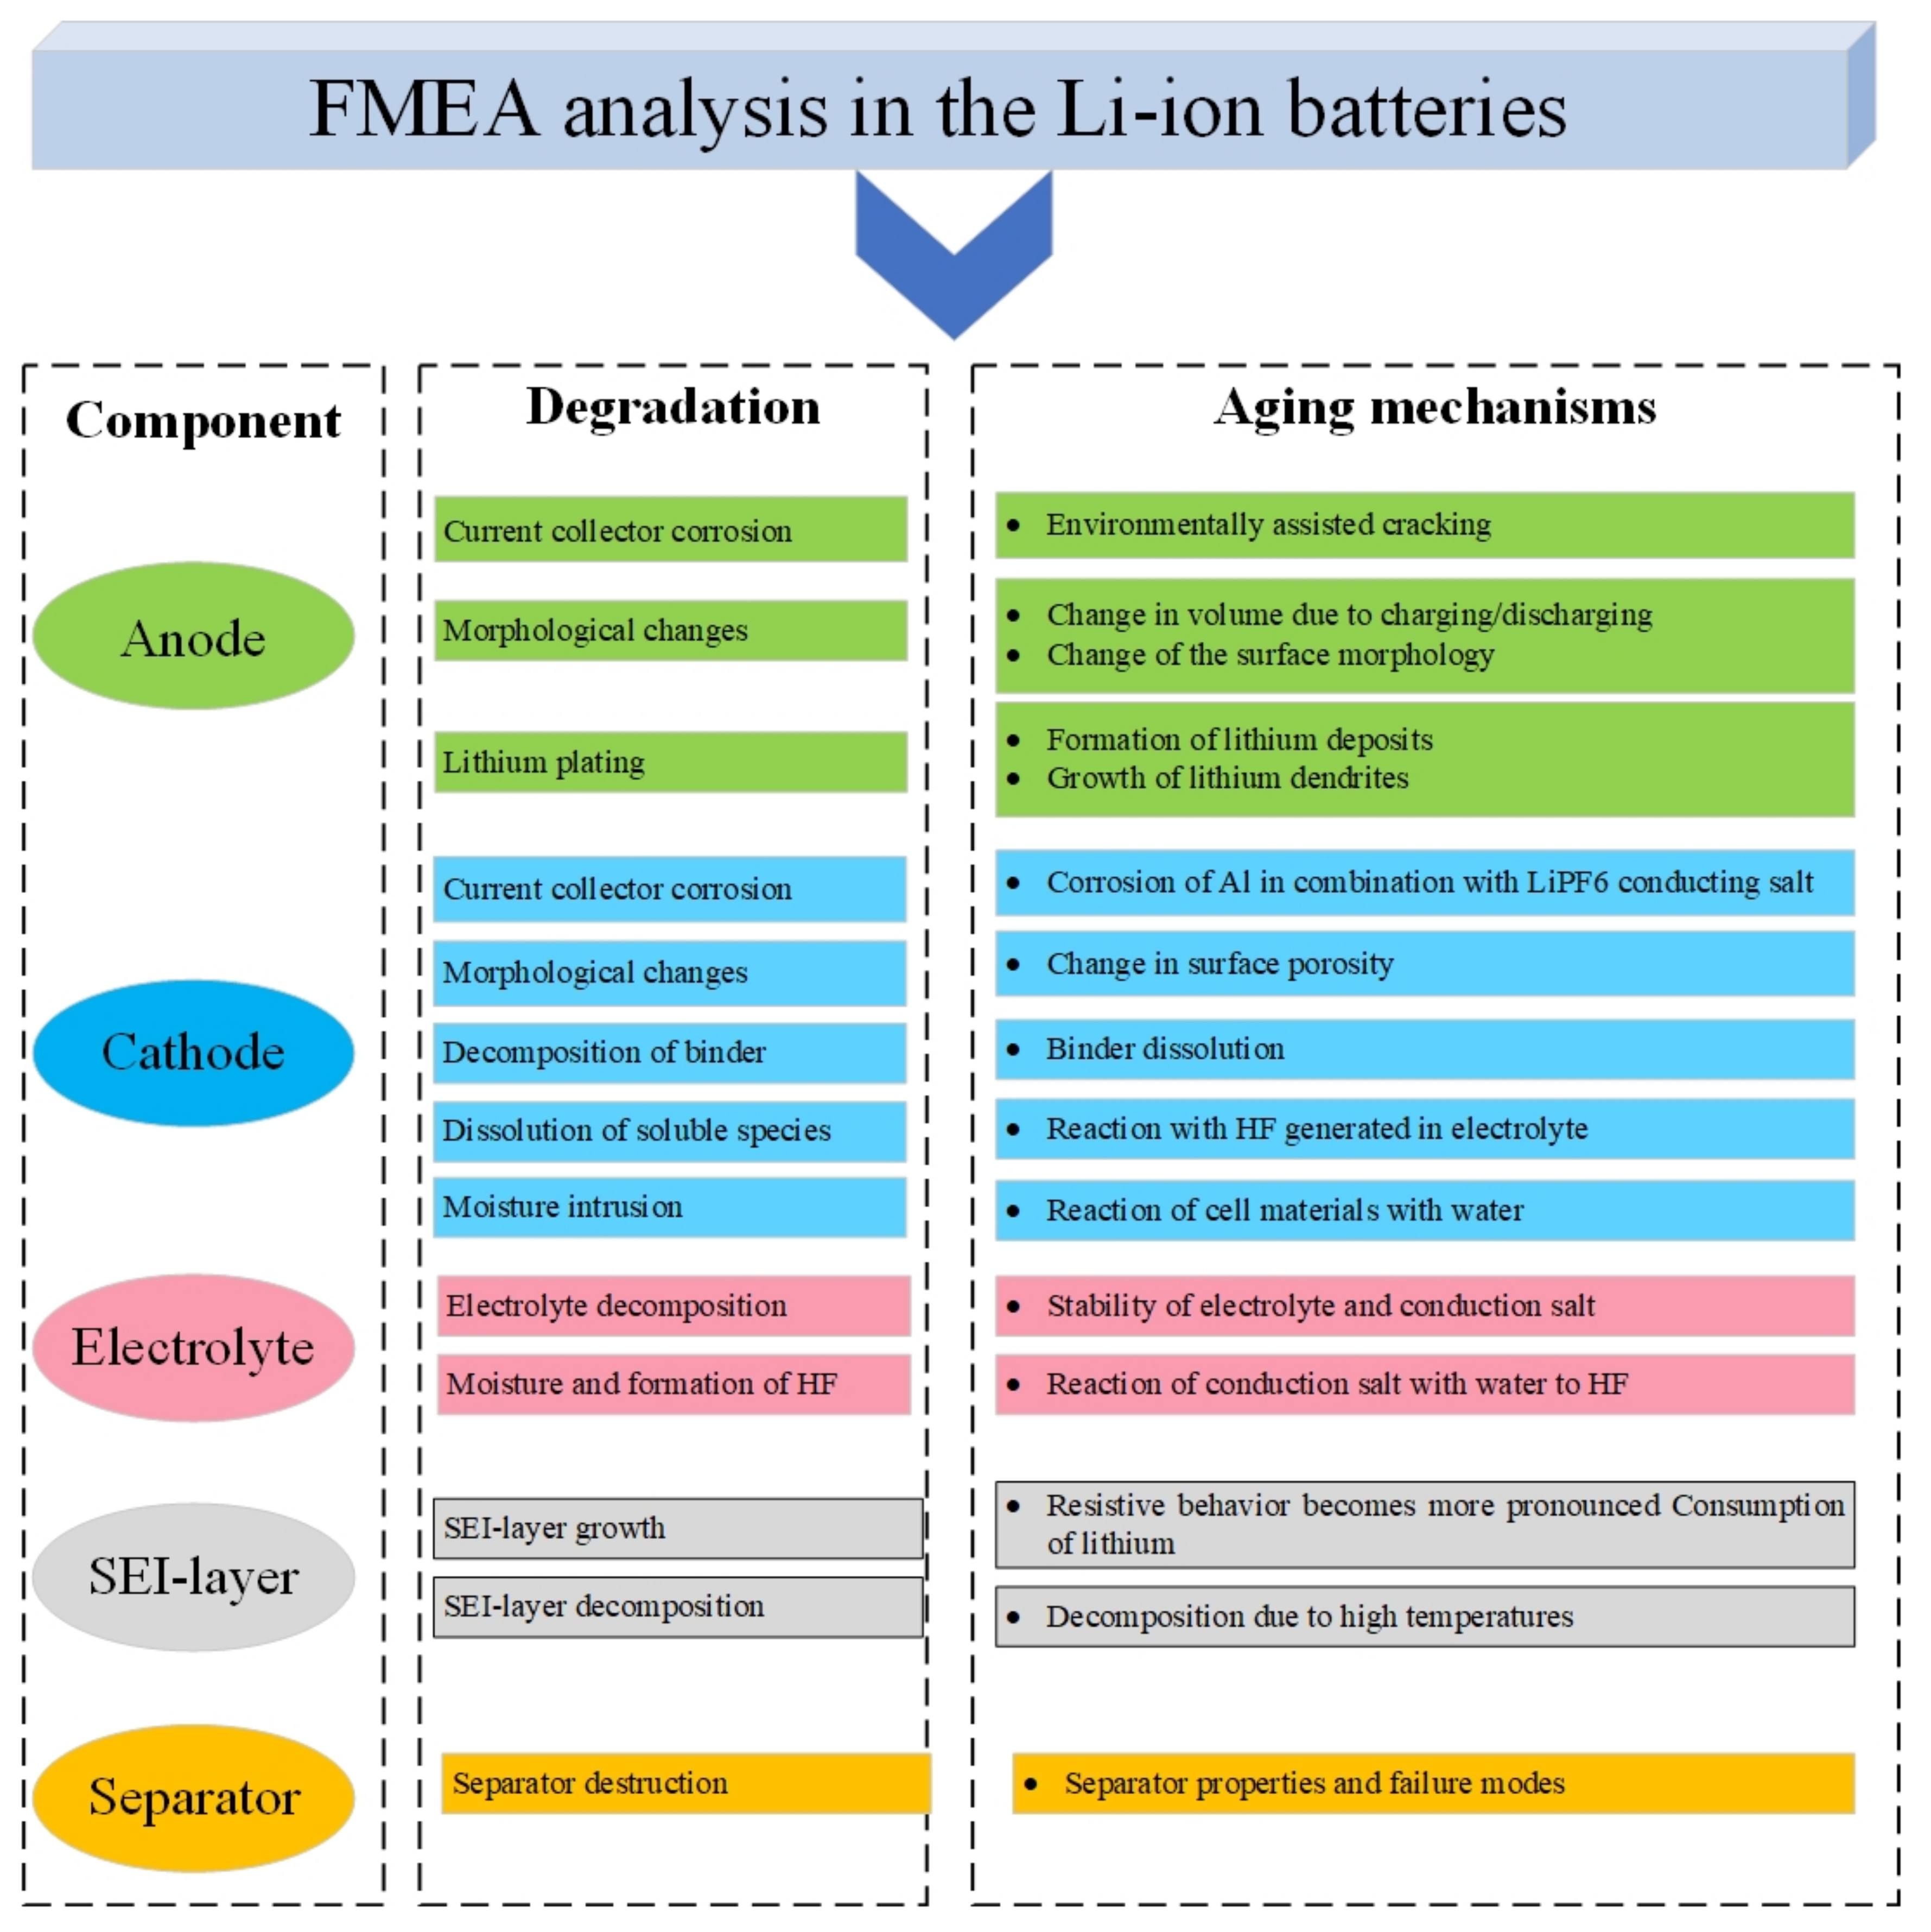
4.1.2. Failure Mode and Effects Analysis (FMEA)
4.1.3. Quantitative Analysis: Time-Domain
4.2. Reliability Indicators
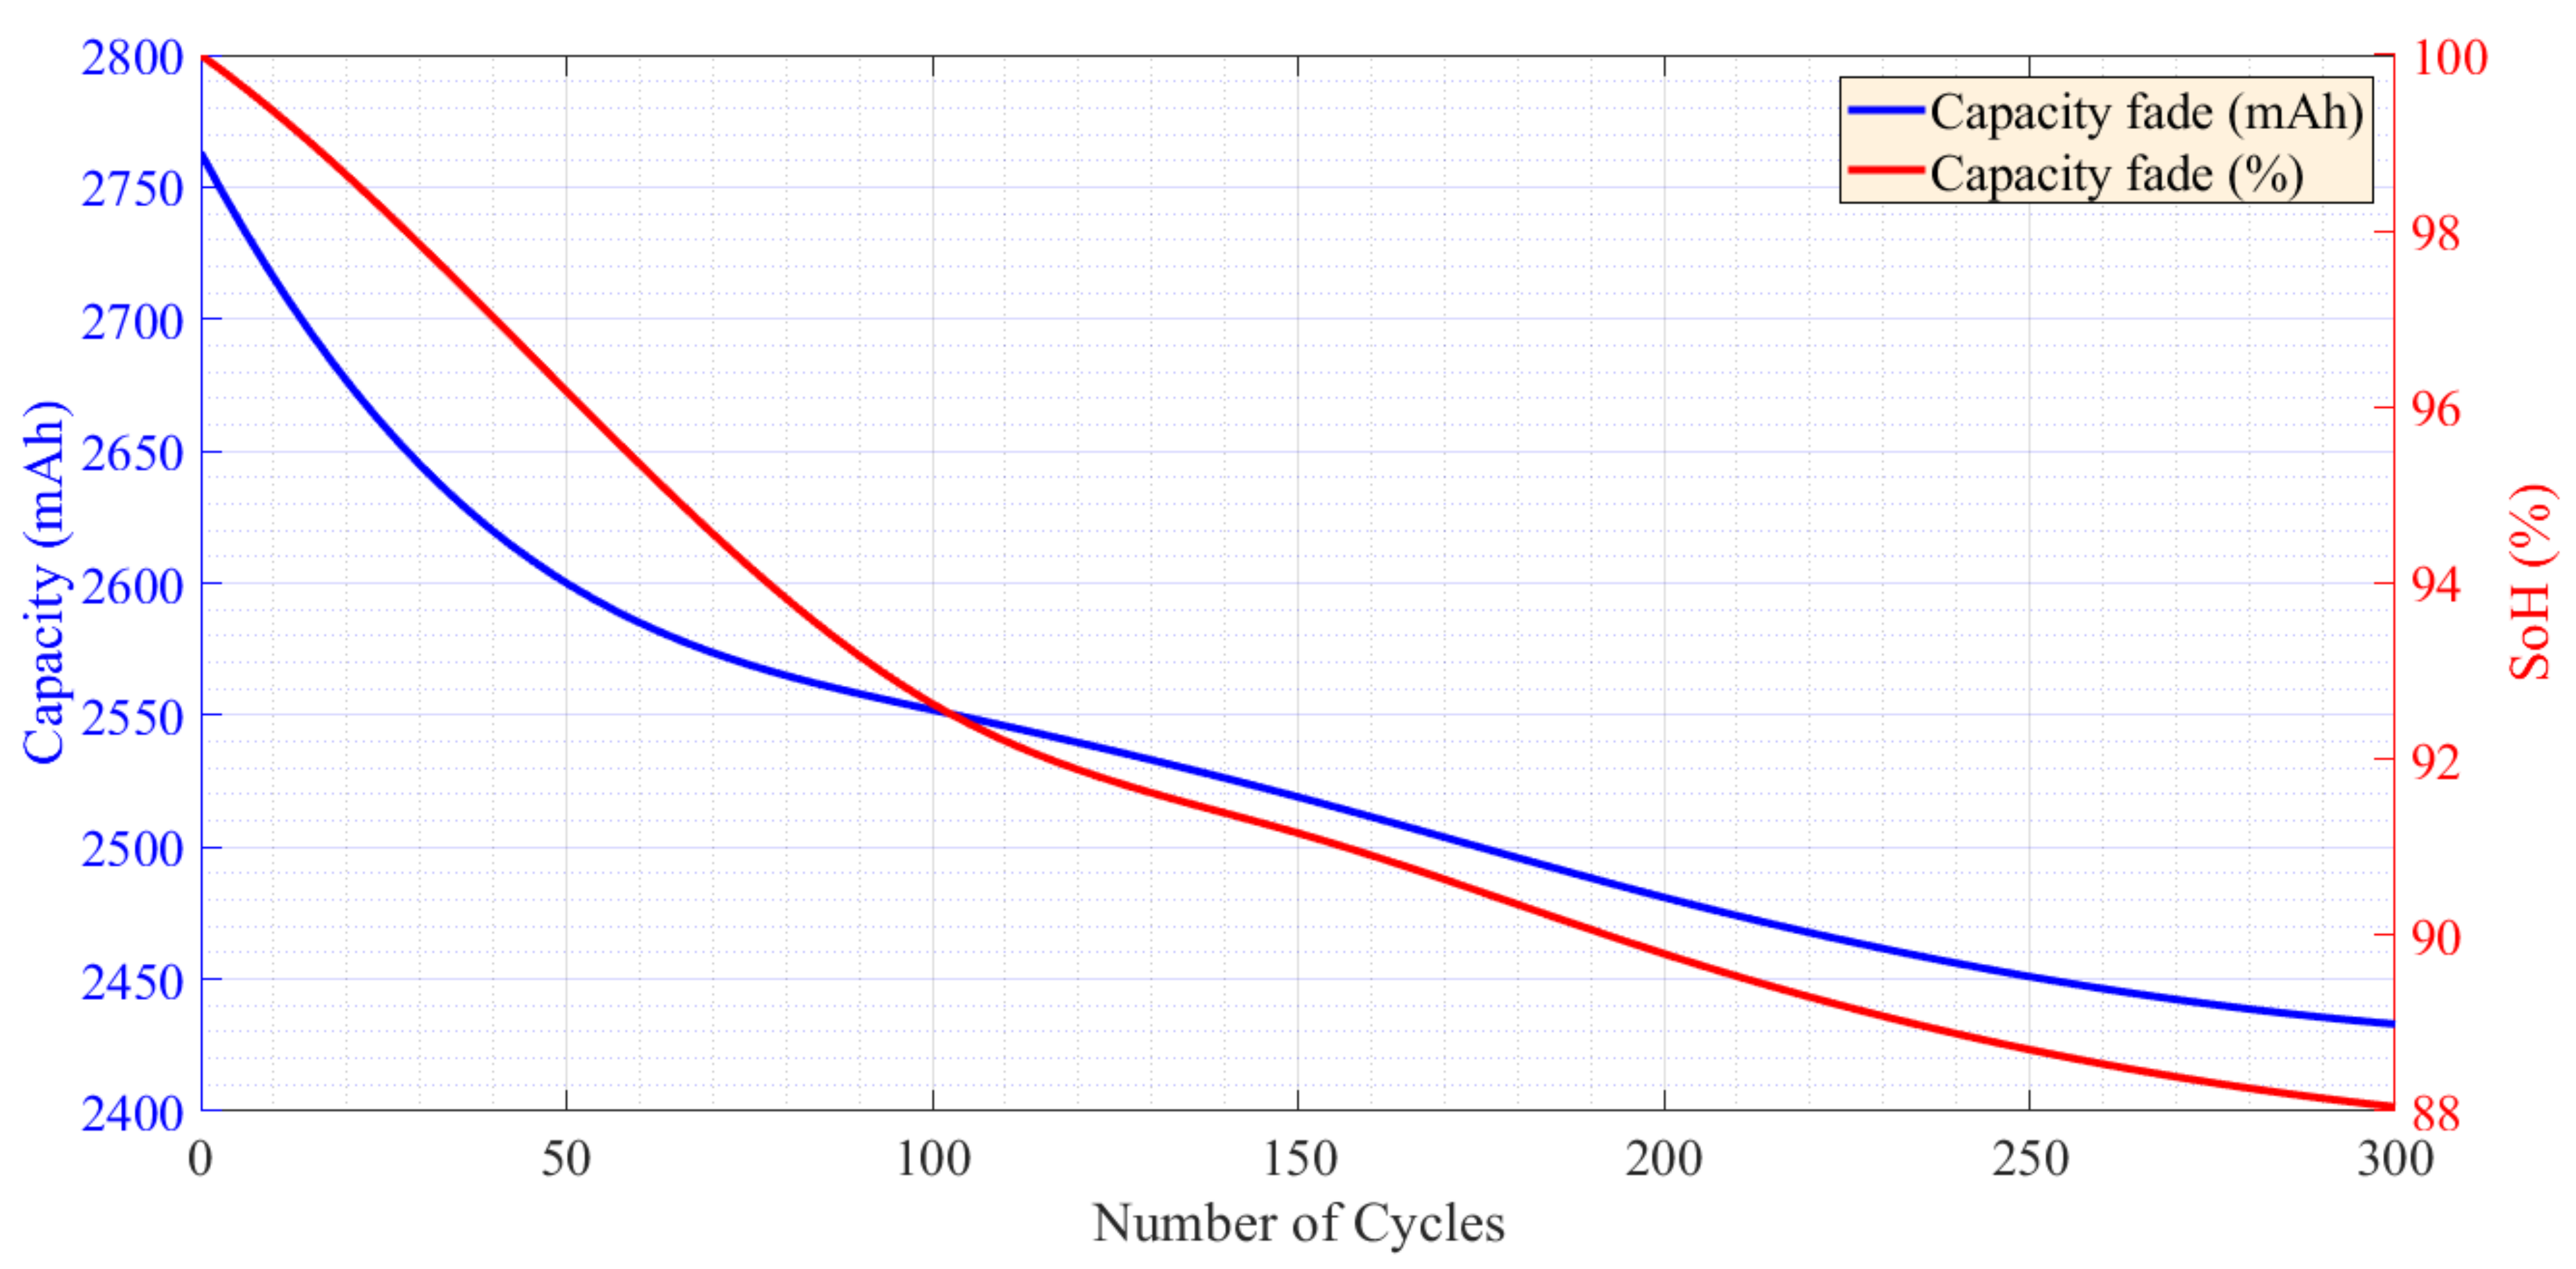
4.2.1. Capacity Fade
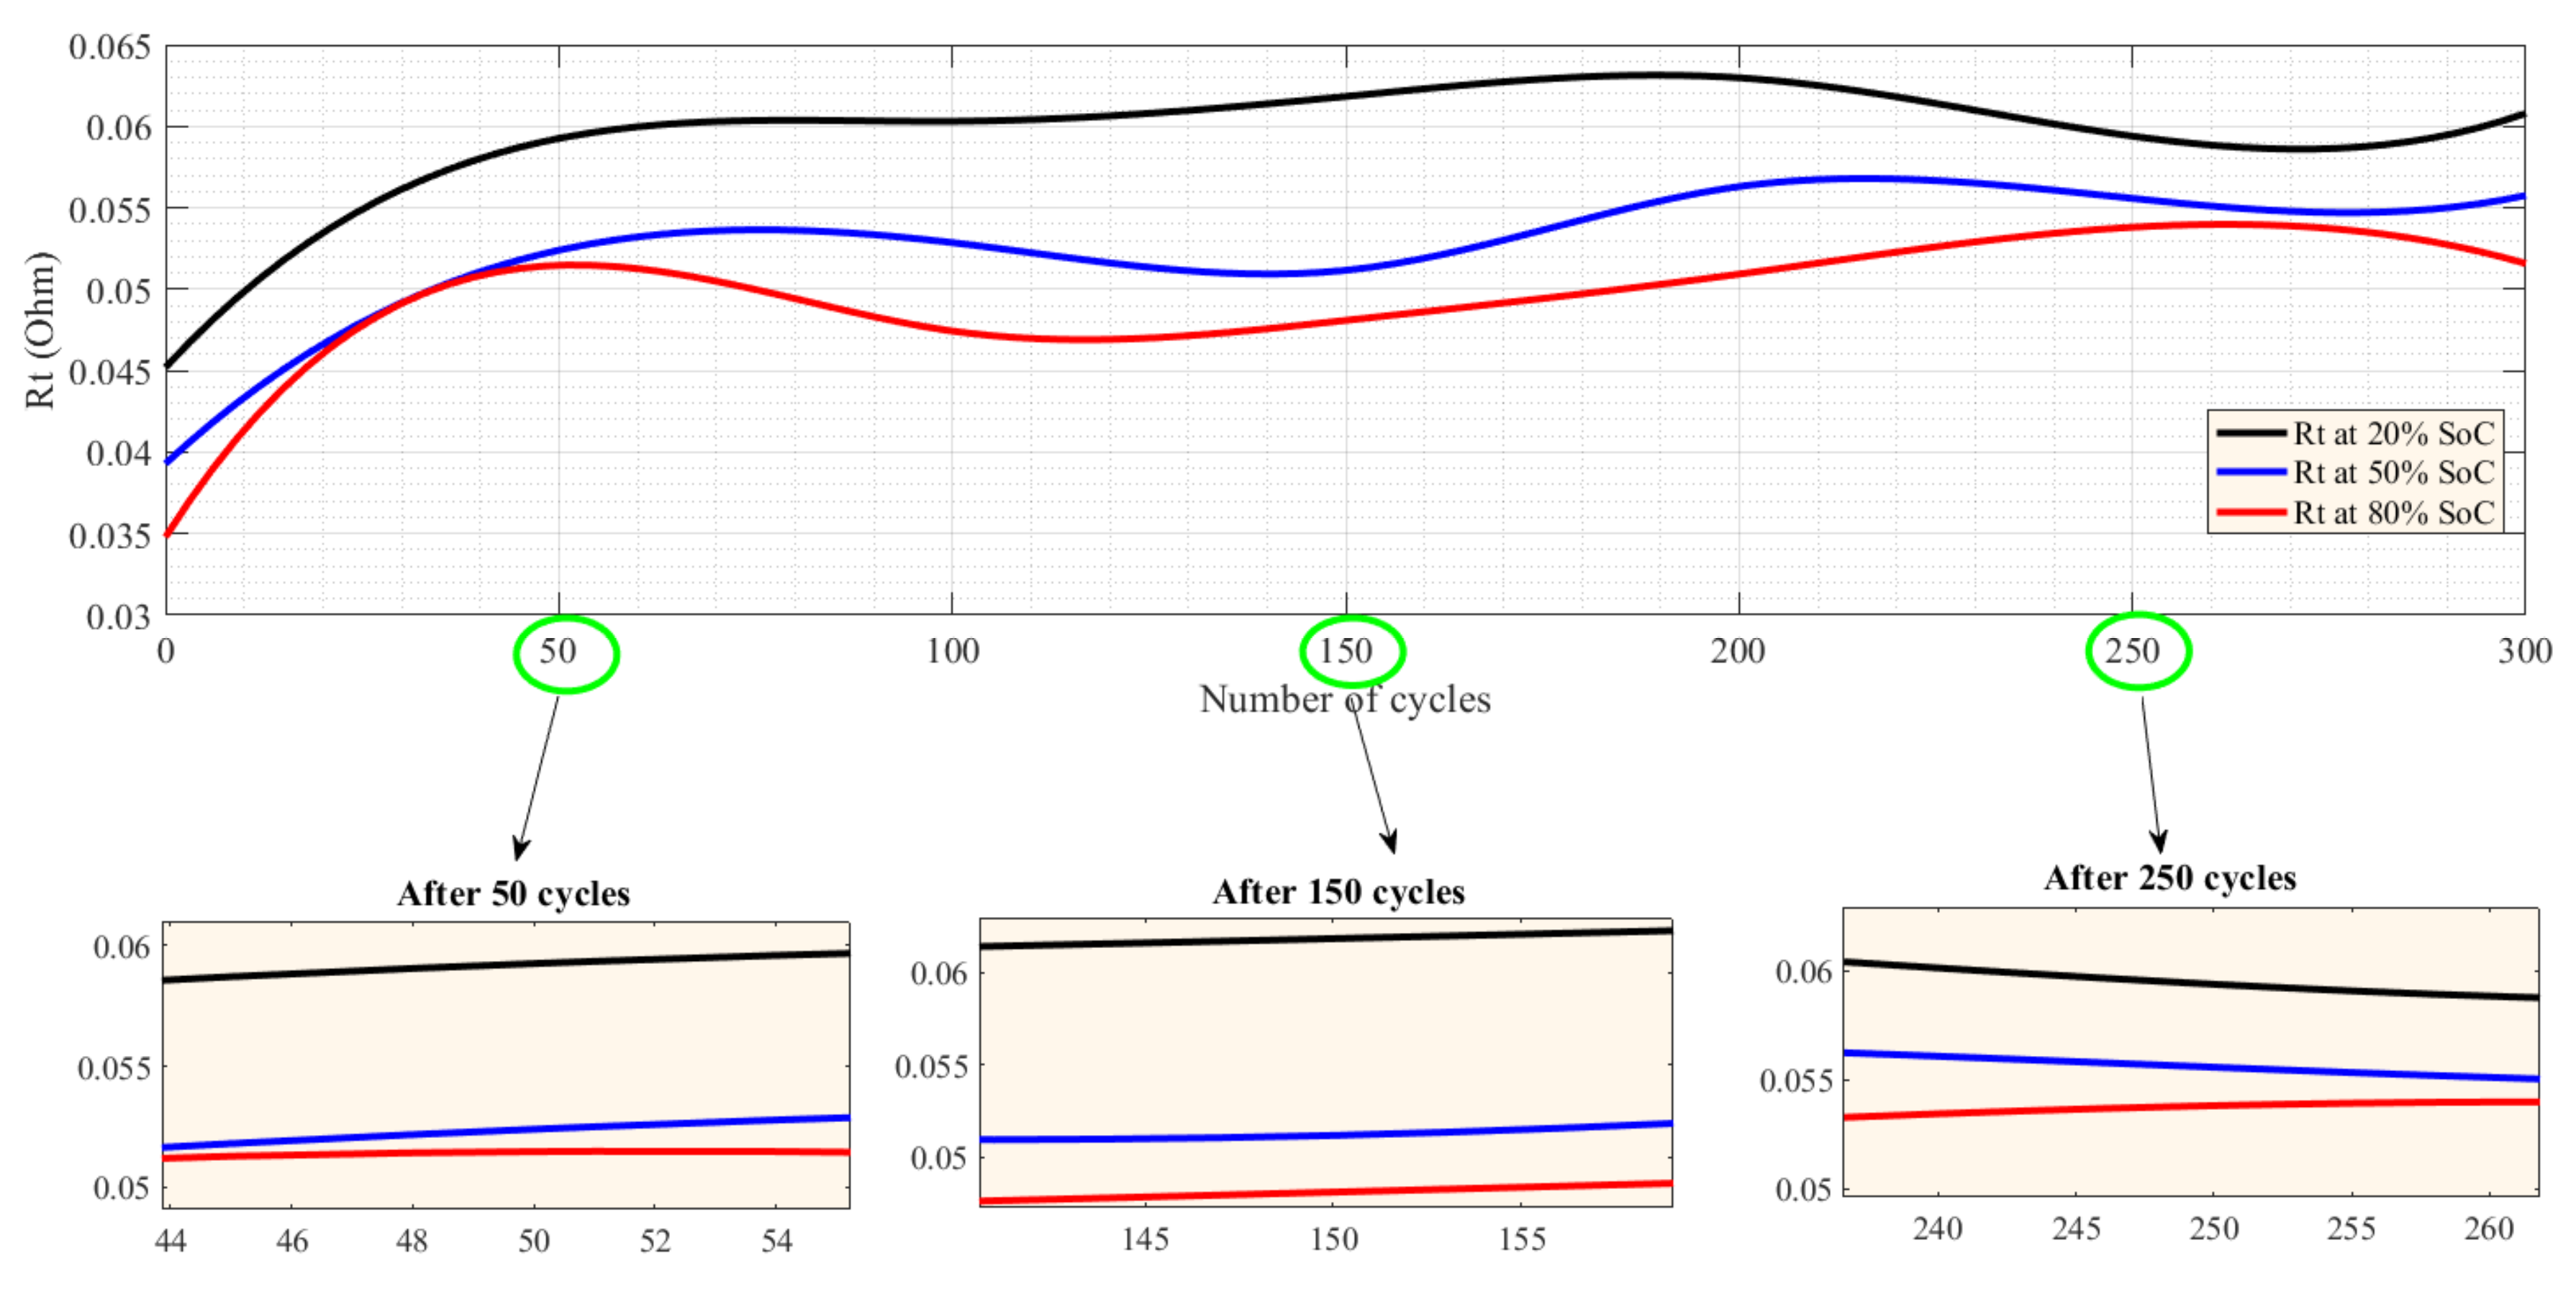
4.2.2. Power Fade
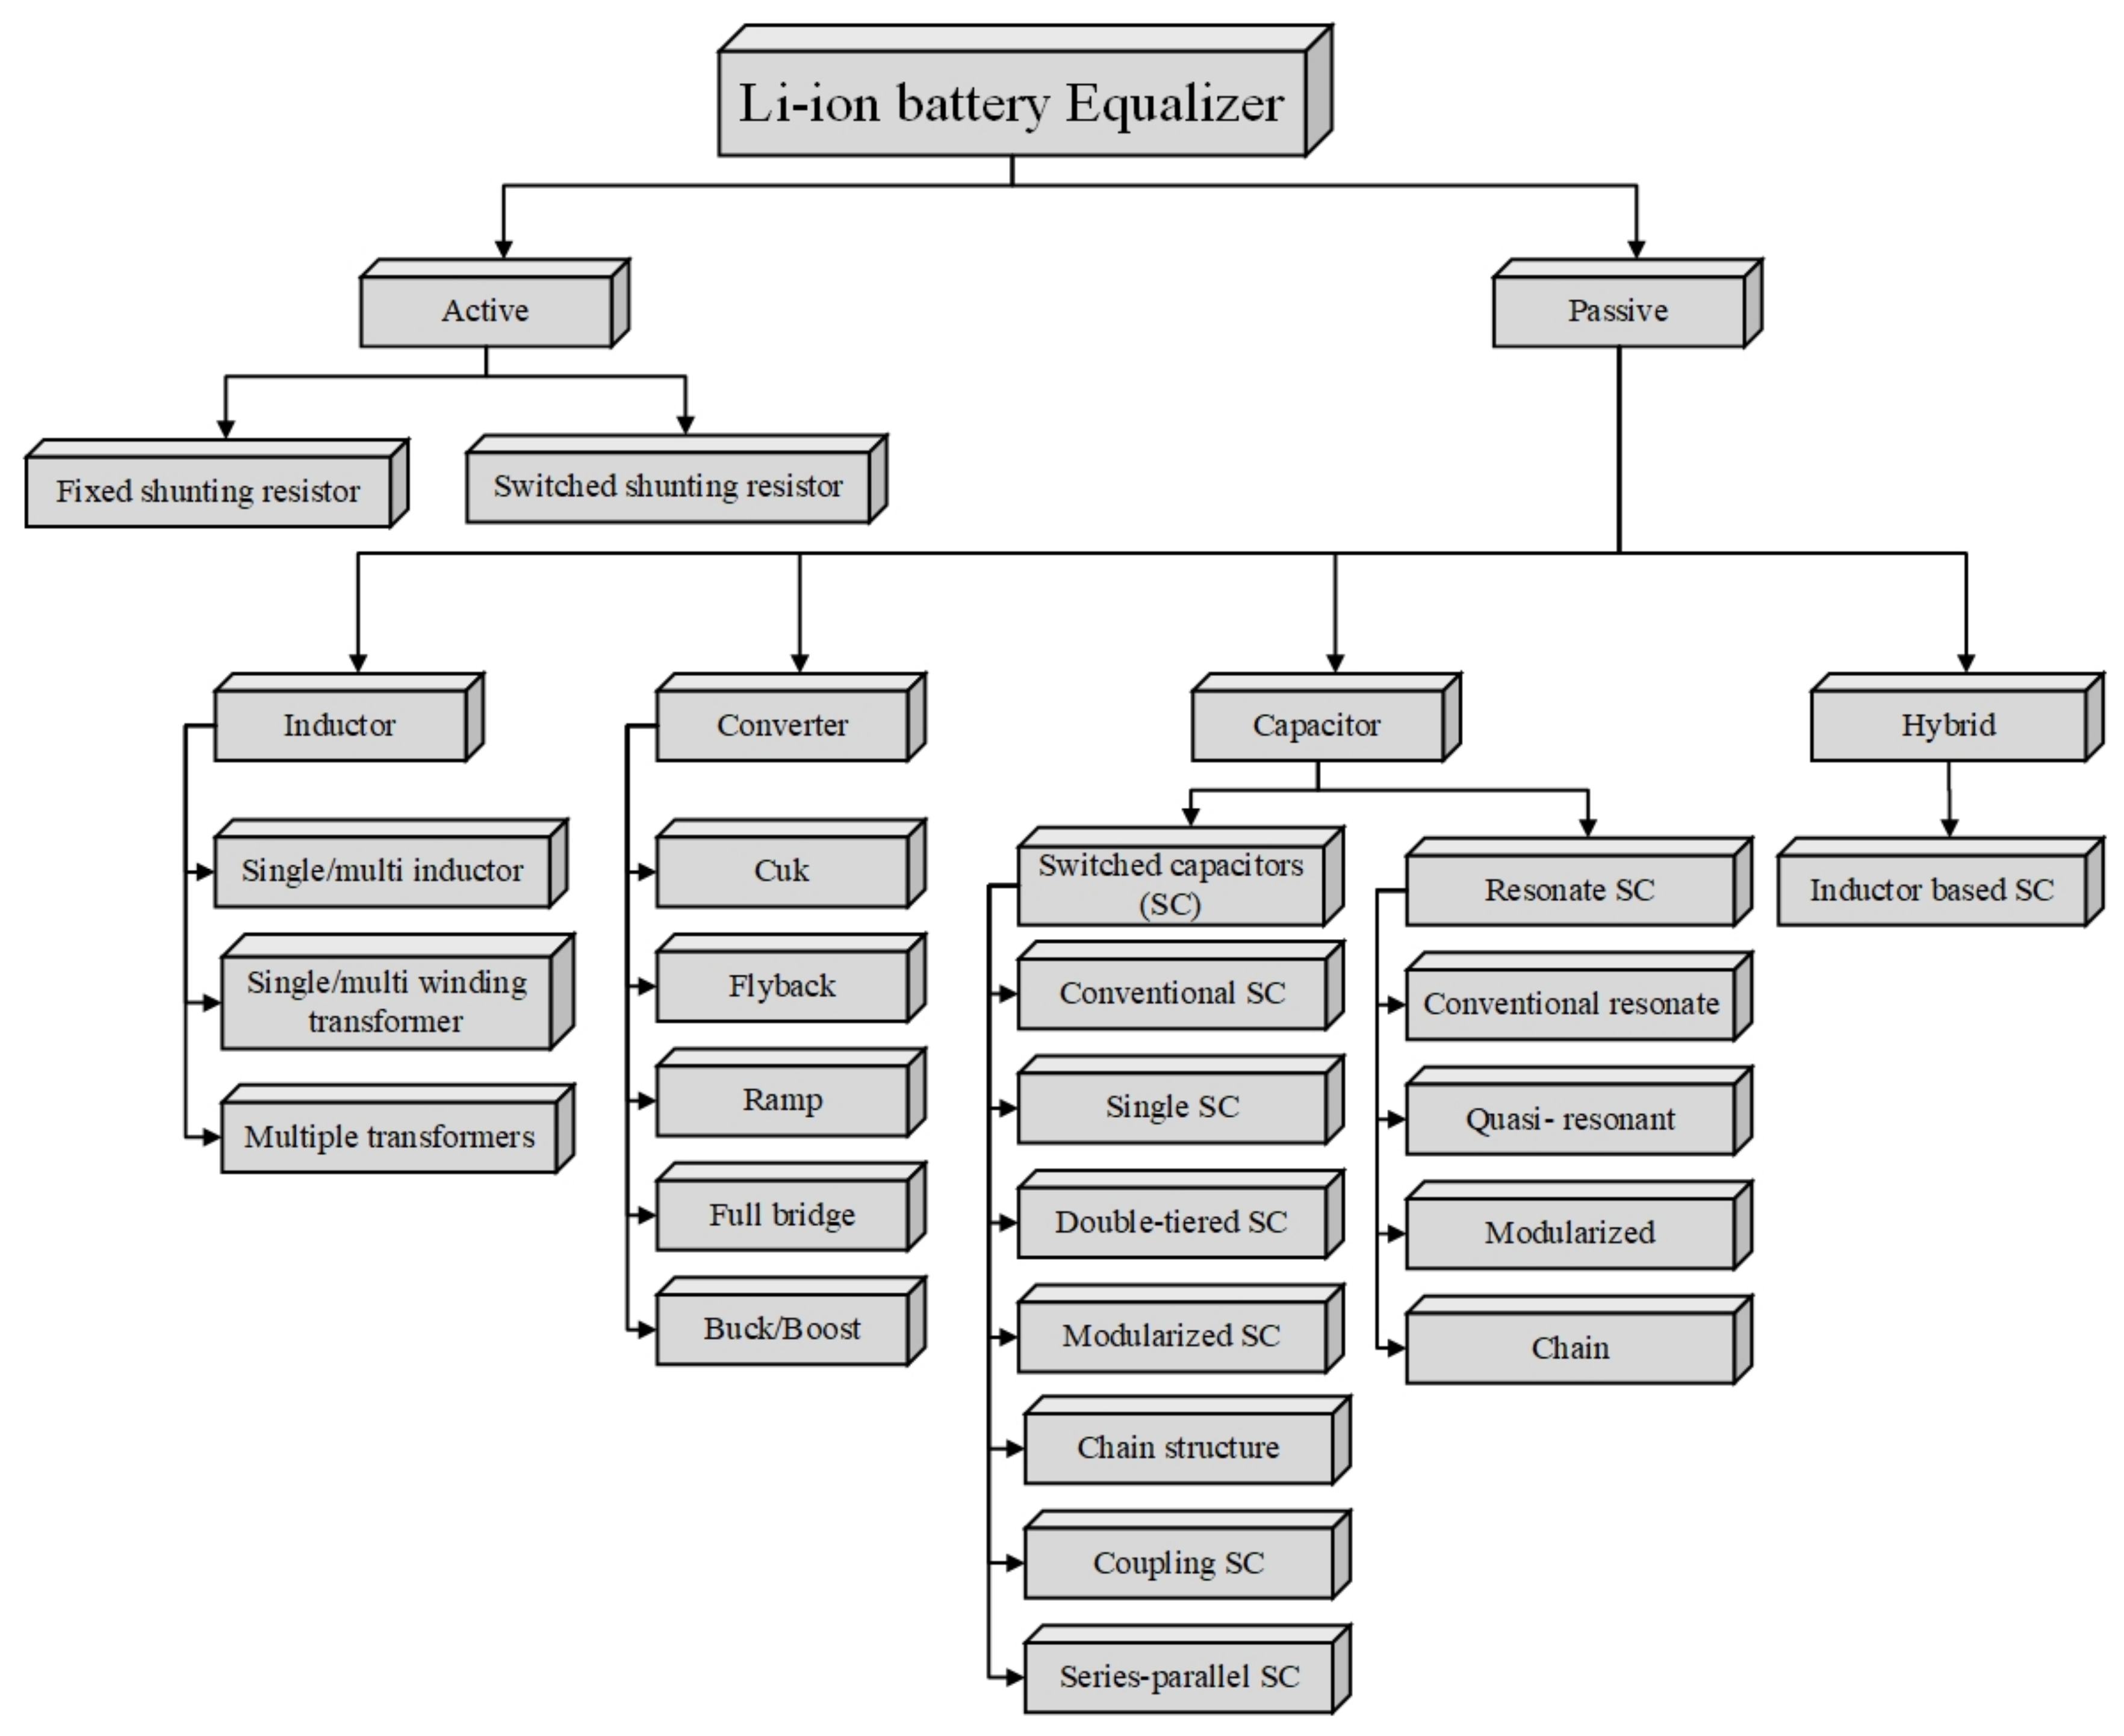
4.3. Control Strategies for Li-Ion Batteries to Improve Their Reliability
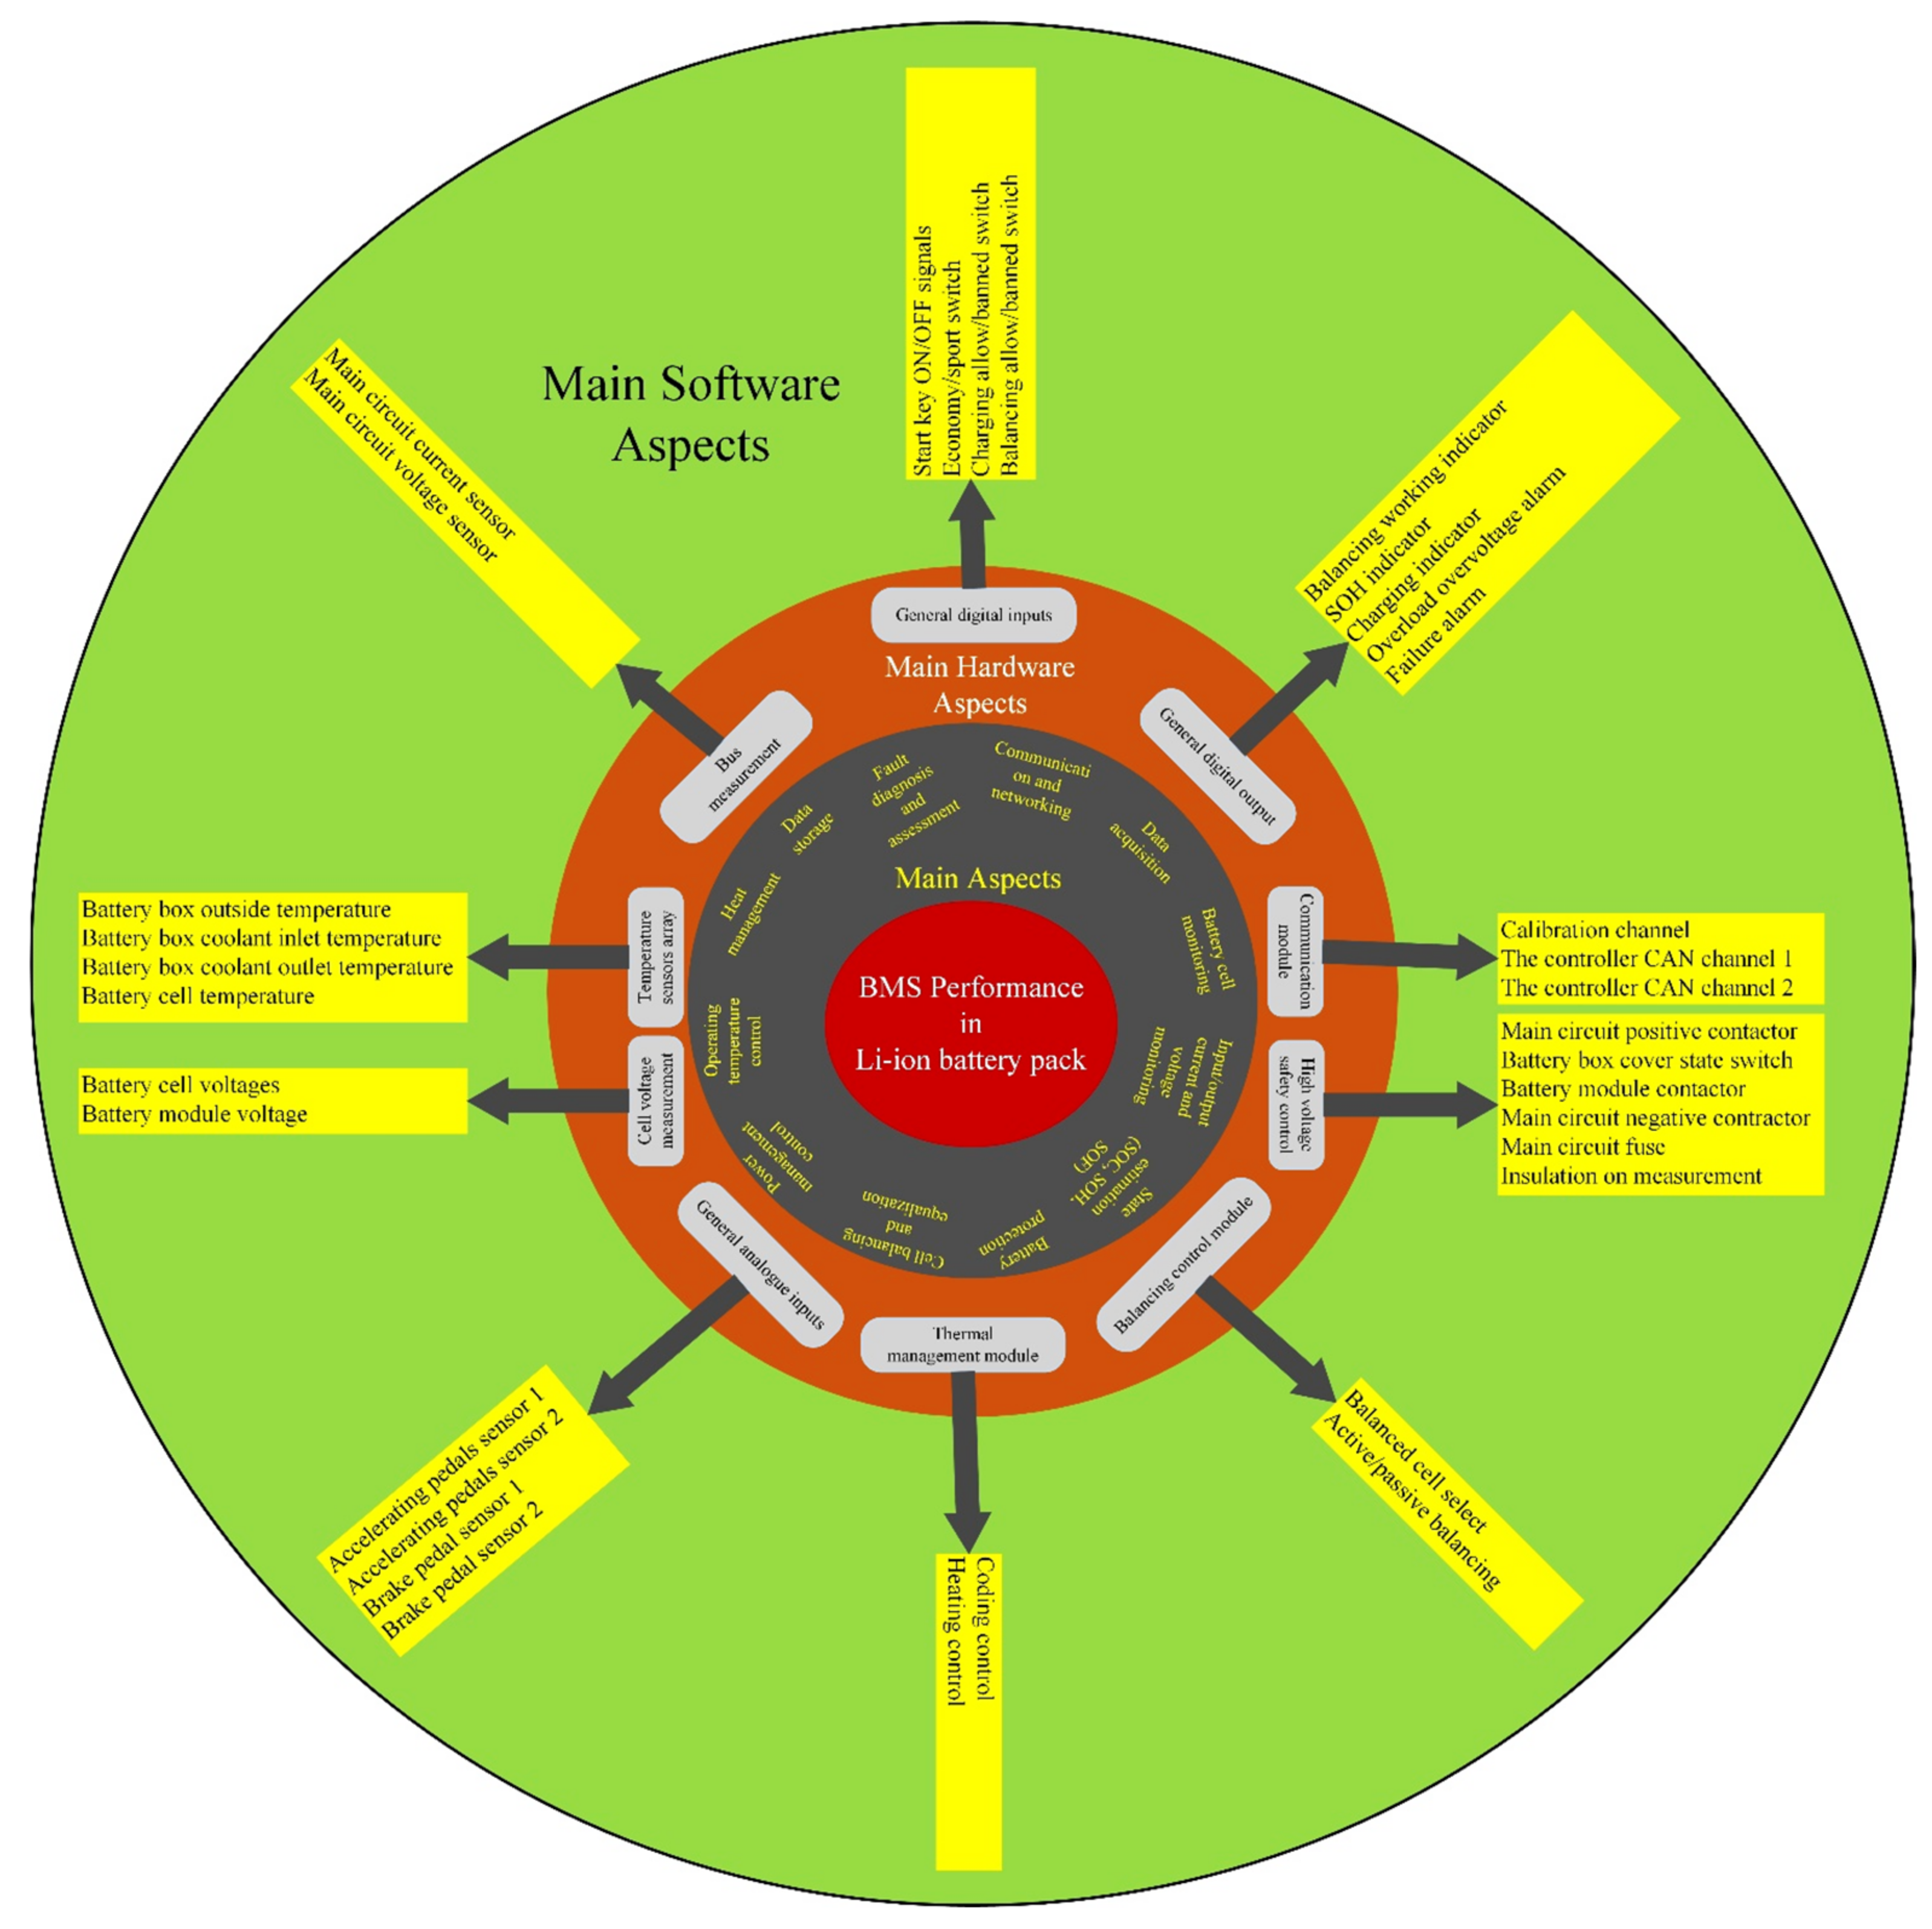
4.3.1. Data Acquisition and Fault Detection
4.3.2. Control Strategies and State Estimation
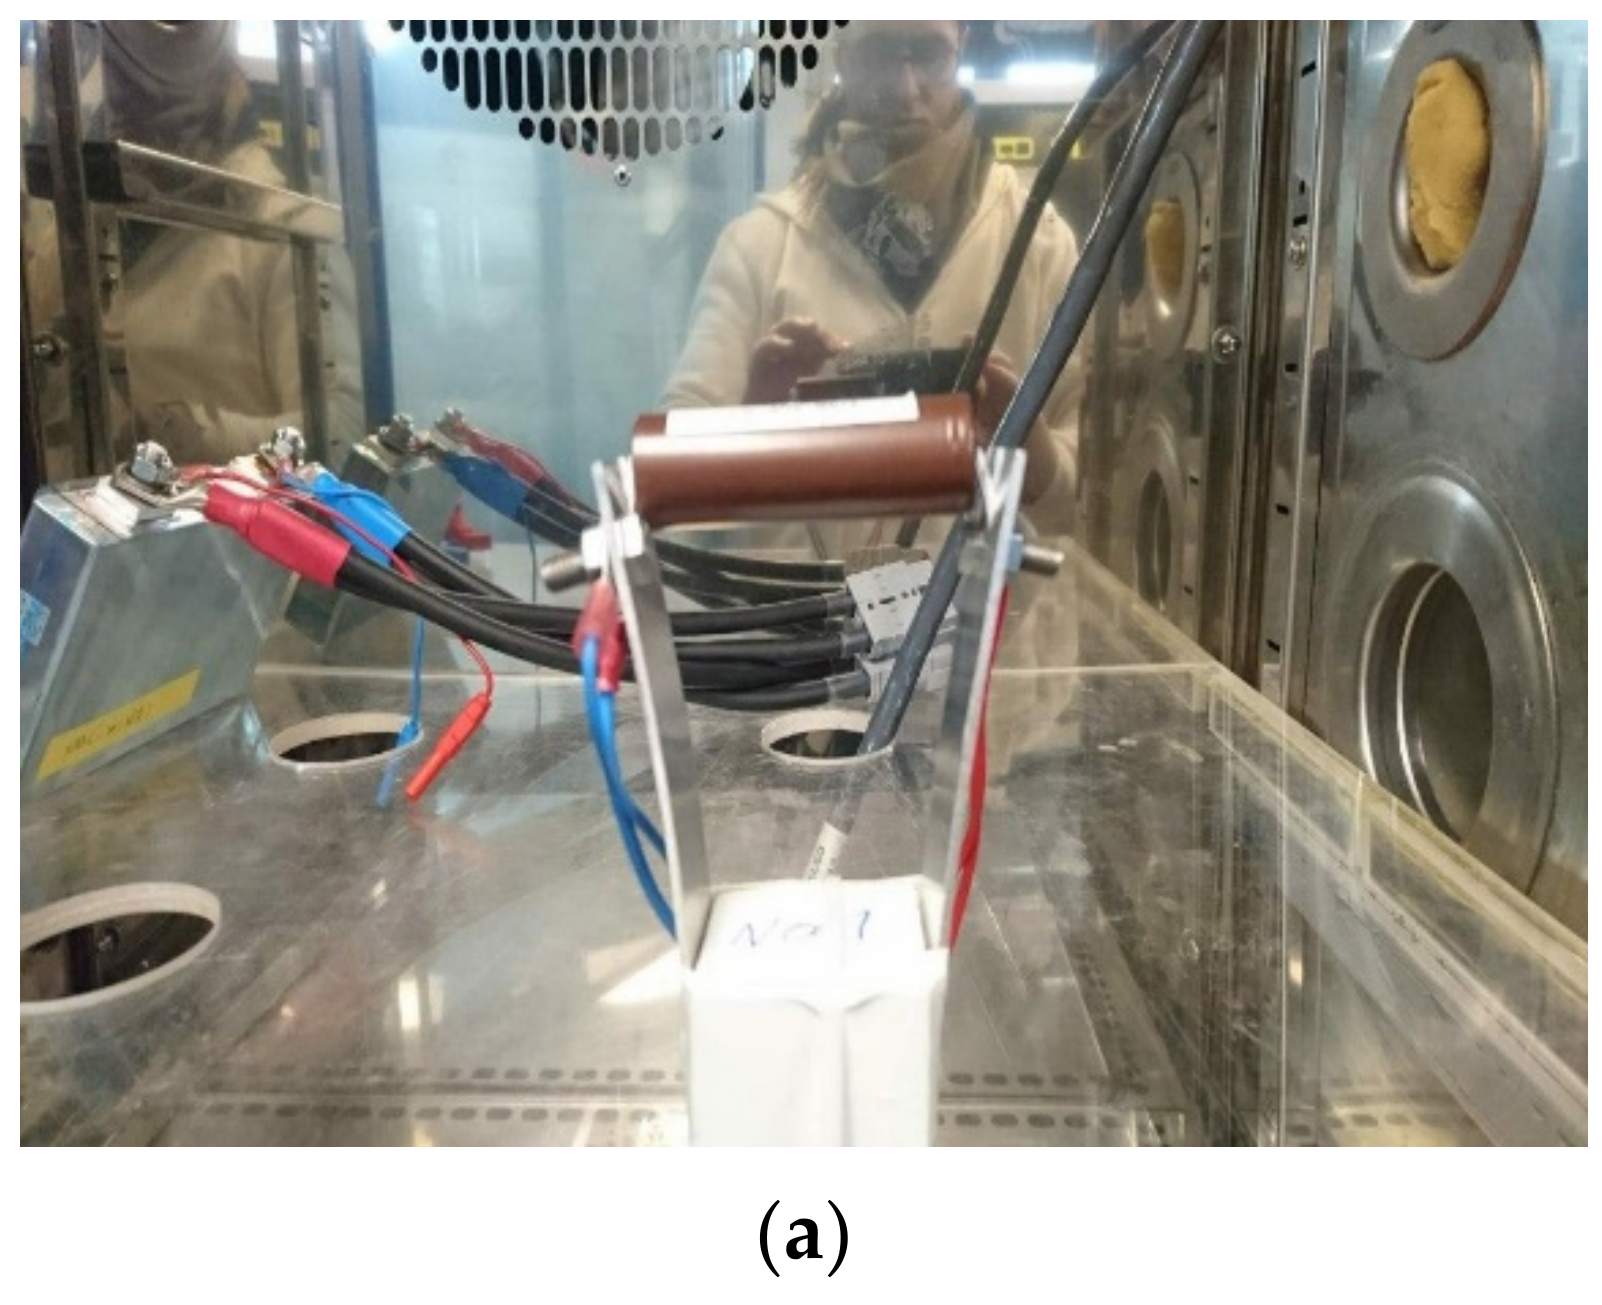
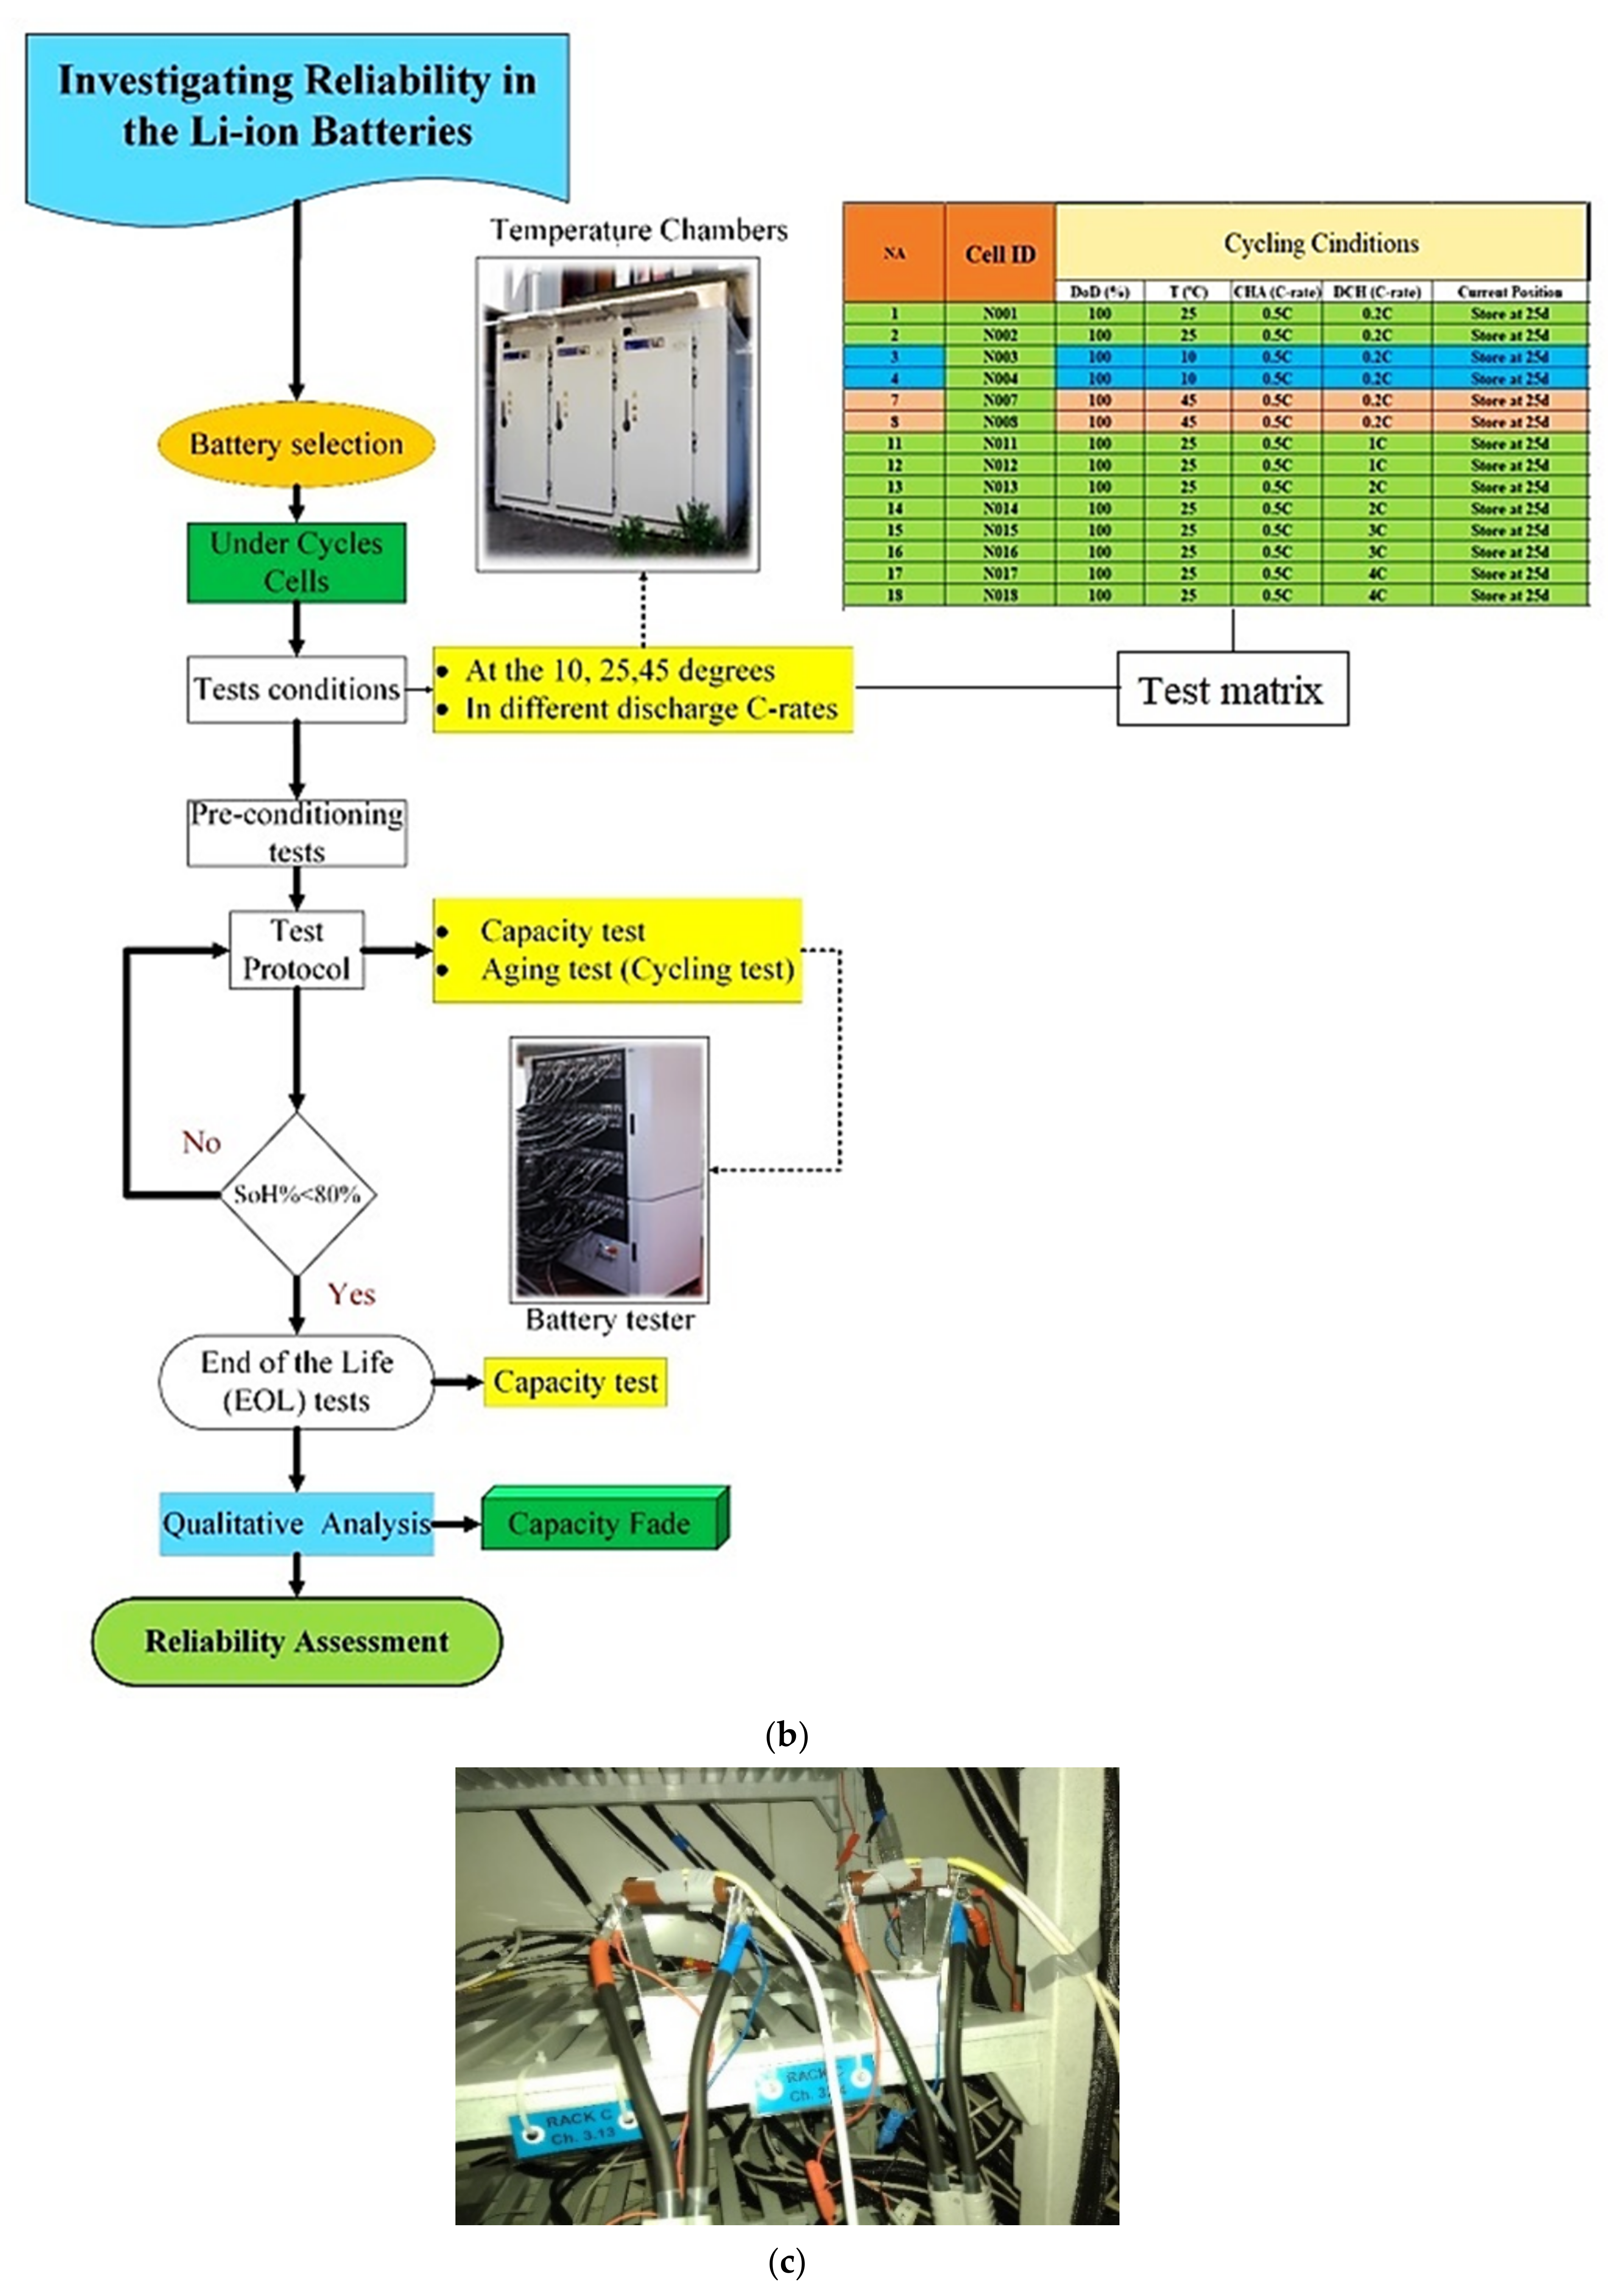
5. Case Study and Experimental Results
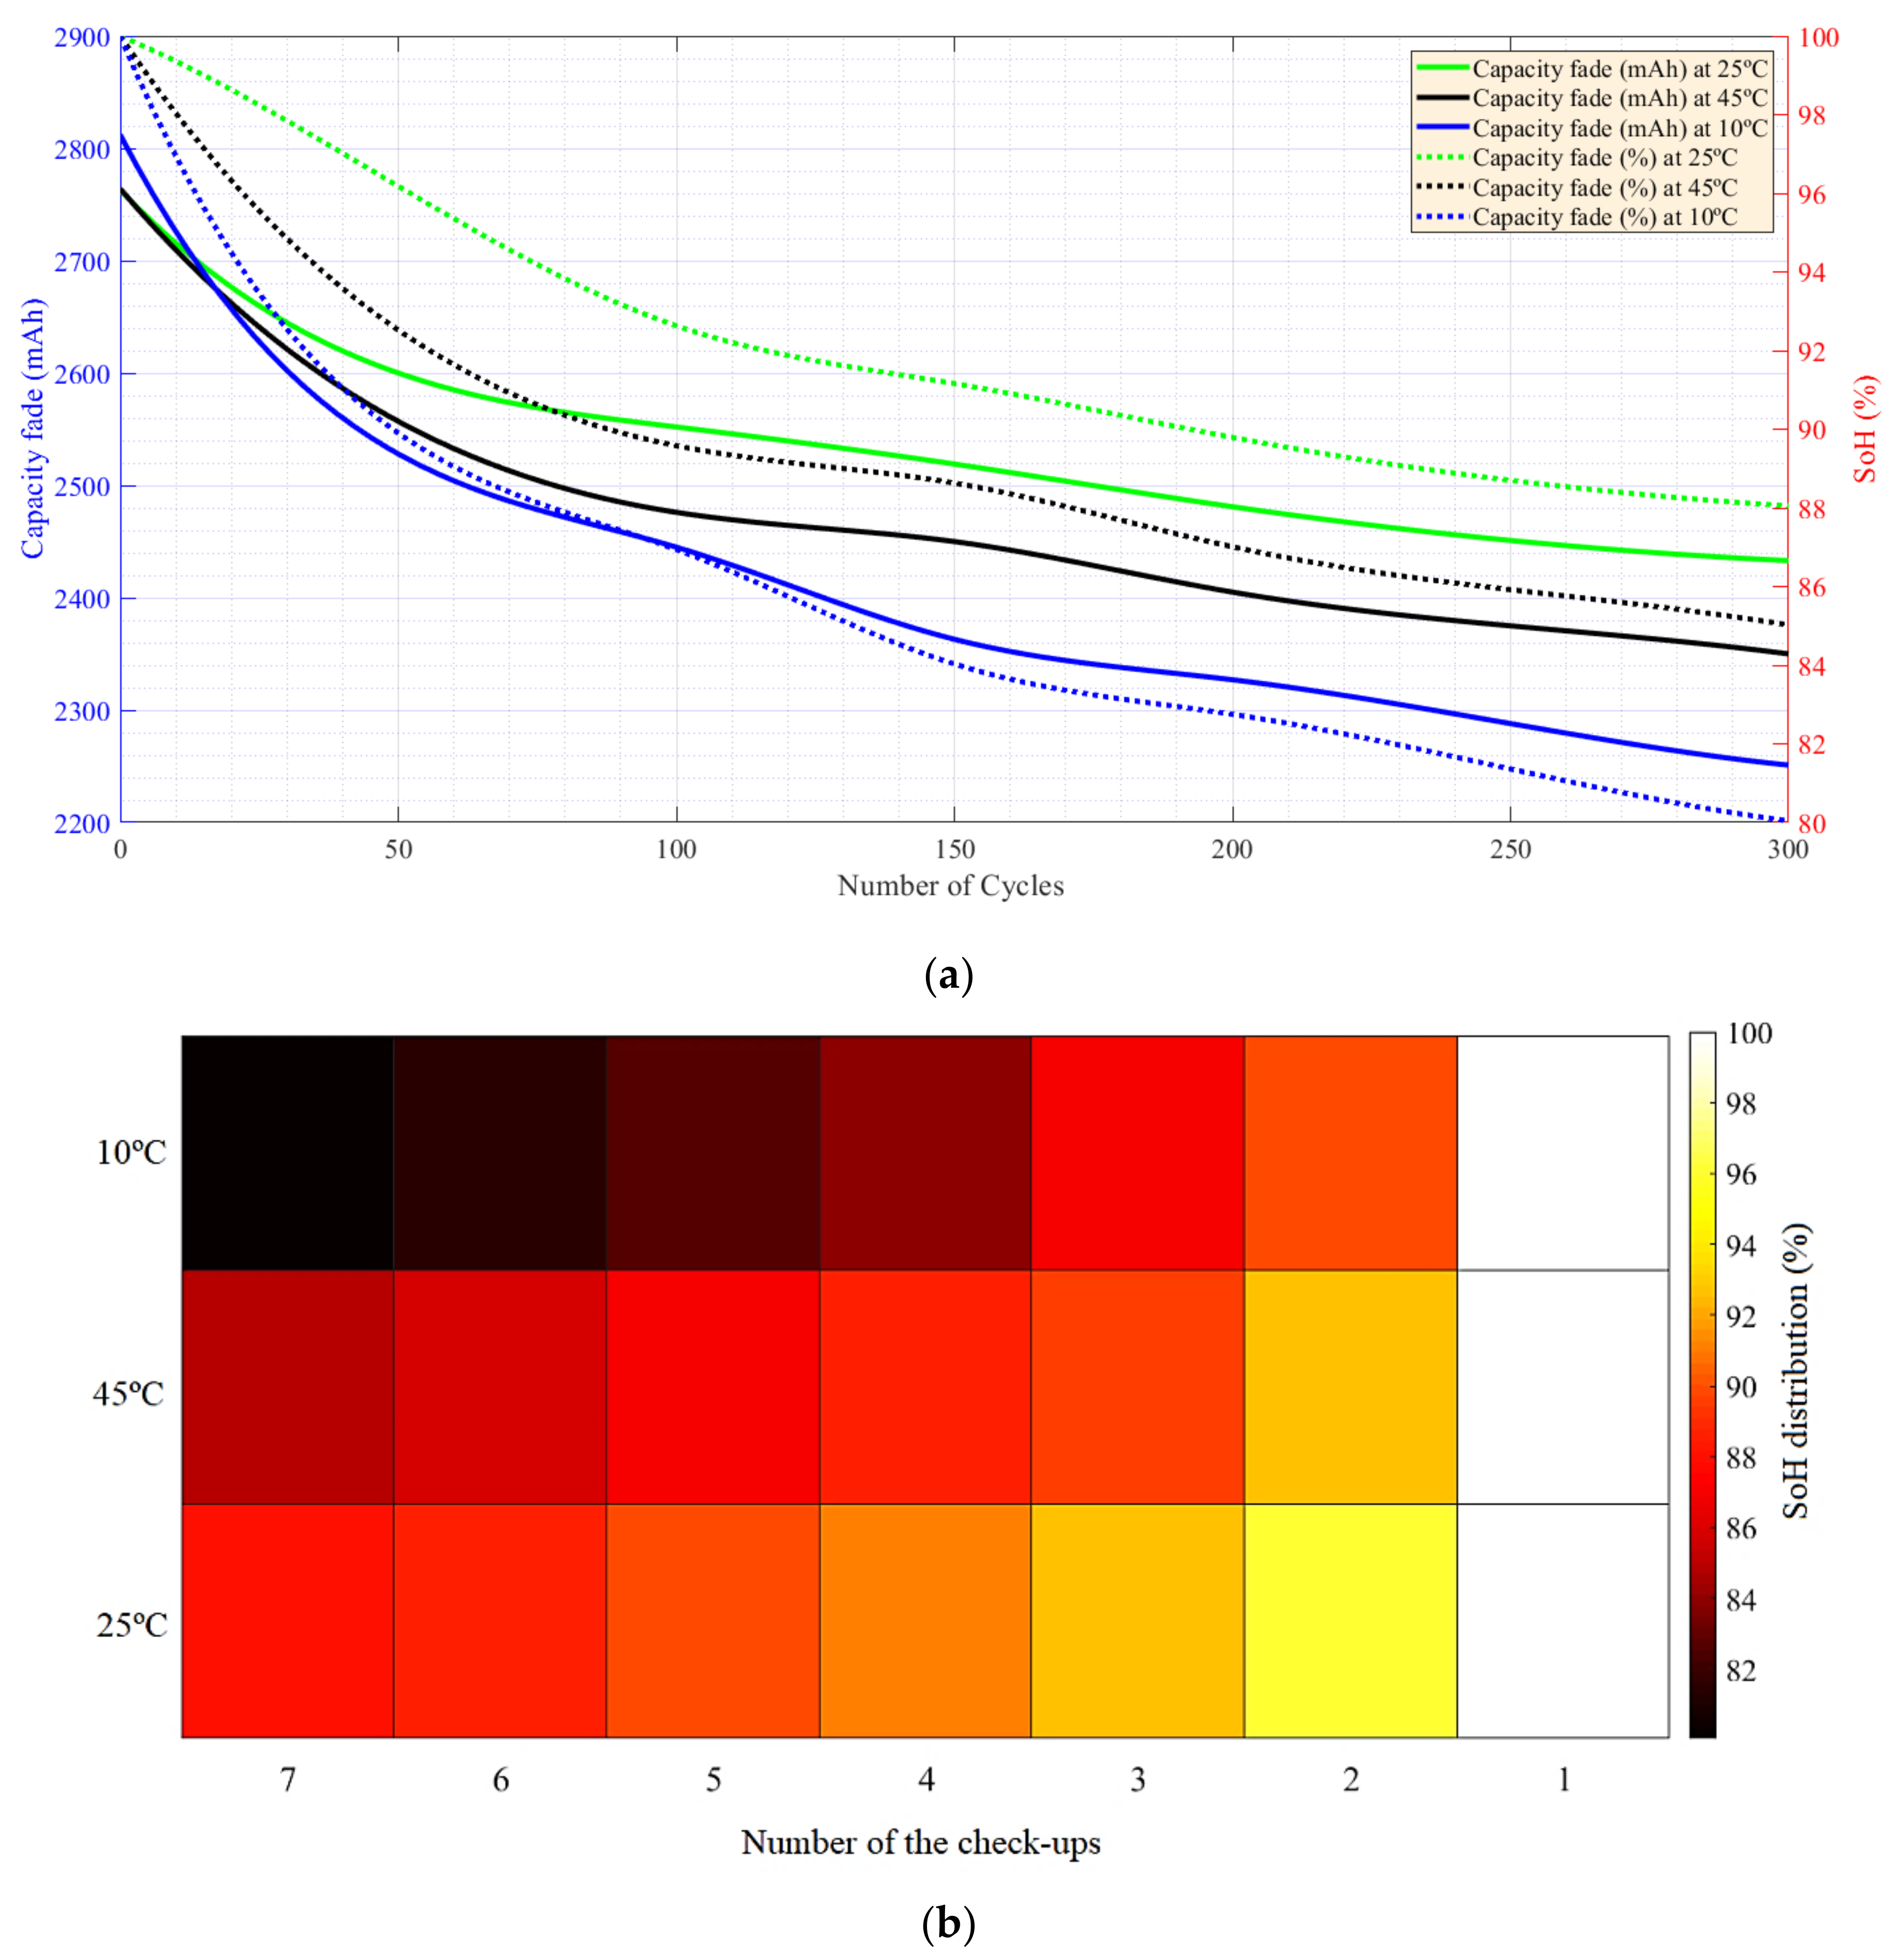
5.1. CF and SoH at Different Temperatures and under Charge–Discharge Standard Test Protocols
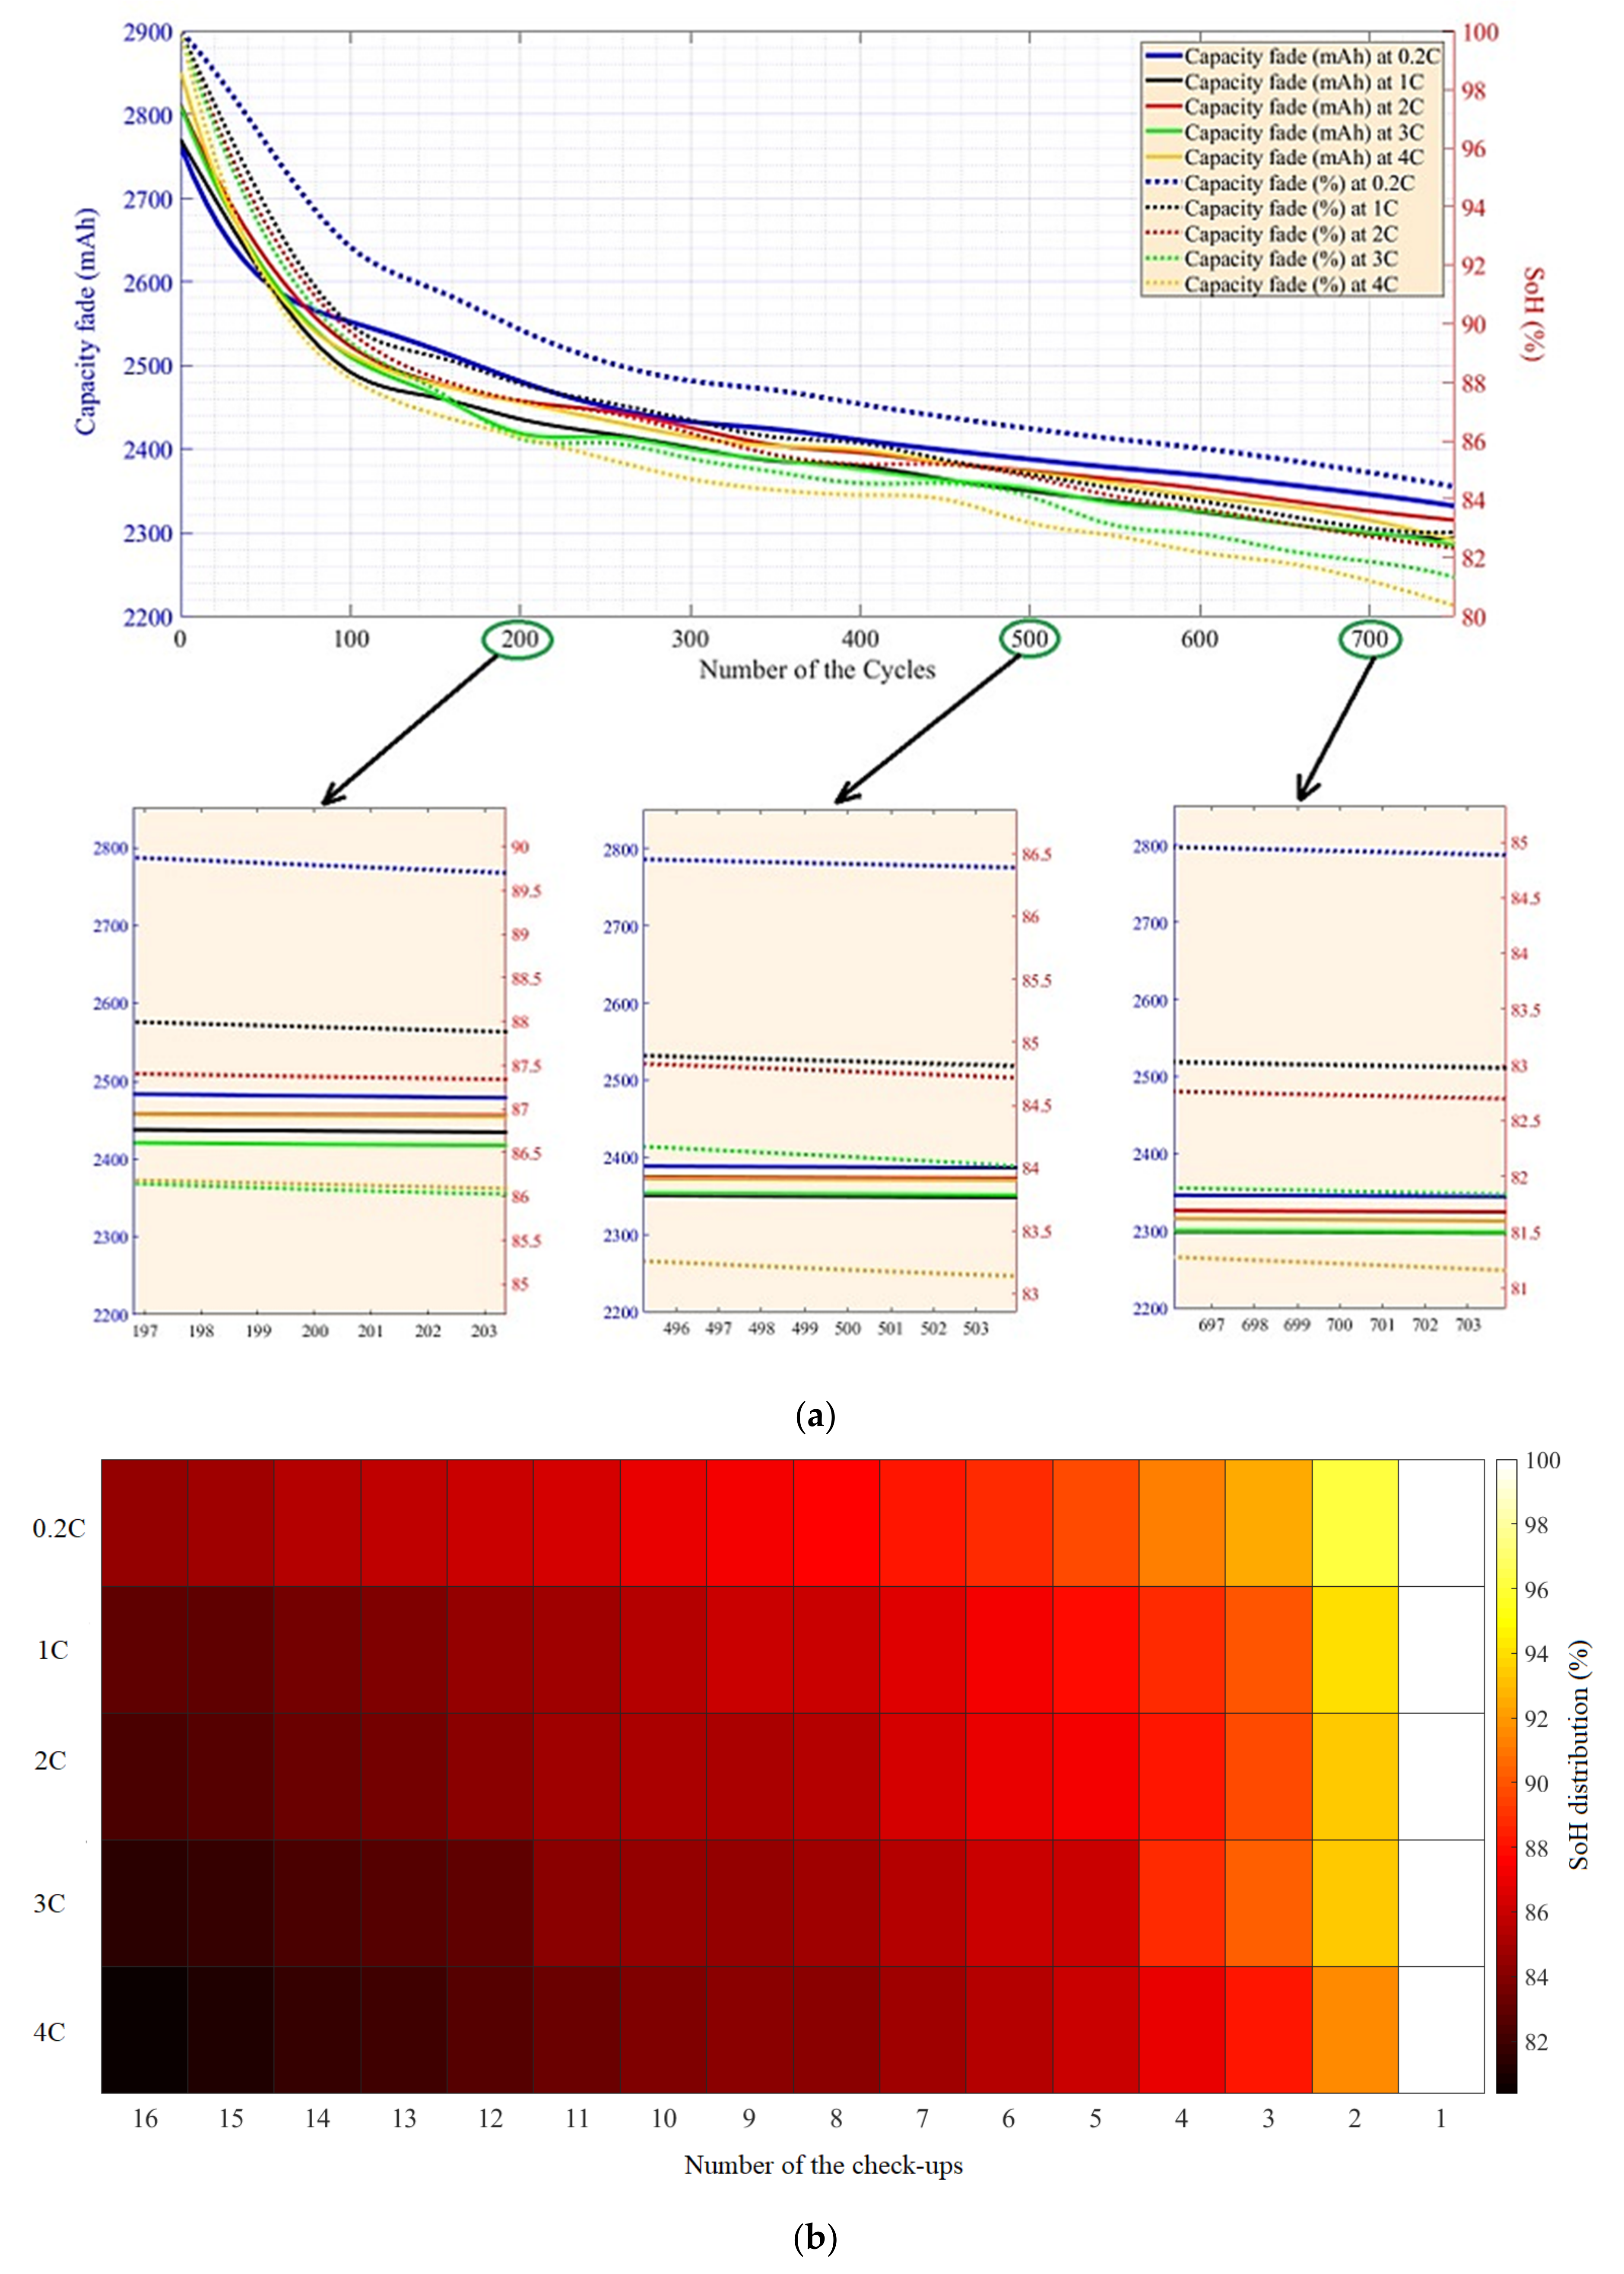
5.2. Capacity Fade and SoH under Different Charge–Discharge Test Protocols
6. Conclusions
Author Contributions
Funding
Institutional Review Board Statement
Informed Consent Statement
Data Availability Statement
Acknowledgments
Conflicts of Interest
References
- Zobaa, A.F.; Aleem, S.H.E.A.; Abdelaziz, A.Y. Classical and Recent Aspects of Power System Optimization; Academic Press: Cambridge, MA, USA; Elsevier: Amsterdam, The Netherlands, 2018; ISBN 9780128124413. [Google Scholar]
- Opitz, A.; Badami, P.; Shen, L.; Vignarooban, K.; Kannan, A.M. Can Li-Ion batteries be the panacea for automotive applications? Renew. Sustain. Energy Rev. 2017, 68, 685–692. [Google Scholar] [CrossRef] [Green Version]
- InteGrated and PHysically Optimised Battery System for Plug-In Vehicles Technologies; European Commission: Brussels, Belgium; Luxembourg, 2021.
- Peters, J.F.; Baumann, M.; Zimmermann, B.; Braun, J.; Weil, M. The environmental impact of Li-Ion batteries and the role of key parameters–A review. Renew. Sustain. Energy Rev. 2017, 67, 491–506. [Google Scholar] [CrossRef]
- Jaguemont, J.; Boulon, L.; Dubé, Y. A comprehensive review of lithium-ion batteries used in hybrid and electric vehicles at cold temperatures. Appl. Energy 2016, 164, 99–114. [Google Scholar] [CrossRef]
- Das, U.K.; Shrivastava, P.; Tey, K.S.; Bin Idris, M.Y.I.; Mekhilef, S.; Jamei, E.; Seyedmahmoudian, M.; Stojcevski, A. Lithium-ion battery aging mechanisms and diagnosis method for automotive applications: Recent advances and perspectives. Renew. Sustain. Energy Rev. 2020, 134, 110227. [Google Scholar] [CrossRef]
- Dubarry, M.; Liaw, B.Y. Identify capacity fading mechanism in a commercial LiFePO4 cell. J. Power Sources 2009, 194, 541–549. [Google Scholar] [CrossRef]
- Chung, S.H.; Tancogne-Dejean, T.; Zhu, J.; Luo, H.; Wierzbicki, T. Failure in lithium-ion batteries under transverse indentation loading. J. Power Sources 2018, 389, 148–159. [Google Scholar] [CrossRef]
- Gandoman, F.H.; Ahmadi, A.; Van den Bossche, P.; Van Mierlo, J.; Omar, N.; Nezhad, A.E.; Mavalizadeh, H.; Mayet, C. Status and future perspectives of reliability assessment for electric vehicles. Reliab. Eng. Syst. Saf. 2019, 183, 1–16. [Google Scholar] [CrossRef]
- Mertens, A.; Vinke, I.C.; Tempel, H.; Kungl, H.; De Haart, L.G.J.; Eichel, R.-A.; Granwehr, J. Quantitative analysis of time-domain supported electrochemical impedance spectroscopy data of Li-ion batteries: Reliable activation energy determination at low frequencies. J. Electrochem. Soc. 2016, 163, H521–H527. [Google Scholar] [CrossRef]
- Collong, S.; Kouta, R. Fault tree analysis of proton exchange membrane fuel cell system safety. Int. J. Hydrogen Energy 2015, 40, 8248–8260. [Google Scholar] [CrossRef]
- Levy, S.C. Safety and reliability considerations for lithium batteries. J. Power Sources 1997, 68, 75–77. [Google Scholar] [CrossRef]
- Hendricks, C.; Williard, N.; Mathew, S.; Pecht, M. A failure modes, mechanisms, and effects analysis (FMMEA) of lithium-ion batteries. J. Power Sources 2015, 297, 113–120. [Google Scholar] [CrossRef] [Green Version]
- Ali Kadhem, A.; Abdul Wahab, N.I.; Aris, I.; Jasni, J.; Abdalla, A.N. Computational techniques for assessing the reliability and sustainability of electrical power systems: A review. Renew. Sustain. Energy Rev. 2017, 80, 1175–1186. [Google Scholar] [CrossRef] [Green Version]
- Escalera, A.; Hayes, B.; Prodanović, M. A survey of reliability assessment techniques for modern distribution networks. Renew. Sustain. Energy Rev. 2018, 91, 344–357. [Google Scholar] [CrossRef]
- Gandoman, F.H.; Jaguemont, J.; Goutam, S.; Gopalakrishnan, R.; Firouz, Y.; Kalogiannis, T.; Omar, N.; Van Mierlo, J. Concept of reliability and safety assessment of lithium-ion batteries in electric vehicles: Basics, progress, and challenges. Appl. Energy 2019, 251, 113343. [Google Scholar] [CrossRef]
- Leng, F.; Tan, C.M.; Yazami, R.; Maher, K.; Wang, R. Quality decision for overcharged li-ion battery from reliability and safety perspective. In Theory and Practice of Quality and Reliability Engineering in Asia Industry; Springer: Singapore, 2017; ISBN 9789811032905. [Google Scholar]
- Liu, Z.; Tan, C.; Leng, F. A reliability-based design concept for lithium-ion battery pack in electric vehicles. Reliab. Eng. Syst. Saf. 2015, 134, 169–177. [Google Scholar] [CrossRef]
- Xiong, R.; Pan, Y.; Shen, W.; Li, H.; Sun, F. Lithium-ion battery aging mechanisms and diagnosis method for automotive applications: Recent advances and perspectives. Renew. Sustain. Energy Rev. 2020, 131, 110048. [Google Scholar] [CrossRef]
- Gao, Y.; Zhang, X.; Yang, J.; Guo, B.; Zhou, X. A novel model for lithium-ion battery aging quantitative analysis based on pseudo two-dimension expressions. Int. J. Electrochem. Sci. 2019, 14, 3180–3203. [Google Scholar] [CrossRef]
- Bubbico, R.; Greco, V.; Menale, C. Hazardous scenarios identification for Li-ion secondary batteries. Saf. Sci. 2018, 108, 72–88. [Google Scholar] [CrossRef]
- Spotnitz, R. Simulation of capacity fade in lithium-ion batteries. J. Power Sources 2003, 113, 72–80. [Google Scholar] [CrossRef]
- Zhang, J.; Lee, J. A review on prognostics and health monitoring of Li-ion battery. J. Power Sources 2011, 196, 6007–6014. [Google Scholar] [CrossRef]
- Abraham, D.; Liu, J.; Chen, C.; Hyung, Y.; Stoll, M.; Elsen, N.; MacLaren, S.; Twesten, R.; Haasch, R.; Sammann, E.; et al. Diagnosis of power fade mechanisms in high-power lithium-ion cells. J. Power Sources 2003, 119–121, 511–516. [Google Scholar] [CrossRef]
- Miao, Y.; Hynan, P.; von Jouanne, A.; Yokochi, A. Current Li-Ion Battery Technologies in Electric Vehicles and Opportunities for Advancements. Energies 2019, 12, 1074. [Google Scholar] [CrossRef] [Green Version]
- Piernas Muñoz, M.J.; Castillo Martínez, E. Introduction to batteries. In Prussian Blue Based Batteries; Springer: New York, NY, USA, 2018; pp. 1–8. [Google Scholar] [CrossRef]
- State of Charge (SOC) Determination. Available online: https://www.mpoweruk.com/soc.htm (accessed on 21 October 2021).
- What Is C-Rate? Available online: https://batteryuniversity.com/learn/article/what_is_the_c_rate (accessed on 21 October 2021).
- Wang, D.; Bao, Y.; Shi, J. Online lithium-ion battery internal resistance measurement application in state-of-charge estimation using the extended kalman filter. Energies 2017, 10, 1284. [Google Scholar] [CrossRef] [Green Version]
- Fang, Q.; Wei, X.; Dai, H. A remaining discharge energy prediction method for lithium-ion battery pack considering SOC and parameter inconsistency. Energies 2019, 12, 987. [Google Scholar] [CrossRef] [Green Version]
- Wachsman, E.D.; Lee, K.T. Lowering the temperature of solid oxide fuel cells. Science 2011, 334, 935–939. [Google Scholar] [CrossRef] [PubMed]
- Mostafa, M.H.; Aleem, S.H.E.A.; Ali, S.G.; Abdelaziz, A.Y.; Ribeiro, P.F.; Ali, Z.M. Robust energy management and economic analysis of microgrids considering different battery characteristics. IEEE Access 2020, 8, 54751–54775. [Google Scholar] [CrossRef]
- Mostafa, M.H.; Abdel Aleem, S.H.E.; Ali, S.G.; Ali, Z.M.; Abdelaziz, A.Y. Techno-economic assessment of energy storage systems using annualized life cycle cost of storage (LCCOS) and levelized cost of energy (LCOE) metrics. J. Energy Storage 2020, 29, 101345. [Google Scholar] [CrossRef]
- Wang, Q.; Jiang, B.; Li, B.; Yan, Y. A critical review of thermal management models and solutions of lithium-ion batteries for the development of pure electric vehicles. Renew. Sustain. Energy Rev. 2016, 64, 106–128. [Google Scholar] [CrossRef]
- Woody, M.; Arbabzadeh, M.; Lewis, G.M.; Keoleian, G.A.; Stefanopoulou, A. Strategies to limit degradation and maximize Li-ion battery service lifetime-Critical review and guidance for stakeholders. J. Energy Storage 2020, 28, 101231. [Google Scholar] [CrossRef]
- Sarkar, J.; Bhattacharyya, S. Application of graphene and graphene-based materials in clean energy-related devices Minghui. Arch. Thermodyn. 2012, 33, 23–40. [Google Scholar] [CrossRef]
- Wu, C.; Sun, J.; Zhu, C.; Ge, Y.; Zhao, Y. Research on Overcharge and Overdischarge Effect on Lithium-Ion Batteries. In 2015 IEEE Vehicle Power and Propulsion Conference (VPPC), Proceedings of the IEEE Conference on Vehicle Power and Propulsion (VPPC), Montreal, QC, Canada, 19–22 October 2015; IEEE: Piscataway, NJ, USA, 2015; pp. 1–6. [Google Scholar] [CrossRef]
- Beletskii, E.V.; Alekseeva, E.V.; Spiridonova, D.V.; Yankin, A.N.; Levin, O.V. Overcharge cycling effect on the surface layers and crystalline structure of LiFePO4 cathodes of Li-ion batteries. Energies 2019, 12, 4652. [Google Scholar] [CrossRef] [Green Version]
- Wen, J.; Yu, Y.; Chen, C. A Review on Lithium-Ion Batteries Safety Issues: Existing Problems and Possible Solutions. Mater. Express 2012, 2, 197–212. [Google Scholar] [CrossRef]
- Li, J.; Wang, D.; Pecht, M. An electrochemical model for high C-rate conditions in lithium-ion batteries. J. Power Sources 2019, 436, 226885. [Google Scholar] [CrossRef]
- Wu, C.; Zhu, C.; Ge, Y.; Zhao, Y. A Review on Fault Mechanism and Diagnosis Approach for Li-Ion Batteries. J. Nanomater. 2015, 2015, 631263. [Google Scholar] [CrossRef] [Green Version]
- Dubarry, M.; Truchot, C.; Liaw, B.Y. Synthesize battery degradation modes via a diagnostic and prognostic model. J. Power Sources 2012, 219, 204–216. [Google Scholar] [CrossRef]
- Marongiu, A.; Nlandi, N.; Rong, Y.; Sauer, D.U. On-board capacity estimation of lithium iron phosphate batteries by means of half-cell curves. J. Power Sources 2016, 324, 158–169. [Google Scholar] [CrossRef]
- Schlasza, C.; Ostertag, P.; Chrenko, D.; Kriesten, R.; Bouquain, D. Review on the aging mechanisms in Li-ion batteries for electric vehicles based on the FMEA method. In 2014 IEEE Transportation Electrification Conference and Expo (ITEC), Proceedings of the 2014 IEEE Transportation Electrification Conference and Expo (ITEC), Dearborn, MI, USA, 15–18 June 2014; IEEE: Piscataway, NJ, USA, 2014; pp. 1–6. [Google Scholar] [CrossRef]
- Swierczynski, M.; Stroe, D.I.; Stan, A.I.; Teodorescu, R.; Laerke, R.; Kjær, P.C. Field tests experience from 1.6MW/400kWh Li-ion battery energy storage system providing primary frequency regulation service. In IEEE PES ISGT Europe 2013, Proceedings of the IEEE PES Innovative Smart Grid Technologies Conference Europe (ISGT Europe), Lyngby, Denmark, 6–9 October 2013; IEEE: Piscataway, NJ, USA, 2013; pp. 1–5. [Google Scholar] [CrossRef]
- Yang, Q.; Xu, J.; Cao, B.; Li, X. A simplified fractional order impedance model and parameter identification method for lithium-ion batteries. PLoS ONE 2017, 12, e0172424. [Google Scholar] [CrossRef]
- Farmann, A.; Waag, W.; Marongiu, A.; Sauer, D.U. Critical review of on-board capacity estimation techniques for lithium-ion batteries in electric and hybrid electric vehicles. J. Power Sources 2015, 281, 114–130. [Google Scholar] [CrossRef]
- Das, U.K.; Shrivastava, P.; Tey, K.S.; Bin Idris, M.Y.I.; Mekhilef, S.; Jamei, E.; Seyedmahmoudian, M.; Stojcevski, A. Advancement of lithium-ion battery cells voltage equalization techniques: A review. Renew. Sustain. Energy Rev. 2020, 134, 110227. [Google Scholar] [CrossRef]


| Name | Cylindrical | Prismatic | Pouch |
|---|---|---|---|
| Shape |  |  |  |
| Arrangement of electrode | Wound | Wound | Wound |
| Mechanical stability | Best | Good | Bad |
| Heat management | Bad | Good | Good |
| Specific energy | Good | Good | Best |
| Energy density | Good | Best | Good |
Publisher’s Note: MDPI stays neutral with regard to jurisdictional claims in published maps and institutional affiliations. |
© 2021 by the authors. Licensee MDPI, Basel, Switzerland. This article is an open access article distributed under the terms and conditions of the Creative Commons Attribution (CC BY) license (https://creativecommons.org/licenses/by/4.0/).
Share and Cite
Gandoman, F.H.; Ahmed, E.M.; Ali, Z.M.; Berecibar, M.; Zobaa, A.F.; Abdel Aleem, S.H.E. Reliability Evaluation of Lithium-Ion Batteries for E-Mobility Applications from Practical and Technical Perspectives: A Case Study. Sustainability 2021, 13, 11688. https://doi.org/10.3390/su132111688
Gandoman FH, Ahmed EM, Ali ZM, Berecibar M, Zobaa AF, Abdel Aleem SHE. Reliability Evaluation of Lithium-Ion Batteries for E-Mobility Applications from Practical and Technical Perspectives: A Case Study. Sustainability. 2021; 13(21):11688. https://doi.org/10.3390/su132111688
Chicago/Turabian StyleGandoman, Foad H., Emad M. Ahmed, Ziad M. Ali, Maitane Berecibar, Ahmed F. Zobaa, and Shady H. E. Abdel Aleem. 2021. "Reliability Evaluation of Lithium-Ion Batteries for E-Mobility Applications from Practical and Technical Perspectives: A Case Study" Sustainability 13, no. 21: 11688. https://doi.org/10.3390/su132111688
APA StyleGandoman, F. H., Ahmed, E. M., Ali, Z. M., Berecibar, M., Zobaa, A. F., & Abdel Aleem, S. H. E. (2021). Reliability Evaluation of Lithium-Ion Batteries for E-Mobility Applications from Practical and Technical Perspectives: A Case Study. Sustainability, 13(21), 11688. https://doi.org/10.3390/su132111688