
The Synergy of Living and Water Wall in Indoor Environment—Case Study in City of Brno, Czech Republic

 , , , , , and
Abstract
:1. Introduction
2. Materials and Methods
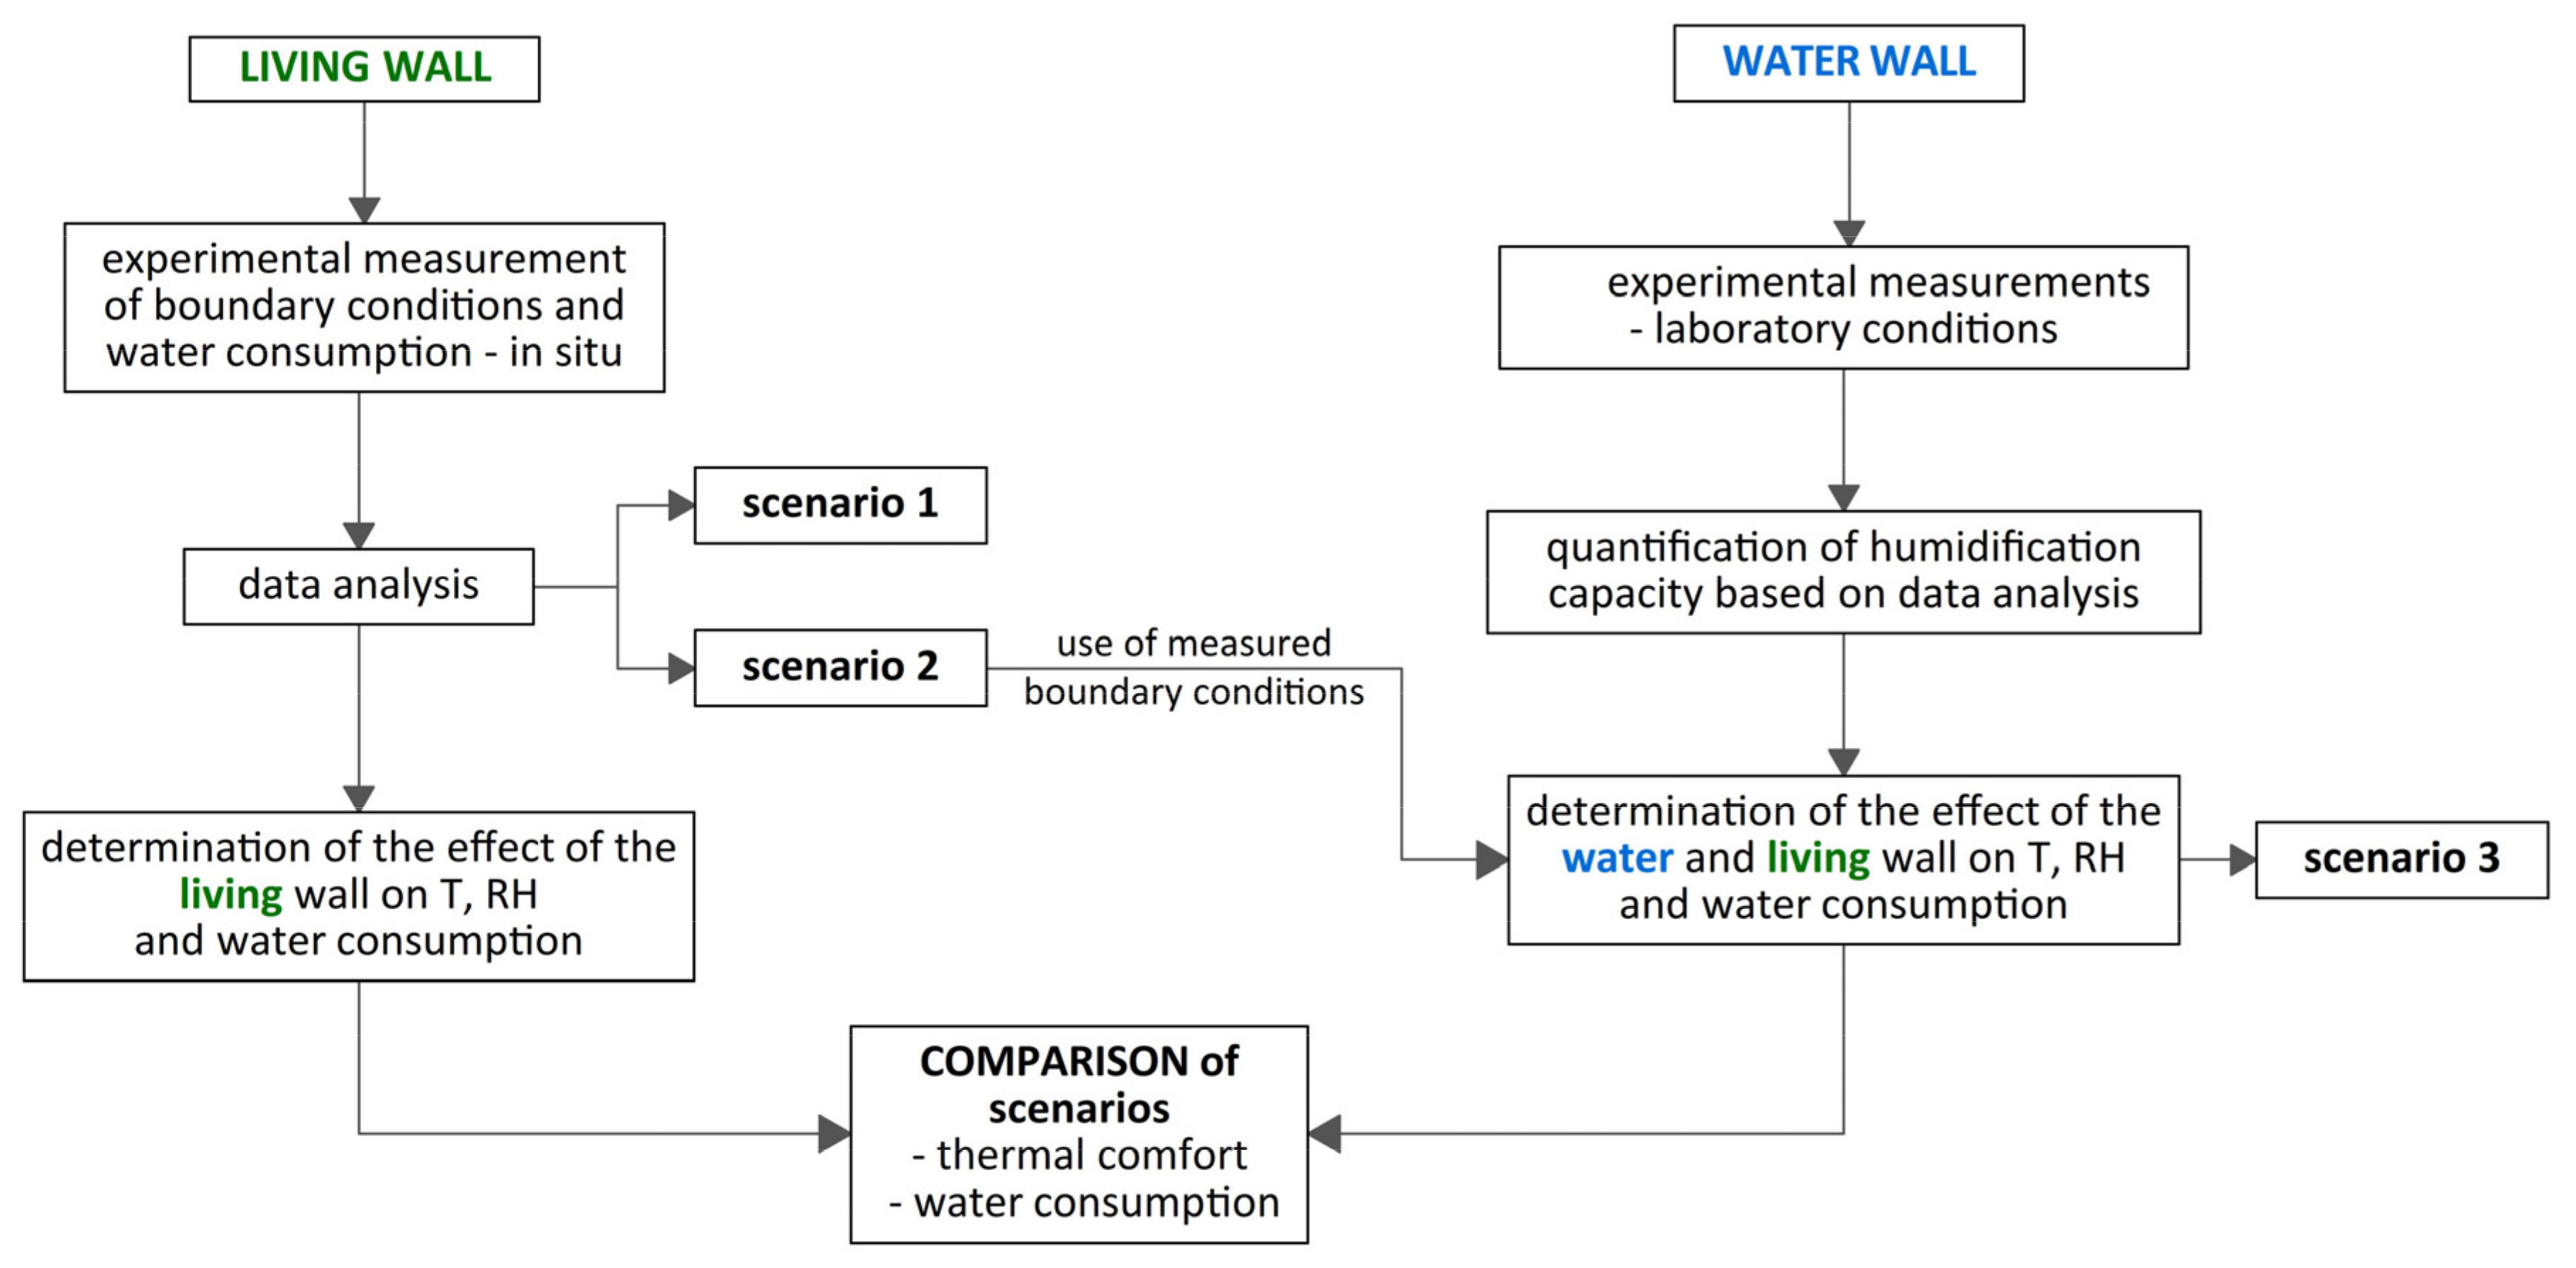
2.1. Research Methodology
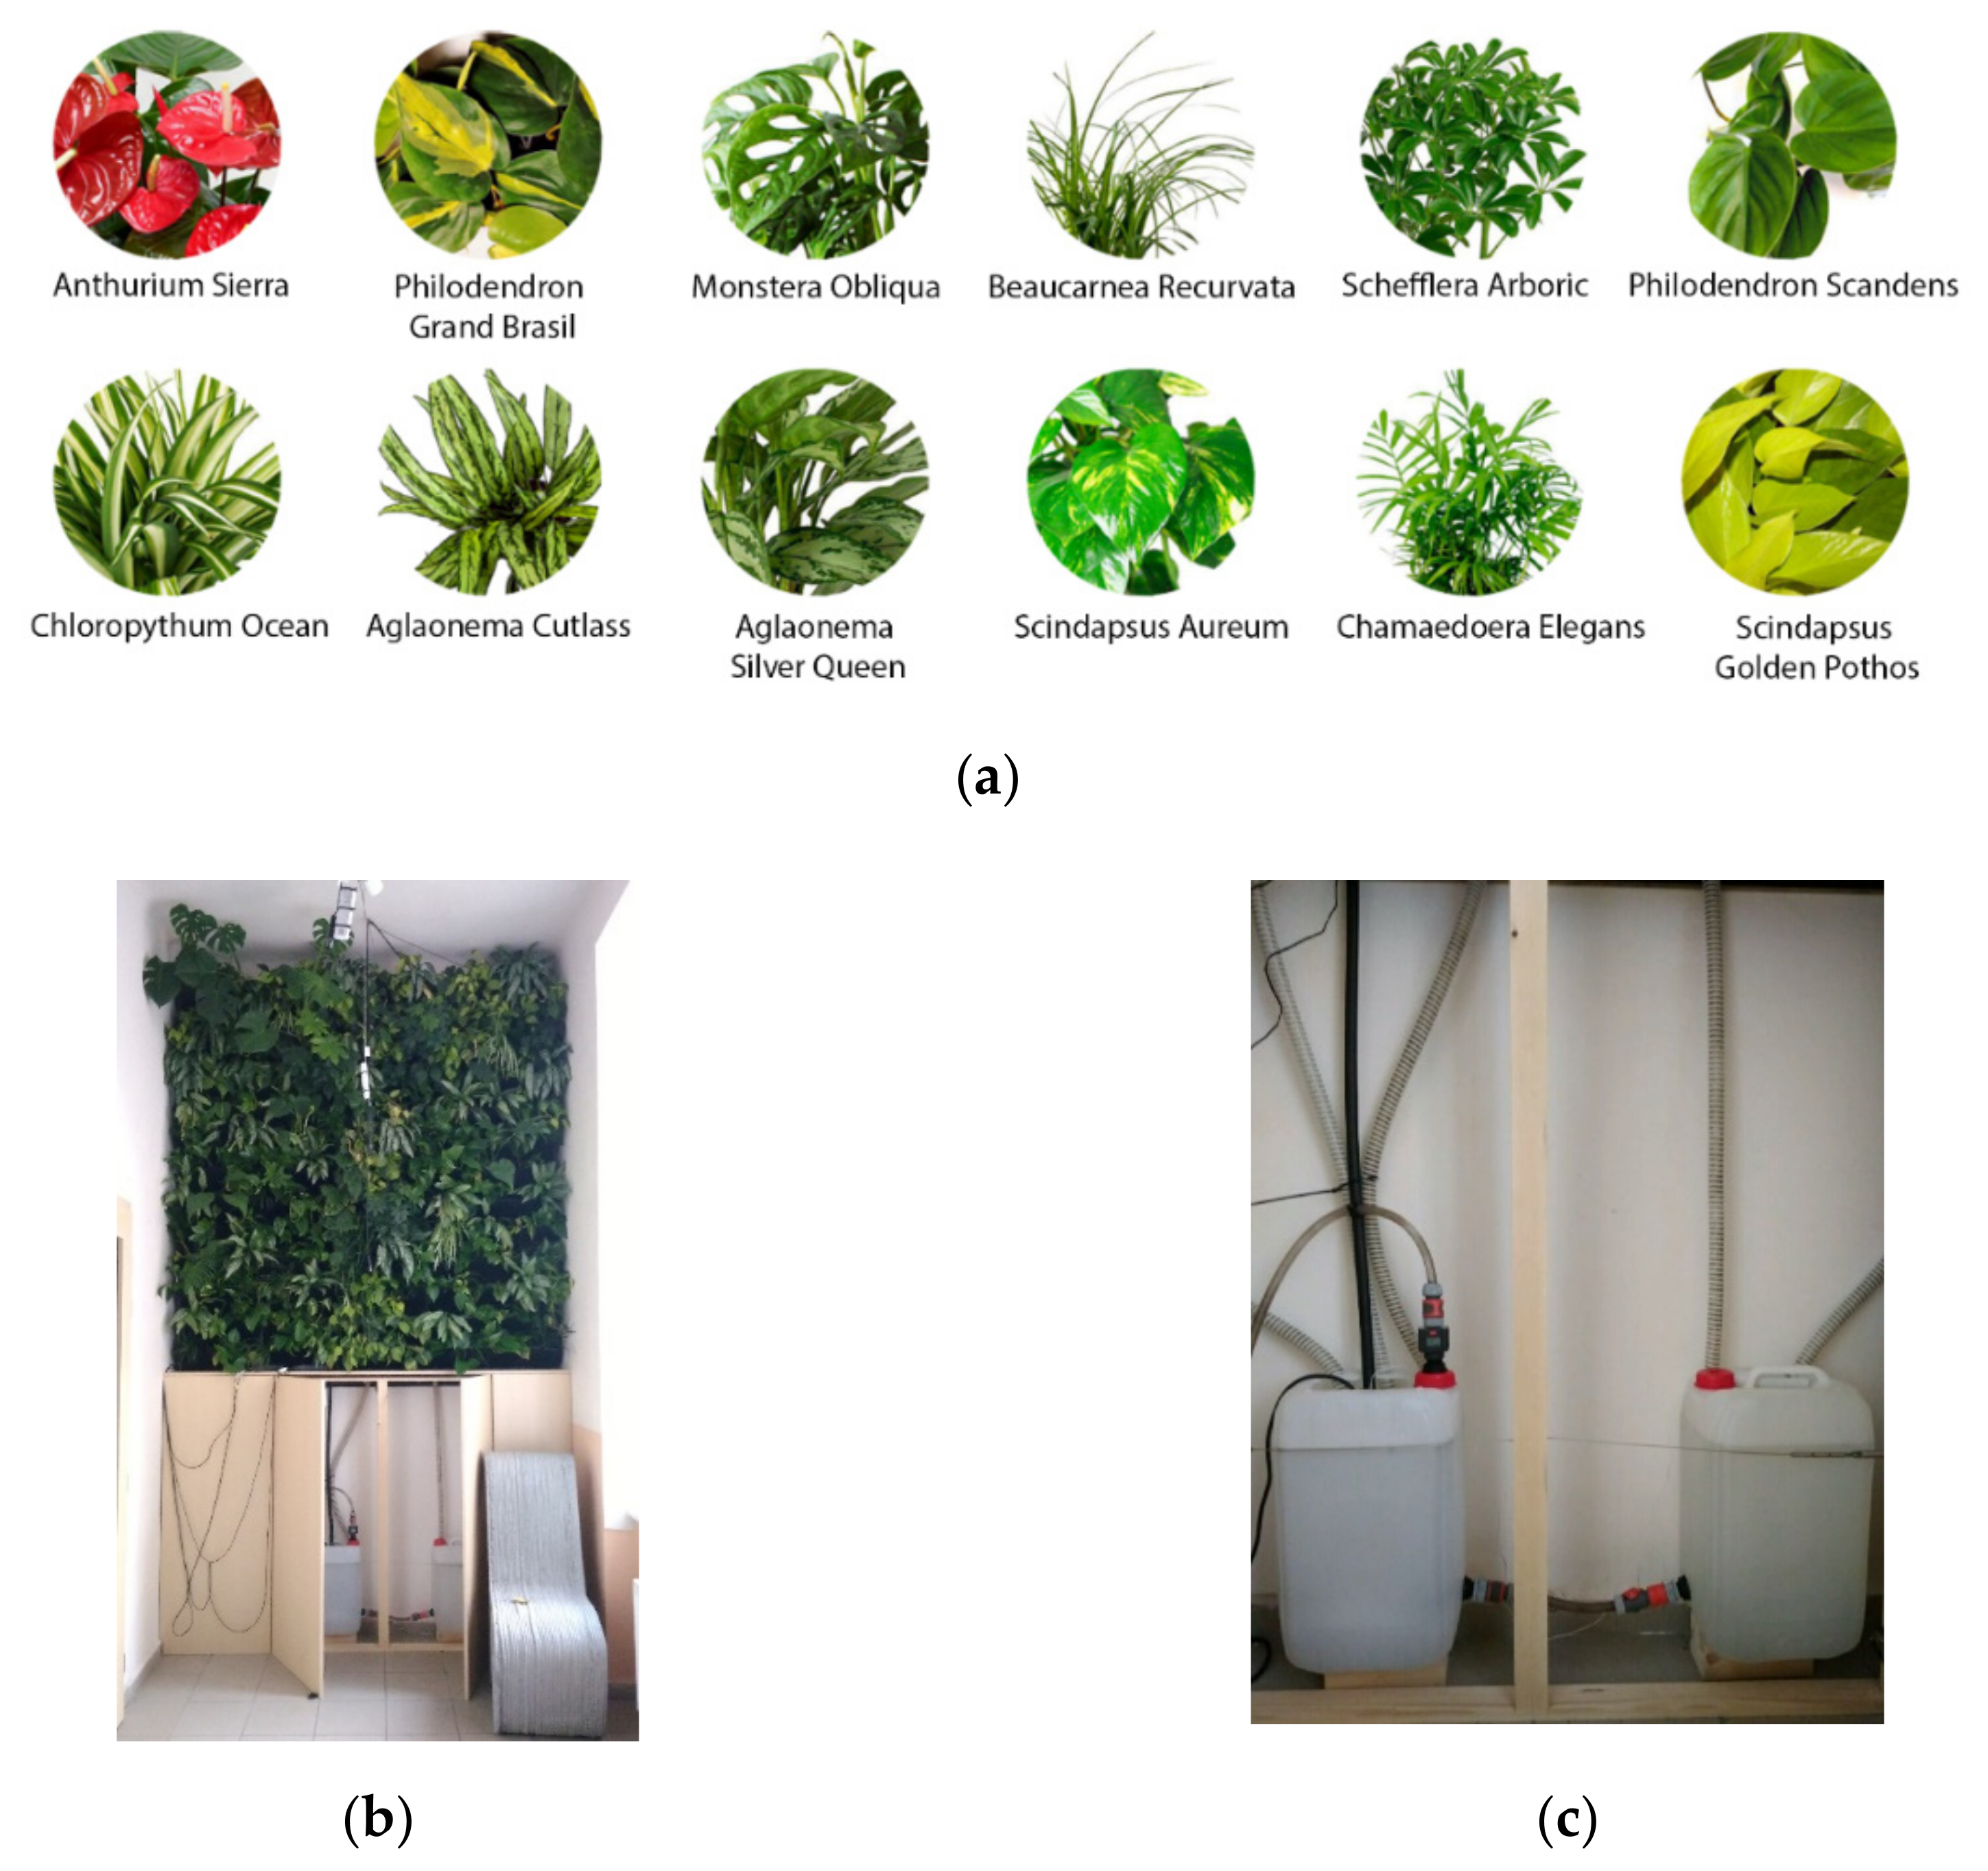
2.2. Living Wall
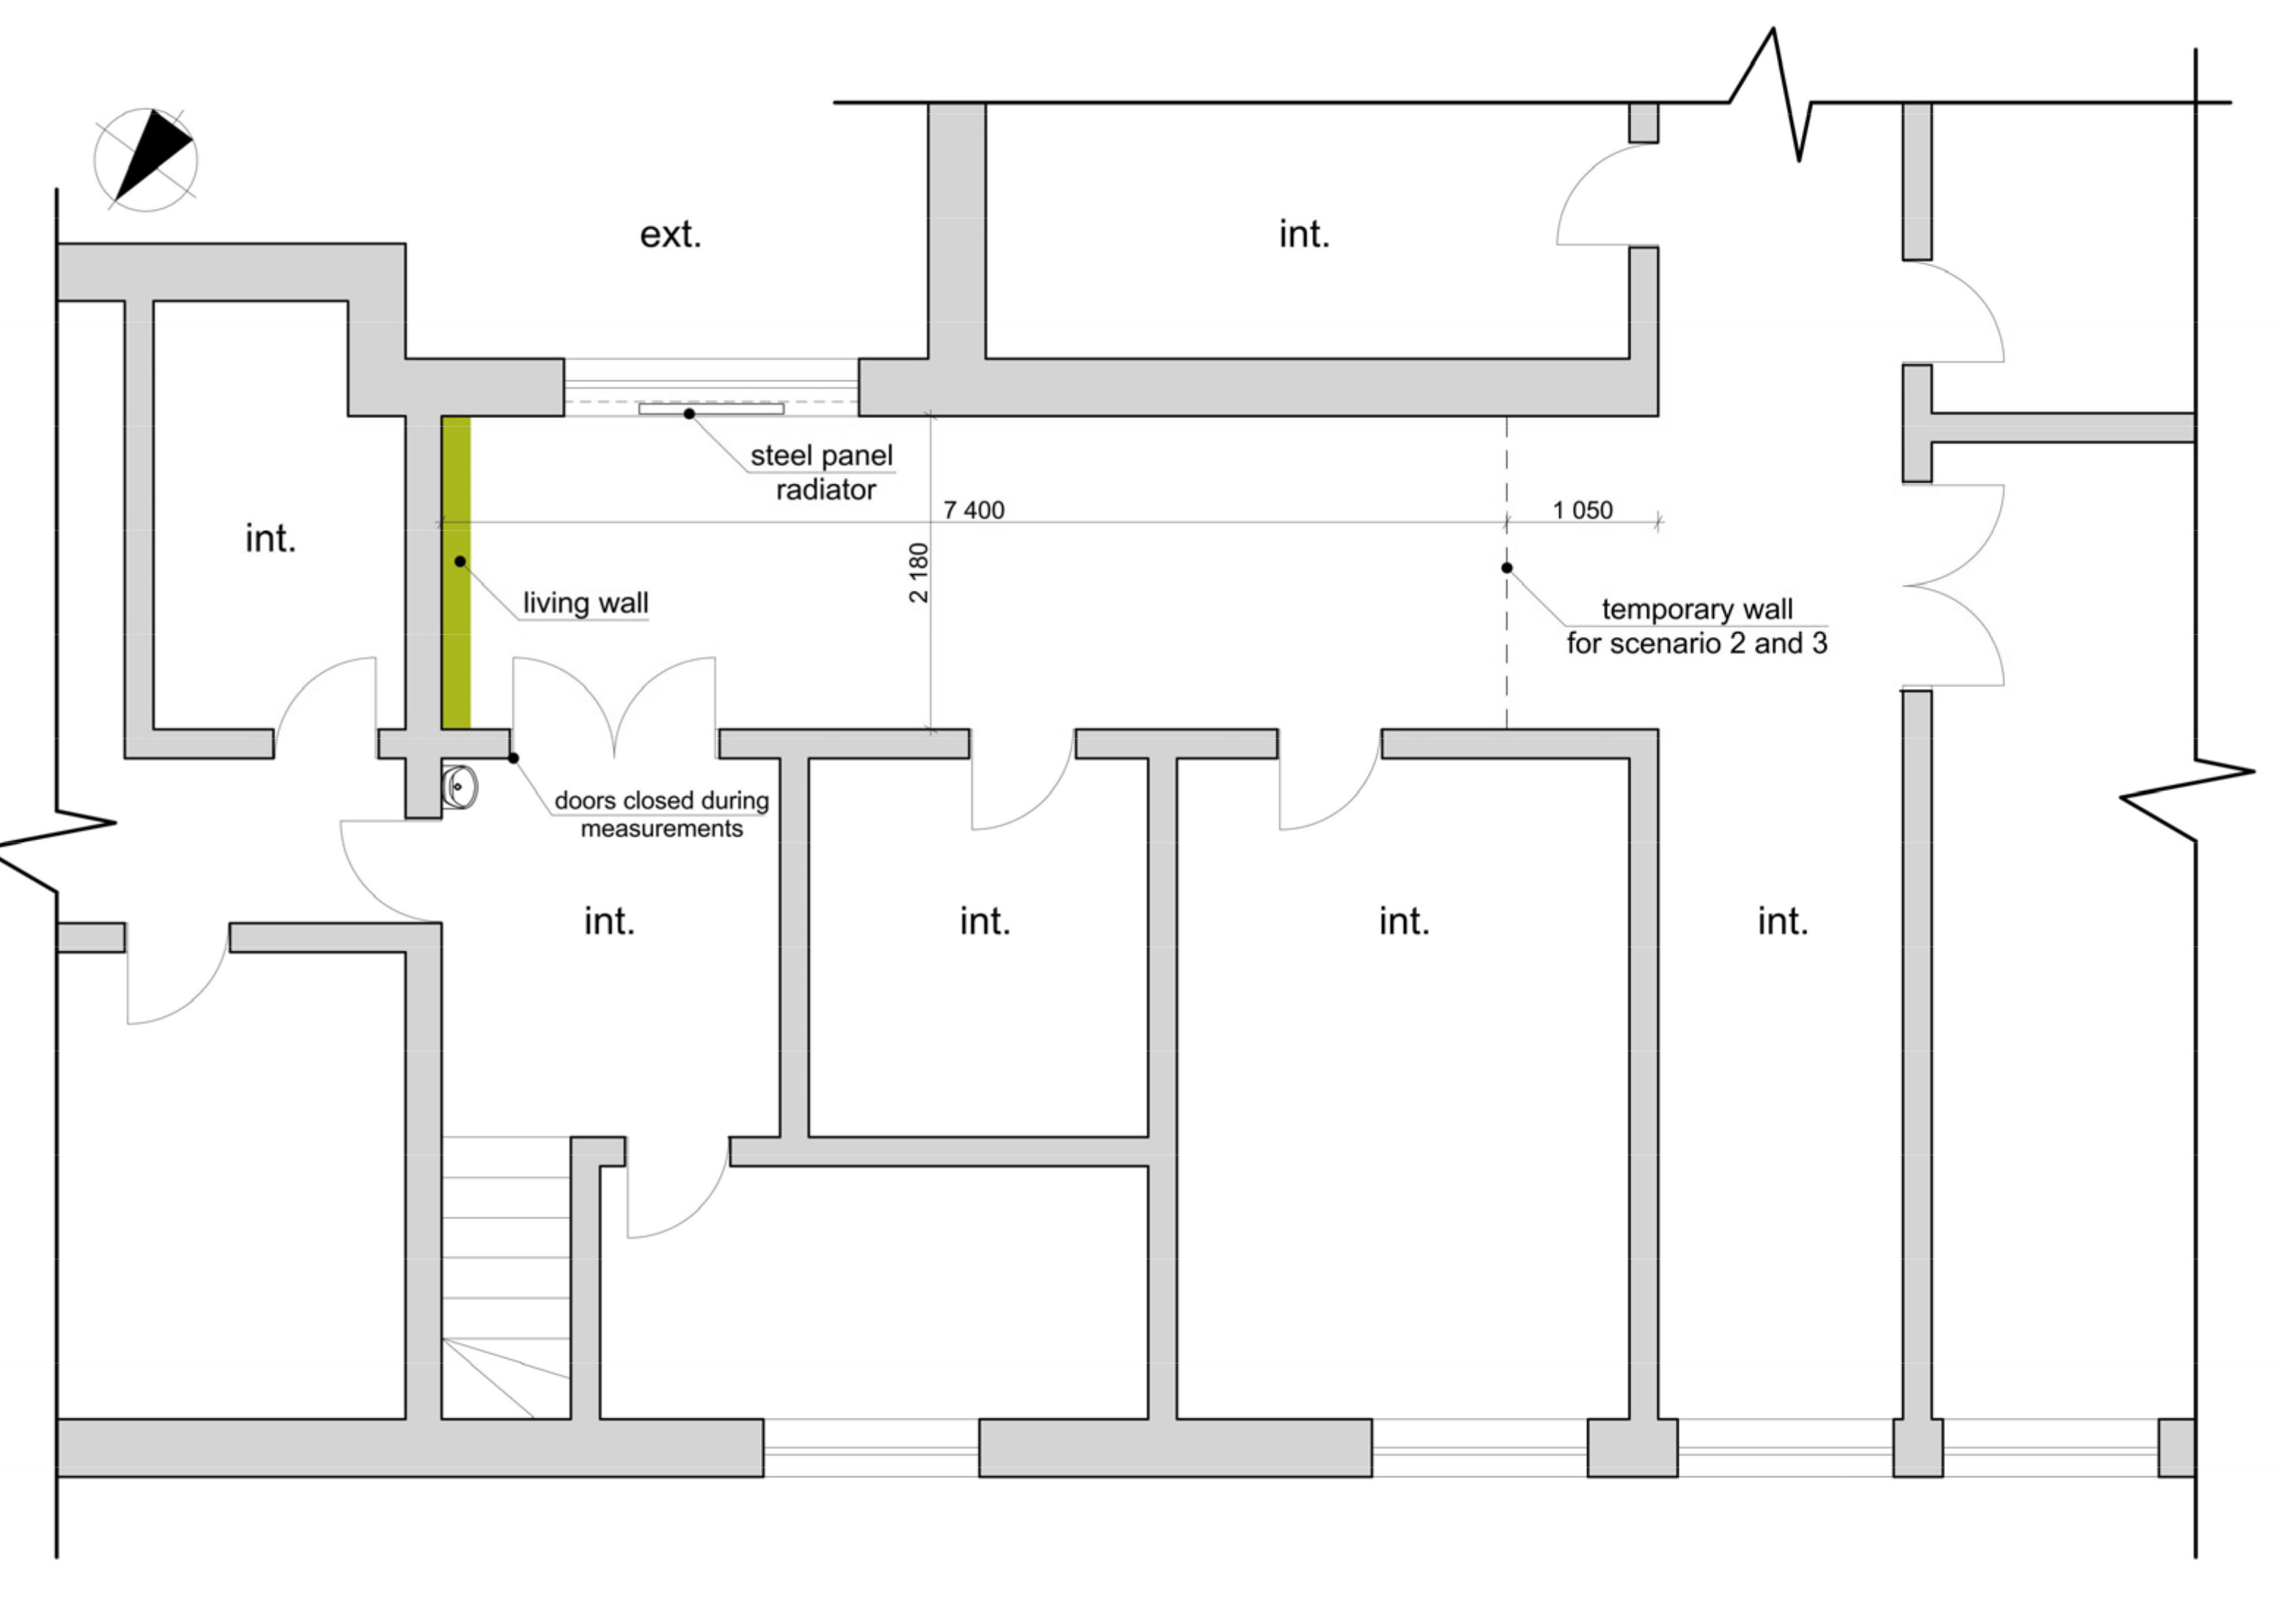
2.2.1. Location
2.2.2. Construction Process
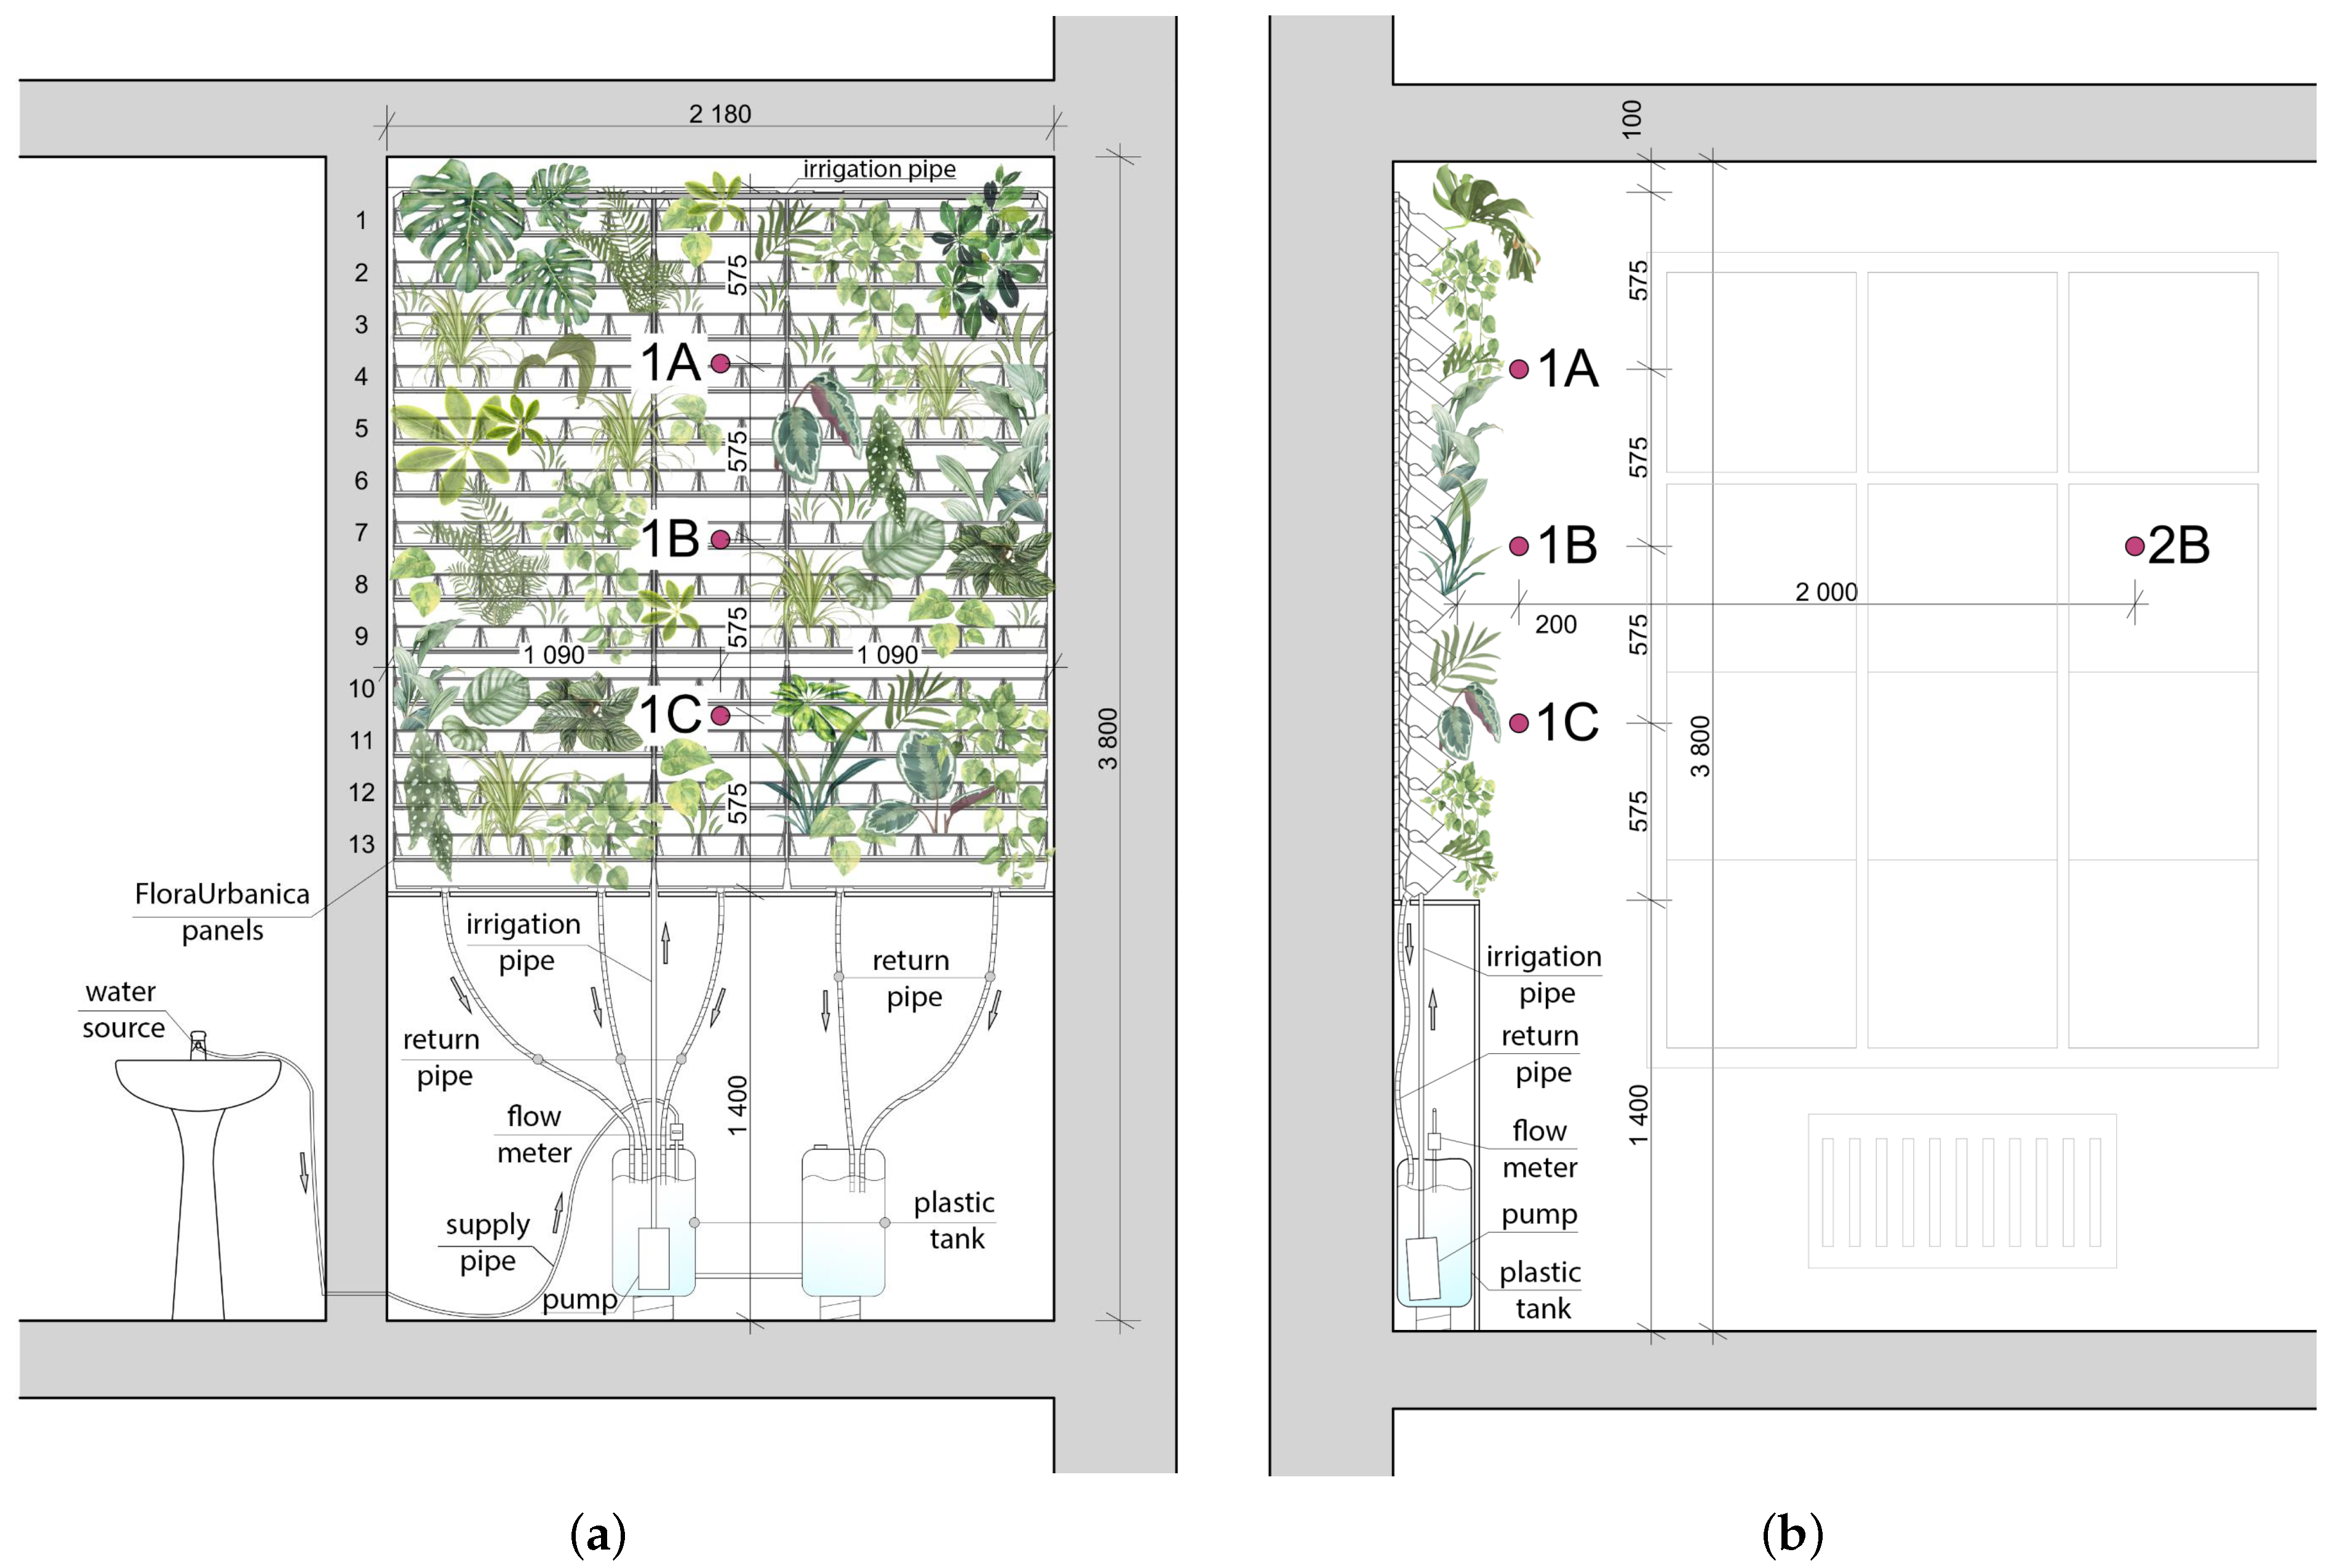
2.2.3. Irrigation System
2.2.4. Measuring Infrastructure
2.3. Water Wall
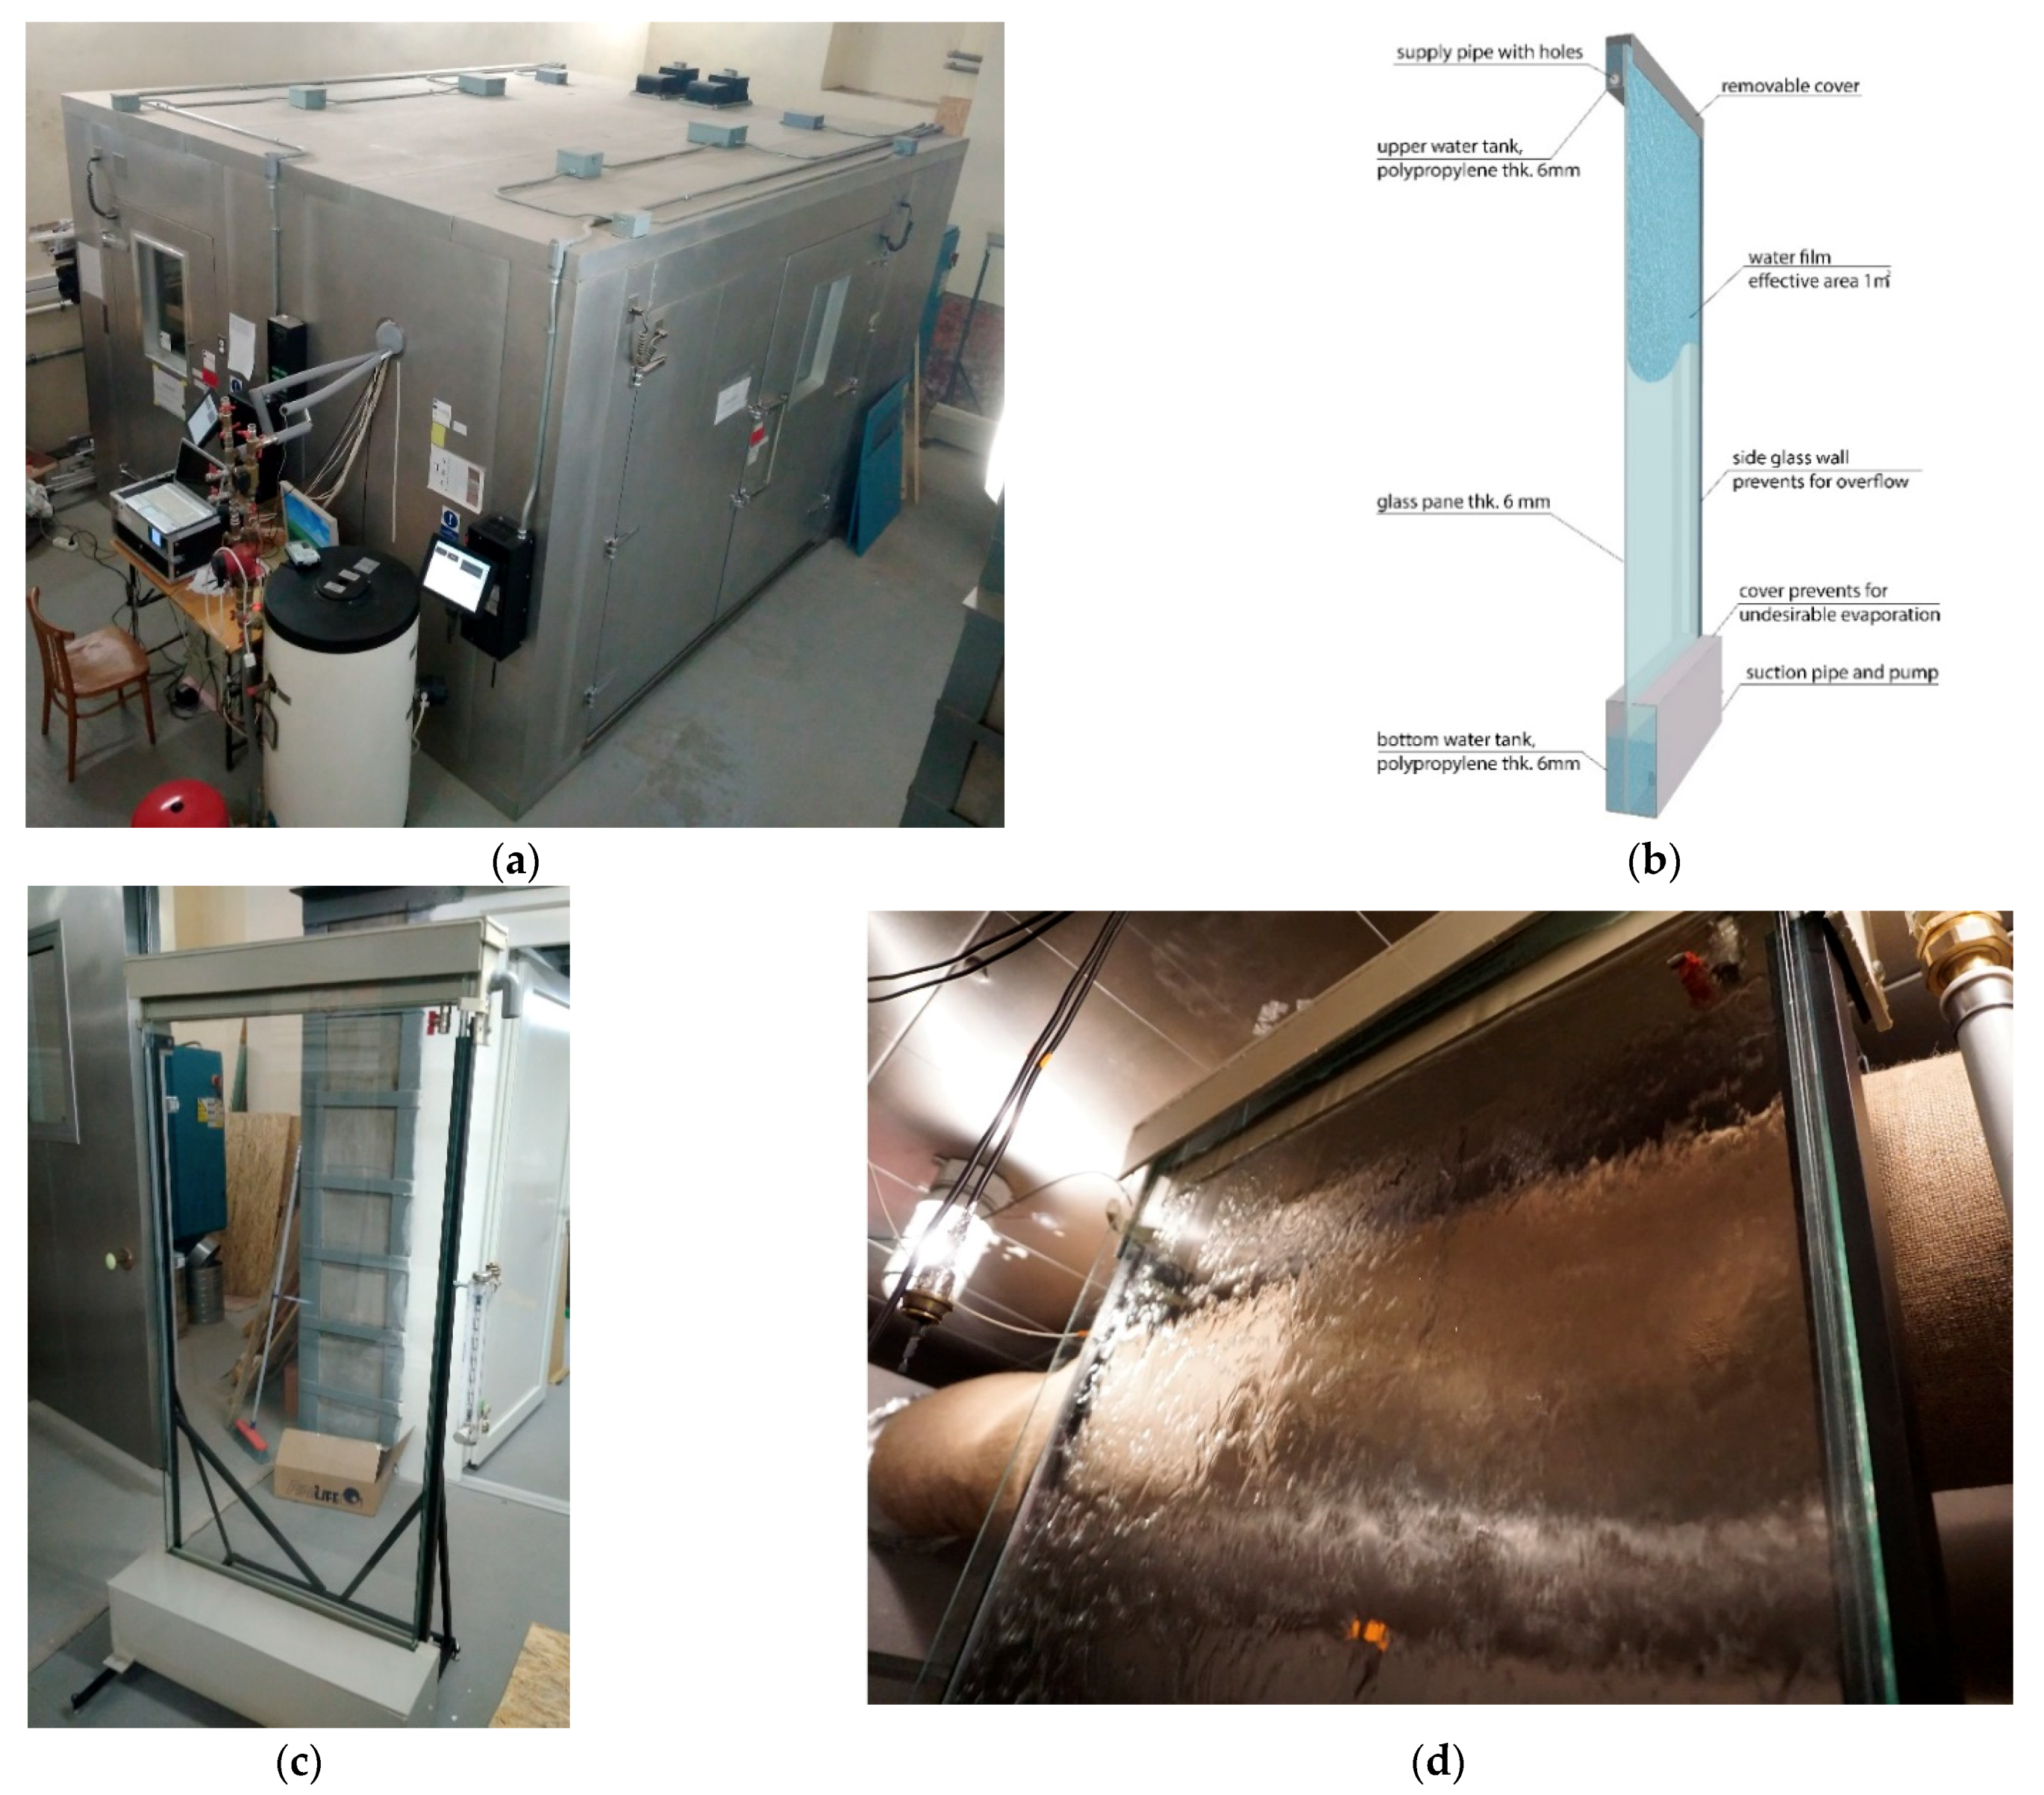
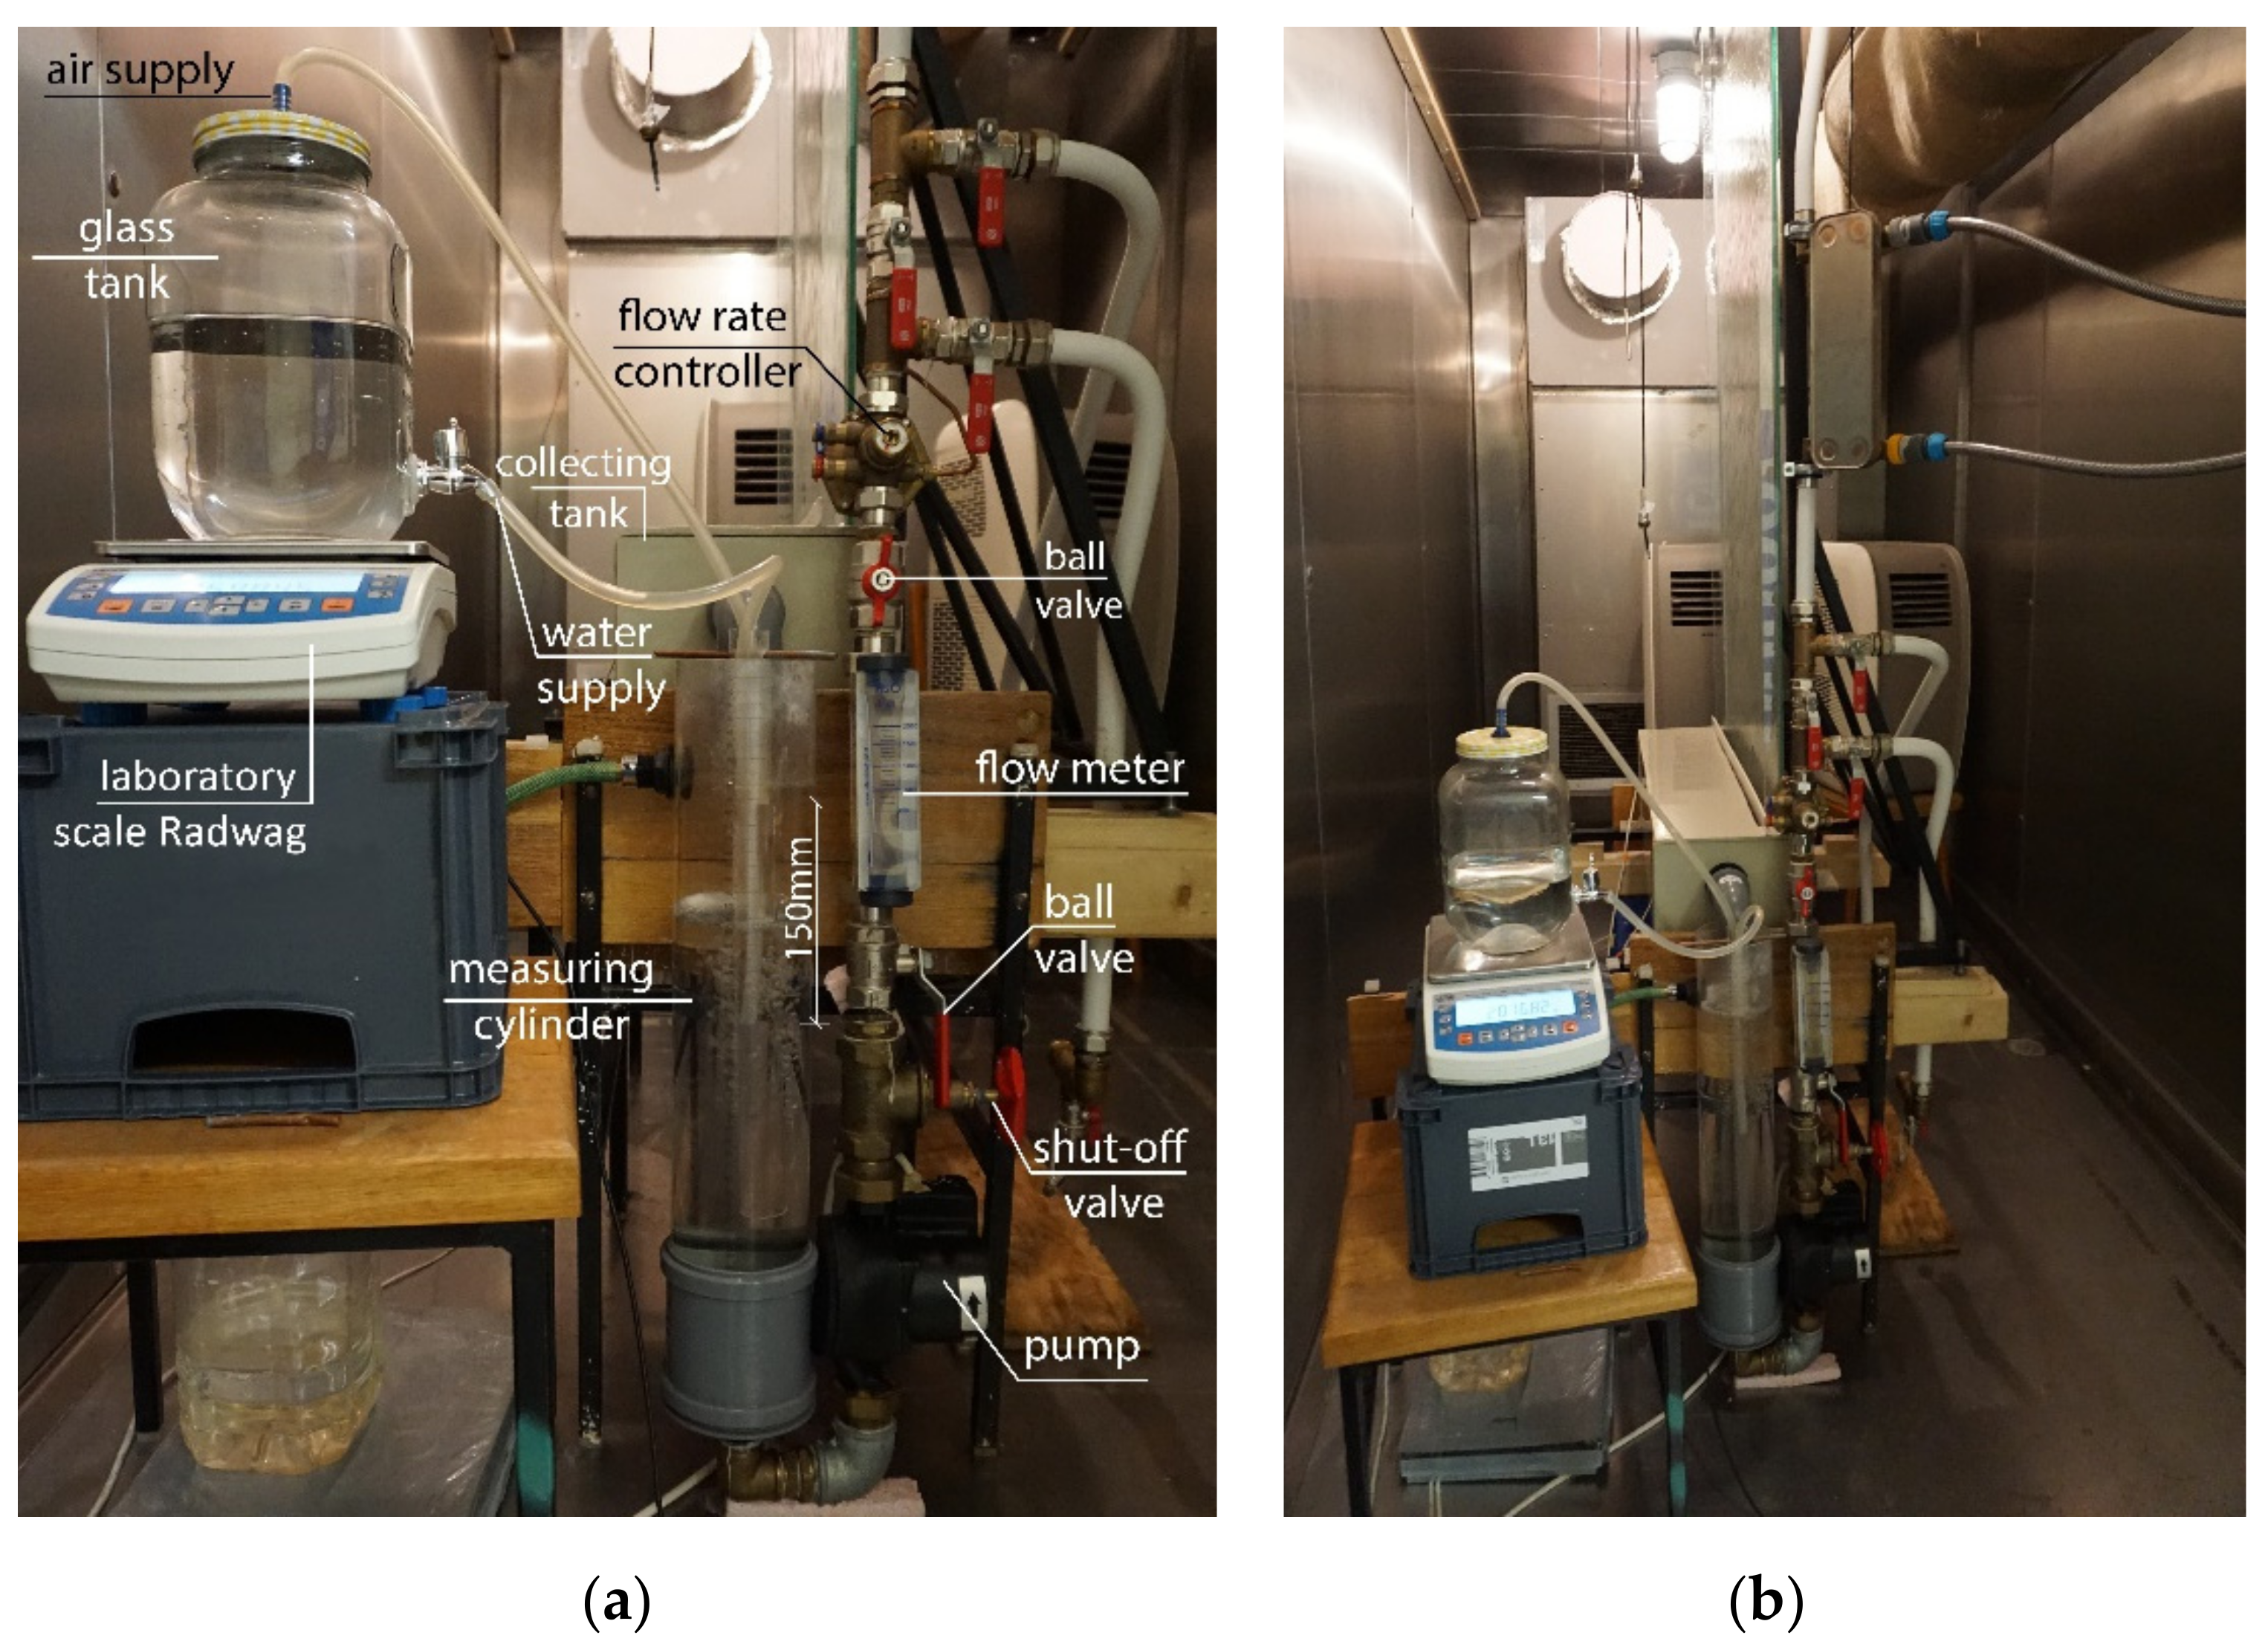
2.3.1. Laboratory Conditions and Water Wall Prototype Design
2.3.2. Measuring System
2.3.3. Measuring Infrastructure
3. Results and Discussion
3.1. Living Wall
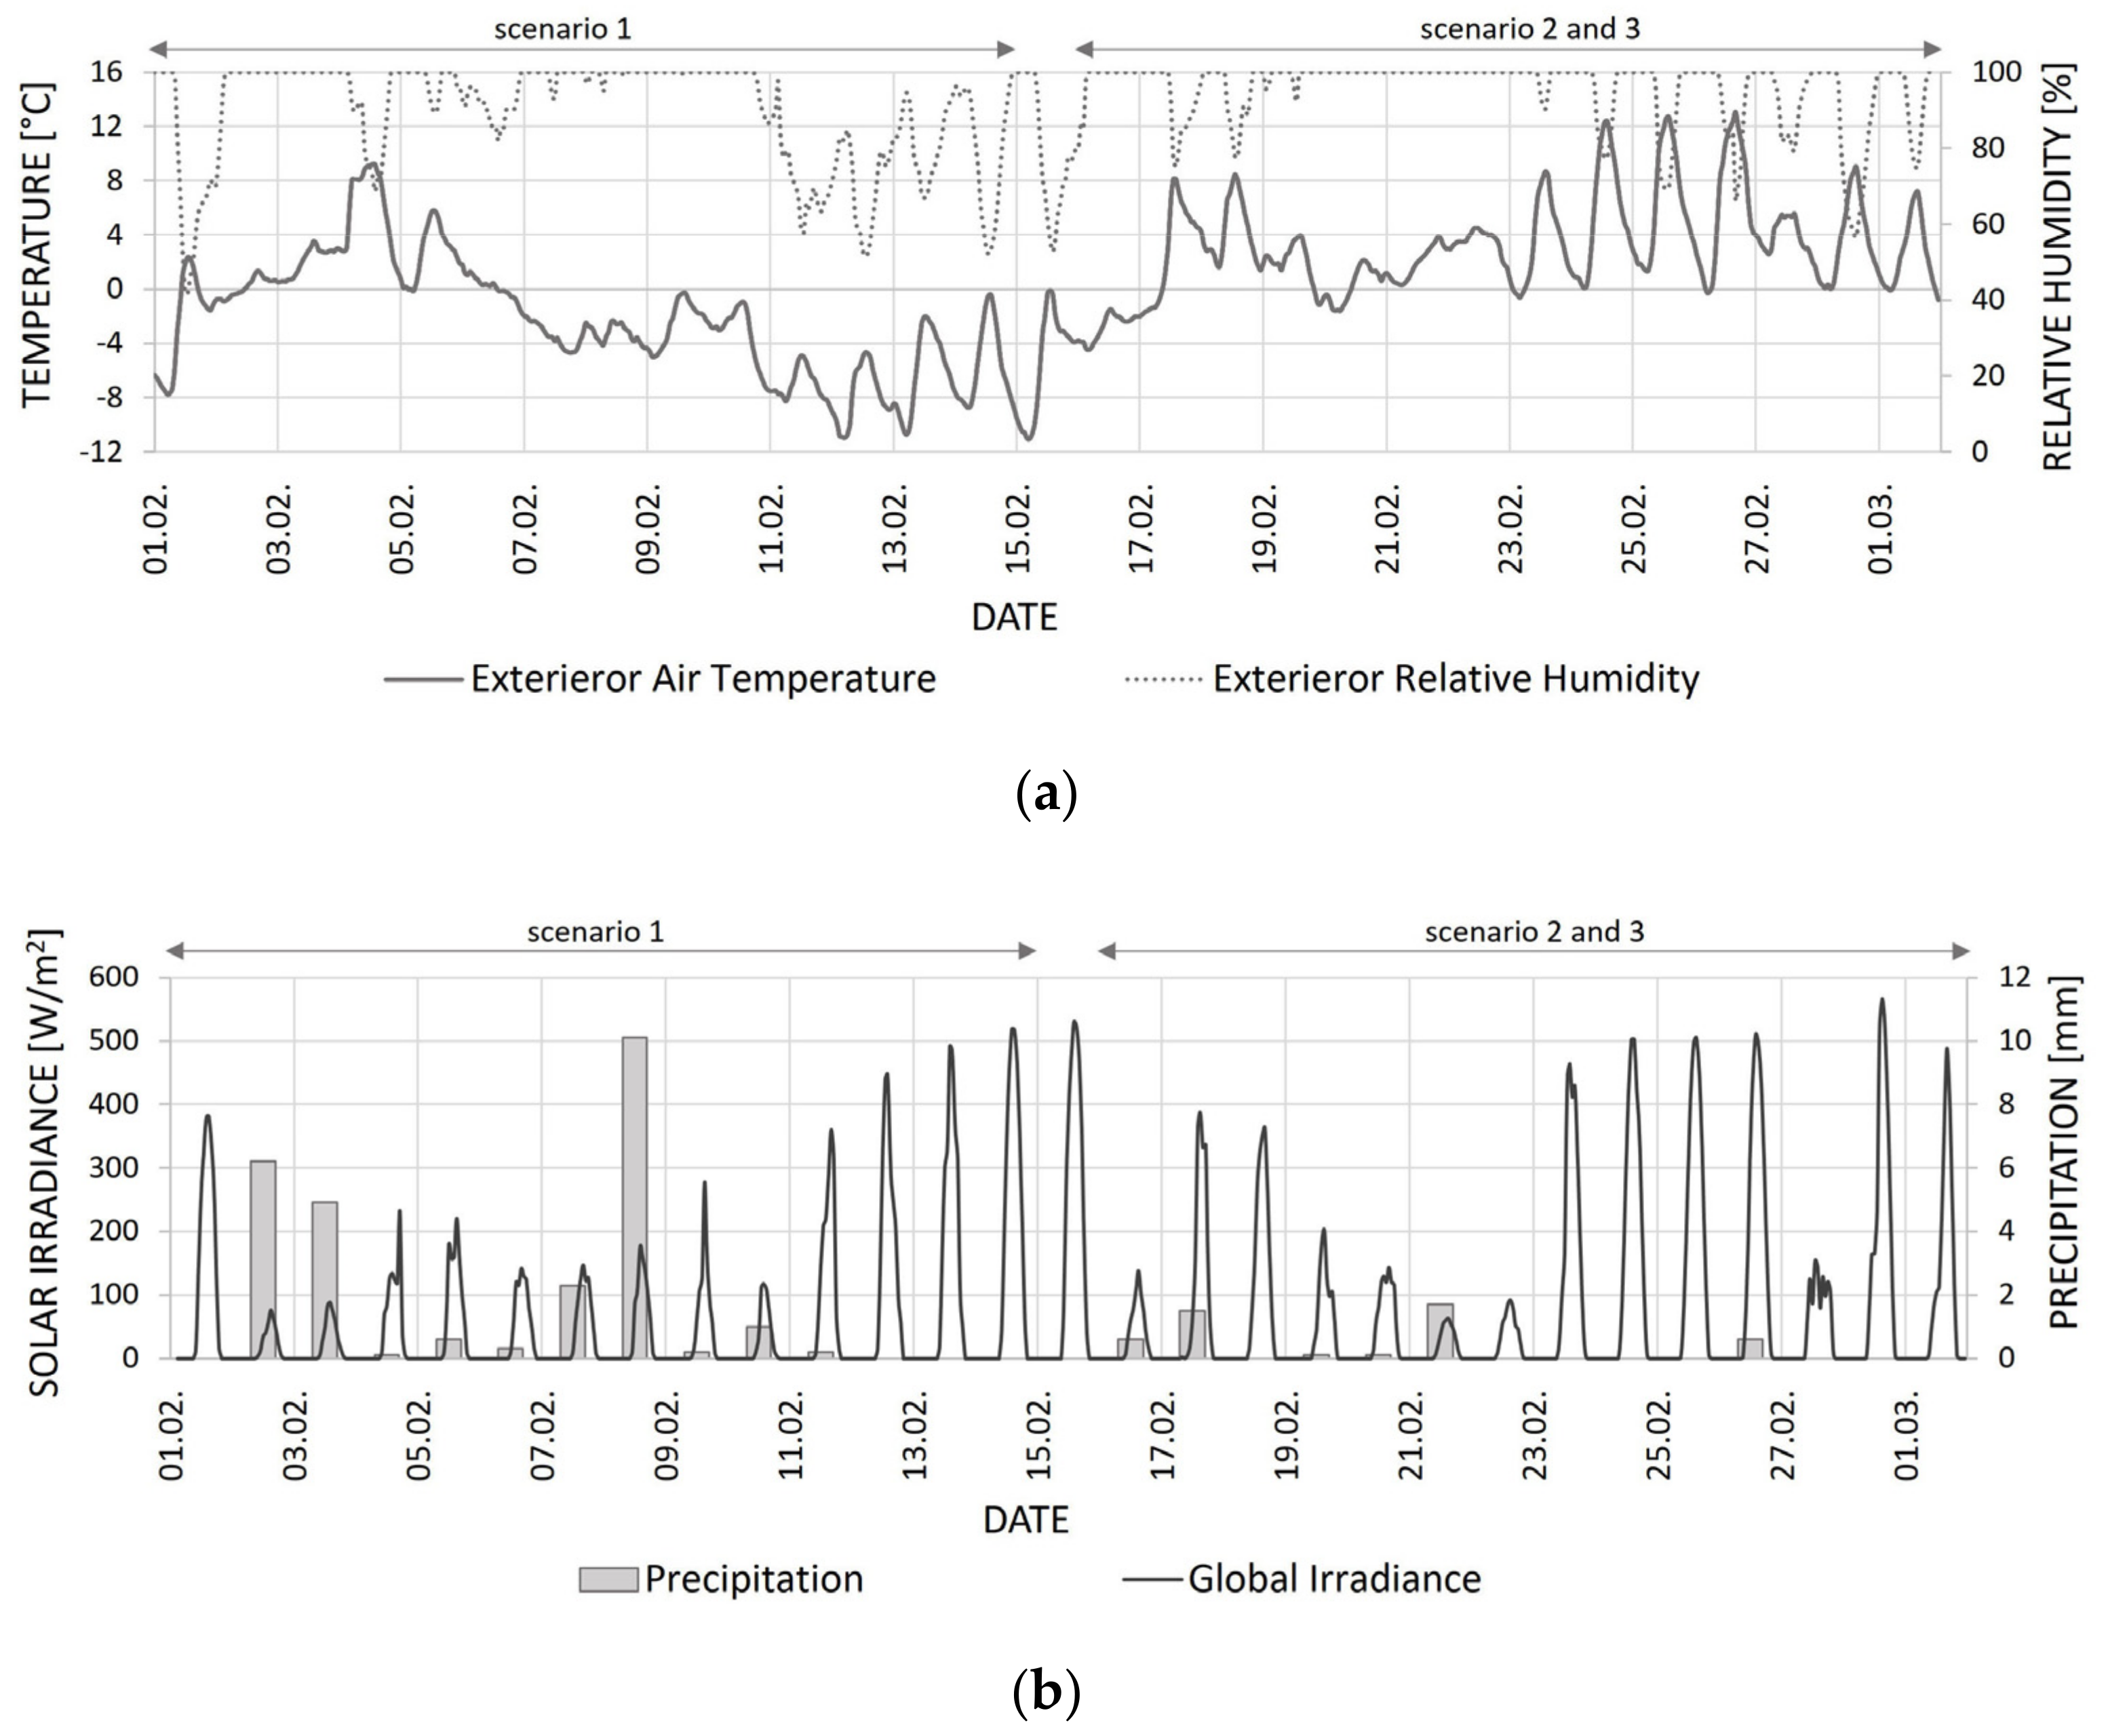
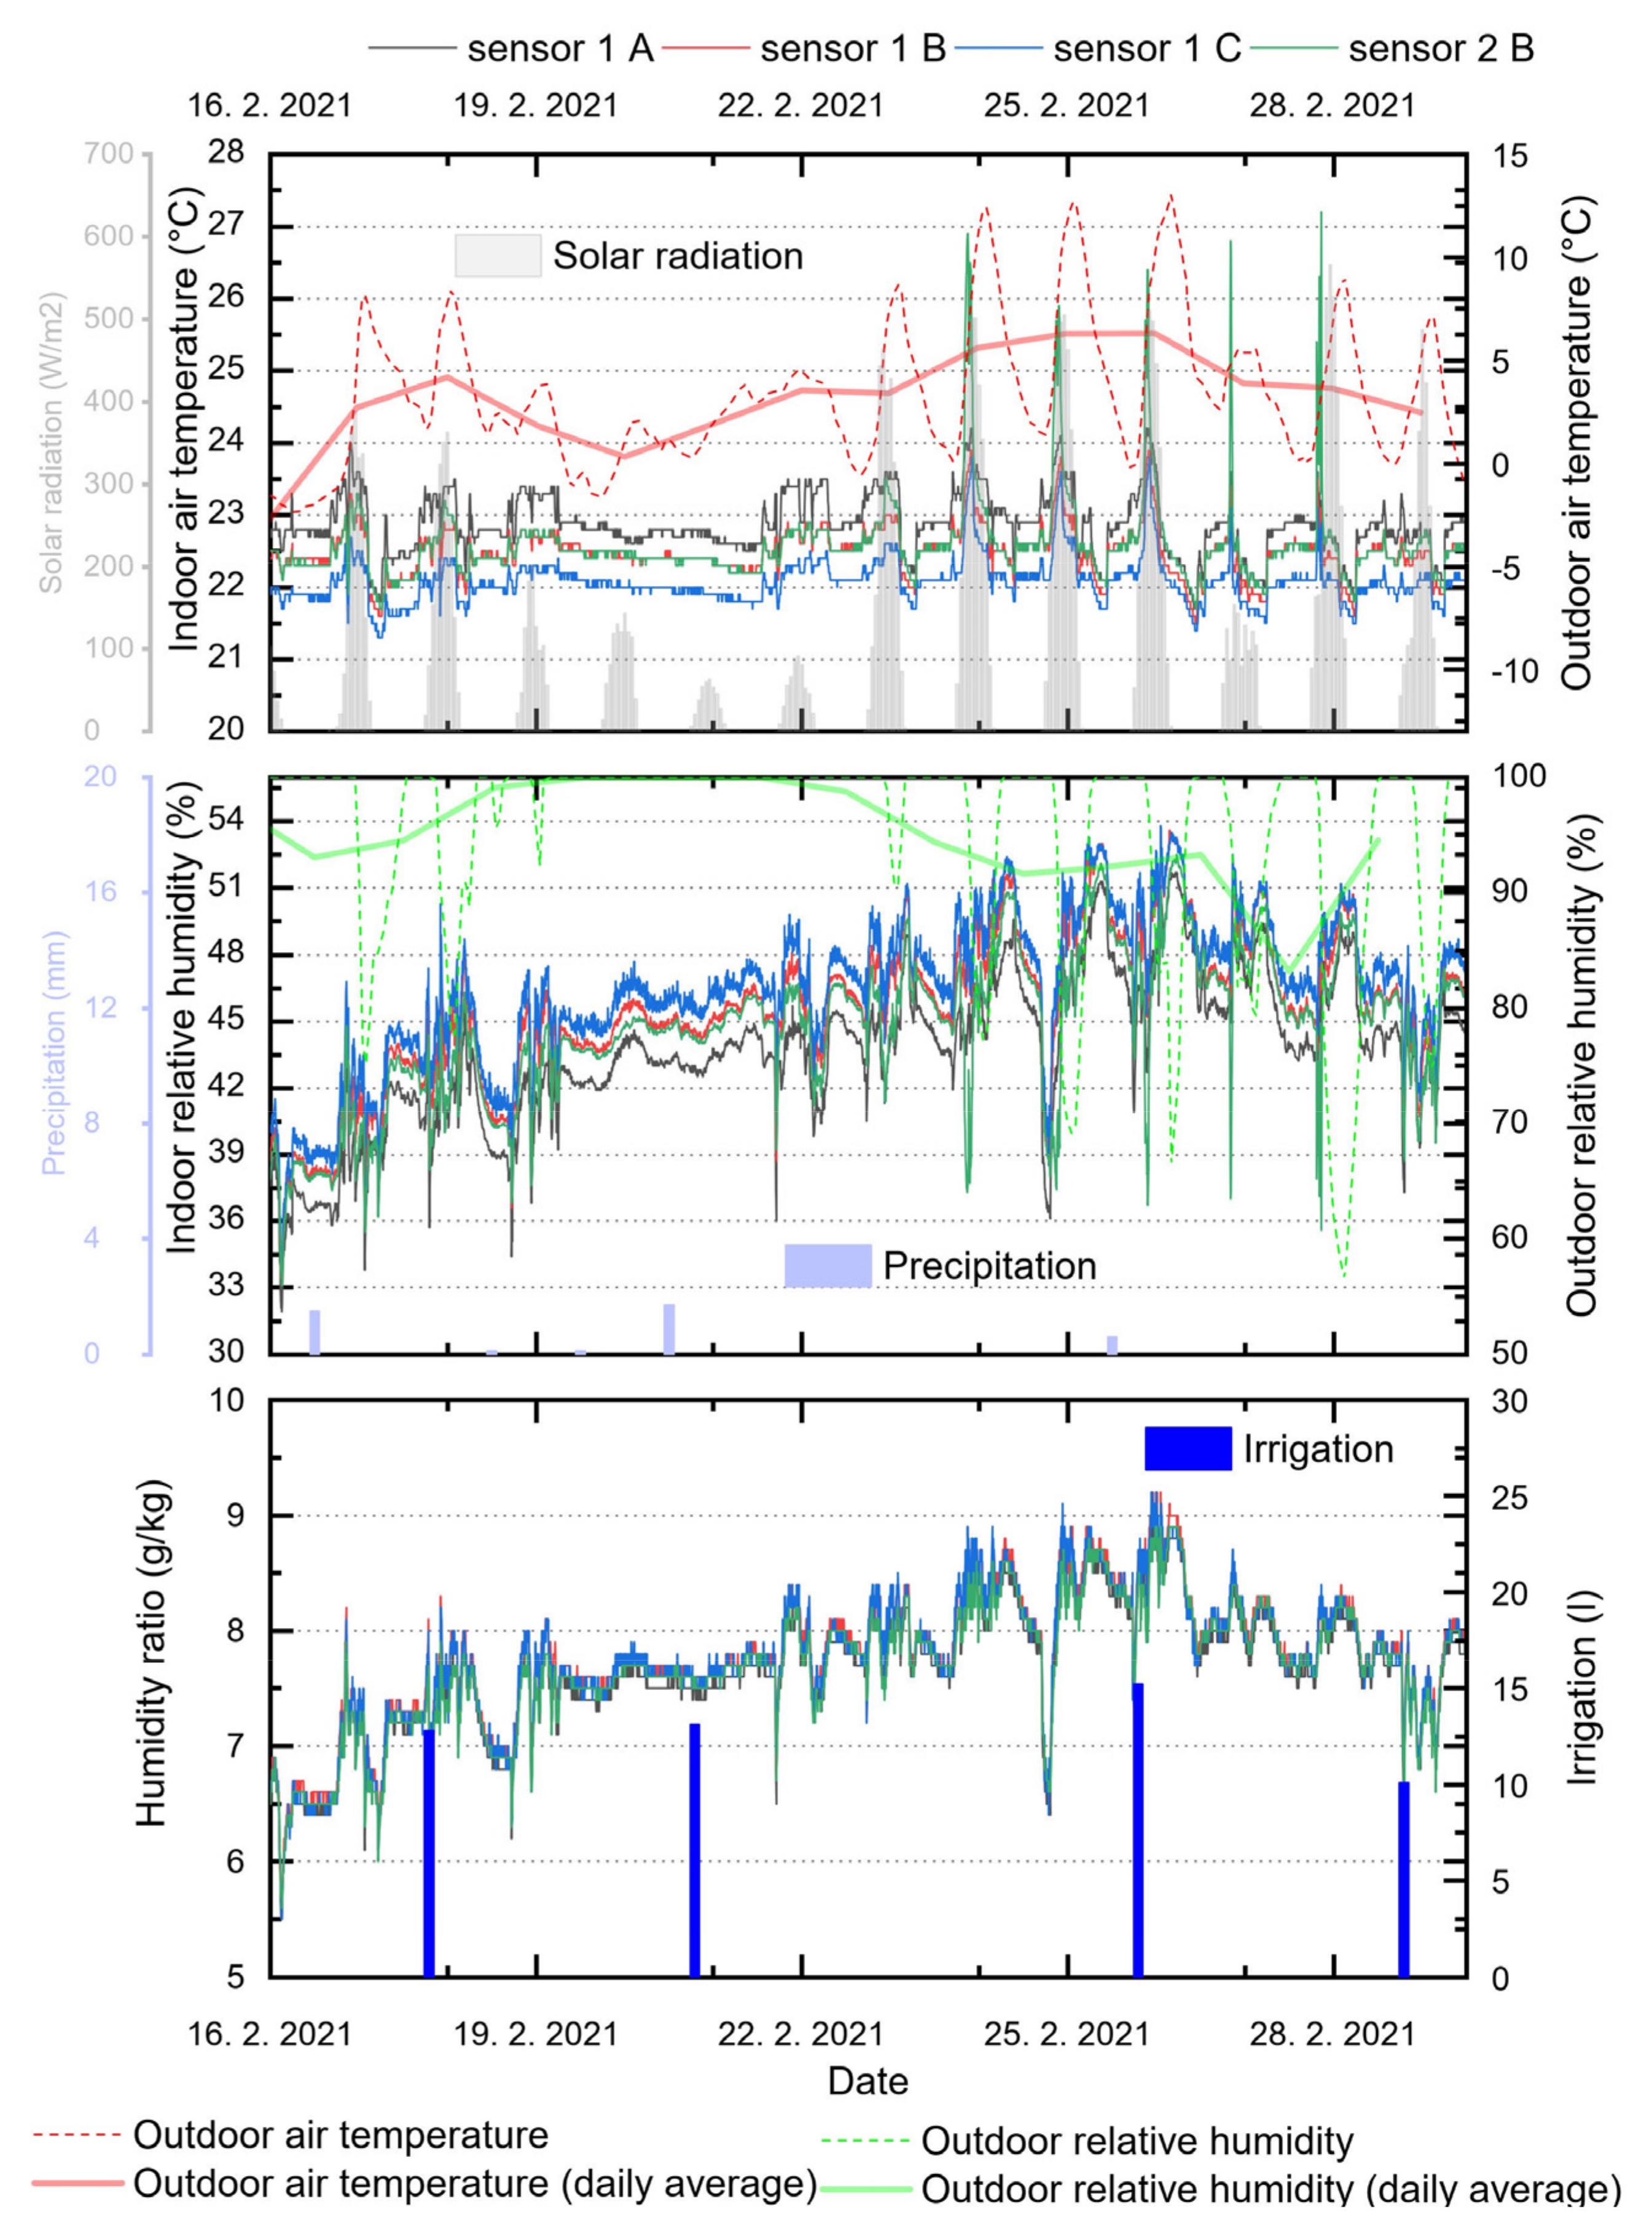
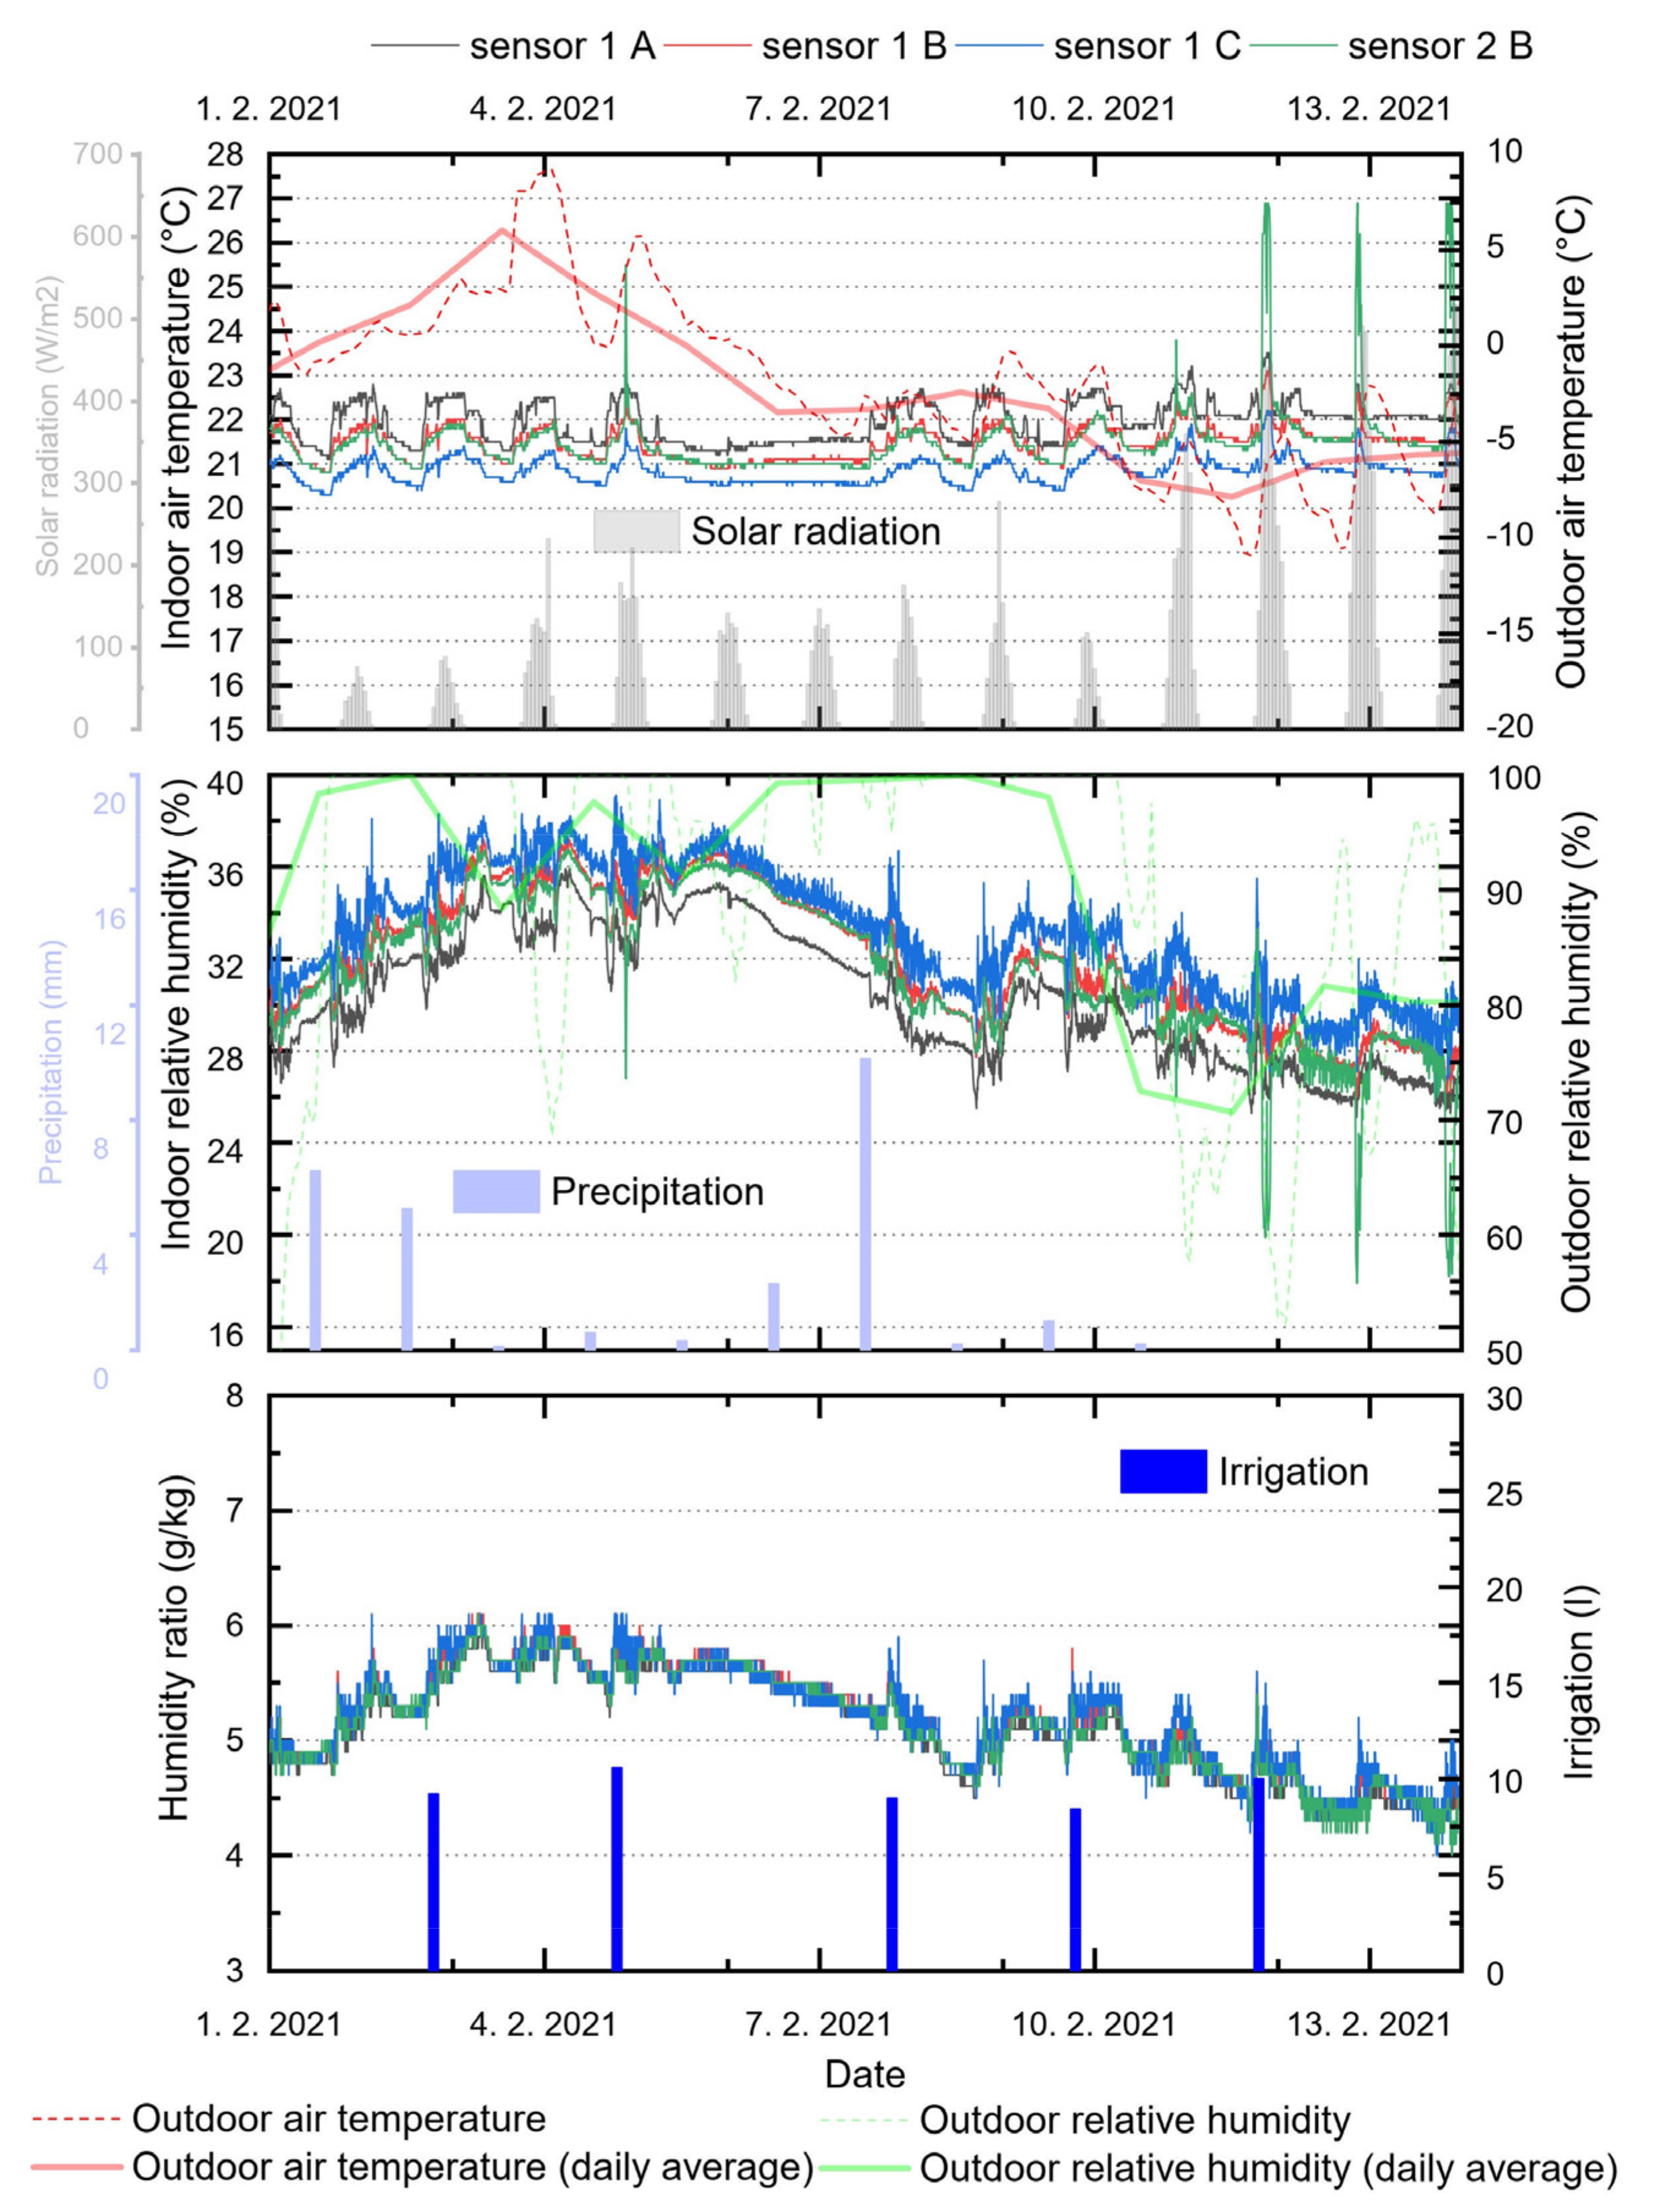
3.1.1. Scenario 1
3.1.2. Scenario 2
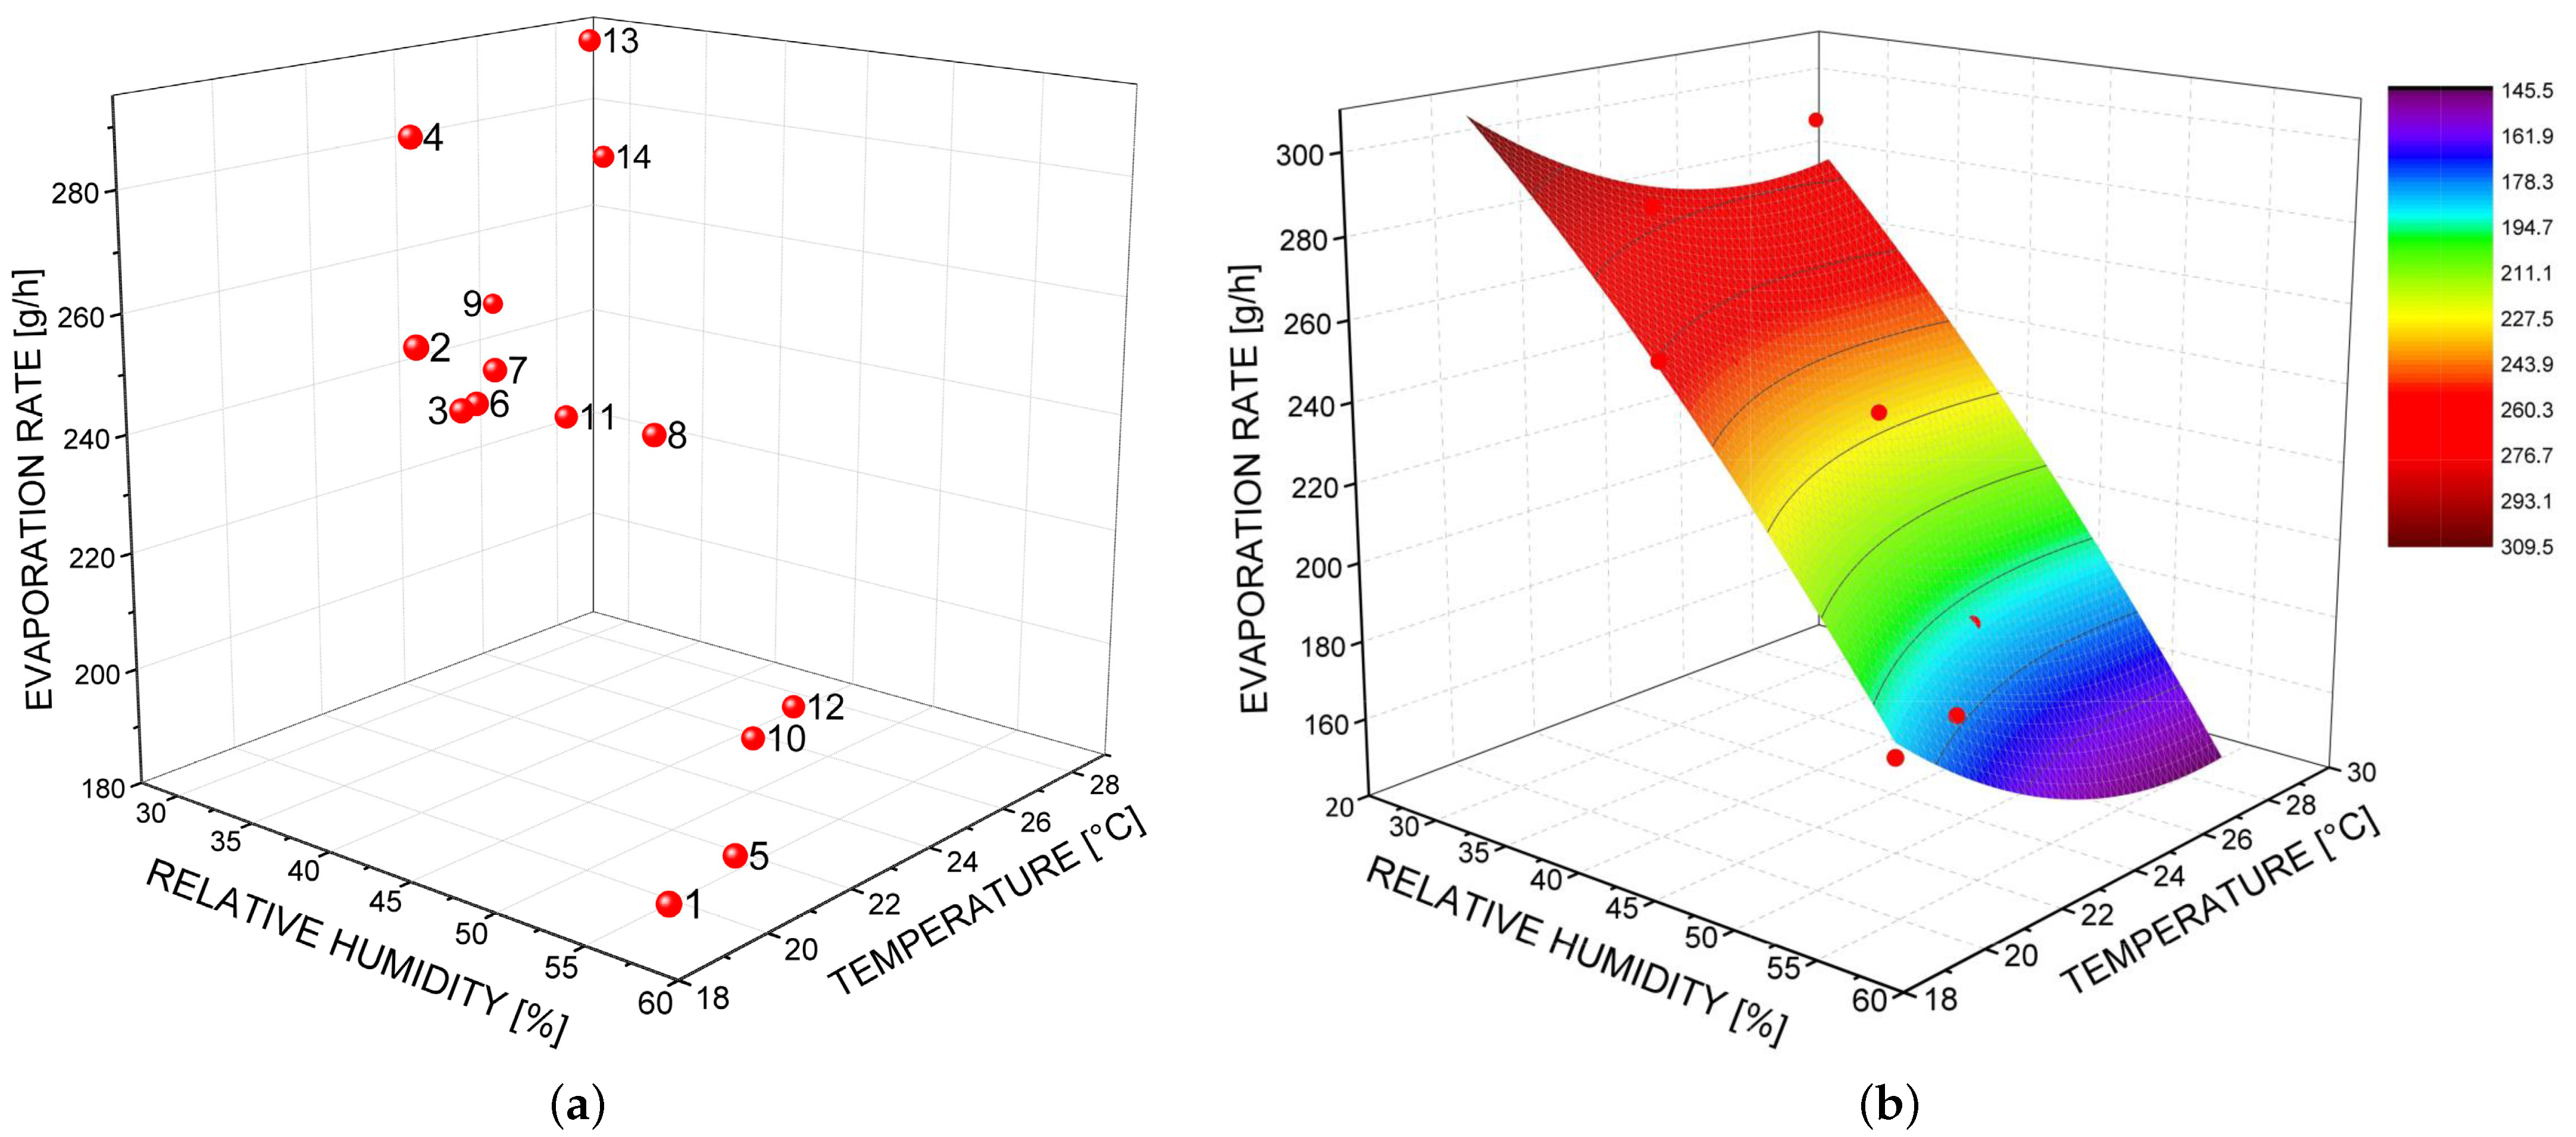
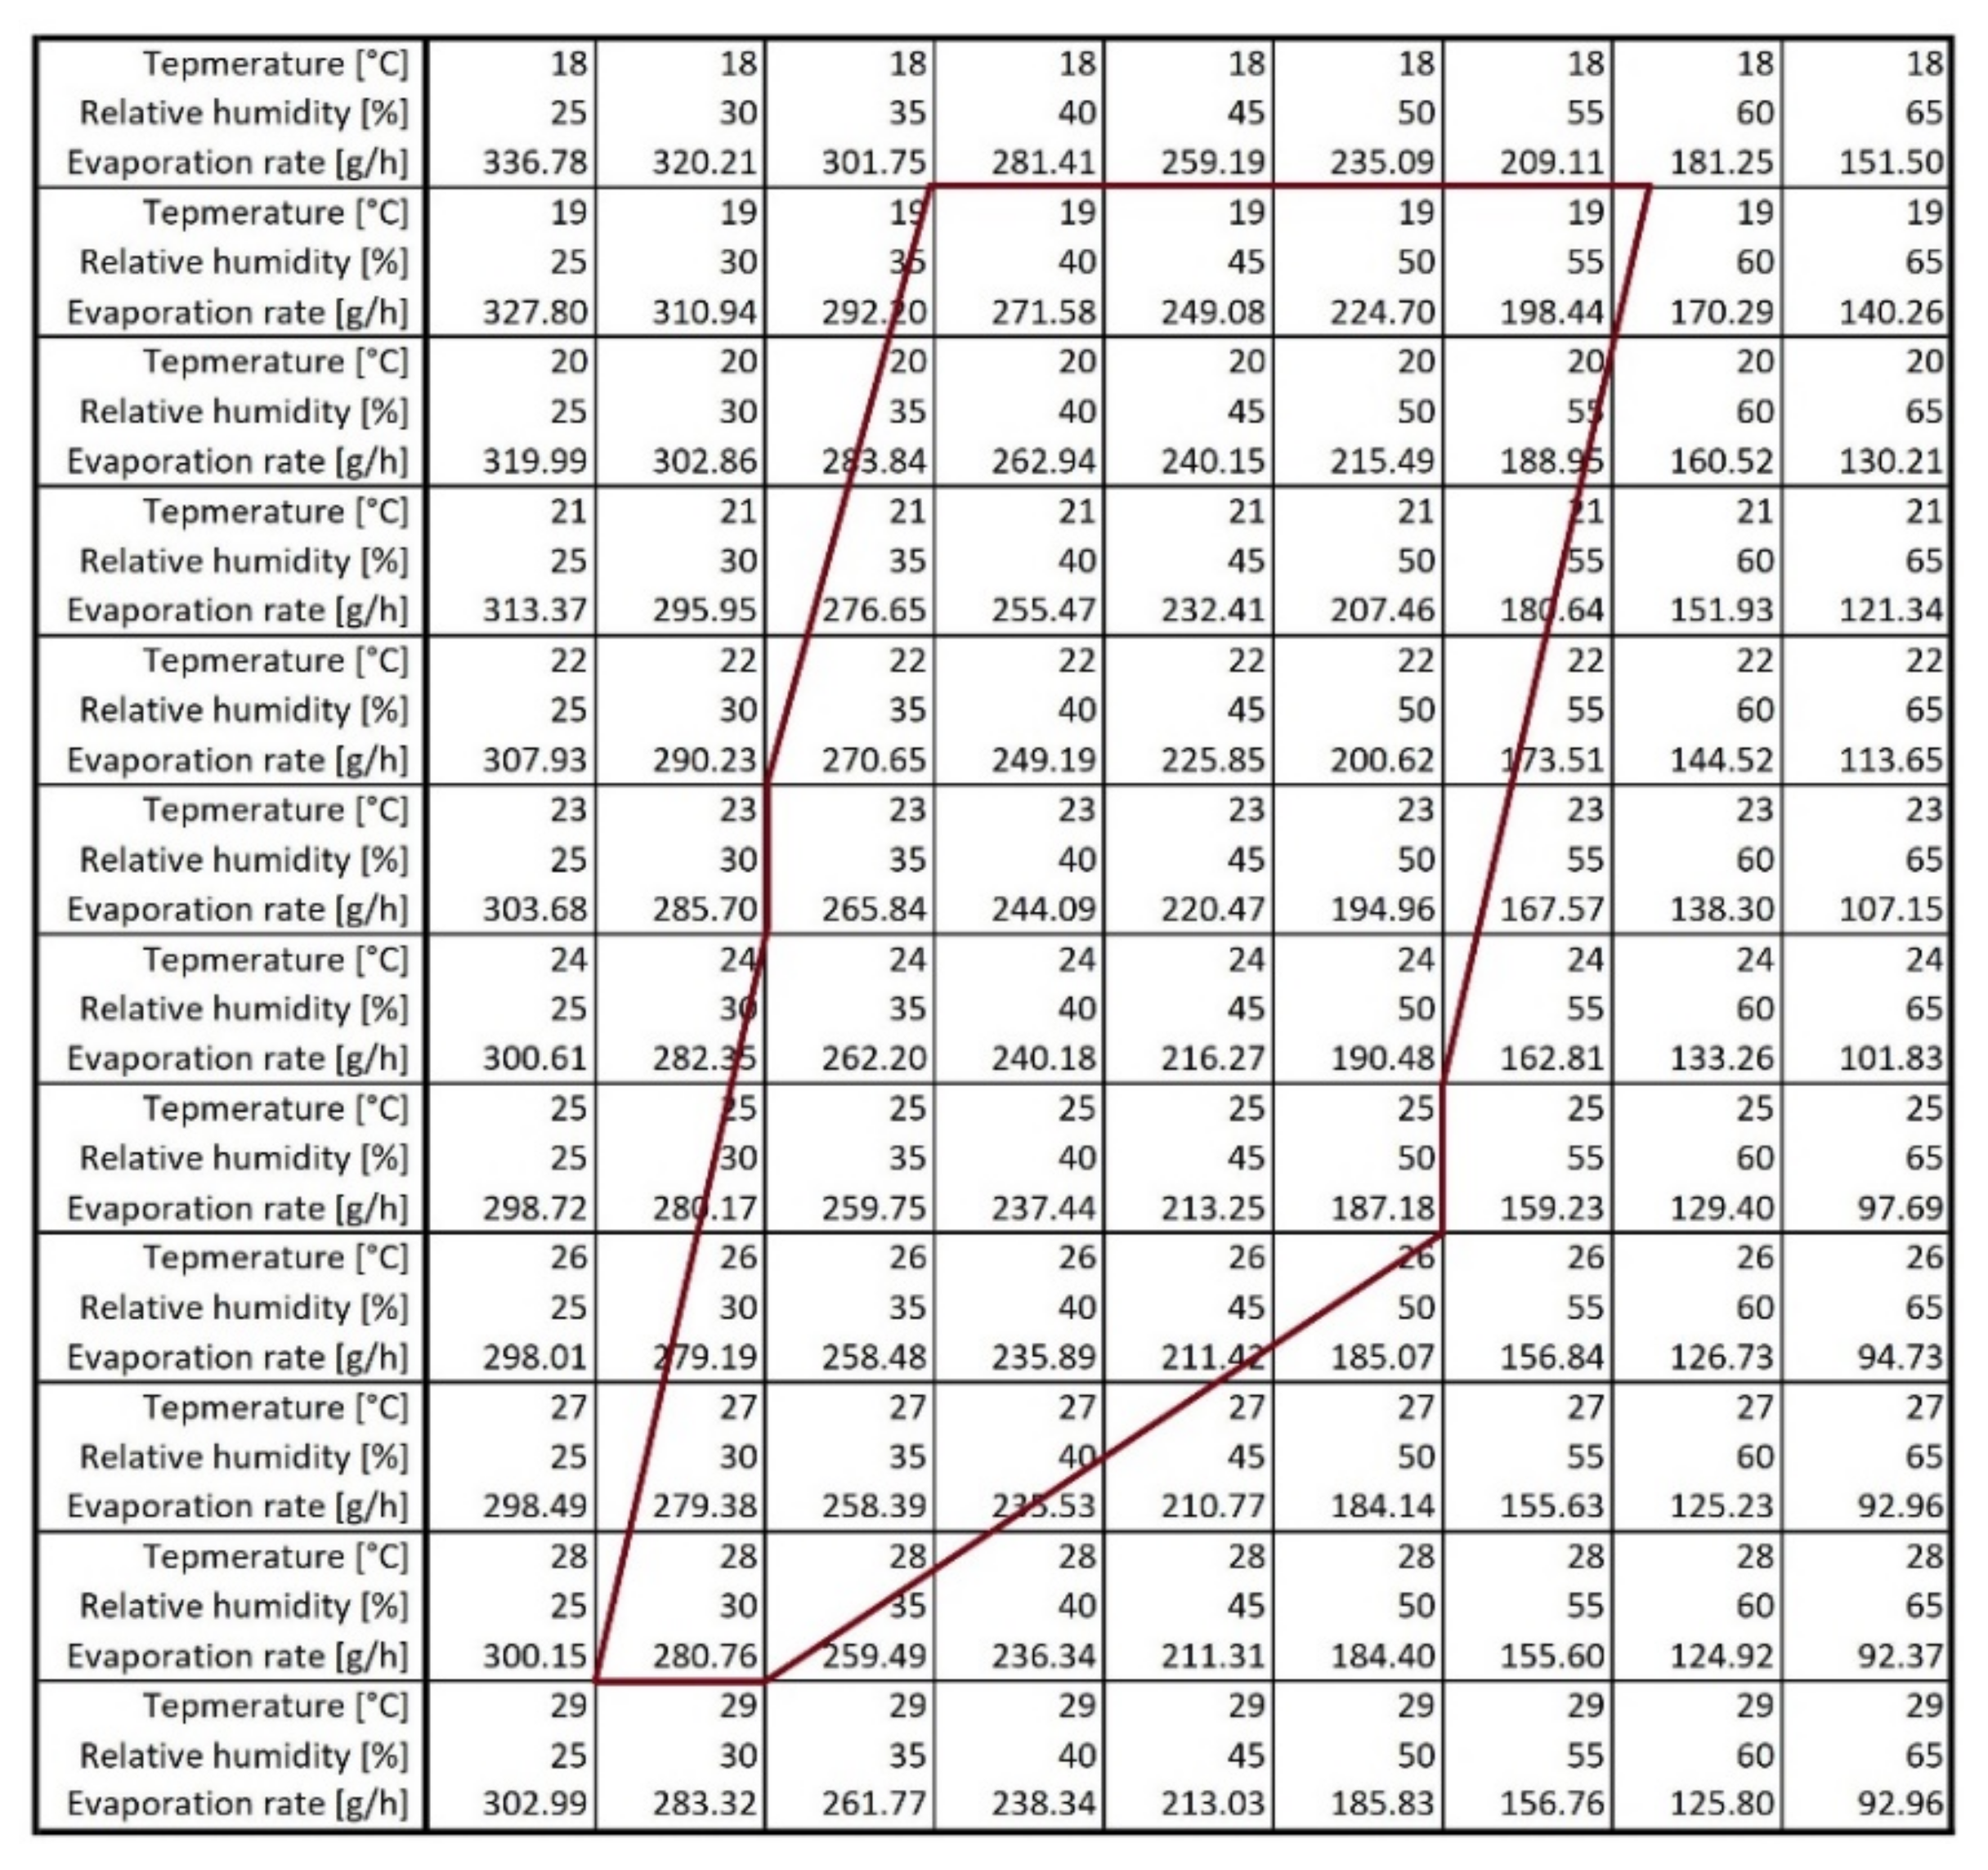
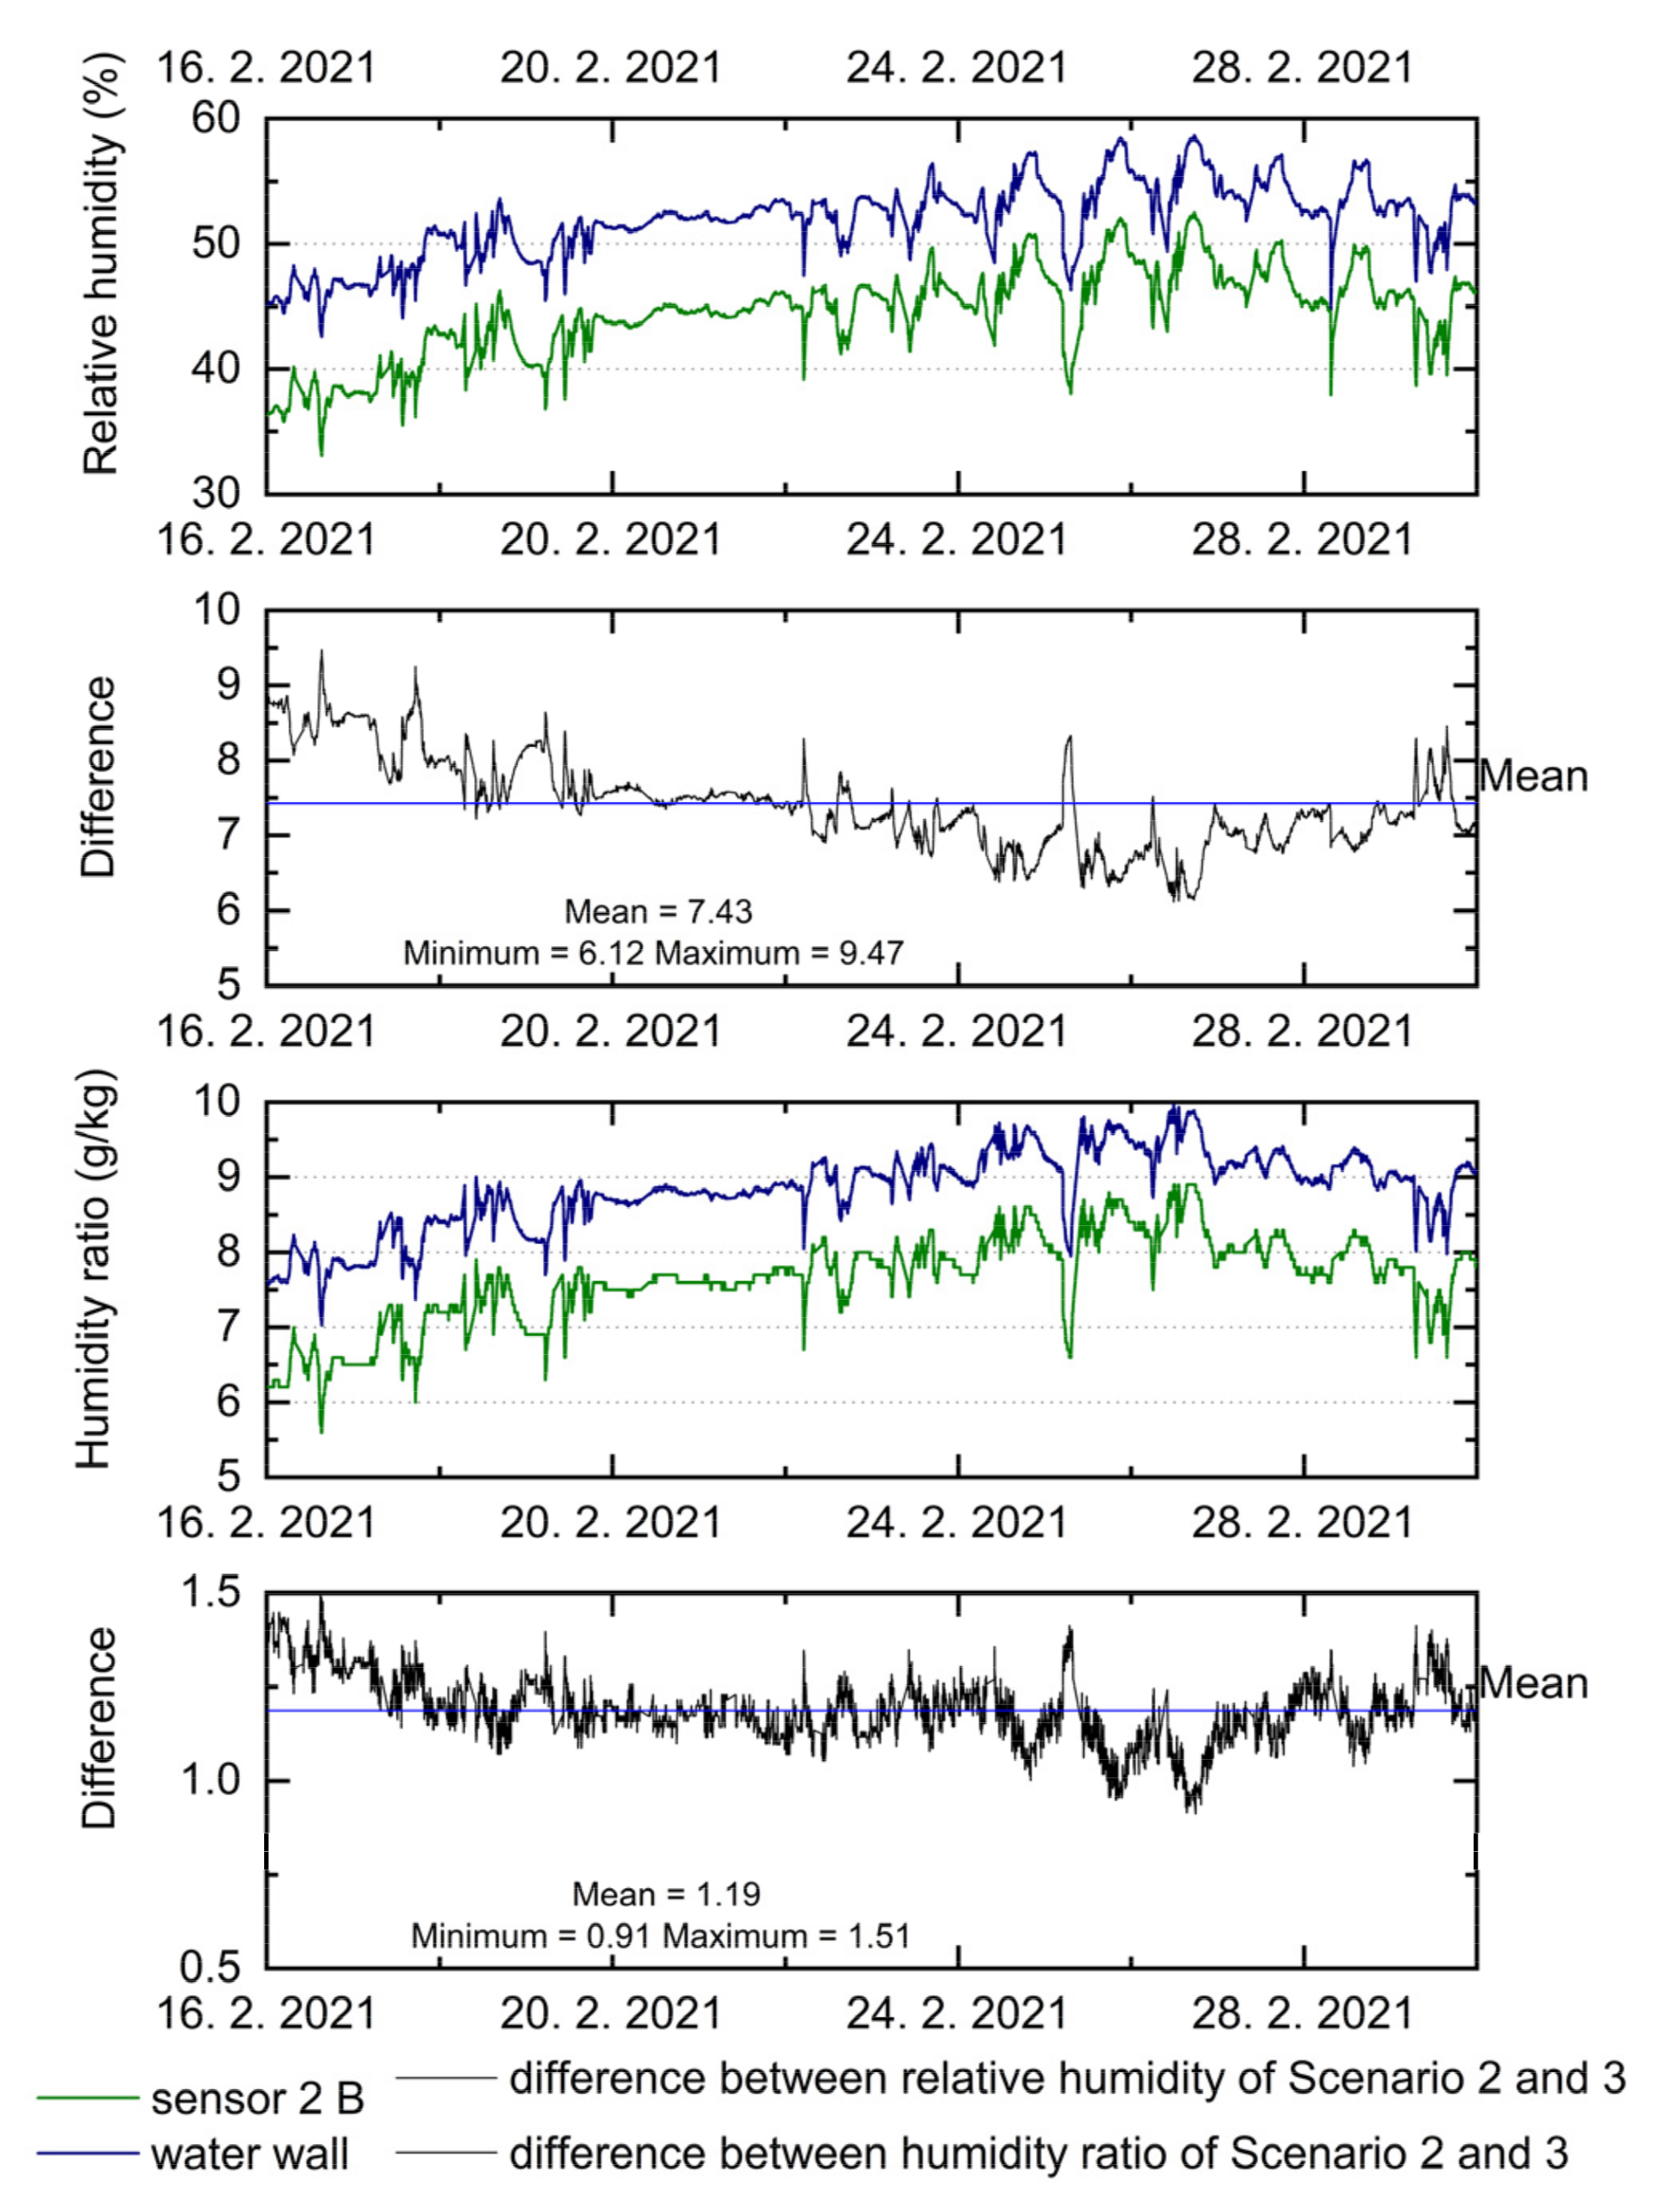
3.2. Water Wall
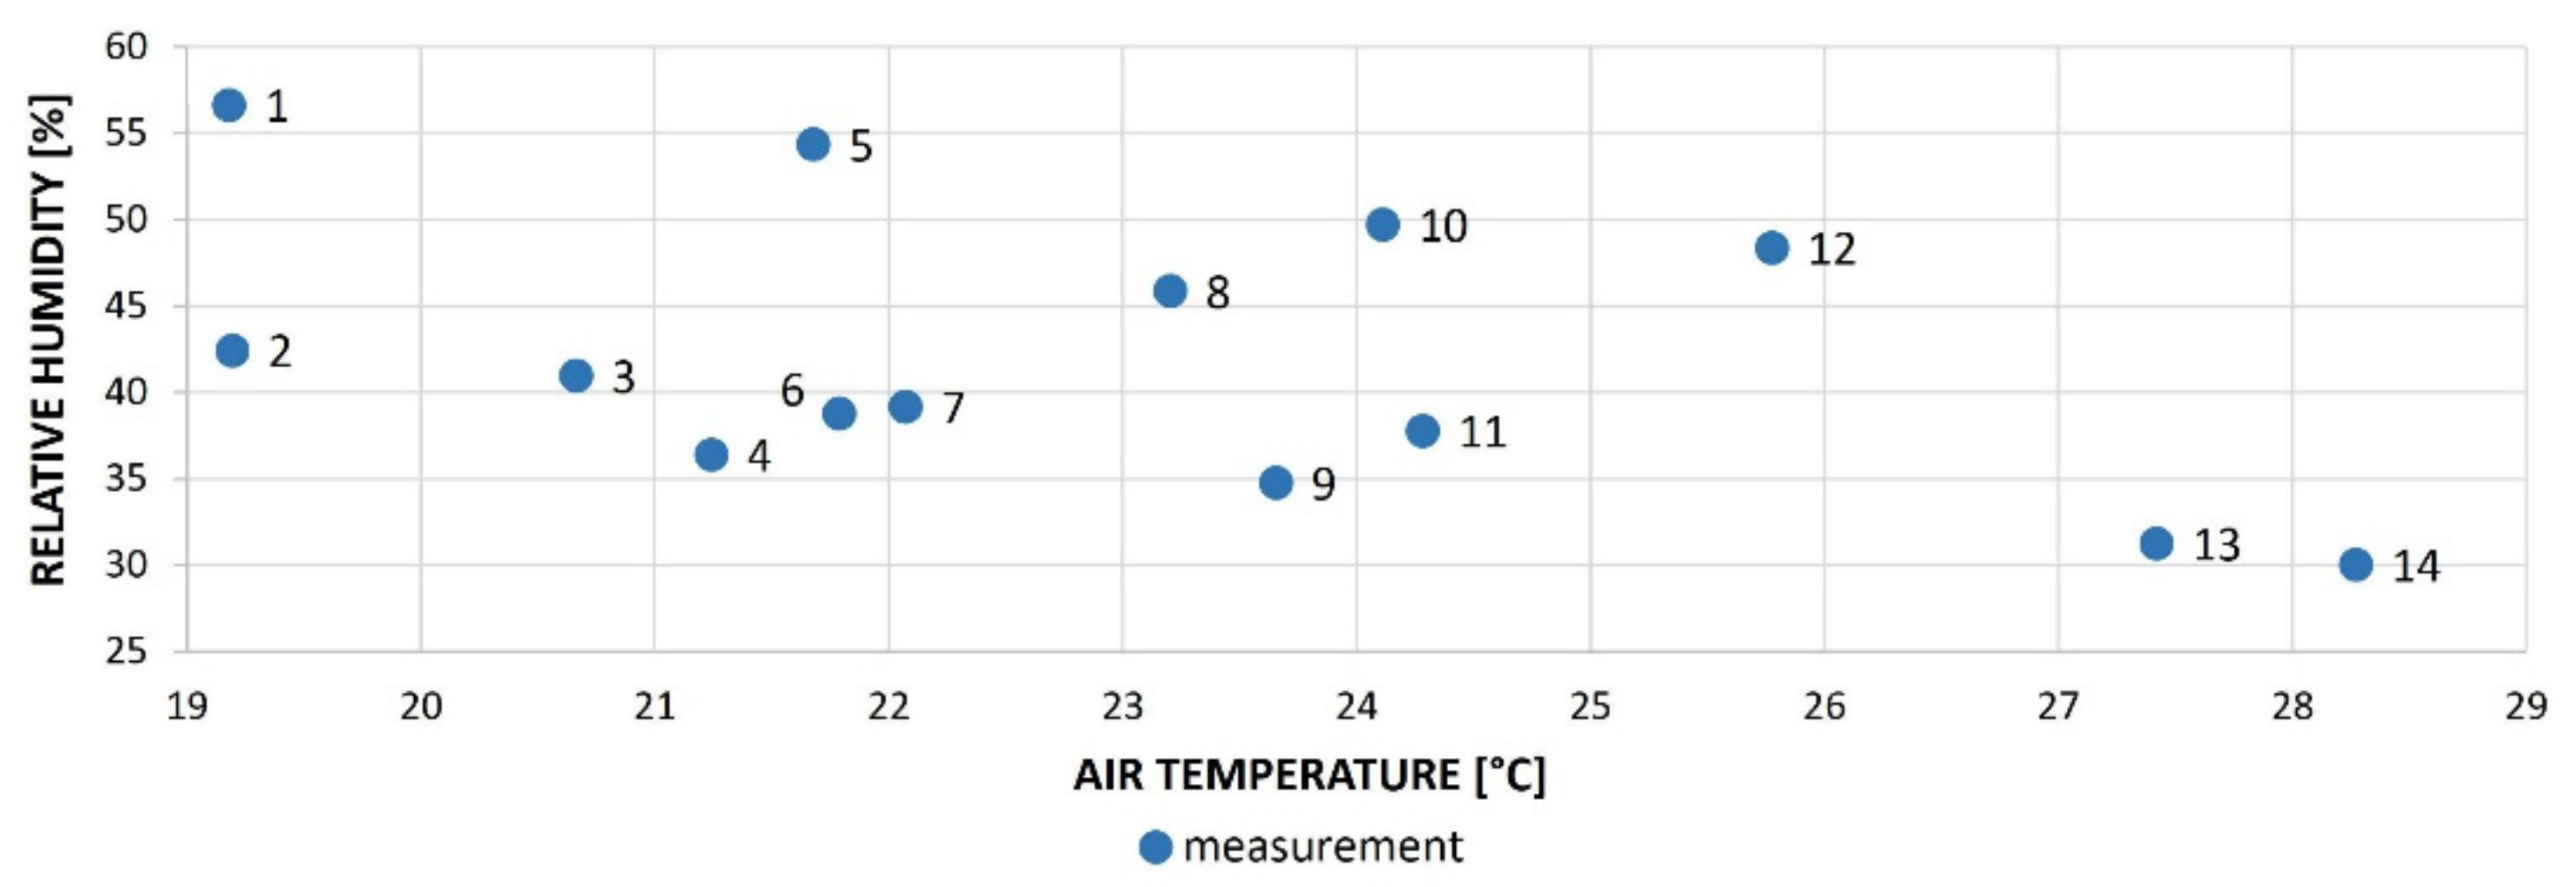
Scenario 3
3.3. Water Consumption
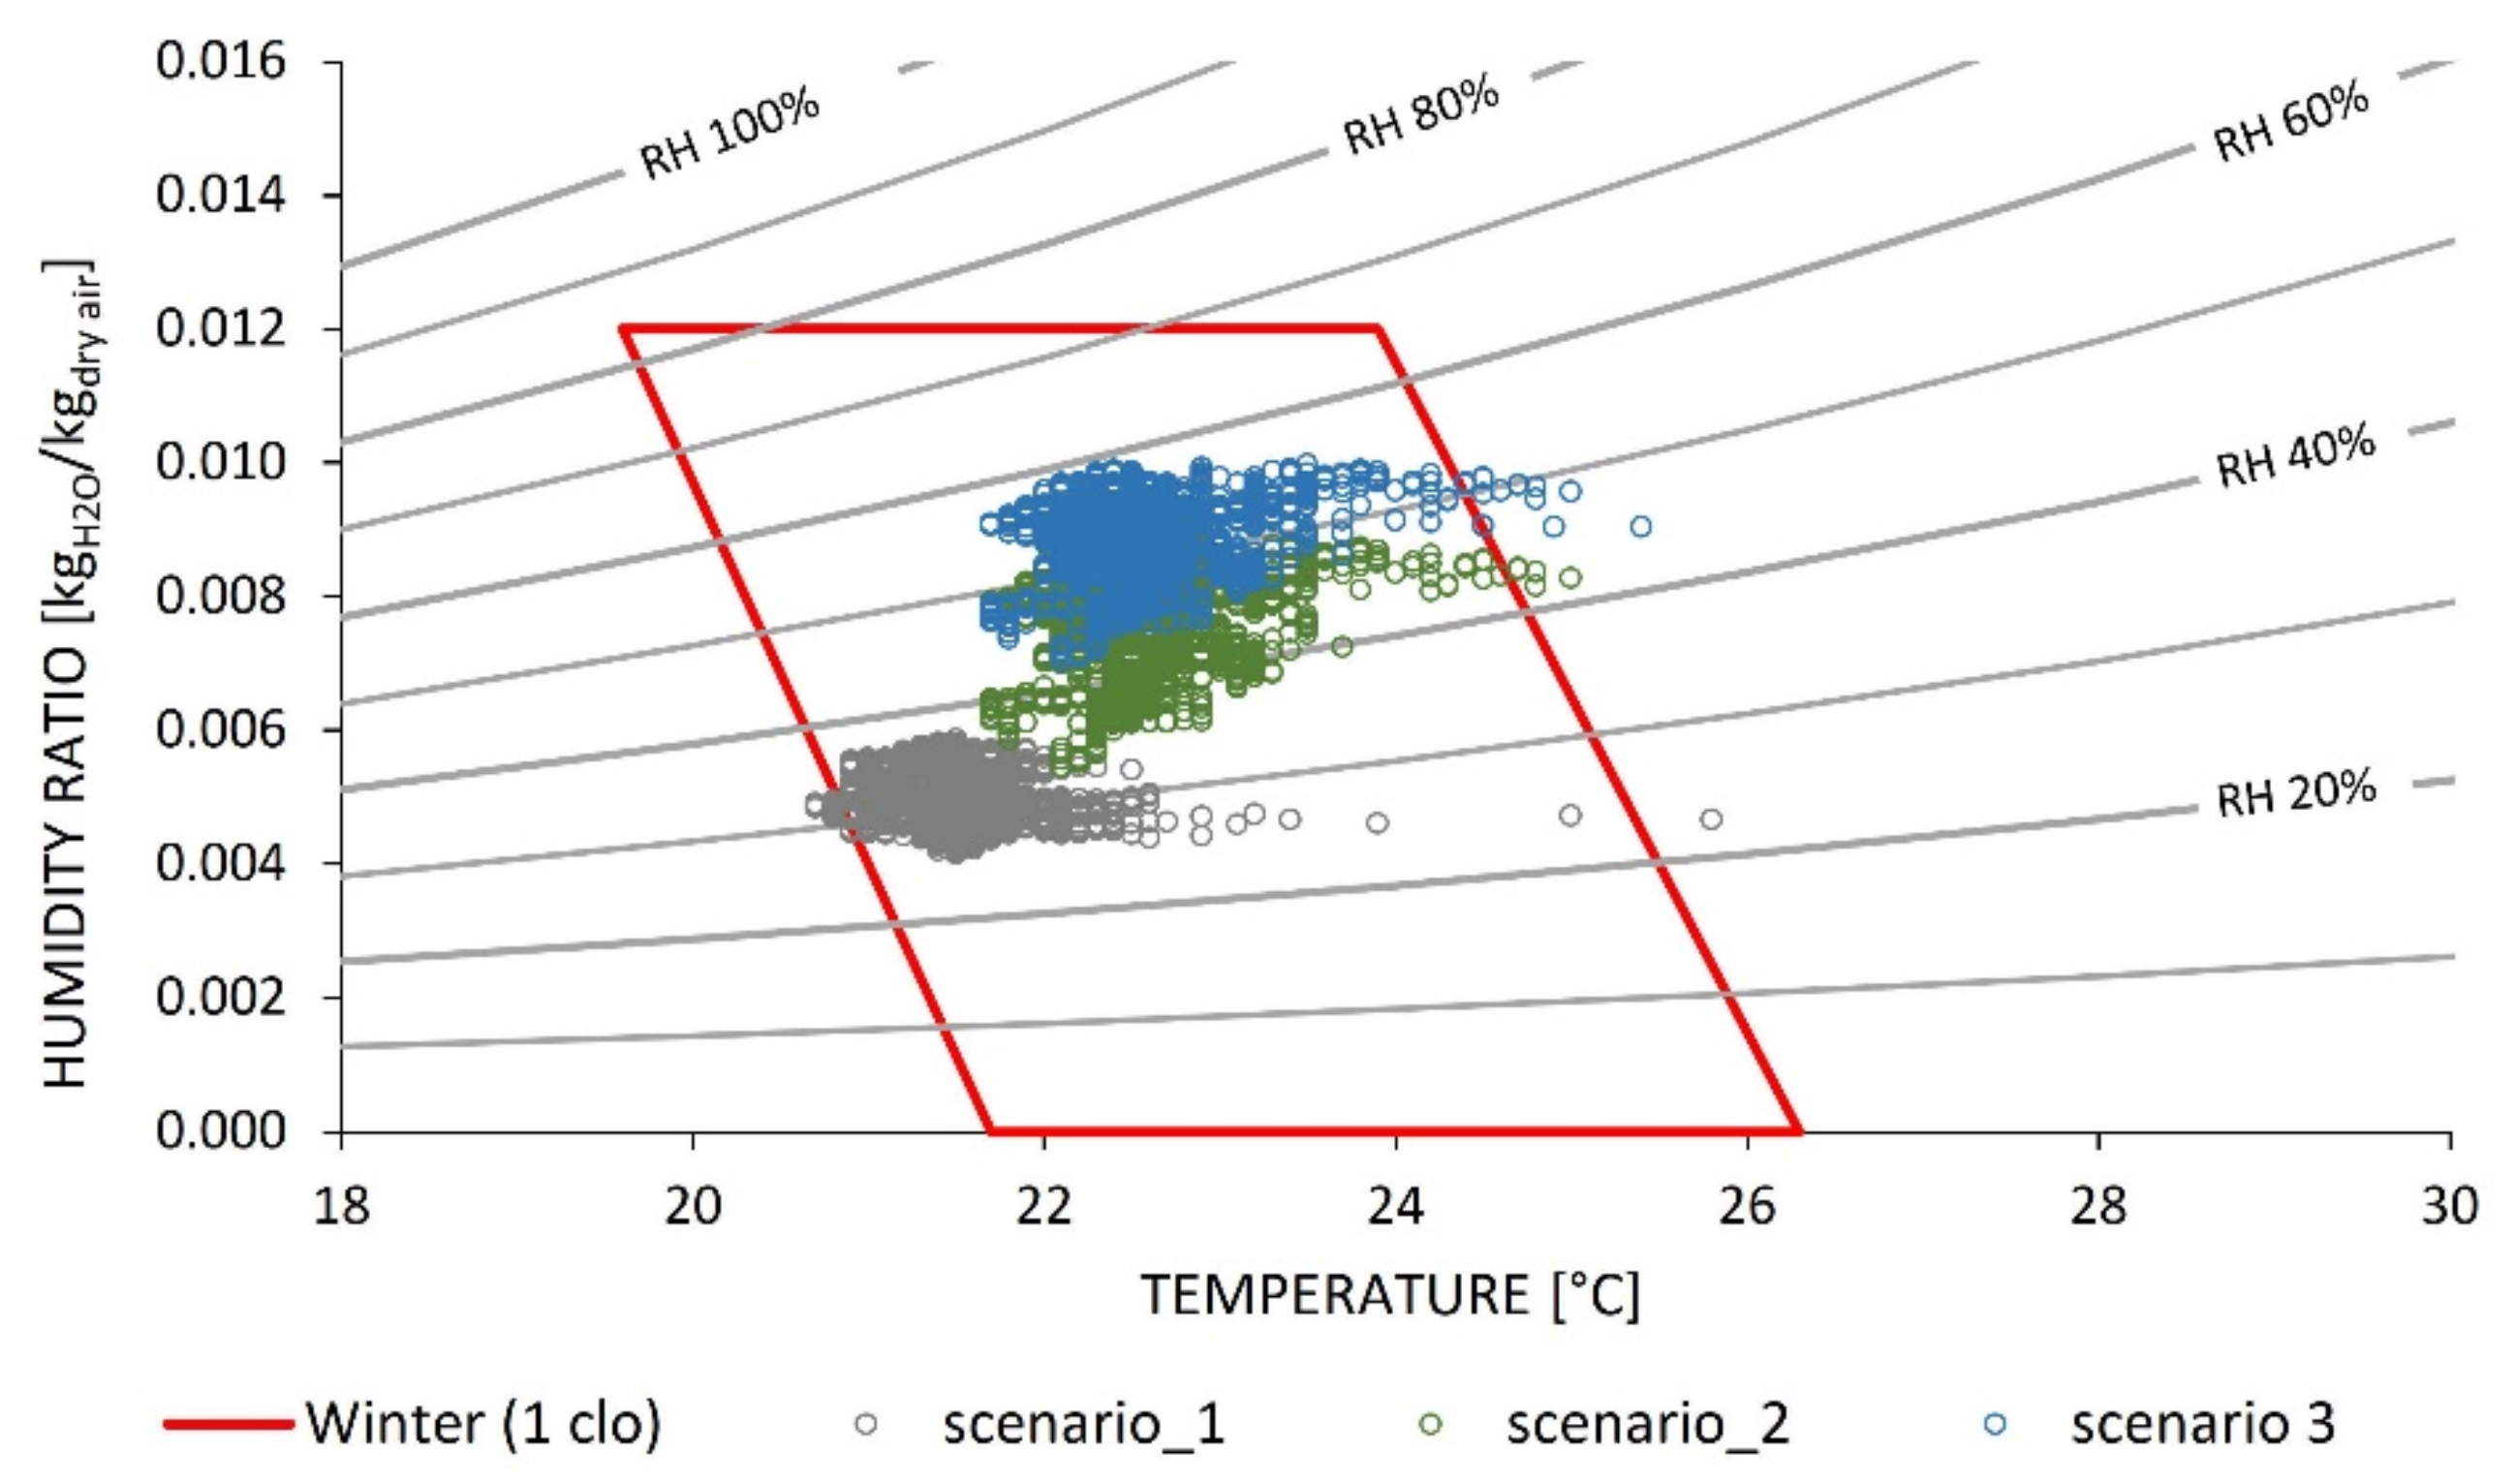
3.4. Comparison of Scenarios
4. Conclusions and Outlook
- the surface temperature of the surrounding surfaces is the same;
- the sorption (desorption) capacity of the surrounding surfaces is known, and resp. testing is performed on sorption-inactive surfaces;
- the exchange and parameters of the air supplied to the test room are known.
- the optimal ratio of room volume and water/vegetation element;
- the impact of the presence of humans, animals, and their activities;
- the influence of different external climatic parameters;
- the influence of building envelope thermal quality;
- the influence of HVAC system; and
- the impact of moisture buffering effect and others.
Author Contributions
Funding
Institutional Review Board Statement
Informed Consent Statement
Data Availability Statement
Acknowledgments
Conflicts of Interest
References
- Fong, K.C.; Hart, J.E.; James, P. A review of epidemiologic studies on greenness and health: Updated literature through 2017. Curr. Environ. Health Rep. 2018, 5, 77–87. [Google Scholar] [CrossRef] [Green Version]
- Nieuwenhuijsen, M.J.; Khreis, H.; Triguero-Mas, M.; Gascon, M.; Dadvand, P. Fifty shades of green: Pathway to healthy urban living. Epidemiology 2017, 28, 63–71. [Google Scholar] [CrossRef]
- Gascon, M.; Triguero-Mas, M.; Martinez, D.; Dadvand, P.; Forns, J.; Plasencia, A.; Nieuwenhuijsen, M.J. Mental health benefits of long-term exposure to residential green and blue spaces: A systematic review. Int. J. Environ. Res. Public Health 2015, 12, 4354–4379. [Google Scholar] [CrossRef] [PubMed] [Green Version]
- James, P.; Banay, R.F.; Hart, J.E.; Laden, F. A review of the health benefits of greenness. Curr. Epidemiol. Rep. 2015, 2, 131–142. [Google Scholar] [CrossRef] [Green Version]
- Gascon, M.; Triguero-Mas, M.; Martinez, D.; Dadvand, P.; Rojas-Rueda, D.; Plasència, A.; Nieuwenhuijsen, M.J. Residential green spaces and mortality: A systematic review. Environ. Int. 2016, 86, 60–67. [Google Scholar] [CrossRef] [Green Version]
- Dadvand, P.; Bartoll, X.; Basagana, X.; Dalmau-Bueno, A.; Martinez, D.; Ambros, A.; Cirach, M.; Triguero-Mas, M.; Gascon, M.; Borrell, C.; et al. Green spaces and general health: Roles of mental health status, social support, and physical activity. Environ. Int. 2016, 91, 161–167. [Google Scholar] [CrossRef] [Green Version]
- Gong, Y.; Palmer, S.; Gallacher, J.; Marsden, T.; Fone, D. A systematic review of the relationship between objective measurements of the urban environment and psychological distress. Environ. Int. 2016, 96, 48–57. [Google Scholar] [CrossRef] [PubMed] [Green Version]
- Van Ryswyk, K.; Prince, N.; Ahmed, M.; Brisson, E.; Miller, J.D.; Villeneuve, P.J. Does urban vegetation reduce temperature and air pollution concentrations? Findings from an environmental monitoring study of the Central Experimental Farm in Ottawa, Canada. Atmos. Environ. 2019, 218, 116886. [Google Scholar] [CrossRef]
- Dzhambov, A.M.; Dimitrova, D.D. Urban green spaces’ effectiveness as a psychological buffer for the negative health impact of noise pollution: A systematic review. Noise Health 2014, 16, 157–165. [Google Scholar] [CrossRef] [PubMed]
- Manteghi, G.; Bin Limit, H.; Remaz, D. Water bodies an urban microclimate: A review. Mod. Appl. Sci. 2015, 9, 1–12. [Google Scholar] [CrossRef] [Green Version]
- White, M.P.; Elliott, L.R.; Taylor, T.; Wheeler, B.W.; Spencer, A.; Bone, A.; Depledge, M.H.; Fleming, L.E. Recreational physical activity in natural environments and implications for health: A population based cross-sectional study in England. Prev. Med. 2016, 91, 383–388. [Google Scholar] [CrossRef]
- Gascon, M.; Zijlema, W.; Vert, C.; White, M.P.; Nieuwenhuijsen, M.J. Outdoor blue spaces, human health and well-being: A systematic review of quantitative studies. Int. J. Hyg. Environ. Health 2017, 220, 1207–1221. [Google Scholar] [CrossRef]
- Völker, S.; Kistemann, T. The impact of blue space on human health and well-being—Salutogenetic health effects of inland surface waters: A review. Int. J. Hyg. Environ. Health 2011, 214, 449–460. [Google Scholar] [CrossRef] [PubMed]
- De Bell, S.; Graham, H.; Jarvis, S.; White, P. The importance of nature in mediating social and psychological benefits associated with visits to freshwater blue space. Landsc. Urban Plan. 2017, 167, 118–127. [Google Scholar] [CrossRef]
- Poórová, Z.; Vranayová, Z. Green Roofs and Water Retention in Košice, Slovakia, 1st ed.; Springer Nature: Cham, Switzerland, 2020; pp. 59–67. [Google Scholar] [CrossRef]
- Yang, G.; Yu, Z.; Jørgensen, G.; Vejre, H. How can urban blue-green space be planned for climate adaption in high-latitude cities? A seasonal perspective. Sustain. Cities Soc. 2020, 53, 101932. [Google Scholar] [CrossRef]
- Nastran, M.; Kobal, M.; Eler, K. Urban heat islands in relation to green land use in European cities. Urban For. Urban Green. 2019, 37, 33–41. [Google Scholar] [CrossRef] [Green Version]
- Dwivedi, A.; Mohan, B.K. Impact of green roof on micro climate to reduce Urban Heat Island. Remote Sens. Appl. Soc. Environ. 2018, 10, 56–69. [Google Scholar] [CrossRef]
- Shi, D.; Song, J.; Huang, J.; Zhuang, C.; Guo, R.; Gao, Y. Synergistic cooling effects (SCEs) of urban green-blue spaces on local thermal environment: A case study in Chongqing, China. Sustain. Cities Soc. 2020, 55, 102065. [Google Scholar] [CrossRef]
- Steeneveld, J.G.; Koopmans, S.; Heusinkveld, G.B.; Theeuwes, E.N. Refreshing the role of open water surfaces on mitigating the maximum urban heat island effect. Landsc. Urban Plan. 2014, 121, 92–96. [Google Scholar] [CrossRef]
- United Nations, Department of Economic and Social Affairs, World Urbanization Prospects: The 2018 Revision. United Nations New York. 2019. Available online: https://population.un.org/wup/Publications/Files/WUP2018-Report.pdf (accessed on 25 June 2021).
- Coburn, A.; Vartanian, O.; Kenett, N.Y.; Nadal, M.; Hartung, F.; Hayn-Leichsenring, G.; Navarrete, G.; González-Mora, L.J.; Chatterjee, A. Psychological and neural responses to architectural interiors. Cortex 2020, 126, 217–241. [Google Scholar] [CrossRef]
- Rebrova, T.; Beckovsky, D.; Selnik, P. Monitoring of the Green Roofs Installation in Brno-City District, Czech Republic. IOP Conf. Ser. Earth Environ. Sci. 2017, 95, 042040. [Google Scholar] [CrossRef] [Green Version]
- Hami, A.; Moula, A.A.; Maulan, S.B. Public preferences toward shopping mall interior landscape design in Kuala Lumpur, Malaysia. Urban For. Urban Green. 2018, 30, 1–7. [Google Scholar] [CrossRef]
- Choi, J.-Y.; Park, S.-A.; Jung, S.-J.; Lee, J.-Y.; Son, K.-C.; An, Y.J.; Lee, S.-W. Physiological and psychological responses of humans to the index of greenness of an interior space. Complement. Ther. Med. 2016, 28, 37–43. [Google Scholar] [CrossRef]
- Mcsweeney, J.; Rainham, D.; Johnson, S.A.; Sherry, S.B.; Singleton, J.J. Indoor nature exposure (INE): A health-promotion framework. Health Promot. Int. 2015, 30, 126–139. [Google Scholar] [CrossRef] [PubMed] [Green Version]
- Horr, Y.A.; Arif, M.; Kaushik, A.; Mazroei, A.; Katafygiotou, M.; Elsarrag, E. Occupant productivity and office indoor environment quality: A review of the literature. Build. Environ. 2016, 105, 369–389. [Google Scholar] [CrossRef] [Green Version]
- van den Bogerd, N.; Dijkstra, S.C.; Tanja-Dijkstra, K.; de Boer, M.R.; Seidell, J.C.; Koole, S.K.; Maas, J. Greening the classroom: Three field experiments on the effects of indoor nature on students’ attention, well-being, and perceived environmental quality. Build. Environ. 2020, 171, 106675. [Google Scholar] [CrossRef]
- van den Berg, A.E.; Wesselius, J.E.; Maas, J.; Tanja-Dijkstra, K. Green Walls for a Restorative Classroom Environment: A Controlled Evaluation Study. Environ. Behav. 2016, 49, 791–813. [Google Scholar] [CrossRef]
- Park, S.-H.; Mattson, R.H. Therapeutic Influences of Plants in Hospital Rooms on Sur-gical Recovery. HortScience 2009, 44, 102–105. [Google Scholar] [CrossRef] [Green Version]
- Bringslimark, T.; Hartig, T.; Patil, G.G. The psychological benefits of indoor plants: A critical review of the experimental literature. J. Environ. Psychol. 2009, 29, 422–433. [Google Scholar] [CrossRef]
- Kellert, S.R.; Heerwagen, J.; Mador, M. Biophilic Design: The Theory, Science and Practice of Bringing Buildings to Life; John Wiley & Sons: Hoboken, NJ, USA, 2011. [Google Scholar]
- Pérez-Urrestarazu, L.; Kaltsidi, M.P.; Nektarios, P.A.; Markakis, G.; Loges, V.; Perini, K.; Fernández-Cañero, R. Particularities of having plants at home during the confinement due to the COVID-19 pandemic. Urban For. Urban Green. 2021, 59, 126919. [Google Scholar] [CrossRef]
- Gunawardena, K.; Steemers, K. Living walls in indoor environments. Build. Environ. 2019, 148, 478–487. [Google Scholar] [CrossRef]
- Charoenkit, S.; Yiemwattana, S. Living walls and their contribution to improved thermal comfort and carbon emission reduction: A review. Build. Environ. 2016, 105, 82–94. [Google Scholar] [CrossRef]
- Wang, C.; Er, S.-S.; Abdul-Rahman, H. Indoor vertical greenery system in urban tropics. Indoor Built Environ. 2016, 25, 340–356. [Google Scholar] [CrossRef]
- Franco, A.; Fernández-Cañero, R.; Pérez-Urrestarazu, L.; Valera, D.L. Wind tunnel analysis of artificial substrates used in active living walls for indoor environment conditioning in Mediterranean buildings. Build. Environ. 2012, 51, 370–378. [Google Scholar] [CrossRef]
- Pérez-Urrestarazu, L.; Fernández-Cañero, R.; Franco, A.; Egea, G. Influence of an active living wall on indoor temperature and humidity conditions. Ecol. Eng. 2016, 90, 120–124. [Google Scholar] [CrossRef]
- Moya, A.T.; van den Dobbelsteen, A.; Ottele’, M.; Bluyssen, M.P. A review of green systems within the indoor environment. Indoor Built Environ. 2019, 28, 298–309. [Google Scholar] [CrossRef]
- Tudiwer, D.; Korjenic, A. The effect of an indoor living wall system on humidity, mould spores and CO2-concentration. Energy Build. 2017, 146, 73–86. [Google Scholar] [CrossRef]
- Poórová, Z.; Turcovská, A.; Kapalo, P.; Vranayová, Z. The Effect of Green Walls on Humidity, Air Temperature, Co2 and Well-Being of People. Environ. Sci. Proc. 2020, 2, 56. [Google Scholar] [CrossRef]
- Hollands, J.; Korjenic, A. Indirect Economic Effects of Vertical Indoor Green in the Context of Reduced Sick Leave in Offices. Sustainability 2021, 13, 2256. [Google Scholar] [CrossRef]
- Fernández-Cañero, R.; Urrestarazu, L.P.; Franco Salas, A. Assessment of the Cooling Potential of an Indoor Living Wall using Different Substrates in a Warm Climate. Indoor Built Environ. 2012, 21, 642–650. [Google Scholar] [CrossRef]
- Cakyova, K.; Vranay, F.; Vertal, M.; Vranayova, Z. Determination of Dehumidification Capacity of Water Wall with Controlled Water Temperature: Experimental Verification under Laboratory Conditions. Sustainability 2021, 13, 5684. [Google Scholar] [CrossRef]
- Wu, T.; Lei, C. A review of research and development on water wall for building applications. Energy Build. 2016, 112, 198–208. [Google Scholar] [CrossRef]
- Chen, W.; Liu, S.; Lin, J. Analysis on the passive evaporative cooling wall constructed of porous ceramic pipes with water sucking ability. Energy Build. 2015, 86, 541–549. [Google Scholar] [CrossRef]
- Tewari, P.; Mathur, S.; Mathur, J. Thermal performance prediction of office buildings using direct evaporative cooling systems in the composite climate of India. Build. Environ. 2019, 157, 64–78. [Google Scholar] [CrossRef]
- Moosavi, L.; Mahyuddin, N.; Ghafar, N. Atrium cooling performance in a low energy office building in the Tropics, a field study. Build. Environ. 2015, 94, 384–394. [Google Scholar] [CrossRef]
- Mitterer, C. Cooling and Dehumidifying Indoor Environments Using the Chilled Water Wall; IBP-FRAUNHOFER: Valley, Germany; Available online: https://www.ibp.fraunhofer.de/content/dam/ibp/en/documents/Information-material/Departments/Hygrothermics/Produktblaetter/IBP_255_PB_Klimabrunnen_neu_en_rz_web.pdf (accessed on 25 June 2021).
- Fang, Y.-M.; Lee, J.M.C.; Mitterer, C.; Kunzel, M.H. The performance of heat pump integrated with chilled water wall for air conditioning and domestic hot water. IOP Conf. Ser. Earth Environ. Sci. 2019, 294, 012032. [Google Scholar] [CrossRef]
- Cakyova, K.; Vranay, F.; Vranayova, Z. Using water wall like air humidifier. Sel. Sci. Pap.-J. Civ. Eng. 2020, 15, 13–18. [Google Scholar] [CrossRef]
- Haupt, T.E.; Heffernan, T.R.; Kazmierczak, J.J.; Nehls-Lowe, H.; Rheineck, B.; Powell, C.; Leonhardt, K.K.; Chitnis, S.A.; Davis, P.J. An Outbreak of Legionnaires Disease Associated with a Decorative Water Wall Fountain in a Hospital. Infect. Control Hosp. Epidemiol. 2012, 33, 185–191. [Google Scholar] [CrossRef]
- Kottek, M.; Grieser, J.; Beck, C.; Rudolf, B.; Rubel, F. World Map of the Köppen-Geiger climate classification updated. Meteorol. Z. 2006, 15, 259–263. [Google Scholar] [CrossRef]
- Skalák, P.; Farda, A.; Zahradníček, P.; Trnka, M.; Hlásny, T.; Štěpánek, P. Projected shift of Köppen–Geiger zones in the central Europe: A first insight into the implications for ecosystems and the society. Int. J. Climatol. 2018, 38, 3595–3606. [Google Scholar] [CrossRef]
- Czech Hydrometeorological Institute, Historical Data. Available online: https://www.chmi.cz/historicka-data/pocasi/mesicni-data/mesicni-data-dle-z.-123-1998-Sb (accessed on 25 June 2021).
- Kraus, M. Hygrothermal Analysis of Indoor Environment of Residential Prefabricated Buildings. IOP Conf. Ser. Mater. Sci. Eng. 2017, 245, 042071. [Google Scholar] [CrossRef]
- Wolkoff, P. Indoor air humidity, air quality, and health—An overview. Int. J. Hyg. Environ. Health 2018, 221, 376–390. [Google Scholar] [CrossRef] [PubMed]
- TUBO, METEO DATA. Available online: http://tubo.fce.vutbr.cz/new/meteoExport.asp (accessed on 25 June 2021).
- Flora Urbanica, Green Wall System. Available online: https://floraurbanica.com/en/flora-panel/ (accessed on 25 June 2021).
- Čákyová, K.; Vranay, F. Utility Model Number 8710: Water Wall Collection Container with Overflow Edge (Zberná Nádoba Vodnej Steny s Prepadovou Hranou); Industrial Property Office of the Slovak Republic: Banská Bystrica, Slovak Republic, 2019. Available online: https://wbr.indprop.gov.sk/WebRegistre/UzitkovyVzor/Detail/50129-2017 (accessed on 25 June 2021).
- Čákyová, K.; Vranay, F.; Kušnír, M. Impact of Flow Rate To Water Film Thickness of Water Wall. Advances and Trends in Engineering Sciences and Technologies III; CRC Press: London, UK, 2019; pp. 337–342. [Google Scholar] [CrossRef]
- Gunawardena, K.R.; Steemers, K. Living wall influence on microclimates: An indoor case study. J. Phys. Conf. Ser. 2019, 1343, 012188. [Google Scholar] [CrossRef]
- Gunawardena, K.; Steemers, K. Urban living walls: Reporting on maintenance challenges from a review of European installations. Archit. Sci. Rev. 2020, 63, 526–535. [Google Scholar] [CrossRef]
- Dolnikova, E.; Katunsky, D.; Vertal, M.; Zozulak, M. Influence of Roof Windows Area Changes on the Classroom Indoor Climate in the Attic Space: A Case Study. Sustainability 2020, 12, 5046. [Google Scholar] [CrossRef]
- Qi, R.; Dong, C.; Zhang, L.-Z. A review of liquid desiccant air dehumidification: From system to material manipulations. Energy Build. 2020, 215, 109897. [Google Scholar] [CrossRef]
- Sterling, E.M.; Arundel, A.; Sterling, T.D. Criteria for Human Exposure to Humidity in Occupied Buildings. ASHRAE Trans. 1985, 91, 611–622. [Google Scholar]
- Regulation of the Government of the Czech Republic No. 361/2007 Coll., Government Order Laying down Health and Safety Conditions at Work. Available online: https://www.zakonyprolidi.cz/cs/2007-361 (accessed on 25 June 2021).
- Vilcekova, S.; Meciarova, L.; Kridlova Burdova, E.; Katunska, J.; Kosicanova, D.; Doroudiani, S. Indoor environmental quality of classrooms and occupants’ comfort in a special education school in Slovak Republic. Build. Environ. 2017, 120, 29–40. [Google Scholar] [CrossRef]
- ASHRAE Standard 55. Thermal Environmental Conditions for Human Occupancy; American Society of Heating, Refrigerating and Air-Conditioning Engineering, Inc.: Atlanta, GA, USA, 2010. [Google Scholar]


| Parameter | Device | Range | Deviation | |
|---|---|---|---|---|
| Air | humidity | Comet DigiL/M | 0 to 100% RH | ±1.8% RH (at nominal temperature +23 °C and RH 0–90%) |
| temperature | −10 to +60 °C | ±0.4 °C | ||
| Parameter | Device | Range | Deviation | |
|---|---|---|---|---|
| Water | temperature | NTC sensor FN 0001 K | 0 to 70 °C | ±0.2 K |
| Air | humidity | FHAD 46-C0 | 10 to 90% RH | ±2.0% RH at nominal temperature (+23 °C) |
| temperature | 5 to 60 °C | typical ±0.2 K (maximum ±0.4 K) | ||
| Temperature (°C) | Relative Humidity (%) | Humidity Ratio (g/kg) | |||||||||||
|---|---|---|---|---|---|---|---|---|---|---|---|---|---|
| Sensor | Sensor | Sensor | |||||||||||
| 1 A | 1 B | 1 C | 2 B | 1 A | 1 B | 1 C | 2 B | 1 A | 1 B | 1 C | 2 B | ||
| Scenario 1 | Max | 23.4 | 22.8 | 22.2 | 25.8 | 35.9 | 37.2 | 39.1 | 36.9 | 5.9 | 6.1 | 6.1 | 6.1 |
| Min | 21.1 | 20.8 | 20.2 | 20.7 | 25.3 | 26.7 | 26.2 | 20.4 | 4.2 | 4.3 | 4.0 | 4.1 | |
| Mean | 21.9 ± 0.4 | 21.4 ± 0.3 | 20.8 ± 0.3 | 21.4 ± 0.4 | 30.2 ± 2.9 | 31.8 ± 2.9 | 33.0 ± 2.8 | 31.5 ± 2.9 | 5.1 ± 0.5 | 5.2 ± 0.5 | 5.2 ± 0.5 | 5.1 ± 0.5 | |
| Scenario 2 | Max | 24.2 | 23.9 | 23.8 | 25.4 | 51.7 | 53.6 | 53.8 | 52.5 | 9.0 | 9.2 | 9.2 | 8.9 |
| Min | 21.7 | 21.5 | 21.3 | 21.7 | 31.9 | 33.2 | 33.8 | 33.1 | 5.5 | 5.6 | 5.5 | 5.6 | |
| Mean | 22.8 ± 0.4 | 22.5 ± 0.3 | 22.1 ± 0.3 | 22.5 ± 0.3 | 43.4 ± 3.7 | 45.3 ± 3.7 | 46.2 ± 3.6 | 44.6 ± 3.6 | 7.6 ± 0.6 | 7.7 ± 0.6 | 7.7 ± 0.6 | 7.6 ± 0.6 | |
| Measurements | ||||||||||||||
|---|---|---|---|---|---|---|---|---|---|---|---|---|---|---|
| 1 | 2 | 3 | 4 | 5 | 6 | 7 | 8 | 9 | 10 | 11 | 12 | 13 | 14 | |
| Temperature (°C) | 19.2 ± 0.1 | 19.2 ± 0.8 | 20.7 ± 0.7 | 21.2 ± 1.6 | 21.7 ± 0.1 | 21.8 ± 0.3 | 22.1 ± 0.3 | 23.2 ± 0.5 | 23.7 ± 1.4 | 24.1 ± 0.1 | 24.3 ± 0.7 | 25.8 ± 0.1 | 27.4 ± 0.3 | 28.3 ± 0.7 |
| Relative humidity (%) | 56.6 ± 2.6 | 42.4 ± 4.3 | 41.0 ± 4.0 | 36.4 ± 3.3 | 54.4 ± 2.1 | 38.8 ± 3.7 | 39.2 ± 3.9 | 45.9 ± 2.9 | 34.8 ± 3.3 | 49.7 ± 2.0 | 37.8 ± 4.0 | 48.4 ± 2.1 | 31.3 ± 2.7 | 30.0 ± 2.3 |
| Measurement: ER (g/h) | 184.11 | 260.77 | 246.75 | 287.54 | 180.97 | 244.11 | 249.38 | 240.32 | 255.05 | 188.89 | 235.84 | 188.25 | 293.87 | 271.23 |
| Equation: ER (g/h) | 187.59 | 259.10 | 253.54 | 269.29 | 179.16 | 255.76 | 252.45 | 215.12 | 26424 | 191.46 | 249.33 | 194.18 | 274.65 | 281.22 |
| Absolute difference | 3.48 | 1.67 | 6.79 | 18.25 | 1.81 | 11.65 | 3.07 | 25.20 | 9.19 | 2.57 | 13.49 | 5.93 | 19.22 | 9.99 |
| Percent deviation (%) | 1.89 | 0.64 | 2.75 | 6.35 | 1.00 | 4.77 | 1.23 | 10.48 | 3.60 | 1.36 | 5.72 | 3.15 | 6.54 | 3.68 |
Publisher’s Note: MDPI stays neutral with regard to jurisdictional claims in published maps and institutional affiliations. |
© 2021 by the authors. Licensee MDPI, Basel, Switzerland. This article is an open access article distributed under the terms and conditions of the Creative Commons Attribution (CC BY) license (https://creativecommons.org/licenses/by/4.0/).
Share and Cite
Cakyova, K.; Vertal, M.; Vystrcil, J.; Nespesny, O.; Beckovsky, D.; Rubina, A.; Pencik, J.; Vranayova, Z. The Synergy of Living and Water Wall in Indoor Environment—Case Study in City of Brno, Czech Republic. Sustainability 2021, 13, 11649. https://doi.org/10.3390/su132111649
Cakyova K, Vertal M, Vystrcil J, Nespesny O, Beckovsky D, Rubina A, Pencik J, Vranayova Z. The Synergy of Living and Water Wall in Indoor Environment—Case Study in City of Brno, Czech Republic. Sustainability. 2021; 13(21):11649. https://doi.org/10.3390/su132111649
Chicago/Turabian StyleCakyova, Katarina, Marian Vertal, Jan Vystrcil, Ondrej Nespesny, David Beckovsky, Ales Rubina, Jan Pencik, and Zuzana Vranayova. 2021. "The Synergy of Living and Water Wall in Indoor Environment—Case Study in City of Brno, Czech Republic" Sustainability 13, no. 21: 11649. https://doi.org/10.3390/su132111649
APA StyleCakyova, K., Vertal, M., Vystrcil, J., Nespesny, O., Beckovsky, D., Rubina, A., Pencik, J., & Vranayova, Z. (2021). The Synergy of Living and Water Wall in Indoor Environment—Case Study in City of Brno, Czech Republic. Sustainability, 13(21), 11649. https://doi.org/10.3390/su132111649