Article

The Relationship between Artificial Intelligence and China’s Sustainable Economic Growth: Focused on the Mediating Effects of Industrial Structural Change

School of Economics and Management, Harbin Engineering University, Harbin 150001, China
*
Author to whom correspondence should be addressed.
Sustainability 2021, 13(20), 11542; https://doi.org/10.3390/su132011542
Submission received: 21 September 2021 / Revised: 13 October 2021 / Accepted: 14 October 2021 / Published: 19 October 2021
(This article belongs to the Section Economic and Business Aspects of Sustainability)

Abstract

:
In recent years, the application of artificial intelligence (AI) has had a significant impact on economic development. This study examined the relationship between the level of AI development and economic growth in 28 Chinese provinces from 2005 to 2018, and we focused on the mediating role of the industrial structure. We found that the unreasonable state of the structure is an important reason behind the slowdown of China’s economic growth. The development of AI not only has a direct effect on economic growth, but can also improve economic slowdown by inhibiting industrial structure upgrading. Taking into account regional heterogeneity, we also conducted sub-regional regressions, and the results show that this mediating effect is particularly significant in the eastern, central, and western areas of China; the regression results also show that the development of AI technologies did not boost the economy before the 2008 financial crisis, but during the economic recovery period, the R&D and application of AI helped China’s economy to rebound. Thus, AI has gradually become an important power engine for high-quality and sustainable growth in China’s economy.

1. Introduction

Artificial intelligence (AI) has become a key technology leading the global technological revolution and industrial change, and developed countries are trying to reshape the global industrial landscape in the era of Industry 4.0 [1]. To grasp the new opportunity for economic development, the Chinese government released the “Made in China 2025” policy, which proposes to focus on intelligent manufacturing and actively promote artificial intelligence in various fields [2,3]. Artificial intelligence, as a general-purpose technology, is essentially the use of machines to simulate the cognitive functions of the human brain to replace some human mental labor, which not only improves productivity but also can generate many highly knowledge-intensive jobs and thus affect the structure of labor [4]. However, at the same time, after years of rapid growth, China’s economy has been unable to maintain its growth rate by traditional industrial restructuring alone and is even facing many challenges, such as widening the gap between the rich and the poor and increasing social conflicts due to unreasonable industrial structures [5]. In this study, we examined the direct effect of AI on China’s regional economic development and the indirect role of industrial structure on the former relationship based on the fixed-effects model, the generalized method of moments (GMM), and stepwise regression analysis. This article also explores whether there is spatial and temporal variability in the relationship between AI and economic growth through heterogeneity analysis. The results of this study help to inform the optimization of industrial structure and effectively direct technological progress to achieve sustainable economic growth in China.
This article is organized as follows: Section 2 provides a mechanistic analysis, Section 3 describes the variable selection and the construction of the econometric model, Section 4 provides the regression results and discussion, and Section 5 provides the conclusions.

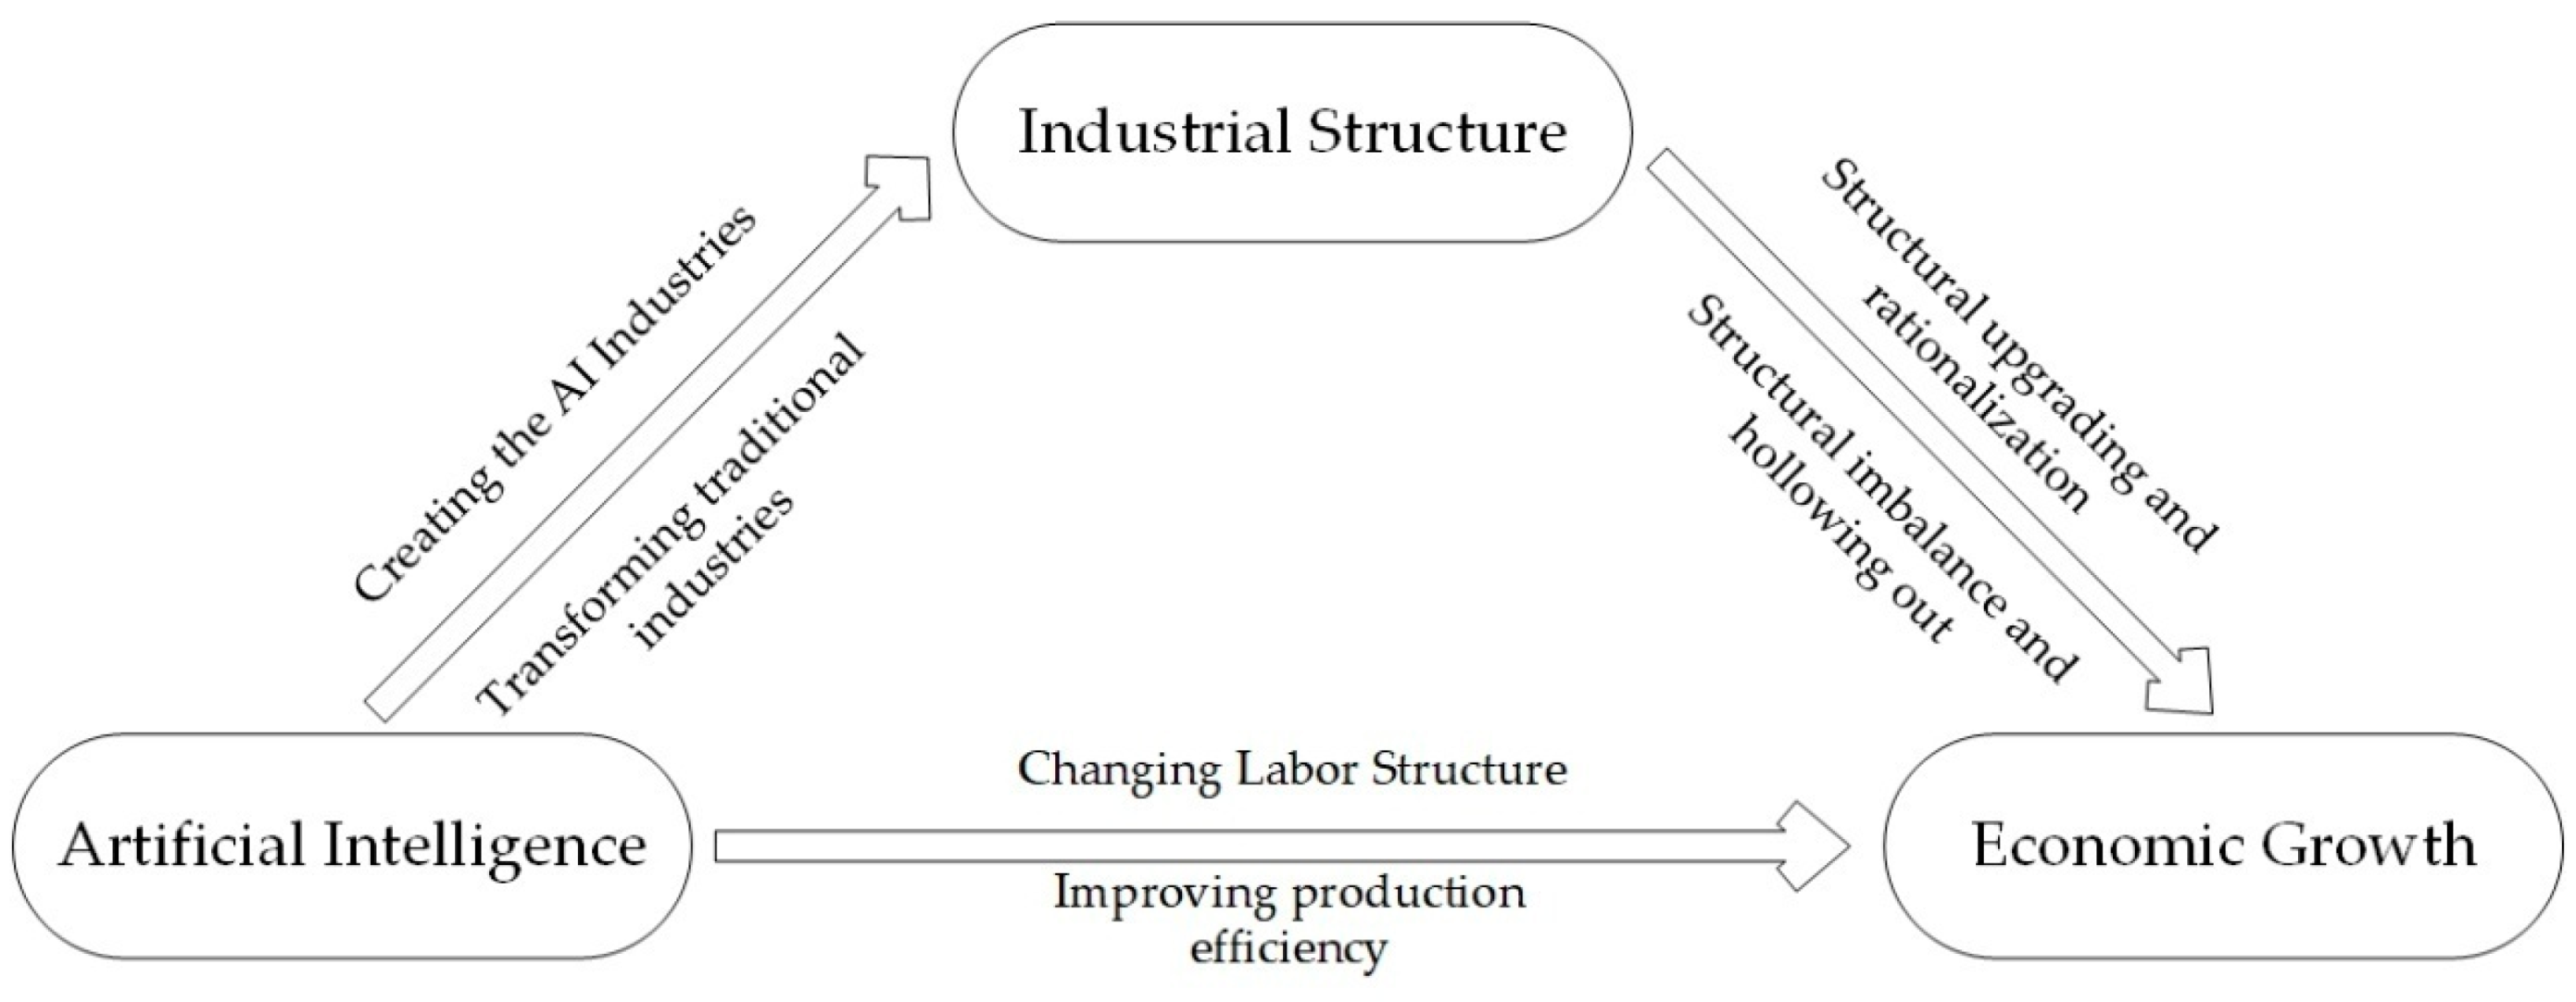
2. Study Hypothesis and Theoretical Framework

Historically, every major industrial technological innovation has been accompanied by a significant increase in productivity [6,7,8]. Artificial intelligence, as the most representative technological progress in current society, contributes to economic development in three main ways: First, intelligent technology can replace traditional labor by automating complex tasks. This approach replaces labor with cheaper capital and not only directly reduces labor costs but also significantly increases the productivity of enterprises [9]; Second, AI can assist the workforce. AI techniques such as machine learning can realize the planning, control, and monitoring of design, production, and equipment operation, thus assisting the workforce and improving total factor productivity [10]; Third, intelligent technology can help promote the technological progress of enterprises. Intelligent technology enhances communication and also reduces the cost of information flow between enterprises [11,12,13]. Therefore, intelligent technology weakens technical barriers, enhances the knowledge spillover effect, and facilitates innovation activities. Moreover, intelligent technology can extract critical information through the analysis of big data and thus obtain rich explicit knowledge. Hence, technology spillover and information identification are effective channels for intelligent technology to promote technological progress. However, due to the high requirements of AI regarding information infrastructure construction and labor quality, at the primary stage of intelligent technology application, there are fewer high-quality talents, and most of the positions with high skill requirements cannot realize the complete replacement of labor by AI, which will reduce or remove the effectiveness of the economic enhancement of AI [14]. Authors D.H. and Dorn D. found that the highly qualified workforce that matches technological progress and economic structure is a key factor in enhancing the core competitiveness of a country [15]. Liu J. et al. highlighted that the development of artificial intelligence cannot be achieved without high-quality talents [16]. Therefore, we propose Hypothesis 1.
Hypothesis 1 (H1).
Artificial intelligence has a catalytic effect on China’s economic growth.
Industrial structure has been considered as a key variable to distinguish developed economies from less developed ones [17]. Industrial structural change mainly comprises two aspects: upgrading and rationalization. Among them, industrial structure upgrading evolution mainly refers to the evolution process of industrial structure from a low level to a high level. The rationalization of industrial structure reflects the effective allocation of resources between industries, and this can indicate the degree of coordination between industries [18]. The relationship between the upgrading and rationalization of the industrial structure is not a simple linear relationship, which may converge or diverge, and the simultaneous promotion of the two levels can realize the optimization of the industrial structure [19]. Economists generally agree that in the process of industrial structure evolution, the efficiency of economic growth can be steadily increased as input factors move from low-productivity to high-productivity sectors and resources are efficiently reallocated [20]. However, in reality, the relationship between industrial structure and economic growth may change for reasons such as the inability of factors to flow adequately in the market. Since the reform and opening-up, China’s economy has experienced years of rapid growth due to the optimization of industrial structure. However, in the late industrialization period, China’s economy experienced a slowdown. Although the government introduced a large-scale economic stimulus plan, the economic growth rate has not been effectively increased, which shows that this phenomenon is not a cyclical slowdown but a structural slowdown [21]. Baumol (1965) considers that this phenomenon is mainly due to the “cost disease of the service sector”. He highlighted that the service sector has low productivity compared to other industries and is a non-progressive sector. Additionally, if wage levels are kept consistent across sectors, service sector costs will rise sharply, resulting in employment and nominal output growth in the service sector but significantly decreased economic growth [22]. Cheng D. Z. found that the Chinese service industry is indeed suffering from “cost disease”, and the labor productivity gap between the tertiary and secondary industries is large. The structural contradiction has become the main contradiction in China’s economic development [23]. Therefore, the relationship between industrial structural change and economic growth is affected by many factors, such as the stage of economic development, and Hypothesis 2 and 3 are proposed.
Hypothesis 2 (H2).
Structural upgrading is beneficial to China’s economic growth.
Hypothesis 3 (H3).
Structural rationalization is beneficial to China’s economic growth.
Technological innovation has had a profound impact on industrial development. Intelligent technology, as a key technology leading the fourth industrial revolution, also has a close connection to the change in the industrial structure. On the one hand, AI upgrades the labor structure by eliminating traditional labor and cultivating high-tech talents [24]. With the rapid development of intelligent technology, other types of production factors, such as financial capital, will also keep pouring into intelligent industries, and the proportion of highly technology-intensive industries in the industrial structure will increase significantly, thus making the structure more advanced. However, with the widening gap in technology intensity between industries, the industrial structure is in an unbalanced state, and the level of structural rationalization may decline. On the other hand, developed countries developed a “re-industrialization” strategy to re-establish the importance of manufacturing. However, this return strategy is not simply the return of production factors, but the upgrading of traditional manufacturing [25]. Intelligent technology has a wide range of permeability characteristics, which can improve the original dominant technology and production methods of traditional industries, and significantly improve their productivity and resource allocation efficiency [26,27,28]. Therefore, intelligent technology enhances the rationalization of the industrial structure by improving the added value of traditional industries, narrowing the technological gap between industries, and enhancing the flow of resource factors. In turn, this intelligent manufacturing strategy may reduce the resource input of the tertiary industry, which is not conducive to the upgrading of the industrial structures [29,30]. Figure 1 is based on the above discussion.
In summary, the relationship between the development of AI and the industrial structure is complex. Additionally, it is of great practical significance to explore how to improve the industrial structure and achieve sustainable economic growth through AI applications. Therefore, Hypothesis 4 and 5 are proposed in this study.
Hypothesis 4 (H4).
Industrial structure upgrading is an effective mediating variable for artificial intelligence to promote China’s economic growth.
Hypothesis 5 (H5).
Industrial structure rationalization is an effective mediating variable for artificial intelligence to promote China’s economic growth.

3. Model and Data

3.1. Model Setting

Referring to Aghion et al. [31], we used mathematical models 1–4 to further illustrate the relationship between AI and economic growth. GDP is a CES combination of goods with an elasticity of substitution less than one:
Y t = A t ( 0 1 X i t ρ d i ) 1 ρ w h e r e   ρ   <   0
At represents standard technological change, and ρ represents the elasticity of substitution. We assumed that another part of technological change is the application of AI. Goods to which AI has not yet been applied can be produced by labor. When AI is applied to a good, it can be replaced by a unit of capital:
X i t = { L i t K i t  
Lit means there are no AI applications, Kit means there are AI applications. Let βt be the proportion of goods to which AI is applied as of date t. In this article, capital and labor are symmetrically allocated across tasks. Thus, each AI task uses Kt/βt units of capital and each non-AI applied task uses L/(1 − βt) units of labor. The production function can be written as:
Y t = A t [ β t ( K t β t ) ρ + ( 1 β t ) ( L 1 β t ) ρ ] 1 / ρ  
Y t = A t [ β t 1 ρ K t ρ + ( 1 β t ) 1 ρ L ρ ] 1 / ρ  
Equation (3) can be simplified to Equation (4). Additionally, we can find that as the proportion of AI applications (βt) rises, Yt also changes. However, their relationship is not clear. Therefore, we used econometric models 5–7 to explore the direct effect of artificial intelligence and industrial structure on economic growth. We also applied the mediating effect model to test whether the industrial structure is an effective channel for AI to promote stable economic growth (Equations (8)–(11)).
G D P i t = α 0 + α 1 I N R i t + α 2 X i t + μ i + λ t + ε i t  
G D P i t = β 0 + β 1 E S i t + β 2 X i t + μ i + λ t + ε i t
G D P i t = γ 0 + γ 1 E R i t + γ 2 X i t + μ i + λ t + ε i t
E S it = σ 0 + σ 1 I N R i t + σ 2 X i t + μ i + λ t + ε i t
E R i t = ξ 0 + ξ 1 I N R i t + ξ 2 X i t + μ i + λ t + ε i t
G D P i t = ϕ 0 + ϕ 1 I N R i t + ϕ 2 E S i t + ϕ 3 X i t + μ i + λ t + ε i t
G D P i t = θ 0 + θ 1 I N R i t + θ 2 E R i t + θ 3 X i t + μ i + λ t + ε i t
GDPit represents the economic growth rate; INRit represents the regional AI index; ESit and ERit are the industrial structure upgrading and rationalization indices, respectively. Xit is a series of control variables, μi represents individual effects, λt represents time effects, and εt represents random error terms.

3.2. Variables and Data

We applied panel data for 28 provinces in China from 2005 to 2018. These data are highly representative of the time period in which the Chinese economy has undergone major changes as AI technology has developed. It is necessary to note that data for some provinces are difficult to obtain, so our data exclude Qinghai, Ningxia, Tibet, Hong Kong, Macau, and Taiwan. Additionally, due to the statistical problems with the yearbook, some data are not available. Thus these values are interpolated. The source of the primary data can be found in Appendix A. The specific indicators were selected and processed as follows:
(1)
Dependent variable: The dependent variable in this study is economic growth (GDPit). GDP is the classical indicator of regional economic development, so this paper used the GDP growth rate of each Chinese province to examine the dynamic growth of the regional economy [32]. Additionally, the GDP growth rate was calculated in constant prices with 2000 as the base period.
(2)
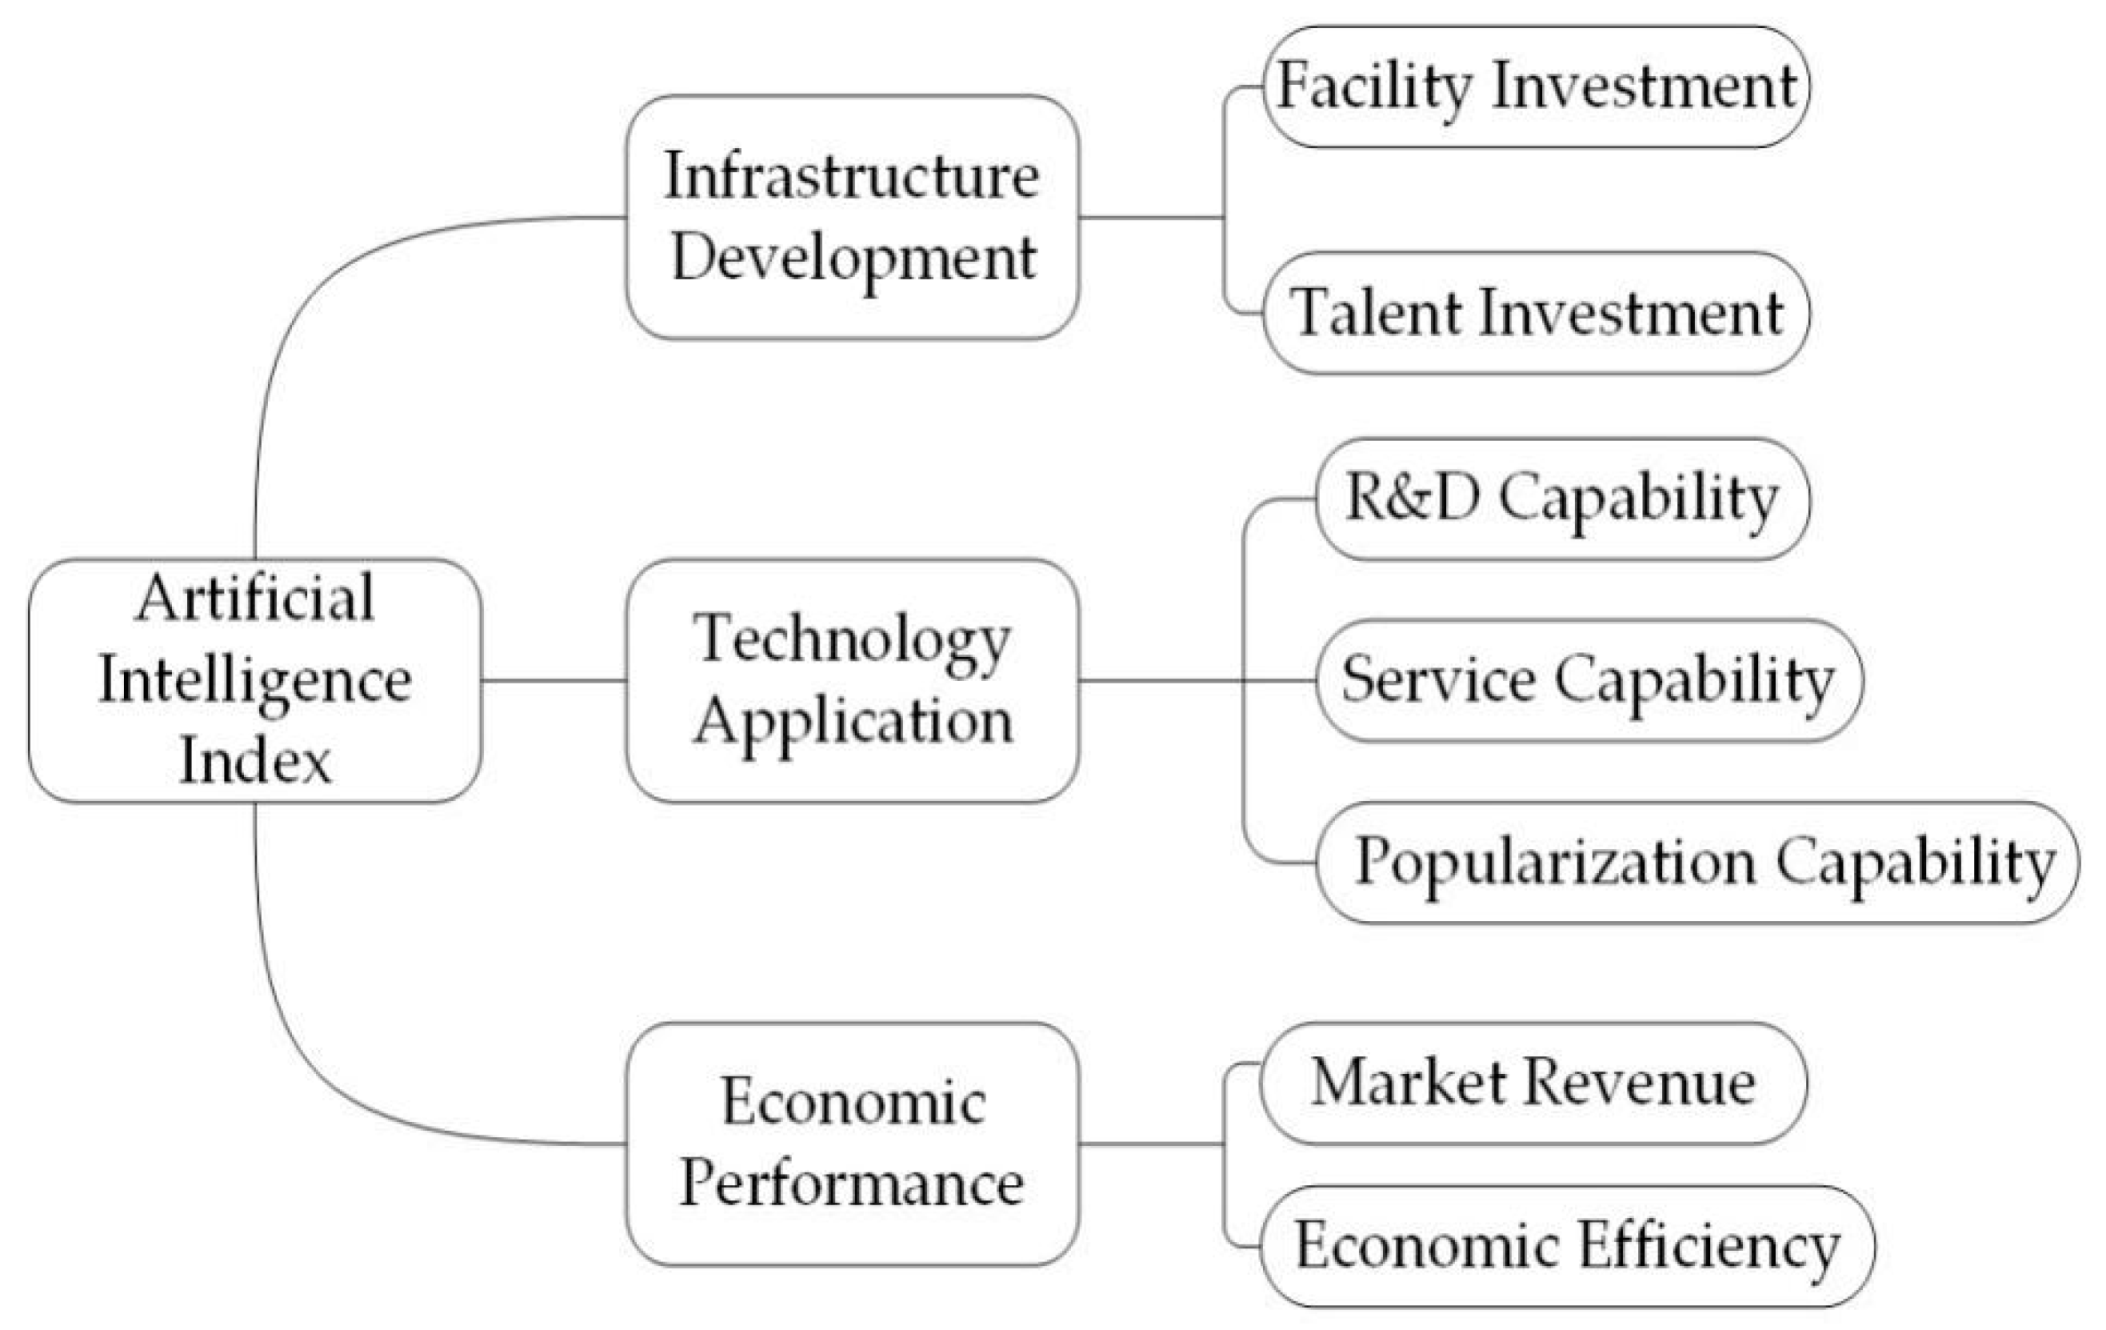
Independent variable: Currently, many studies use a single index, such as the number of industrial robots, to measure the application level of AI [33,34], but there are fewer relevant data in China, and the choice of a single index does not allow a comprehensive assessment. In this paper, we referred to the research results of many Chinese scholars and constructed a regional artificial intelligence evaluation system from three aspects: infrastructure development, technology application, and market benefits (Figure 2) [35,36].
First, intelligent infrastructure development includes two parts: facility investment and talent investment. As an important basis for the development of artificial intelligence technology, communication facilities are the basic guarantee of regional information exchange, and the investment amount of fixed assets in the telecommunication industry was adopted as the proxy variable in this paper. Expertise in artificial intelligence is also equally important, and we chose software development personnel as a proxy variable. Second, technology application contains three parts: R&D capability, service capability, and popularization capability. The number of software enterprises, IT service revenue, and software product revenue were used as proxy variables, respectively. Third, the economic performance reflects the operating performance of the AI industry, and this paper used the profit and per capita income of the artificial intelligence industry to examine the market revenue and economic efficiency. The measurement of the AI index must determine the weights and comprehensive scores. Because there may be some errors in subjectively set weights, we calculated the entropy weight to evaluate the regional intelligence level. Figure 3 shows the changes in China’s intelligence index from 2005 to 2018. Additionally, it can be seen from the figure that in 2010, China’s intelligence level grew rapidly. Although the growth rate of China’s AI index has slowed down in recent years, the overall trend is fluctuating upward.
(3)
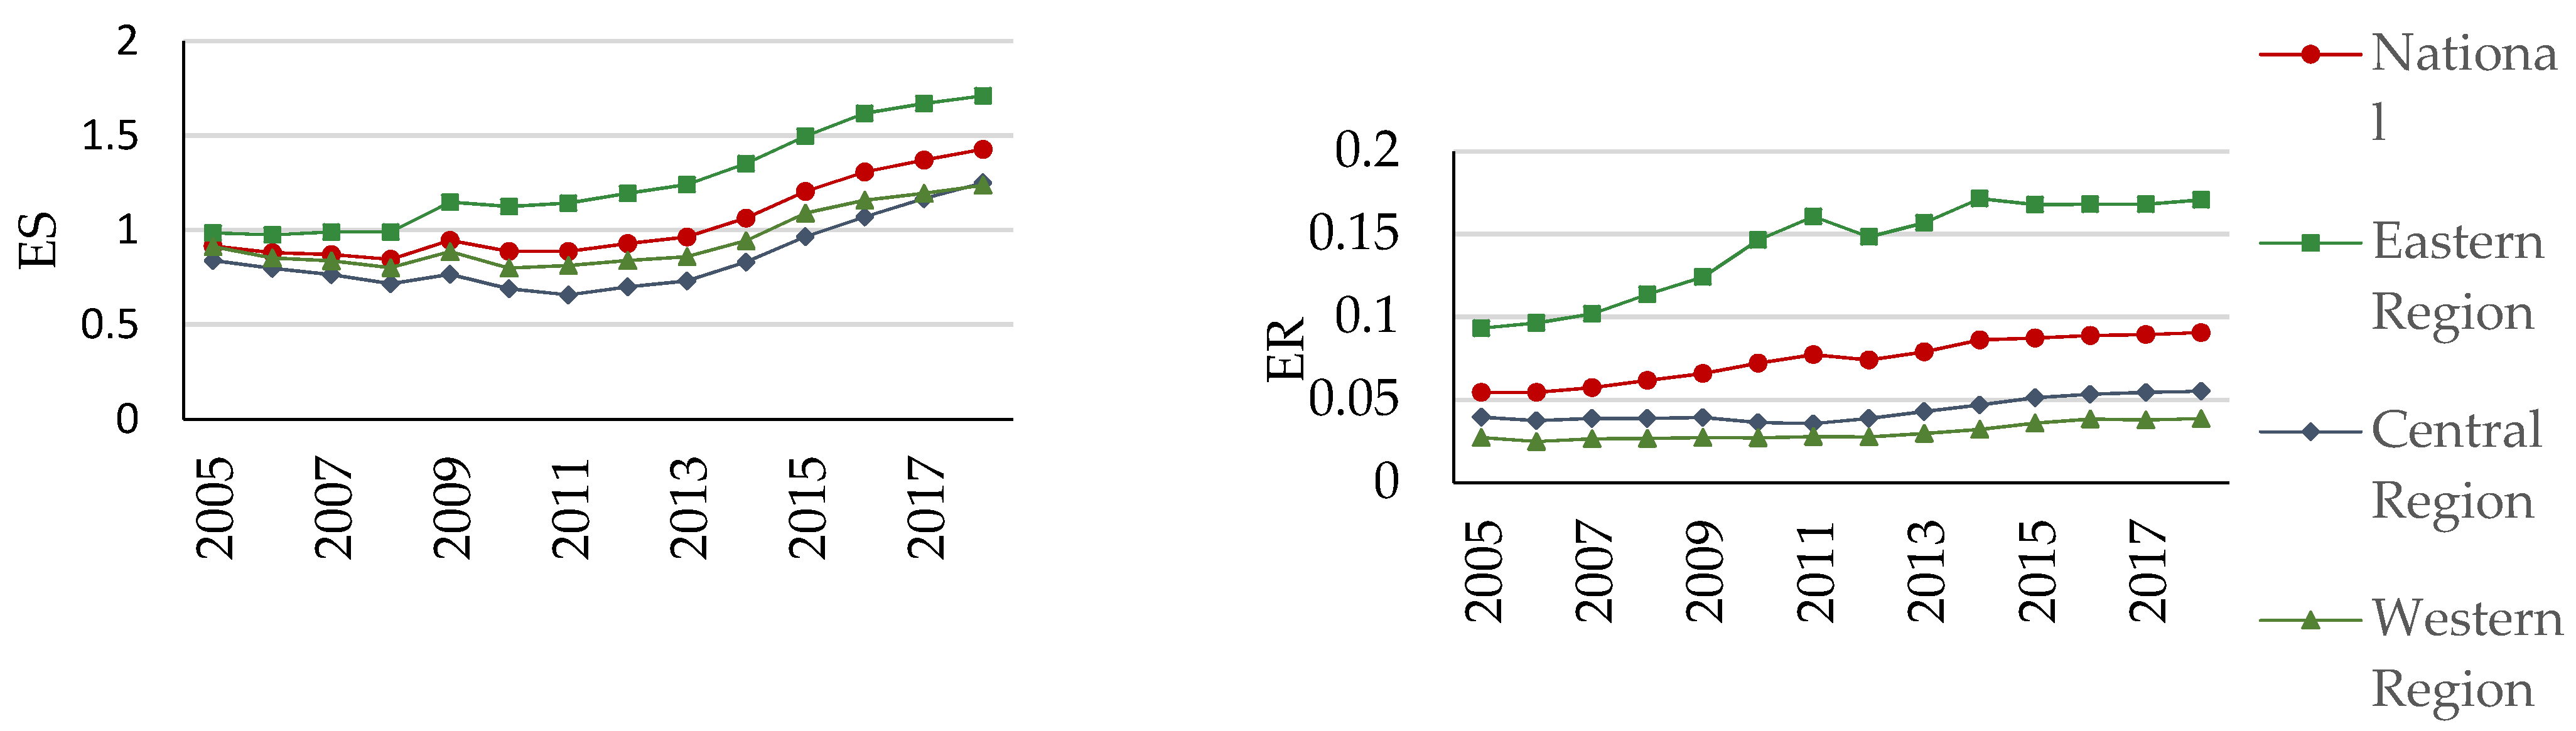
Mediating variables: The industrial structure upgrading index (ESit) and industrial structure rationalization index (ERit) were used as mediating variables. In this paper, the ratio of the tertiary sector to secondary sector output was used to measure the level of structural upgrading, and the improved Theil index (TRit) was used to measure the rationality of the industrial structure (Equations (12) and (13), where Y denotes the output value, L denotes employment, i denotes industry, n denotes the number of industrial sectors, and ERit is the inverse of the Theil index). The lower the value of the Theil index, the higher the index of structure rationalization, indicating that the structure is closer to the equilibrium state and the structure is more rational [37].
Figure 4 was drawn based on the measurement results, which show the level of structural upgrading and rationalization in China. The figure displays an overall upward trend, although ES and ER dropped in 2009 and 2011, respectively. The level of structural upgrading and rationalization in the eastern region far exceeds that in other areas; the industrial structure in the central region is more reasonable than that in the western region, but the two are equal in terms of industrial structural upgrading.
T R i t = i = 1 n ( Y i Y ) ln ( Y i L i / Y L )
E R i t = 1 / T R i t
(4)
Control variables: The main variables include ① the urbanization index (URBit): regions with a higher urbanization index usually have better economic development, so this paper used the proportion of the urban population to the total population in each province to measure the level of regional urbanization [38]; ② trade openness (FDIit): foreign investment can increase additional capital for regional input, and also expose industries to advanced technology and management experience, so FDI is beneficial to regional economic development, and the proportion of trade import and export to GDP of each province was used as a proxy variable for trade openness [39]; ③ government intervention (GOVit): the government can realize the effective allocation of resources within the market through macropolicies, but excessive fiscal intervention may also inhibit the independent innovation of industries, and the fiscal expenditure ratio was used to measure government intervention; ④ communication level (PTBit): the improvement of communication level can effectively reduce the cost of inter-regional information exchange, and this paper adopted the per-capital amount of telecommunications to measure it [40].
The descriptive statistics of all variables are shown in Table 1. It illustrates that there are 392 observed quantities in the study and ER has the most dramatic variation with the largest difference between the maximum and minimum values. The other main variables (GDP, INR, and ER) have a smaller degree of variation, and it is worth noting that the minimum value of GDP is negative, which also indicates that the Chinese economy needs further improvement.

4. Estimation Results

As we needed to perform a preliminary examination of the relationship between variables, cross-sectional correlation tests and unit root tests were performed. Table 2 illustrates that all variables were correlated, and the variables passed the unit root test after second-order differencing. For the homogeneous order single integer series, further cointegration tests are required. The results of both Westerlund and Pedroni tests in Table 3 show that there is a stable long-term relationship between the variables.

4.1. Basic Regression and Discussion

In this part, we used Stata 17.0 for the model analysis. Additionally, the fixed effect type in OLS was selected for the base regression because of the Hausman test results. From Table 4, we can see that the development of AI has significantly contributed to economic growth, but the upgrading and rationalization of the industrial structure are not conducive to economic growth. Due to the possible endogeneity problem of the model, this paper used the GDP first-order lagged term as the instrumental variable and used the GMM model for further dynamic regression analysis. The Sargan test results show that there is no second-order serial correlation problem, thus indicating that the selection of instrumental variables and the setting of the model are reasonable. Table 4 shows the regression results of the GMM model. It shows that the estimated coefficient of the first-order lagged term of GDP is significantly positive, indicating that the current period of economic development is positively correlated with the level of previous periods. At the 5% significant level, AI has a positive driving effect on China’s economy, and a one-unit increase in the regional intelligence level can grow the economy by 3.642%. This is consistent with the findings of existing studies that the application of AI can realize the intelligence of production and management, thus effectively improving labor productivity and achieving sustainable economic growth [41], and Hypothesis 1 is valid. Table 4 also shows that changes in industrial structure have a significant negative effect on economic development, with a greater adverse impact of structural upgrading. And Hypothesis 2 and 3 is not valid. This indicates that it is difficult to support the sustainable growth of China’s economy by relying on industrial structure upgrading and that Baumol’s cost disease, which ignores technological progress, is the main reason for the slowdown of China’s economic growth. Among the control variables, only communication and urbanization levels have a significant contribution to the economy.

4.2. Mediating Effects Regression

We tested whether α1 of model 5 is significant, which is the premise of the mediating effect model. Then, we tested the coefficients of the core variables (σ1, ξ1, φ2, θ2) of models 8–11, respectively, and if the coefficients were significant, this indicated that the mediating effect model was valid. We can further determine whether there are full or partial mediating effects among the variables (φ1, θ1) based on the regression results; if there is a poor sign of the regression coefficients, we need to further determine the role of the relationship between the variables through the Sobel test [42]. The z in Equation (14) is Sobel’s statistic. Specifically, a is σ1 or ξ1, b is φ2 or θ2, and S represents their standard deviation. When these coefficients are not significant, the z value is calculated and a t-test is performed on it. If the p-value < 0.05, then the mediating effect existed.
z = a × b a 2 × S b 2 + b 2 × S a 2
As can be seen from Table 5, the coefficients of FDI and GOV were removed as they were not significant. Additionally, consistent with the previous regression results, the coefficient of α1 is significantly positive at the 5% level. However, the results of the mediating effects regression show that AI is detrimental to industrial structural upgrading, and a 1% increase in the degree of AI application will decrease the industrial structural upgrading index by 0.384%. Similar results indicate that industrial structure upgrading is negative for economic growth. This shows that the mediating effect model is valid, and it is a partially mediating effect, which accounts for 22.029%. Second, following the above steps to test the index of industrial structure rationalization, it is found that the regression results are approximately the same, but the significance is poor, and the Sobel tests showed that the absolute value of the test statistic is 0.695, which is less than the critical value of 1.96, so industrial structure rationalization is not an effective mediating variable.
In summary, the impact of AI development on China consists of both direct and mediating effects, where the mediating effect specifically refers to economic growth by inhibiting the upgrading of the industrial structure, and Hypothesis 4 is valid. There are three reasons for this: (1) The application of industrial robots and other artificial intelligence technologies can improve technical efficiency and promote technological progress, and this effect directly promotes regional economic development. (2) China’s structural upgrading that ignores technological progress will lead to “Baumol’s cost disease” in the tertiary industry. The tremendous technological progress evoked by the development of artificial intelligence has improved the current industrial structure by eliminating the upgrading speed [43,44]. (3) The redistribution of resources realized by AI may enhance the degree of industrial structure imbalance, so the rationalization of the industrial structure is not an effective channel for AI to promote economic growth.

4.3. Regional and Temporal Regression

Considering the large differences in economic levels among regions in China, this paper divided the sample into the eastern, central, and western regions and conducted regression analysis separately. The eastern region includes Beijing, Tianjin, Hebei, Liaoning, Shanghai, Jiangsu, Zhejiang, Fujian, Shandong, Guangdong, and Hainan. The central region includes Shanxi, Jilin, Heilongjiang, Anhui, Jiangxi, Henan, Hubei, and Hunan. The western region includes Chongqing, Sichuan, Guizhou, Yunnan, Shaanxi, Gansu, Xinjiang, Inner Mongolia, and Guangxi. From Table 6, we can see that AI promotes economic growth mainly through the mediating effect of impeding structural upgrading. However, unlike the national sample, this is a full intermediary effect, accounting for 56.60%, and 57.76% of the total effect in the central region and western region, respectively. Additionally, the direct effect of AI is not significant, because AI in China is still in its infancy. Additionally, the current total factor productivity (TFP) base is large [45,46,47]. For the central and western areas, with the development of AI, the level of industrial structure rationalization also decreases and the regional economy grows, which may be caused by the reallocation of resources.
This paper further examined whether the financial crisis had an impact on the economic growth effect of AI, using 2008 as the time point. The regression results (Table 7) show that the role of AI was not significant before the financial crisis, mainly due to the low level of AI application in China before 2008. However, after the financial crisis, with the rise of the Internet, China accelerated the development of AI technology, so the regression results show that the economic growth caused by AI increased significantly in 2008. Consistent with the previous findings, this effect is also achieved mainly by improving the current state of the industrial structure.

4.4. Robustness Test

We used the replacement core variable method to test the robustness of the regression results. First, total factor productivity (TFP) was selected as a new indicator of economic growth. The input variables included physical capital stock and labor force, the output variable was the regional gross product, and the measurement method was stochastic frontier analysis (SFA) [48]. Second, the AI index was re-measured using the coefficient of variation instead of entropy. Finally, we chose the industrial structure upgrading index (Equation (15)) as the industrial structure observation variable and re-estimated the model [49]. From Table 8, we can see that the regression results after replacing the core variables, in turn, are consistent with the previous model results, thus indicating robust results.
E i t = i = 1 3 [ ( Y i t / Y ) i ] , i = 1 , 2 , 3

5. Conclusions

With the rapid development of the technological revolution, China is facing a dual challenge of technological upgrading and economic growth. The wide application of artificial intelligence has gradually become a new way to achieve high-quality economic development. This study explored the impact of AI on China’s economic growth and the role of industrial structure in this relationship. The empirical results show the following:
China’s economy has entered a period of slowdown, and industrial changes alone can no longer meet the new demands of development. It is even facing the structural irrationality formed by the excessive pursuit of structural upgrading. The application of artificial intelligence makes a significant positive contribution to economic growth, and AI has gradually become the core driver of China’s sustainable economic growth.
AI development not only directly promotes regional development, but also enables economic growth by avoiding excessive industrial upgrading. Although the change in resource allocation ratio may lead to a lower rationalization of the industrial structure, the total effect of AI on economic development remains positive.
The relationship between AI and economic growth has significant regional differences. For the central and western areas, the direct effect of AI on the economy is not obvious, but the mediating effect by inhibiting the upgrading of industrial structure is always significant. And AI upgrading may cause a lower level of industrial structure rationalization, but this mediating effect also benefits regional economic growth.
The role of AI is influenced by the economic environment. Before the financial crisis in 2008, the level of R&D and the application of intelligent technology was low and could not fully play its role in driving the economy. Additionally, in the late financial crisis, the rise of AI gradually became an important support for economic recovery and stable development.
In light of these results, several better practices emerge for government policymakers. First, it is reasonable to understand the dynamic relationship between the economy and the industrial structure and enhance the degree of industrial structure optimization. On the one hand, we should actively promote the flow of production factors and realize the reasonable allocation of resource factors; on the other hand, the government should use technological innovation to guide the industrial structure to upgrade to high value-added, high technology, and high intensification. Second, the Chinese government should actively promote the development of the artificial intelligence industry. The government should encourage the development and application of information technology, to narrow the digital divide and realize the construction of industrial information networks. The government is expected to cultivate high-quality talents that meet the needs of intelligence. Optimizing the talent cultivation system guarantees human resources for intelligent development. Finally, the intelligent development strategy of each region should be formulated according to local conditions and development stages. For the eastern region, where the infrastructure is better, the government can encourage enterprises to carry out R&D activities by formulating incentive policies to promote the development of AI technology; for the central and western areas, especially those with backward economic development, the government should formulate supportive policies to introduce high-quality talents. In the face of the “COVID-19” epidemic, artificial intelligence was applied in the prevention, control, prediction, and treatment stages of the virus, and some economic losses were recovered as a result. Therefore, the government should pay more attention to the research and development of AI in the current economic environment. Enterprises should also strengthen technology exchange and cooperation to ensure stable economic growth.
Although this study explored the impact of AI on the economy from a new perspective, the research is still preliminary. Undoubtedly, there are still aspects to improve upon in our research. If we can obtain more relevant data concerning AI in China, we can develop more scientific indices, which will make policy recommendations more accurate and applicable. However, the findings of this paper provide important implications for policymakers, both in China and elsewhere, especially during an economic transformation.

Author Contributions

K.L. collected and analyzed the data and prepared the draft, and D.F. organized the research design and finalized the paper. All authors have read and agreed to the published version of the manuscript.

Funding

This research was funded by the Key Project of the National Social Science Foundation of China with grant number (19AGL007) and the Research Planning Project of Philosophy and Social Science of Heilongjiang Province (grant number 18GLD291).

Institutional Review Board Statement

Not applicable.

Informed Consent Statement

Not applicable.

Data Availability Statement

Publicly available datasets were analyzed in this study. This data can be found here: http://www.stats.gov.cn/ (accessed on 17 October 2021).

Acknowledgments

We are indebted to the anonymous reviewers and editors.

Conflicts of Interest

The authors declare that they have no conflict of interest.

Appendix A

Table A1. Data source of primary variables.
Primary VariablesData Source
GDP growth rateChina Statistical Yearbook (CSY)
The investment amount of fixed assets in the telecommunication industryChina Electronic Information Industry
Statistical Yearbook (CEINSY)
The number of software development personnelCEINSY
The number of software enterprisesCEINSY
IT service revenueCEINSY
Software product revenueCEINSY
The profit and per capita income of the artificial intelligence industryNational Bureau of Statistics Database
The industrial outputCSY
The number of industrial employeesCSY
The proportion of the urban population to total populationCSY
The proportion of trade import and export to GDPCSY
The fiscal expenditure ratioCSY
The per-capital amount of telecommunicationsCSY

References

  1. Olsen, T.L.; Tomlin, B. Industry 4.0: Opportunities and challenges for operations management. M&SOM-Manuf. Serv. Op. 2020, 22, 113–122. [Google Scholar]
  2. Li, L. China′s manufacturing locus in 2025: With a comparison of “made-in-China 2025” and “industry 4.0”. Technol. Forecast. Soc. 2018, 135, 66–74. [Google Scholar] [CrossRef]
  3. Guan, J.; Shi, Y. China’s economic strategy: When theory meets practice. Aust. J. Int. Aff. 2020, 74, 348–354. [Google Scholar] [CrossRef] [Green Version]
  4. Restrepo, P.; Acemoglu, D. The wrong kind of AI? Artificial intelligence and the future of labour demand. Cam. J. Reg. Econ. Soc. 2020, 13, 25–35. [Google Scholar]
  5. Andreoni, A.; Tregenna, F. Escaping the middle-income technology trap: A comparative analysis of industrial policies in China, Brazil, and South Africa. Struct. Change Econ. D. 2020, 54, 324–340. [Google Scholar] [CrossRef]
  6. Rajapathirana, R.P.J.; Hui, Y. Relationship between innovation capability, innovation type, and firm performance. J. Innov. Knowl. 2018, 3, 44–55. [Google Scholar] [CrossRef]
  7. Teece, D.J. Profiting from innovation in the digital economy: Enabling technologies, standards, and licensing models in the wireless world. Res. Policy. 2018, 47, 1367–1387. [Google Scholar] [CrossRef]
  8. Lv, L.; Yin, Y.; Wang, Y.; Chen, C.-H. The Impact of R&D Input on Technological Innovation: Evidence from South Asian and Southeast Asian Countries. Discret. Dyn. Nat. Soc. 2020, 2020, 1–11. [Google Scholar] [CrossRef]
  9. Gazni, A.; Ghaseminik, Z. The increasing dominance of science in the economy: Which nations are successful? Scientometrics 2019, 120, 1411–1426. [Google Scholar] [CrossRef]
  10. Lewis, P.; Bell, K. Understanding the UK’s productivity problems. Empl. Relat. Int. J. 2019, 41, 296–312. [Google Scholar] [CrossRef]
  11. Kim, D.-H.; Kim, T.J.Y.; Wang, X.; Kim, M.; Quan, Y.-J.; Oh, J.W.; Min, S.-H.; Kim, H.; Bhandari, B.; Yang, I.; et al. Smart Machining Process Using Machine Learning: A Review and Perspective on Machining Industry. Int. J. Precis. Eng. Manuf.–Green Technol. 2018, 5, 555–568. [Google Scholar] [CrossRef]
  12. Kumar, V.; Rajan, B.; Venkatesan, R.; Lecinski, J. Understanding the role of artificial intelligence in personalized engagement marketing. Calif. Manag. Rev. 2019, 61, 135–155. [Google Scholar] [CrossRef]
  13. Wei, F.; Sheng, D.; Lili, W. Evolutionary model and simulation research of collaborative innovation network: A case study of artificial intelligence industry. Discret. Dyn. Nat. Society. 2018, 2018, 1–13. [Google Scholar] [CrossRef]
  14. Vinuesa, R.; Azizpour, H.; Leite, I.; Balaam, M.; Dignum, V.; Domisch, S.; Fellander, A.; Langhans, S.D.; Tegmark, M.; Nerini, F.F. The role of artificial intelligence in achieving the sustainable development goals. Nat. Commun. 2020, 11, 233. [Google Scholar] [CrossRef] [PubMed] [Green Version]
  15. Henstock, P.V. Artificial Intelligence for Pharma: Time for Internal Investment. Trends Pharmacol. Sci. 2019, 40, 543–546. [Google Scholar] [CrossRef] [PubMed]
  16. Autor, D.H.; Dorn, D. The Growth of Low-Skill Service Jobs and the Polarization of the US Labor Market. Am. Econ. Rev. 2013, 103, 1553–1597. [Google Scholar] [CrossRef] [Green Version]
  17. Liu, J.; Chang, H.; Forrest, J.Y.-L.; Yang, B. Influence of artificial intelligence on technological innovation: Evidence from the panel data of china's manufacturing sectors. Technol. Forecast. Soc. Chang. 2020, 158, 120–142. [Google Scholar] [CrossRef]
  18. Sertsios, G. Corporate finance, industrial organization, and organizational economics. J. Corp. Financ. 2020, 64, 101680. [Google Scholar] [CrossRef]
  19. Zhou, X.; Pan, Z.; Shahbaz, M.; Song, M. Directed technological progress driven by diversified industrial structural change. Struct. Chang. Econ. Dyn. 2020, 54, 112–129. [Google Scholar] [CrossRef]
  20. Tsai, D.H.A. The effects of dynamic industrial transition on sustainable development. Struct. Chang. Econ. Dyn. 2018, 44, 46–54. [Google Scholar] [CrossRef]
  21. Qian, X.F.; Liu, Z.; Pan, Y. China’s trade slowdown: Cyclical or structural? China World Econ. 2017, 25, 65–83. [Google Scholar] [CrossRef]
  22. Baumol, W.J. Macroeconomics of unbalanced growth: The anatomy of urban crisis. Am. Econ. Rev. 1967, 57, 415–426. [Google Scholar]
  23. Cheng, D.Z. Features, causes, and effects of service industry growth: Baumol-Fuchs hypothesis and an empirical study. Soc. Sci. China. 2004, 4, 18–32+204. [Google Scholar]
  24. Capasso, M.; Stam, E.; Cefis, E. Industrial Dynamics and Economic Geography. Reg. Stud. 2014, 49, 5–9. [Google Scholar] [CrossRef]
  25. He, B.; Bai, K.-J. Digital twin-based sustainable intelligent manufacturing: A review. Adv. Manuf. 2020, 9, 1–21. [Google Scholar] [CrossRef]
  26. Wang, L. From Intelligence Science to Intelligent Manufacturing. Engineering 2019, 5, 615–618. [Google Scholar] [CrossRef]
  27. Min, H. Artificial intelligence in supply chain management: Theory and applications. Int. J. Logist. Res. Appl. 2009, 13, 13–39. [Google Scholar] [CrossRef]
  28. Kundisch, D.O.; Mittal, N.; Nault, B.R. Research Commentary—Using Income Accounting as the Theoretical Basis for Measuring IT Productivity. Inf. Syst. Res. 2014, 25, 449–467. [Google Scholar] [CrossRef] [Green Version]
  29. Shrestha, Y.R.; Ben-Menahem, S.M.; von Krogh, G. Organizational Decision-Making Structures in the Age of Artificial Intelligence. Calif. Manag. Rev. 2019, 61, 66–83. [Google Scholar] [CrossRef]
  30. Jarrahi, M.H. Artificial intelligence and the future of work: Human-AI symbiosis in organizational decision making. Bus. Horiz. 2018, 61, 577–586. [Google Scholar] [CrossRef]
  31. Aghion, P.; Jones, B.F.; Jones, C.I. Artificial intelligence and economic growth. NBER Work. Papers 2018, 23928. [Google Scholar] [CrossRef]
  32. Amirat, A.; Zaidi, M. Estimating GDP Growth in Saudi Arabia Under the Government’s Vision 2030: A Knowledge-based Economy Approach. J. Knowl. Econ. 2019, 11, 1145–1170. [Google Scholar] [CrossRef]
  33. Lee, H.; Kraft, B.; Leigh, N.G. Robots, skill demand and manufacturing in US regional labour markets. Camb. J. Reg. Econ. Soc. 2020, 13, 77–97. [Google Scholar] [CrossRef]
  34. Clark, C.M.A.; Gevorkyan, A.V. Artificial Intelligence and Human Flourishing. Am. J. Econ. Sociol. 2020, 79, 1307–1344. [Google Scholar] [CrossRef]
  35. Liu, L.; Li, L.S.; Liu, J.; Cheng, Z.H. Intelligentization and the transformation of economic development mode: Theoretical mechanism and empirical evidence. Econ. Rev. 2020, 4, 3–19. [Google Scholar]
  36. Liu, L.; Yang, K.; Fujii, H.; Liu, J. Artificial intelligence and energy intensity in China’s industrial sector: Effect and transmission channel. Econ. Anal. Policy 2021, 70, 276–293. [Google Scholar] [CrossRef]
  37. Gan, C.H.; Zheng, R.G.; Yu, D.F. An empirical study on the effects of industrial structure on economic growth and fluctuations in China. Econ. Res. J. 2011, 46, 4–16+31. [Google Scholar]
  38. Yunsong, C.; Yi, Z. The Inequality Effect of Urbanization and Social Integration. Soc. Sci. China 2016, 37, 117–135. [Google Scholar] [CrossRef]
  39. Droste, N.; Hansjürgens, B.; Kuikman, P.; Otter, N.; Antikainen, R.; Leskinen, P.; Pitkänen, K.; Saikku, L.; Loiseau, E.; Thomsen, M. Steering innovations towards a green economy: Understanding government intervention. J. Clean. Prod. 2016, 135, 426–434. [Google Scholar] [CrossRef]
  40. Symeou, P.C. Economy size and performance: An efficiency analysis in the telecommunications sector. Telecommun. Policy 2011, 35, 426–440. [Google Scholar] [CrossRef]
  41. Kaplan, A.; Haenlein, M. Rulers of the world, unite! The challenges and opportunities of artificial intelligence. Bus. Horiz. 2020, 63, 37–50. [Google Scholar] [CrossRef]
  42. Wen, Z.L.; Chang, L.; Hau, K.T.; Liu, H.Y. Testing and application of the mediating effects. Acta Psychol. Sin. 2004, 36, 614–620. [Google Scholar]
  43. Liao, H.; Yang, L.; Ma, H.; Zheng, J. Technology import, secondary innovation, and industrial structure optimization: A potential innovation strategy for China. Pac. Econ. Rev. 2020, 25, 145–160. [Google Scholar] [CrossRef]
  44. Wagner, D.N. Economic patterns in a world with artificial intelligence. Evol. Inst. Econ. Rev. 2020, 17, 111–131. [Google Scholar] [CrossRef] [Green Version]
  45. Lei, X.; Wu, S. Improvement of Different Types of Environmental Regulations on Total Factor Productivity: A Threshold Effect Analysis. Discret. Dyn. Nat. Soc. 2019, 2019, 1–12. [Google Scholar] [CrossRef]
  46. Lu, R.; Ruan, M.; Reve, T. Cluster and co-located cluster effects: An empirical study of six Chinese city regions. Res. Policy 2016, 45, 1984–1995. [Google Scholar] [CrossRef]
  47. Jia, Z.; Gu, G. Is Local Government Intervention Effective in Promoting the Tfp of an Old Industrial Area?—a Spatial Econometric Analysis of Northeast China. Singap. Econ. Rev. 2020, 66, 933–951. [Google Scholar] [CrossRef]
  48. Lampe, H.W.; Hilgers, D. Trajectories of efficiency measurement: A bibliometric analysis of DEA and SFA. Eur. J. Oper. Res. 2015, 240, 1–21. [Google Scholar] [CrossRef]
  49. Xiao, W.E.N.; Pan, J.-D.; Liu, L.-Y. China’s Industrial Structure Upgrade in the “New Normal”: Empirical Test and Determinants. Singap. Econ. Rev. 2018, 63, 1037–1058. [Google Scholar] [CrossRef] [Green Version]
Figure 1. Theoretical analysis chart.
Sustainability 13 11542 g001
Figure 2. Artificial intelligence evaluation system.
Sustainability 13 11542 g002
Figure 3. Artificial intelligence development in China from 2005 to 2018.
Sustainability 13 11542 g003
Figure 4. Changes in China’s industrial structure from 2005 to 2018.
Sustainability 13 11542 g004
Table 1. Descriptive statistics.
VariableObsMeanStd.Dev.MinMax
GDP3920.10700.0324−0.02500.2380
INR3920.23050.18920.00700.8293
ER3927.89769.08561.214062.0542
ES3921.03610.57880.49914.3548
URB3920.53860.14250.26870.8960
FDI3920.15560.24200.00021.2371
GOV3920.20660.07580.07920.4575
PTB3920.19950.15500.04551.1204
Table 2. Cross-sectional correlation test and unit root test.
Cross-Sectional Correlation TestUnit Root Test
Original ValuesOriginal ValuesSecond-order differenced values
CDLLCIPSLLCIPS
GDP58.64 ***0.304.41−39.62 ***−27.41 ***
INR23.26 ***−3.22 ***−0.88−22.19 ***−17.21 ***
ER37.67 ***−0.563.30−21.50 ***−16.71 ***
ES53.09 ***6.908.85−21.03 ***−16.14 ***
URB63.74 ***−0.906.15−23.36 ***−17.45 ***
FDI13.78 ***−3.41 ***1.28−23.24 ***−17.92 ***
GOV62.81 ***−5.78 ***0.26−21.64 ***−17.54 ***
PTB70.24 ***20.9410.31−12.01 ***−8.08 ***
Note: ***, **, and * denote significant levels at 1%, 5%, and 10%, respectively.
Table 3. Cointegration test.
VariablesMethodStatistical VariablesValues
Artificial intelligence indexWesterlundVariance ratio3.95 ***
PedroniAugmented Dickey–Fuller t−6.86 ***
Phillips–Perron t−7.27 ***
Industrial structure upgradingWesterlundVariance ratio1.54 *
PedroniAugmented Dickey–Fuller t−7.16 ***
Phillips–Perron t−7.19 ***
Industrial structure rationalizationWesterlundVariance ratio1.81 **
PedroniAugmented Dickey–Fuller t−9.29 ***
Phillips–Perron t−9.64 ***
Note: ***, **, and * denote significant levels at 1%, 5%, and 10%, respectively.
Table 4. Basic regression results.
(1)(2)(3)(4)(5)(6)
FEFEFEGMMGMMGMM
Lag of GDP 0.674 ***0.681 ***0.765 ***
(0.039)(0.053)(0.048)
INR0.042 * 3.642 **
(0.023) (1.702)
ES −0.050 *** −7.471 ***
(0.005) (1.061)
ER −0.002 *** −0.111 **
(0.000) (0.053)
URB−0.397 ***−0.376 ***−0.355***23.139 *−3.815−2.35
(0.040)(0.030)(0.033)(13.552)(16.382)(16.908)
FDI0.072 ***0.031 ***0.043***−4.737 **−2.0735.644 *
(0.013)(0.011)(0.013)(2.193)(2.720)(3.022)
GOV−0.0330.101 **−0.037−1.221−1.051−6.186 **
(0.046)(0.042)(0.044)(5.29)(3.016)(2.875)
PTB−0.0040.028 ***−0.0011.612 **1.219 **1.411 ***
(0.010)(0.010)(0.010)(0.755)(0.545)(0.535)
Hausman−116.250188.930 ***−8655.080
Sargan 329.085225.719245.533
AR (2) 0.3140.205−1.625
Note: ***, **, and * denote significant levels at 1%, 5%, and 10%, respectively.
Table 5. Regression results of mediating effects.
(1)(2)(3)(4)(5)
Total EffectsMediation Effects of Structural UpgradingMediating Effects of Structural Rationalization
GDPESGDPERGDP
INR2.346 **
(1.135)
−0.384 **
(0.177)
1.829 *
(1.118)
−4.016 *
(2.118)
2.427 **
(0.027)
ES −1.344 ***
(0.319)
ER 0.020
(1.414)
URB−6.111 ***
(1.594)
1.647 ***
(0.249)
−3.897 **
(1.647)
47.360 ***
(2.975)
−7.074 ***
(2.051)
PTB−5.260 ***
(1.212)
1.283 ***
(0.198)
−3.536 ***
(1.311)
9.000 ***
(2.374)
−5.443 ***
(1.296)
TIME EFFECTSYESYESYESYESYES
INDIVIDUALS EFFECTSYESYESYESYESYES
OBSERVATIONS392392392392392
Note: ***, **, and * denote significant levels at 1%, 5%, and 10%, respectively.
Table 6. Regional regression results.
Eastern Region
GDPESGDPERGDP
INR9.116***
(2.163)
−0.286*
(0.082)
9.121***
(2.175)
1.166
(5.067)
9.344***
(2.191)
ES −0.019
(0.303)
ER −0.027
(0.025)
Central Region
GDPESGDPERGDP
INR7.439 *
(4.262)
−1.030 ***
(0.359)
3.227
(4.246)
−5.900 **
(2.580)
4.158
(4.213)
ES −4.088 ***
(0.894)
ER −0.556 ***
(0.137)
Western Region
GDPESGDPERGDP
INR6.795 **
(3.109)
−0.671 **
(0.279)
2.867
(2.744)
5.038 ***
(1.251)
8.462 **
(3.355)
ES −5.849 ***
(0.986)
ER −0.331
(0.256)
Note: ***, **, and * denote significant levels at 1%, 5%, and 10%, respectively.
Table 7. Temporal regression results.
Before the Financial Crisis in 2008
GDPGDPGDP
INR2.480
(2.841)
ES −1.513 *
(0.831)
ER −0.166 **
(0.831)
After the Financial Crisis in 2008
GDPESGDPERGDP
INR2.150 *
(1.136)
−0.584 ***
(0.204)
1.55
(1.134)
−6.510 ***
(2.384)
2.509 **
(1.145)
ES −1.035 ***
(0.329)
ER 0.055 *
(0.029)
Note: ***, **, and * denote significant levels at 1%, 5%, and 10%, respectively.
Table 8. Robustness test results.
Replacement of Economic Growth Indicator
TFPESTFPERTFP
INR1.177 ***−0.478 **1.112 ***−7.504 ***1.163 ***
ES −0.136 ***
ER 0.001
Replacement of AI Index Calculation Method
GDPESGDPERGDP
INR2.830 **−0.553 ***−0.035 *5.242.849 **
ES −0.051 ***
ER 0.020
Replacement of Industrial Structure Upgrading Index
GDPEGDP
INR2.830 ***−0.101*3.137 **
E −11.091 ***
Note: ***, **, and * denote significant levels at 1%, 5%, and 10%, respectively.
Publisher’s Note: MDPI stays neutral with regard to jurisdictional claims in published maps and institutional affiliations.

