Article

Adsorption-Release Characteristics of Phosphorus and the Community of Phosphorus Accumulating Organisms of Sediments in a Shallow Lake

1
Environmental Science and Engineering College, Fujian Normal University, Fuzhou 350007, China
2
Fujian Province Research Centre for River and Lake Health, Fuzhou 350007, China
3
Department of Geography and Environmental Science, University of Reading, Reading, Whiteknights RG6 6AB, UK
*
Author to whom correspondence should be addressed.
Sustainability 2021, 13(20), 11501; https://doi.org/10.3390/su132011501
Submission received: 28 August 2021 / Revised: 30 September 2021 / Accepted: 11 October 2021 / Published: 18 October 2021

Abstract

:
One of the most challenging issues for developing countries in modern times is the care and management of clean, potable drinking water sources. Accordingly, this study singled out potential contributing factors to harmful algae blooms with a particular focus on phosphorus (P) release. The potential risks of P release for the drinking water from a lake in Fujian were assessed by investigating the spatial-temporal distribution of P, its exchange capacity, and its discharge capacity in sediment, including the community composition of phosphorus accumulating organisms (PAOs) and the phosphate’s initial migration effects on sediments. Different mixed materials, including soil aggregate distributions, sorbent, fractions, adsorption-desorption of P, and the community composition of PAOs were assessed. Total phosphorus (TP) content was measured at 24.4 ± 1.2 to 563.9 ± 38.2 mg/kg, but contents displayed some spatial differences. The dominant Ps found in the sample sediments were organic phosphorus and inorganic phosphorus associated with hydroxide Fe/Al-P, which accounted for 48.6% and 43.6%, respectively, of the TP content in the lake’s central waters. The TP concentration in vertical sediment ranged from 436.2 ± 21.3 to 602.9 ± 31.4 mg/kg. The TP spatio-temporal distribution inputs varied with rainfall (p < 0.05). P deposition occurred throughout most water bodies (p < 0.05), covering extensive areas and also decreasing at lower depths. Forty-four operational taxonomic unit (OTU) phosphorus-accumulating organism types from 11 phyla were detected in the sediment samples obtained from the Sanshiliujiao Lakes region. Proteobacteria also dominated compared to the organisms with the strongest PAOs. The diversity of PAOs in summer samples was significantly higher than that of the autumn samples. These findings provide a scientific foundation for determining the future discovery of the microbial mechanisms involved in the phosphorus metabolic cycle found in reservoir sediments. Various forms of phosphorus influenced the PAO diversity, especially Fe/Al-P. Thus, the abundance of PAOs in the sediment proved to be an essential component of the P cycle and may even play a key role in regional material circulation and in causing other environmental issues.

1. Introduction

Due to the effects of rapid economic and social development, excessive nutrients, mainly nitrogen and phosphorus (P), have been released into international bodies of freshwater, which has resulted in severe water eutrophication [1,2,3]. It has also been well documented that water eutrophication ultimately leads to harmful algae blooms (HABs) that are often accompanied by dangerous toxins currently filtrating into the world’s drinking water supplies [4,5]. For these reasons, eutrophication has become one of the most challenging environmental problems in developing countries such as China. Major lakes and reservoirs indicate that P is a critical contributor to water eutrophication [6]. Numerous studies over the past few decades have proven that algal blooms release P from freshwater sediments where P has amassed over time, which can then exacerbate algal blooms [7,8,9]. The primary reason that HABs cannot wholly be resolved and can even cause re-eutrophication, is most likely that it is challenging to manage the critical causes, such as responses to climate change and other anticipated nutrients’ forcing of HABs; furthermore, the specific mechanisms are not precisely understood [10]. We suggest that the phosphorus cycle between sediments and algal blooms provides an important subject area for research teams for further study.
It has already been well established that sediment provides an essential reservoir of nutrients for natural aquatic ecosystems. Numerous studies have also shown that HAB occurrences can also affect the release of nutrients, especially P, from lake sediment [11,12]. Therefore, the study of P migration and transformation through the sediment–water interface is critical for clarifying the contribution of sediment phosphorus to HABs [13]. Factors affecting released P from sediments include the deposits’ intrinsic properties, their P content, their morphology, and the sediments’ own environmental conditions [14,15]. Many studies have also revealed that the P in sediments includes organic phosphorus (OP) and inorganic phosphorus (IP), and it is IP that accounts for most of the total phosphorus (TP) concentration [16,17]. Among the different IPs, the P associated with iron (Fe-P) is the most likely to change forms, but the P associated with Ca (Ca (Al-P)) is the most stable constituent [18]. It is also crucial to consider that the transformation of P fractions in sediment is multifaceted and involves numerous microbial community interactions. The metabolism of microbial bacteria may even promote the formation of phototrophic organisms and P mobilization. The sediment P adsorption capacity appears to be directly related to sediment size because fine particles can absorb more P. Environmental factors affecting P are those that lake sediments typically release, including pH, temperature [19], agitation, biological activity, and oxidation and reduction potential [20,21].
P adsorption, kinetics, thermodynamics, isotherms, and alternative parameters [22] can all reflect P adsorption mechanisms in sediments. When assessing sediment components, the Langmuir and Freundlich equations have been used to represent the sediment adsorption transformations and determine the maximum adsorption capacity and effectiveness [23,24]. Experiments and mass balance equations have also been used to study the release flux of P in sediments, which provided an effective method to explore the impact of sediments on water quality [25]. These measures can even estimate the residues’ potential to release soluble reactive phosphorus (SRP) in overlying water by comparing the adsorption-desorption equilibrium concentration (EPC0) to the SRP concentrations. When the SRP concentration is greater than the EPC0 concentration, the deposit adsorbs P in the water [26]. When the SRP concentration is less than the EPC0 concentration, the sediments releases P from the overlying water and increases the risk of blooming accordingly [27]. The relevant government agencies in the studied region have carefully taken measures to control the pollution sources of Sanshiliujiao Lake in the past few years, but HABs have also continued to occur, especially during the summer [28]. For this reason, it can be conjectured that the sediment’s internal nutrient loading may be responsible for the lake’s unimproved water quality.
To the best of our knowledge, the existing literature lacks microbiological studies on the phosphorus cycle in the Sanshiliujiao Lake waters, especially concerning its previously unreported phosphate-accumulating bacteria diversity and community characteristics. This study aimed to examine the distribution and proportion of P in the sediments of Sanshiliujiao Lake to simulate the adsorption and release characteristics of sediment P, and to explore the environmental impact of sediment P collected from surface sediments and cores. Bacteria diversity and the characteristics of its community structure were also investigated, along with other structures and environmental factors. These factors were then analyzed to establish the sediments’ distribution and P migration characteristics. The P adsorption kinetics, adsorption thermodynamic characteristics, and the P release load and risk were also determined. Our results suggest that (1) P-depleted sediments in a P migration system, (2) the P migration theory at the sediment–water interface, (3) collective assessment of the community composition and distribution of PAOs, and (4) eutrophication control are of theoretical and practical significance in mitigating the adverse effects of P released in the freshwater environment.

2. Materials and Methods

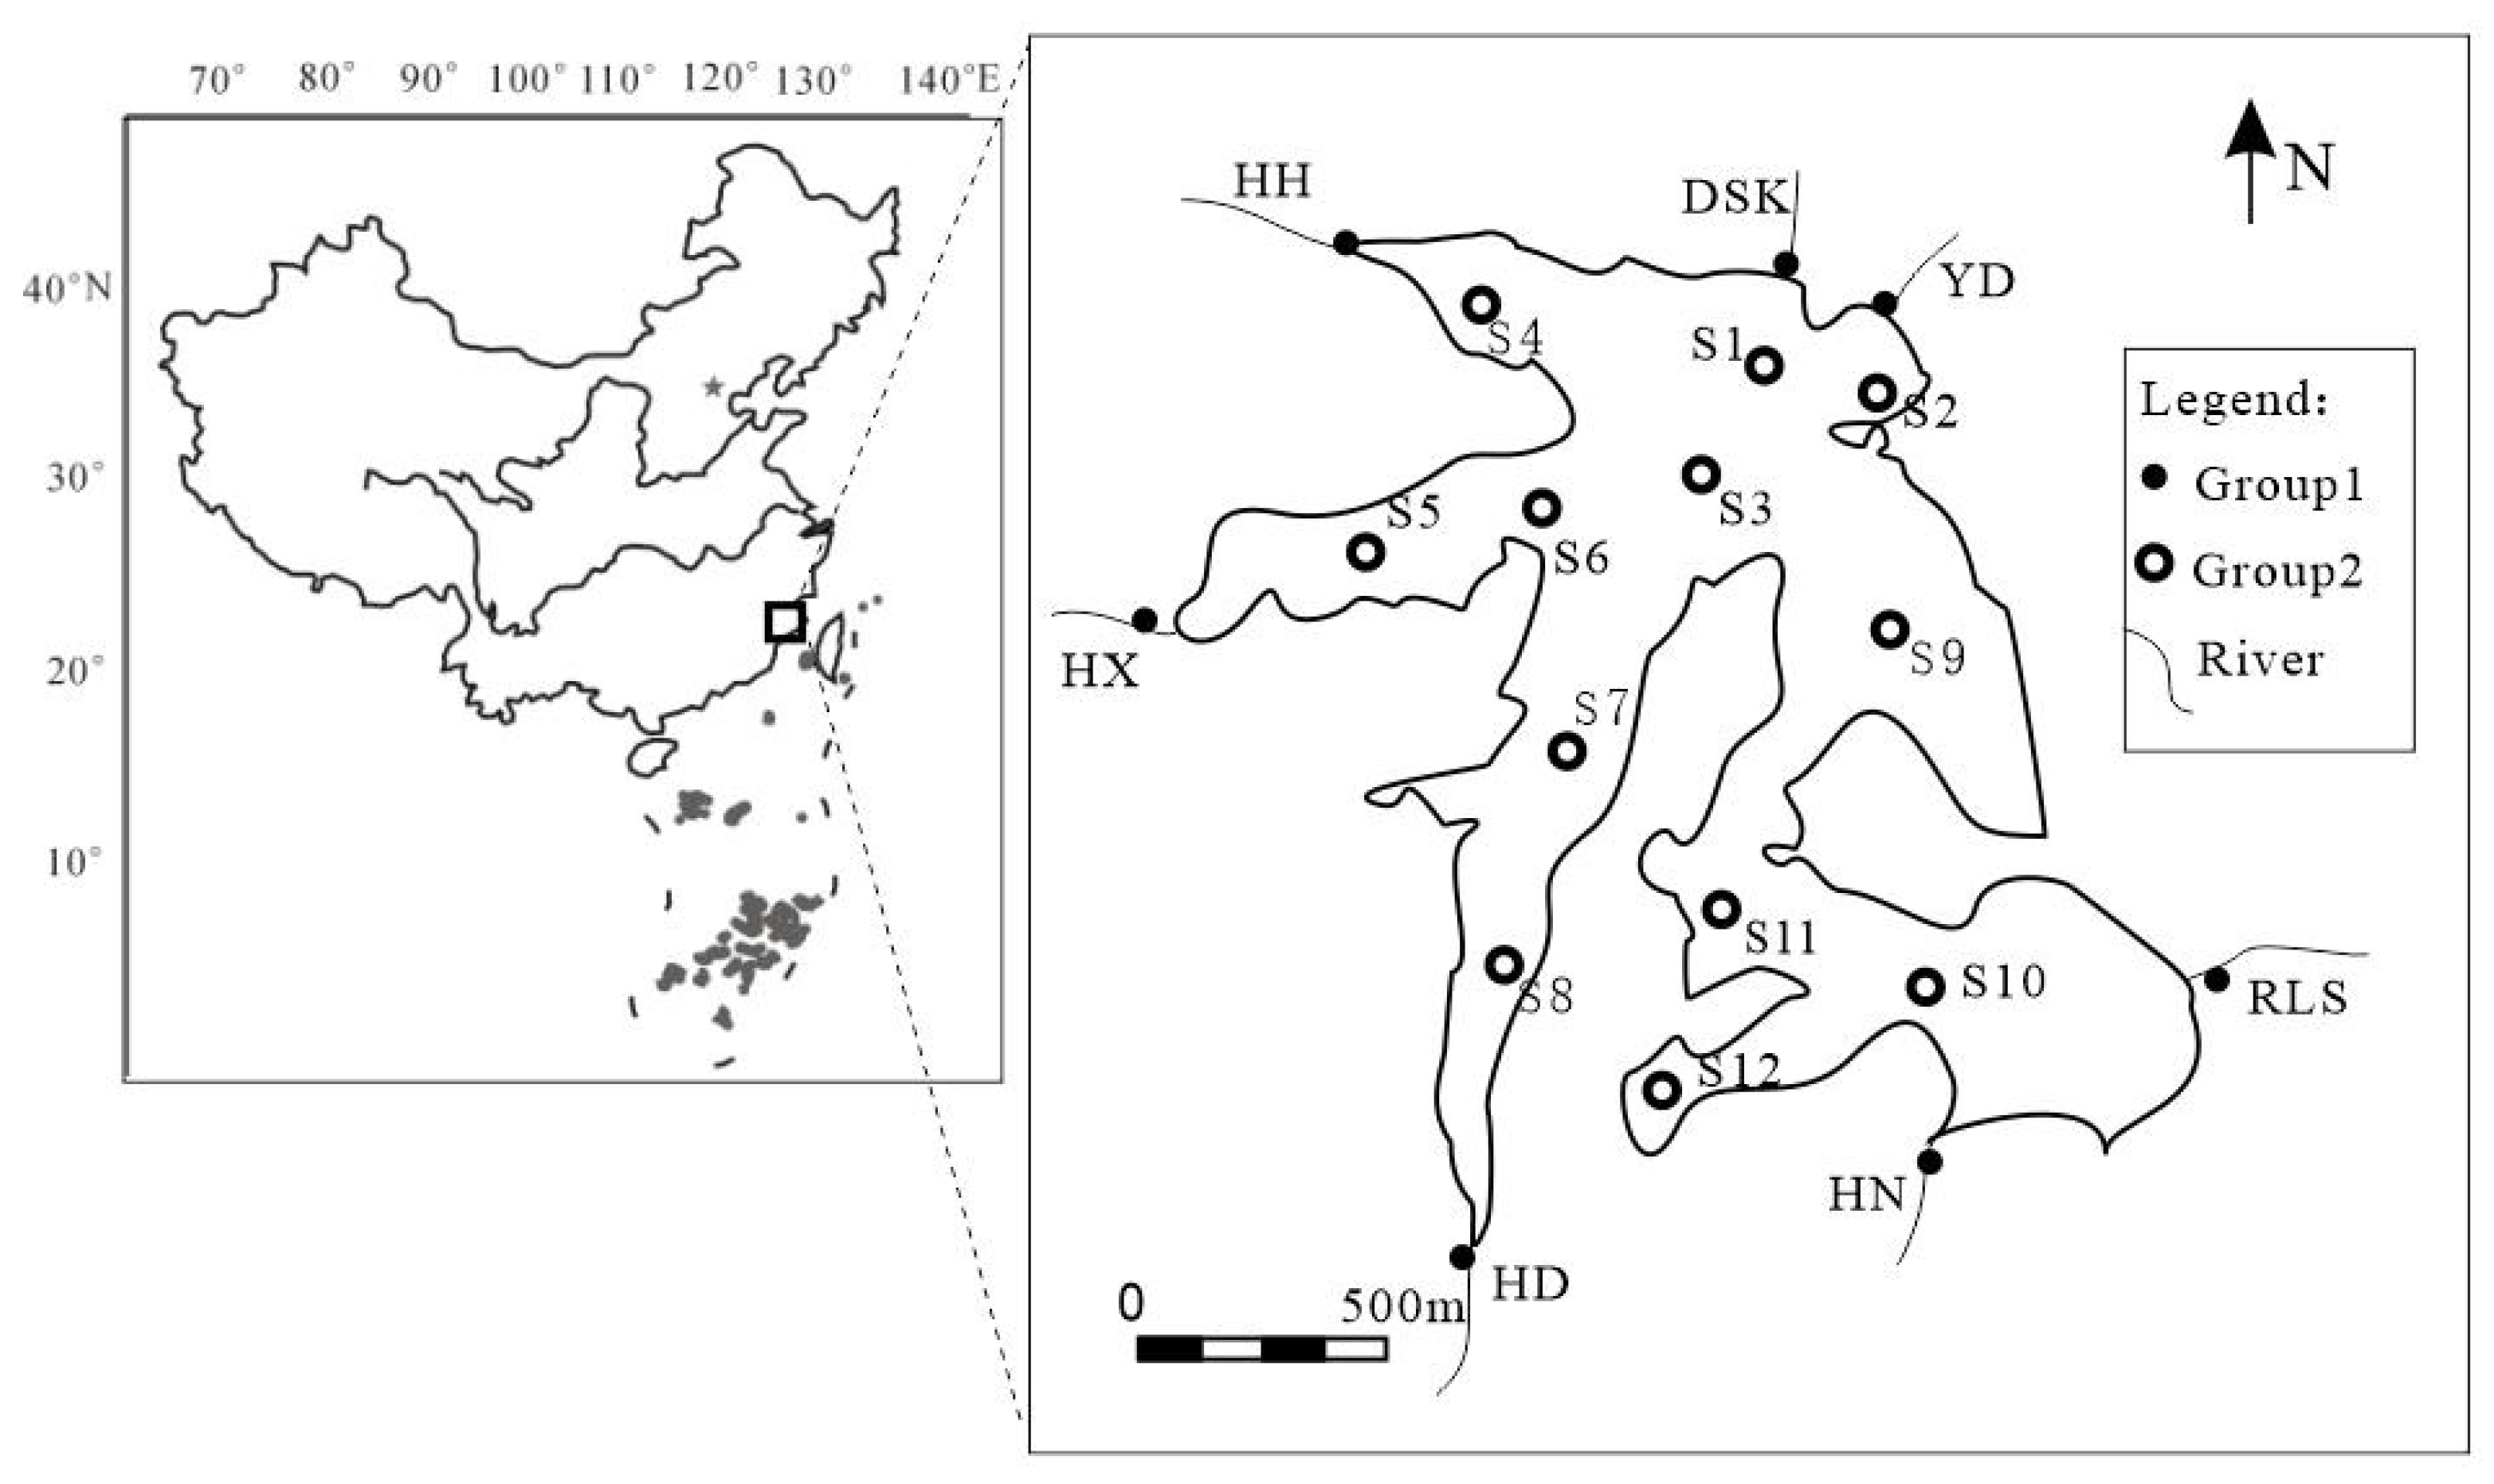
2.1. Study Site and Sampling

Sanshiliujiao Lake (25°27′ N~25°28′ N, 119° 45′ E~119°46′ E) is in the central and southern regions of Pingtan Island (Fuzhou, Fujian Province, China), which is a drought-prone area with an annual rainfall of 1200 mm, but annual evaporation of 2000 mm and significant wind velocity (average speed 4.8 m/s) (Figure 1). The size of Sanshiliujiao Lake is 2.1 km2, and the mean and maximum water depths are 2 and 5 m, respectively. The largest natural lake in this area is one of the most critical water sources for the region’s drinking water. The watershed area (13.4 km2) is mostly drought-resistant forest and drylands within the village, comprising rich and nutrient-poor granodiorite and post-granodiorite sand deposits. Inter-basin water transfer from the Min River is the primary source of flow, and five other tributaries in Honghu, Huxi, Meilou, and Hunan, and other native streams, all have a lower flow rate. Although the relevant government agencies have worked diligently in recent years to control the pollution affecting Sanshiliujiao Lake’s water supply, HABs have occurred, especially in the summer [28]. For this reason, we conjecture that the sediment’s internal nutrient loading may be contributing to the lake’s unimproved water quality.

2.2. Simulation Experiment Design on Sorption Experiments

2.2.1. Kinetic Adsorption Experiments

For the adsorption kinetics experiment, a batch method was used to obtain the sorption isotherms. Each sample was mixed with KH2PO4 at a ratio of 1 mg/L KH2PO4 and placed in a 100 mL centrifuge tube. Samples were then placed on a constant temperature thermostatic shaker with temperature control of 25 °C ± 1 °C and an oscillation speed of 200 rpm. After 5 min, 0.5 h, 1 h, 2 h, 4 h, 8 h, 12 h, and 24 h, the solutions were placed in a centrifuge with a 4000 rpm speed and centrifuged for 15 min. The supernatant was filtered and then used to determine the SRP concentration.

2.2.2. Equilibrium Adsorption Experiments

Isothermal adsorption simulation experiments were carried out using two concentration gradient ranges. The high-concentration gradients were 0, 0.5, 1.0, 2.0, 5.0, 8.0, and 15.0 mg/L, and 0, 0.01, 0.02, 0.05, 0.08, 0.10, 0.15, and 0.20 mg/L were the low-concentration gradients. The adsorption experiments were performed using a batch technique. Briefly, in an oscillator (THZ-82, Changzhou Guohua Electric Co., Ltd., Changzhou, China) under room temperature conditions, 0.5 ± 0.0002 g of the sediment sample was added to a series of 40 mL phosphate solutions. Because the solution’s initial concentration significantly affects the kinetic process [29,30] and investigated most sorption isotherms between 0 and 1.6 mg/L, the phosphorus concentration was 1 mg/L. The agitation speed was 150 rpm for samples withdrawn at time intervals. Then, the centrifuge separated the aqueous phases at 4000 rpm (Model LG10-2.4A, Beijing Physical Utilization centrifugal Factory, Beijing, China). A spectrophotometric instrument analyzed each sample’s supernatant with a UV spectrometry (UV2550 spectrophotometer, Shimadzu Corporation, Kyoto, Japan) based on the law of Lambert–Beer. The phosphorus adsorbed on sediment samples was also calculated from the difference between the initial and equilibrium phosphate concentrations. In addition, the above experiments were carried out under the same conditions in triplicate, which produced a relative error of <5%. The SRP concentration of the samples was then centrifugated at 4000 rpm for 15 min and measured. The supernatant was taken out and the resulting filtrate was sent through a 0.45 μm filtration membrane for determination.

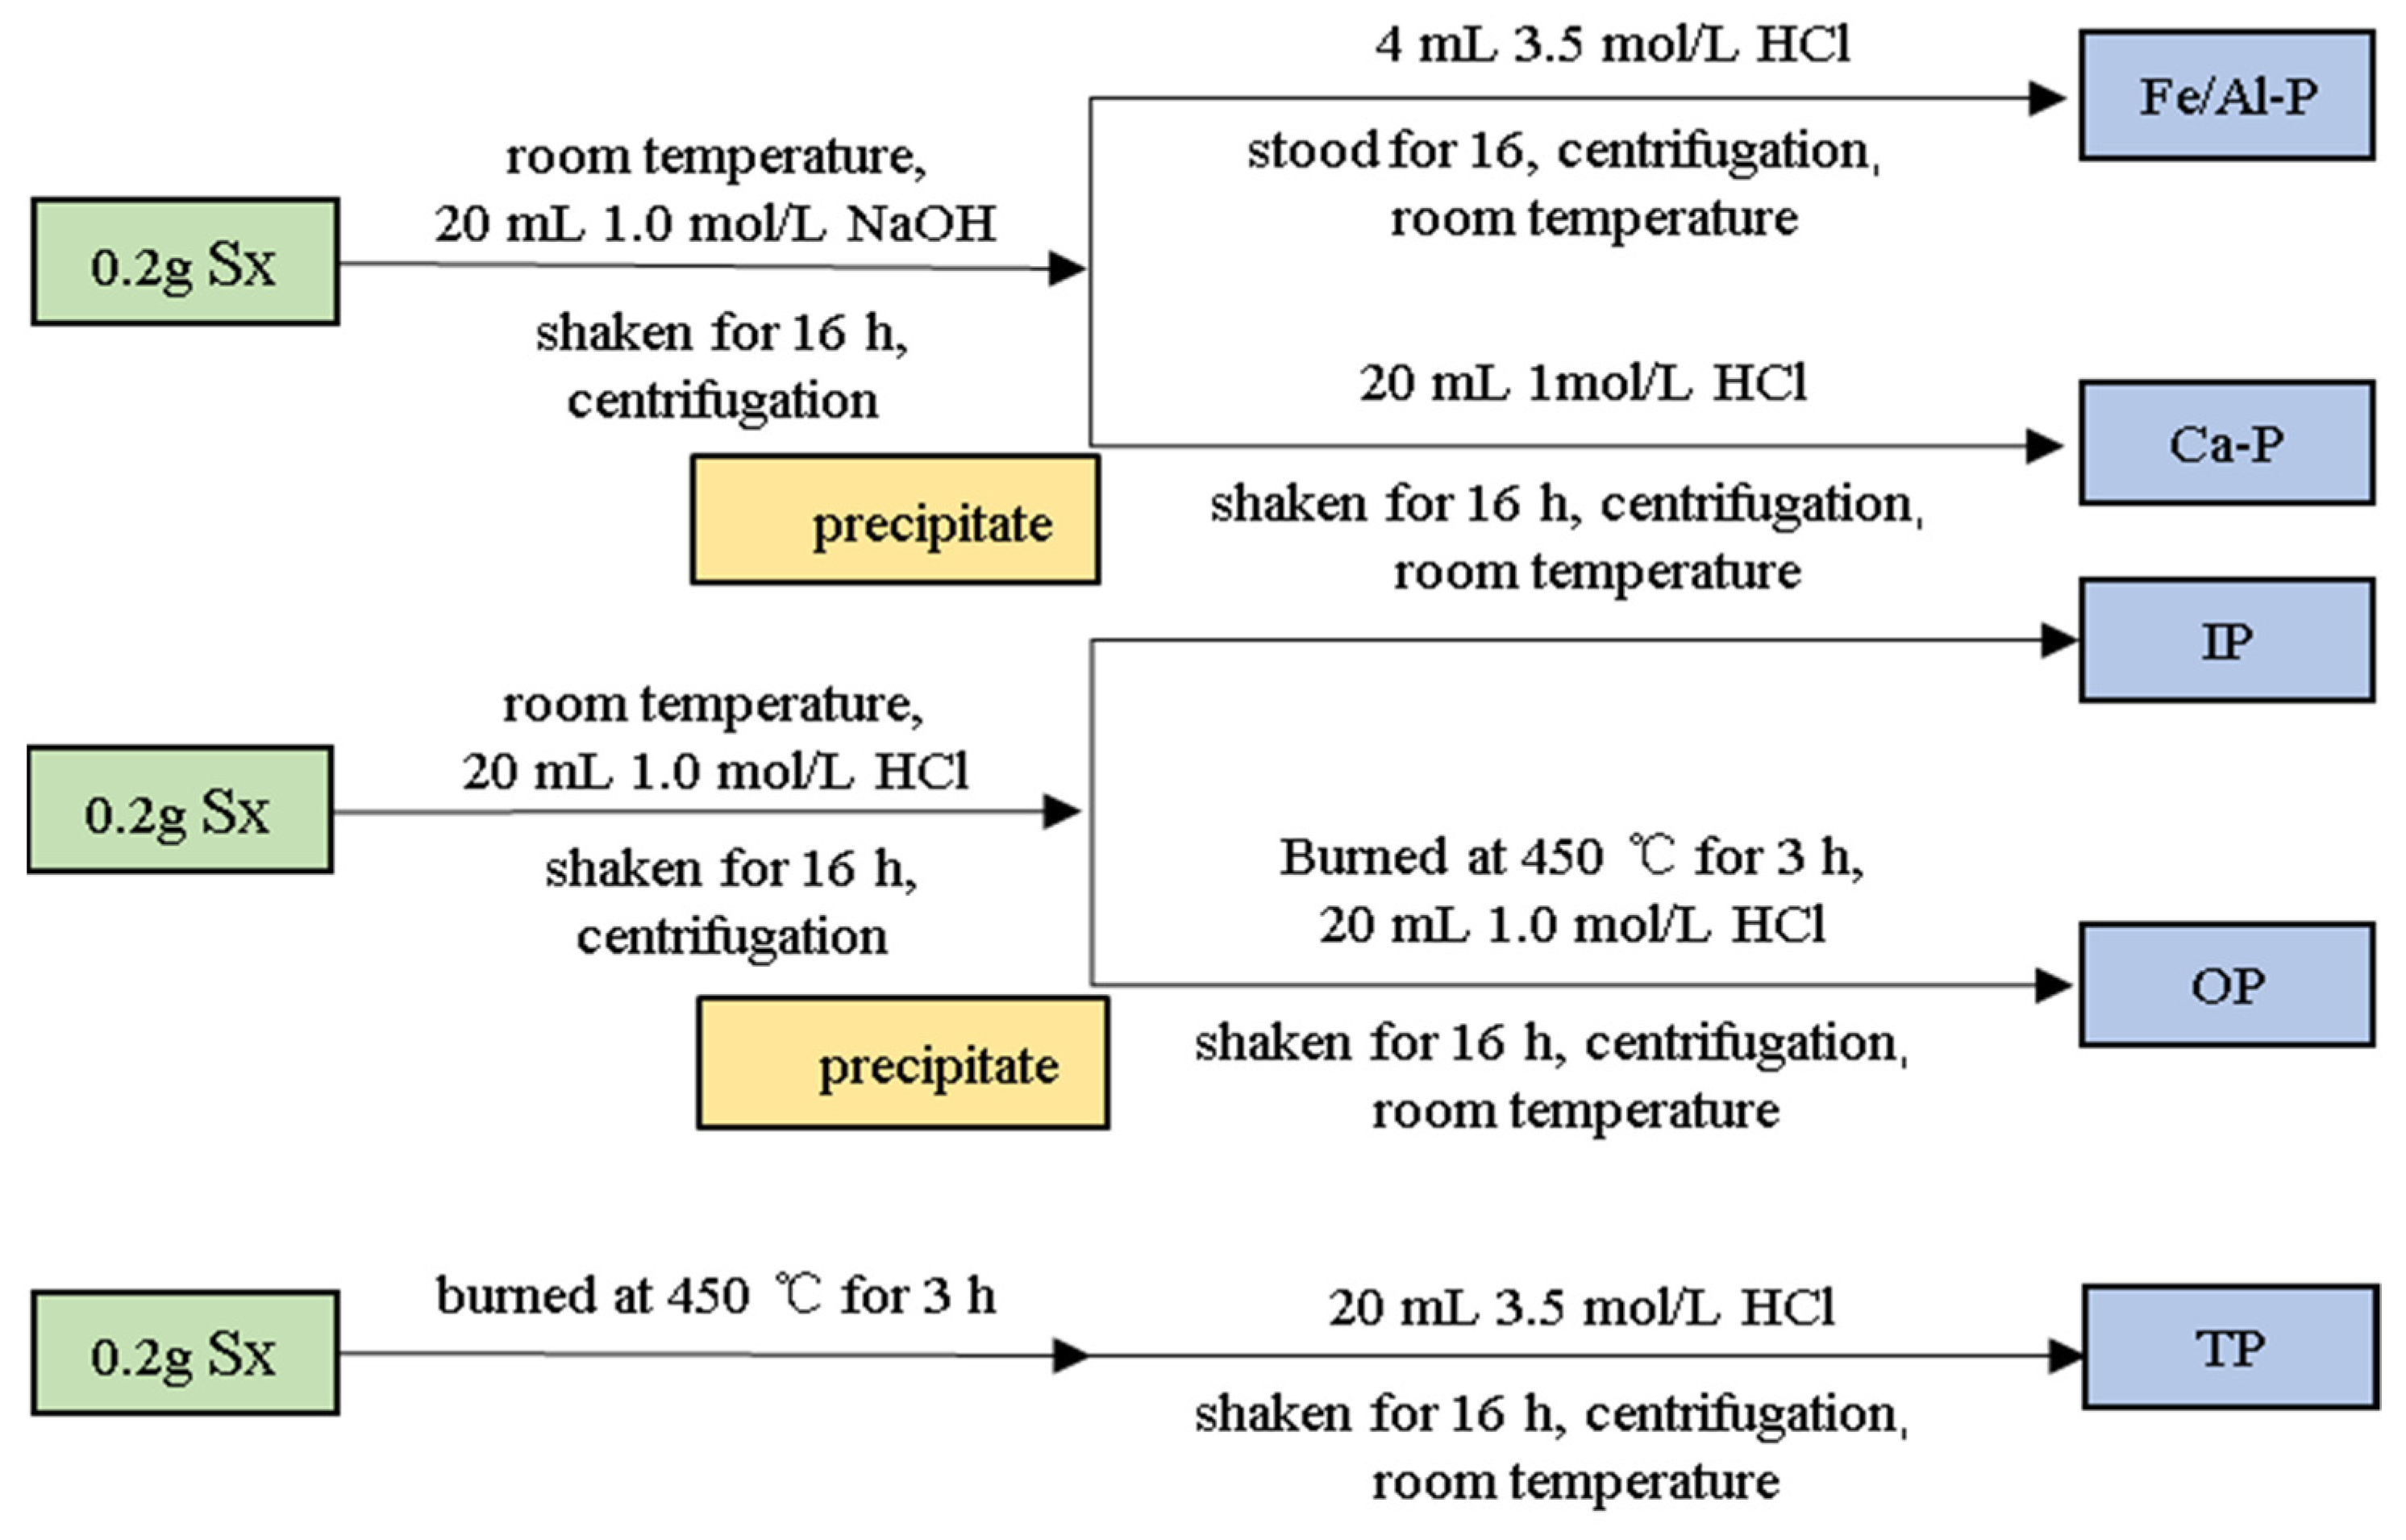
2.2.3. Analyze Different Phosphorus Phases

Standard Measurements and Testing (SMT) was used to determine the vertical summer and autumn samples in the P sediments, which were then classified into P bound to Al, Fe, and Mn oxides and hydroxides (Fe/Al-P), P associated with IP, OP, TP, and Ca-P (Figure 2). The Fe/Al-P was extracted with NaOH, whereas Ca-P was extracted with HCl. The HCl-extracted IP and its residual were treated at 450 °C to detect OP content and detected TP after the sample was treated at 450 °C and extracted with HCl [31]. The filtrate was then tested according to the ammonium molybdate spectrophotometric method (GB 11893-89). Samples and results in triplicate were analyzed using IBM SPSS 22 statistics, with relative errors at mean values lower than 5%.

2.3. Determination of Phosphorus Vertical Release Rate by Pore Water Diffusion Model

Under the influences of environmental conditions, the nutrient exchange rate and load between the sediments and the overlying water (through Fick’s first law) were acquired [32]. The TP concentration of the vertical sediment–water interface was also obtained from the collected sample calculated using the pore water diffusion method.
F = Φ D s 0 x d C d x
where F is the diffusion flux across sediment–water interface; Φ indicates the porosity of the surface sediments; d c d x represents the concentration gradient of the overlying water and pore water (10−3 mg/cm4); and Ds represents the significant molecular diffusion coefficient (cm2/s). When taking into consideration the bending effect of sediment, the measurement of sediment curvature is quite difficult [33]. The empirical relationship between the real diffusion coefficient (Ds) and porosity (Φ) is given as:
D S = D 0 ,   i f   < 0.7 ;   D S = 2 D 0 ,   i f   > 0.7
where D0 is the ideal diffusion coefficient of nutrients in infinite dilution solution,   D 0 ( HPO 4 2 ) = 7.0 × 10 6 cm 2 s 1 .
After filtration, the standard curve method revealed the concentration of DIP in the sediment–water interface. The molybdenum blue spectrophotometric method [34] determined the soluble reactive P (SRP).

2.4. Phosphorus Accumulating Organisms (PAOs) in the Sediments

2.4.1. DNA Extraction and Purification of Sediment

Using the Power Soil DNA Isolation Kit (MO BIO Laboratories, Inc., Carlsbad, CA, USA), total DNA extraction and sediment sample purification was performed. Spectrophotometry was used to estimate the concentration and purity of the extracted DNA (NanoDrop, Wilmington, DE, USA). The obtained DNA samples were stored at −80 °C for use before molecular biological analysis.

2.4.2. Amplification, Recovery, and Enzymatic Digestion of PPK1 Gene in Phosphorus Accumulating Organisms

The phosphorous accumulating organisms amplified the polyphosphate kinase PPK1 gene with the reported universal primers of PPK1. The former primer was 5′-AAYYTIGAYGARTTYTTYATGGT-and the reverse primer was 5′-TTIKYITSYTCRTCRAAICKIGC-3′. The PCR reaction system (25 μL) contained 10×PCR buffer 2.5 μL, dNTP 2μL; Former primer (10 μm) 1μL, Reverse primer (10 μm) 1 μL, Taq DNA polymerase (5 U/μL) 0.5 μL, template DNA (15–20 ng/μL) 1 μL, distilled water at 25 μL. The amplification reaction was conducted at 94 °C for 2 min, 35 cycles at 94 °C for 30 s, 55 °C for 45 s, and 72 °C for 2 min, with a final extension at 72 °C for 10 min. The amplified PPK1 gene fragment was recovered with the gel recovery kit, and the restriction enzyme Taq I was used for the restriction enzyme digestion of the PPK1 gene. The enzyme digestion system (20 μL) contained the recovery product at 2.5 μL, Buffer 5 μL, Taq I (5 U/μL) 0.5 μL, distilled water 11.5 μL. Enzyme digestion was performed at 37 °C for 16 h using a water bath.

2.4.3. T-RFLP Detection and Pattern Analysis

A 3730XL sequencer detected the PCR products after analyzing each sample’s T-RFLP pattern with Peak Scanner software, and also removed the primer peaks and restriction fragments. Among these, the Terminal Restriction fragment (T-RF) less than 23 bp was the peak of the primer, and the relative peak area (the peak area of each restriction fragment divided by the accumulated peak area) less than 0.5% was the peak of the primer. The relative peak area (Ap) was calculated of a single T-RF according to the formula Ap = ni/N × 100, where ni represents the peak area of each distinguishable T-RF, and N represents the sum of all T-RF peak areas. This study excluded fragments <35 bp and >600 bp, and peaks of fluorescence intensity more significant than 30 RFU (Relative RF) were selected, and each T-RF in the graph was treated as an Operational Taxonomic Unit (OTU), suggesting that every T-RF detected represented at least one kind of phosphorus accumulating organism.

2.4.4. Construction of Clone Libraries and Sequencing

According to the manufacturer instructions, the constructed PPK1 clone libraries of all samples’ purified PCR products using the pMD-18T Vector Systems and E. coli DH5a were transformed as competent host cells (Takara, Kusatsu, Japan). Approximately 100 white colonies from each library were selected. PCR amplification screened each clone with primers RVM and M13-47 to select positive clones. The enzymatic digestion of PCR products was conducted with Afa I and Msp I (Takara, Beijing, China). The enzyme digestion system (10 μL) contained PCR product 4 μL; 10 × M Buffer 1 μL; the restriction enzyme Afa I and Msp I in 0.5 μL each; and the sterilized ddH2O was added up to10μL the enzymatic digestion for 3 h at 37 °C. Gel electrophoresis separated the restricted fragments 3% agarose with ethidium bromide, which were observed under UV illumination. The RFLP band types’ fingerprint images were analyzed using Quantity One (BioeRad, Hercules, CA, USA). Clones sharing the same restriction fragment length polymorphism (RFLP) pattern concerning the position and number of bands were regarded as belonging to the same OTU. One clone from each OTU was selected for DNA sequencing.

2.4.5. Sequence Analysis of Functional Genes and Phylogenetic Tree Construction

The PPK1 gene sequences obtained by sequencing were compared with the known sequences in the GenBank database by BLAST to identify the species closest to the clone sequences. Phylogenetic analysis was performed using MEGA version 4.0, and the neighbor-joining tree was constructed using a Poisson correction model with a bootstrap value of 1000.

2.5. Statistical Analysis

One-way analysis of variance (ANOVA) is a series of arithmetic average values used to examine the significance of differences among samples. In this study, ANOVA was performed using SPSS 24 (IBM SPSS Statistics, Armonk, NY, USA). Average values ± SD (standard deviation) are represented as lowercase letters, such as a, b, c, and d, and signify the differences between factors. When the same letters are displayed, the difference among samples is not significant, but significant differences between two wetland types at the 0.05 level are evident when different letters are displayed. The data graph was generated using Origin 9.1 software (OriginLab, Northampton, MA, USA). The Pearson correlation coefficient analyzes the correlation between the two variables. Measurable significance was observed at the levels of p < 0.05 and p < 0.01.

3. Results

3.1. Characteristics of the P in Sediments

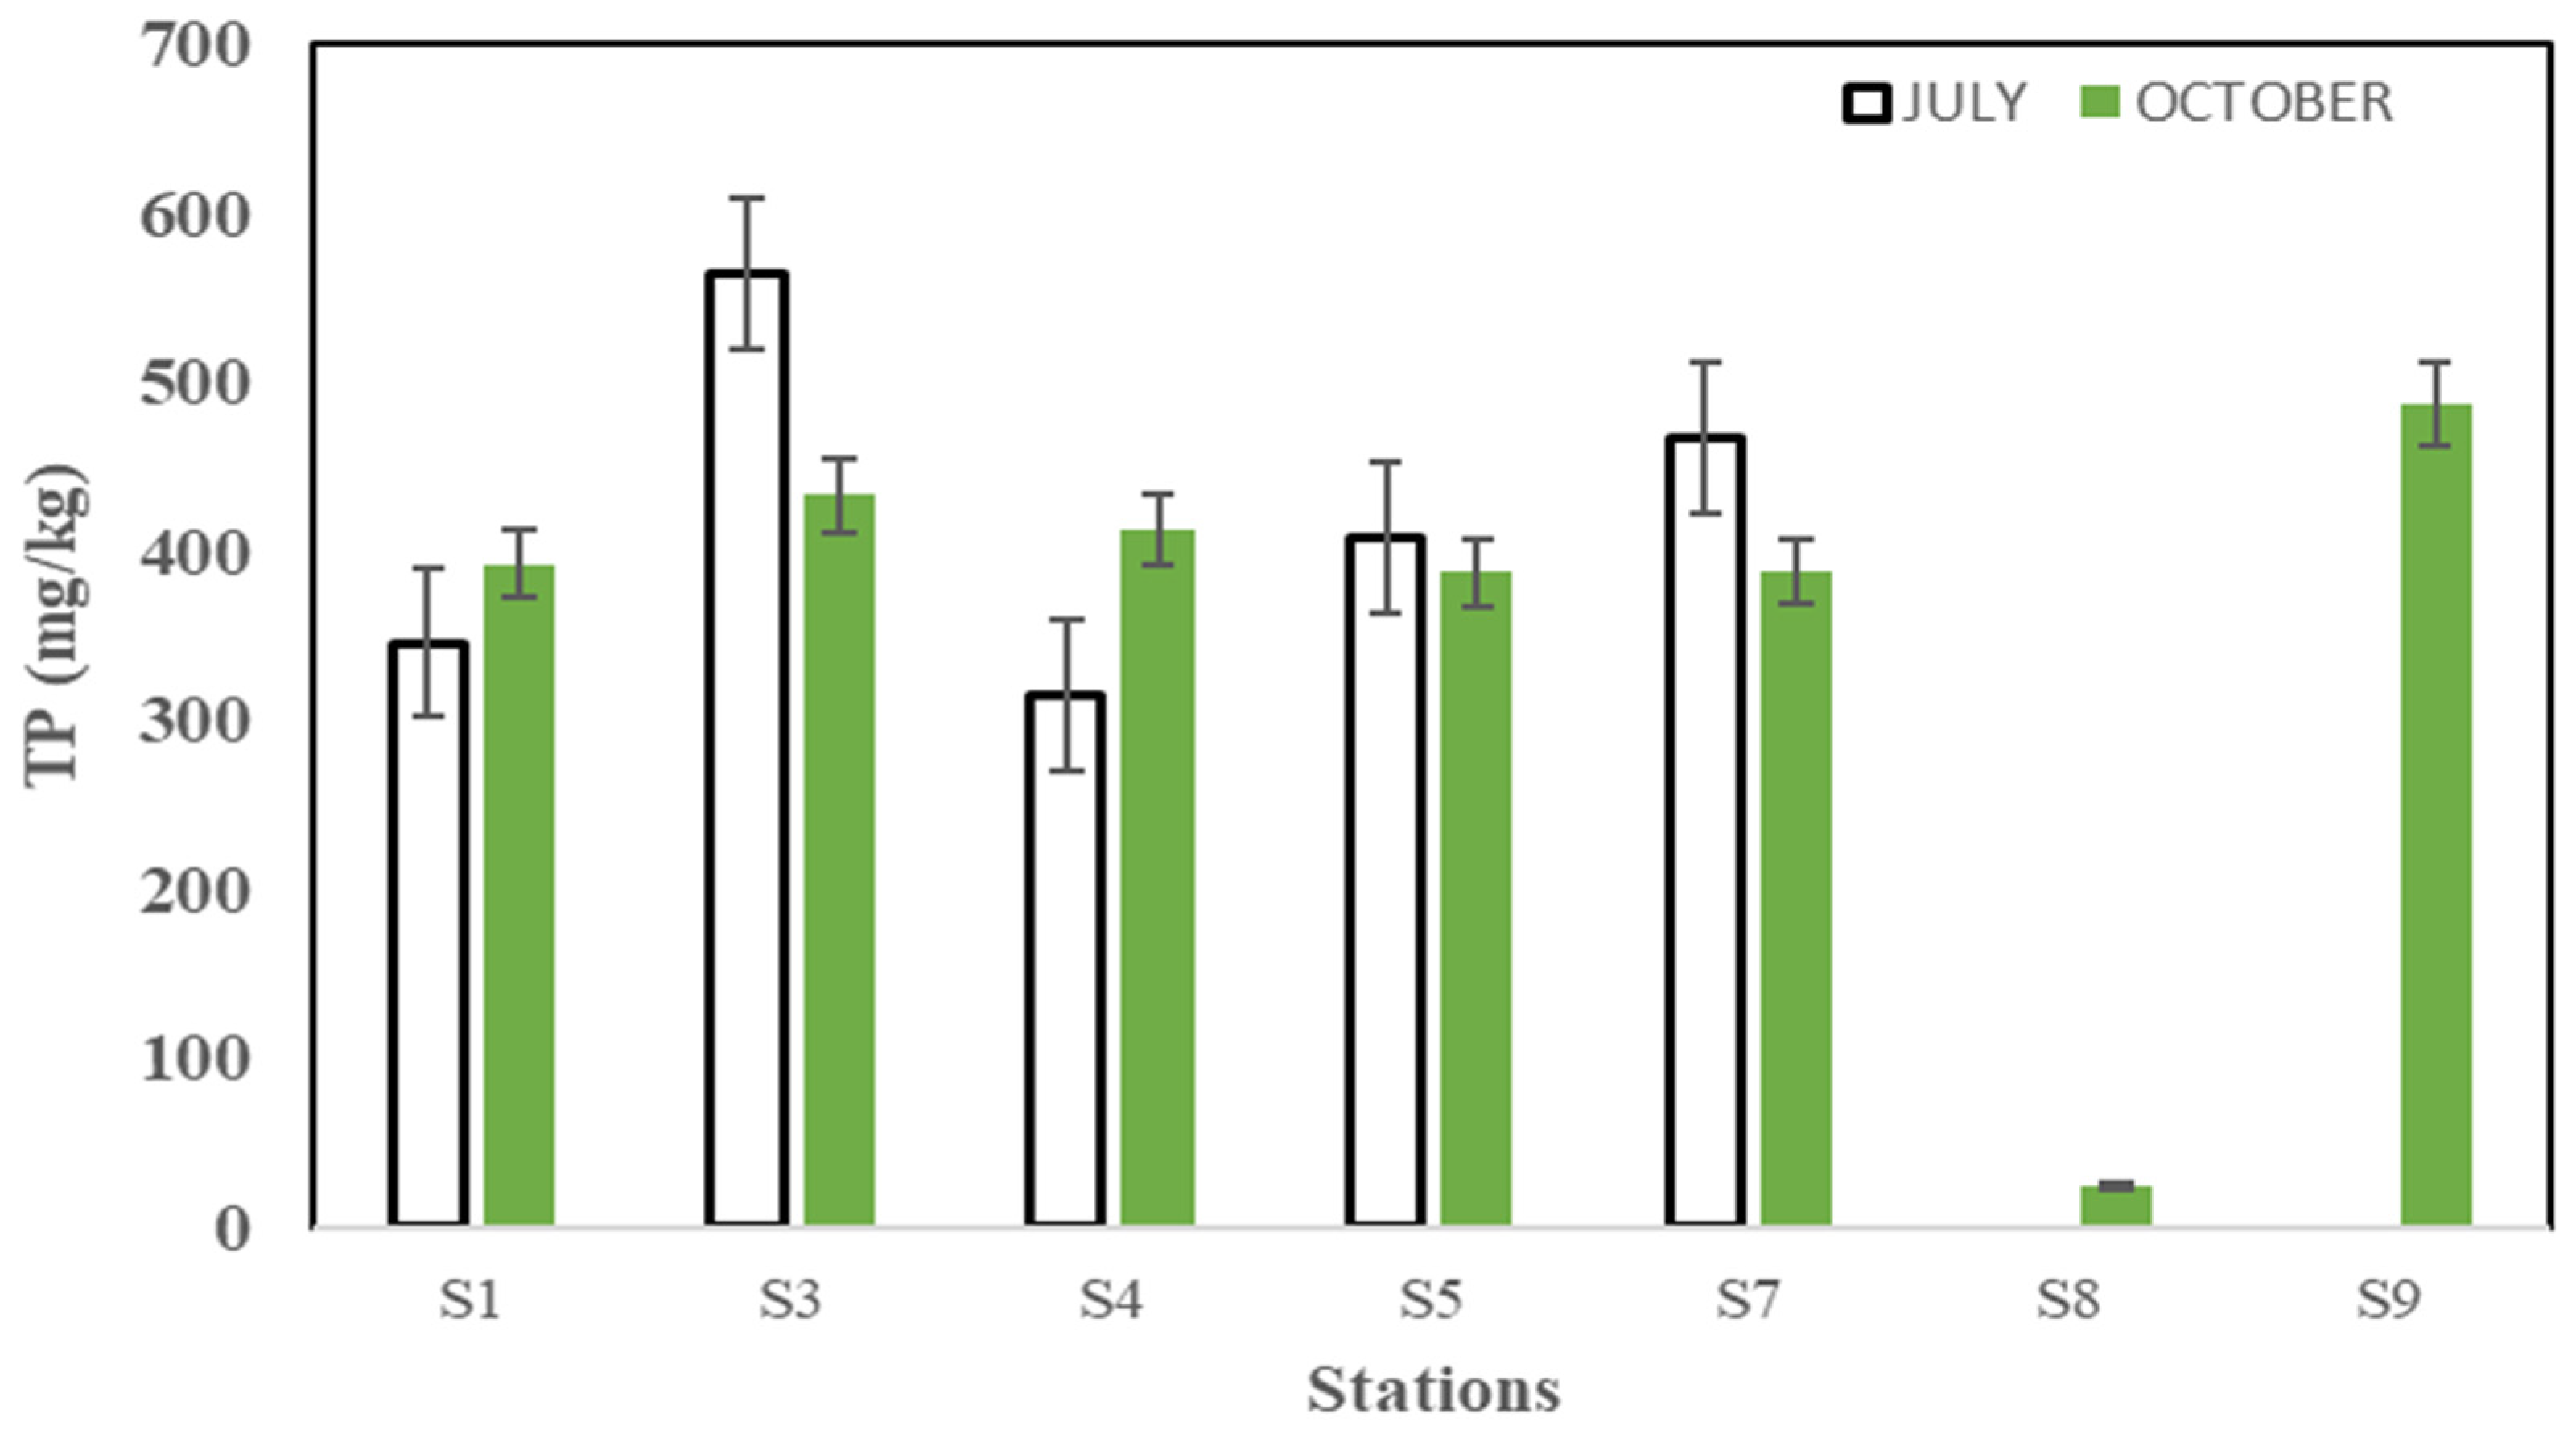
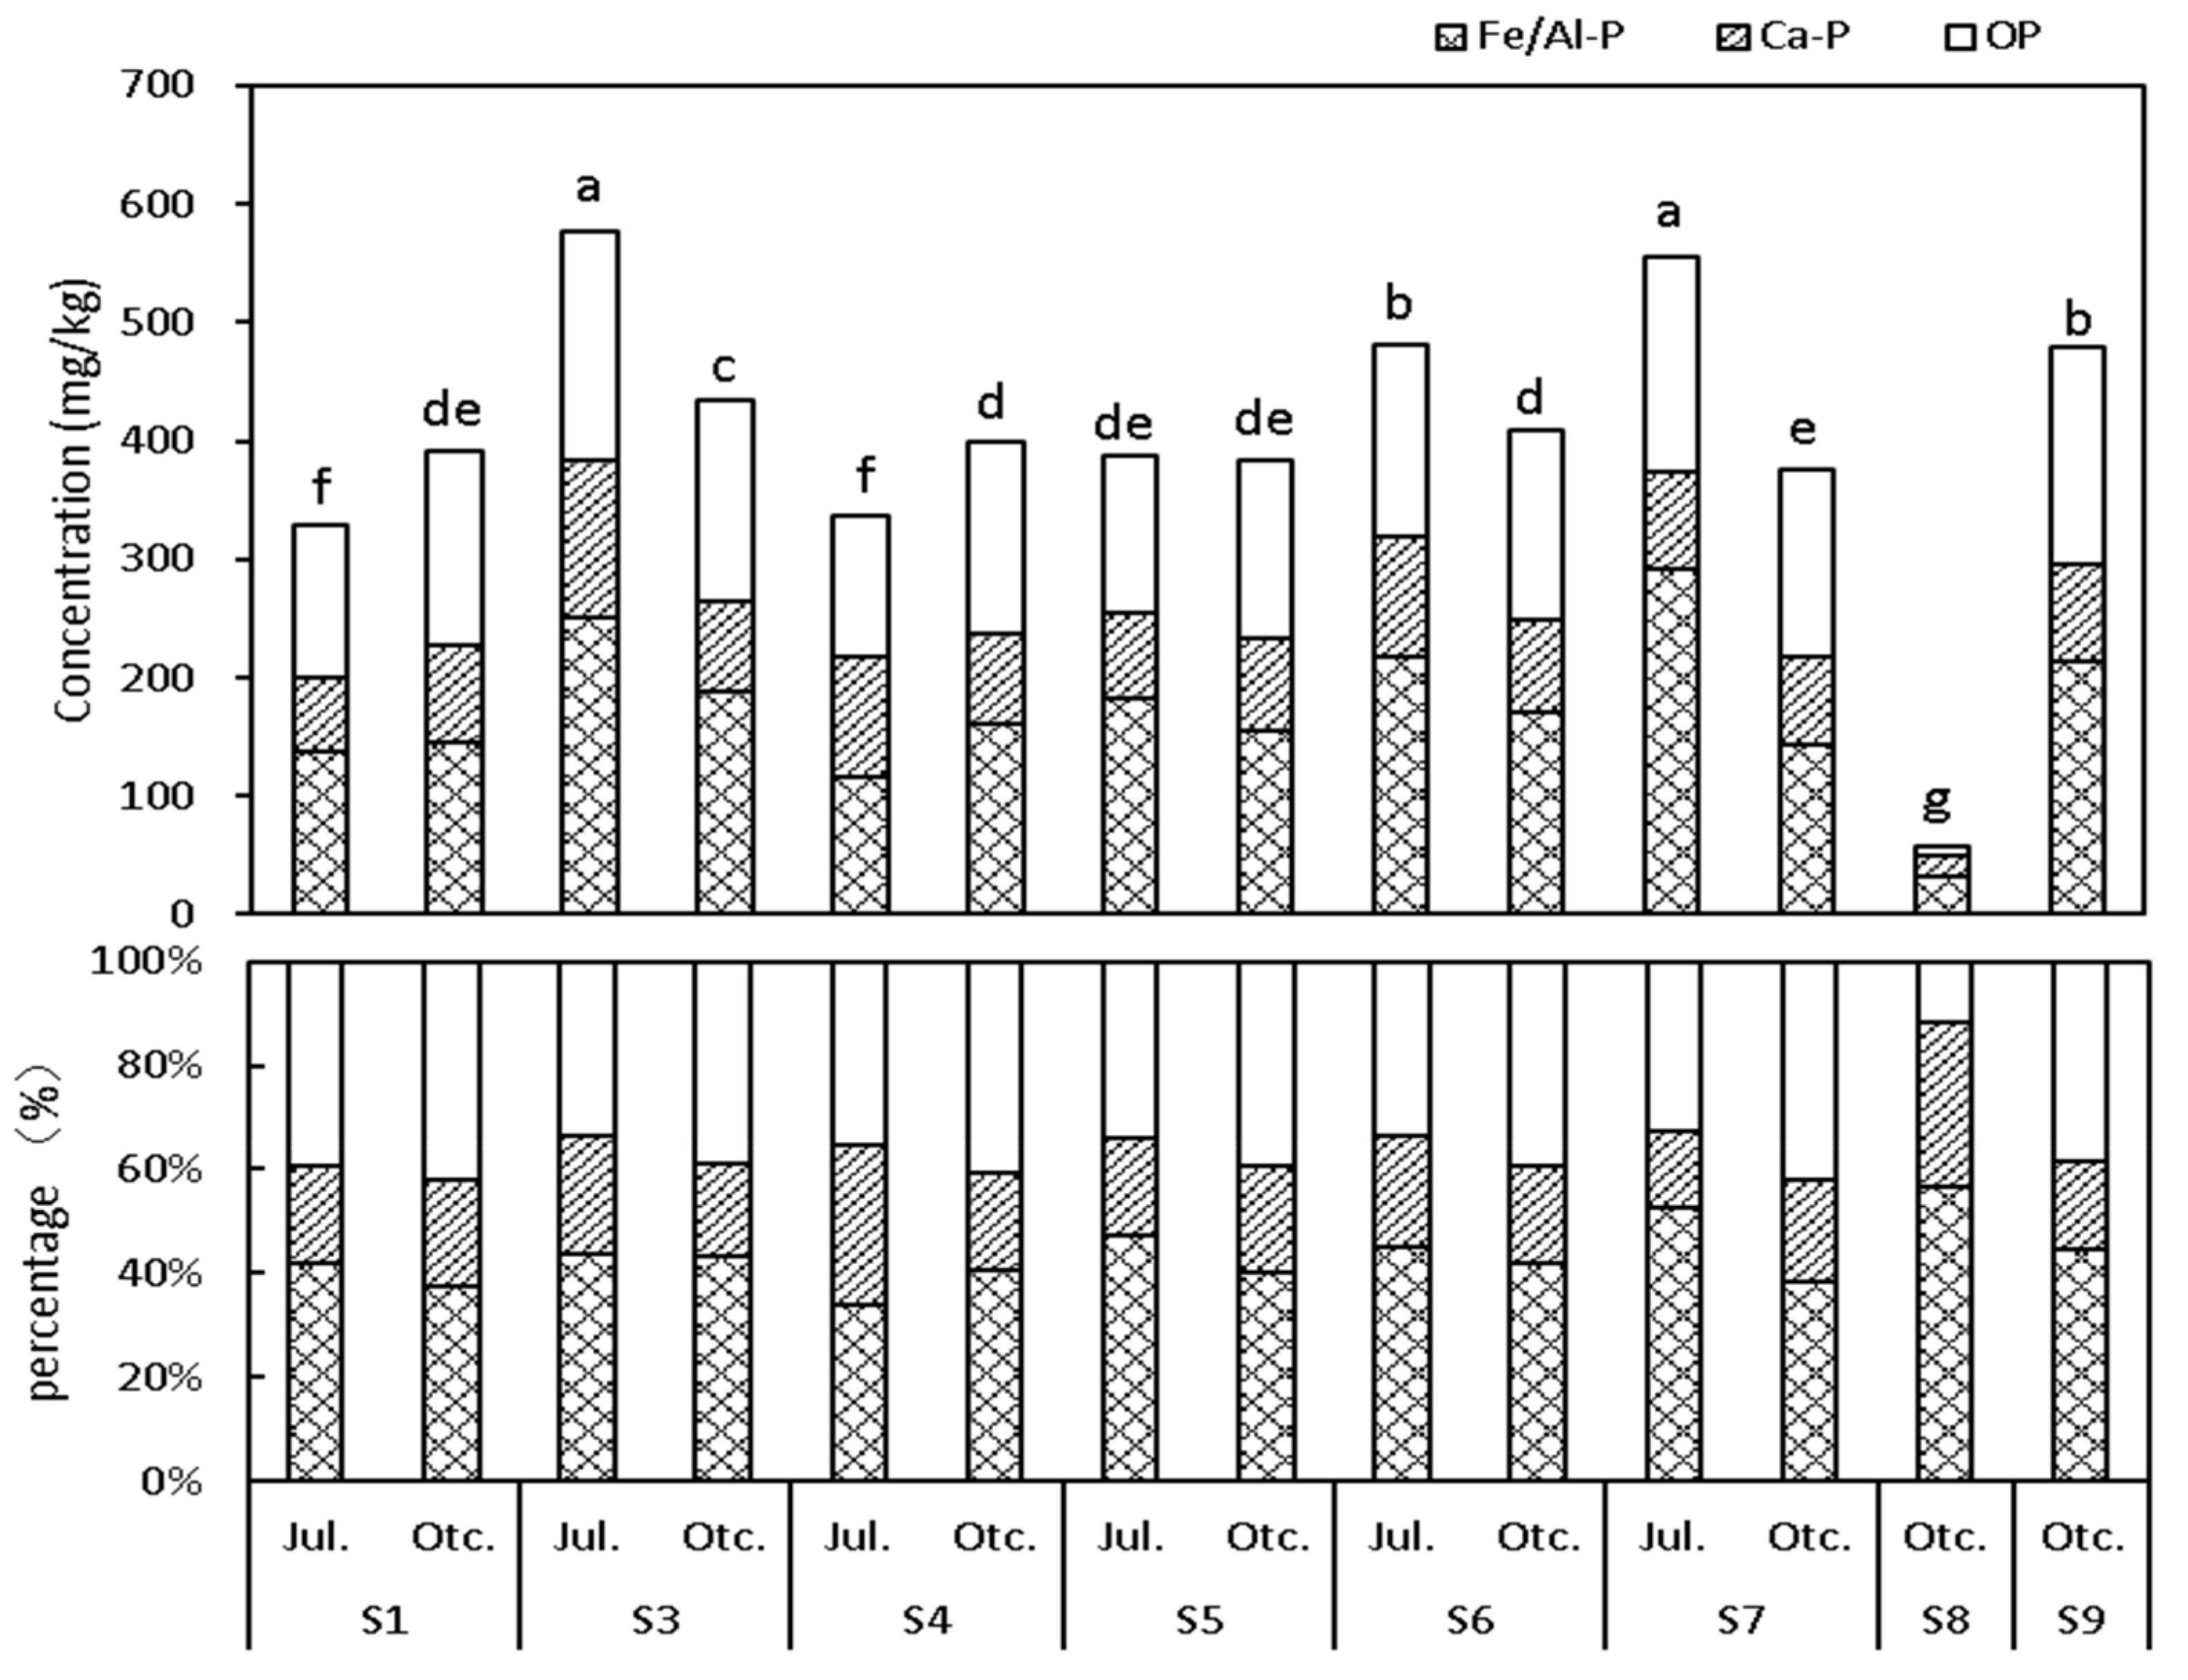
3.1.1. Spatial and Temporal Distribution of the P in the Surface Sediments

Figure 3 shows the TP content of the surface sediments at each point in July and October. Lab analyses were repeated three times, after which time the final data points were averaged. The results showed that the TP content in the surface sediments S1–S9 was 24.4 ± 1.2~563.9 ± 38.2 mg/kg. The average TP content in the study area was 498.7 ± 92.2 mg/kg, followed by S9 (487.8 mg/kg). However, the S8 content was only 24.4 mg/kg. The TP contents of the surface sediments in July (S1–S7) and October (S1–S7 and S1–S9) were 420.4 mg/kg (314.8 to 563.9), 38.7.2 mg/kg (387.5 to 433.6), and 361.2 mg/kg (24.4 to 487.8). Compared with July, the surface sediments’ average surface area (excluding S8, S9) decreased by 4.1% in October. In this study, the sediments’ TP contents at points S3, S5, and S7 decreased by 23.1%, 5.2%, and 16.9%, respectively. The S1 and S4 contents increased correspondingly by 13.5% and 31.3% (Figure 3). The sediments’ TP contents most likely increased from the contributions of rivers to the lake and the water transfer process, which generated the two sources of pollution for the lake and were therefore presumed to be massive pollution sources.

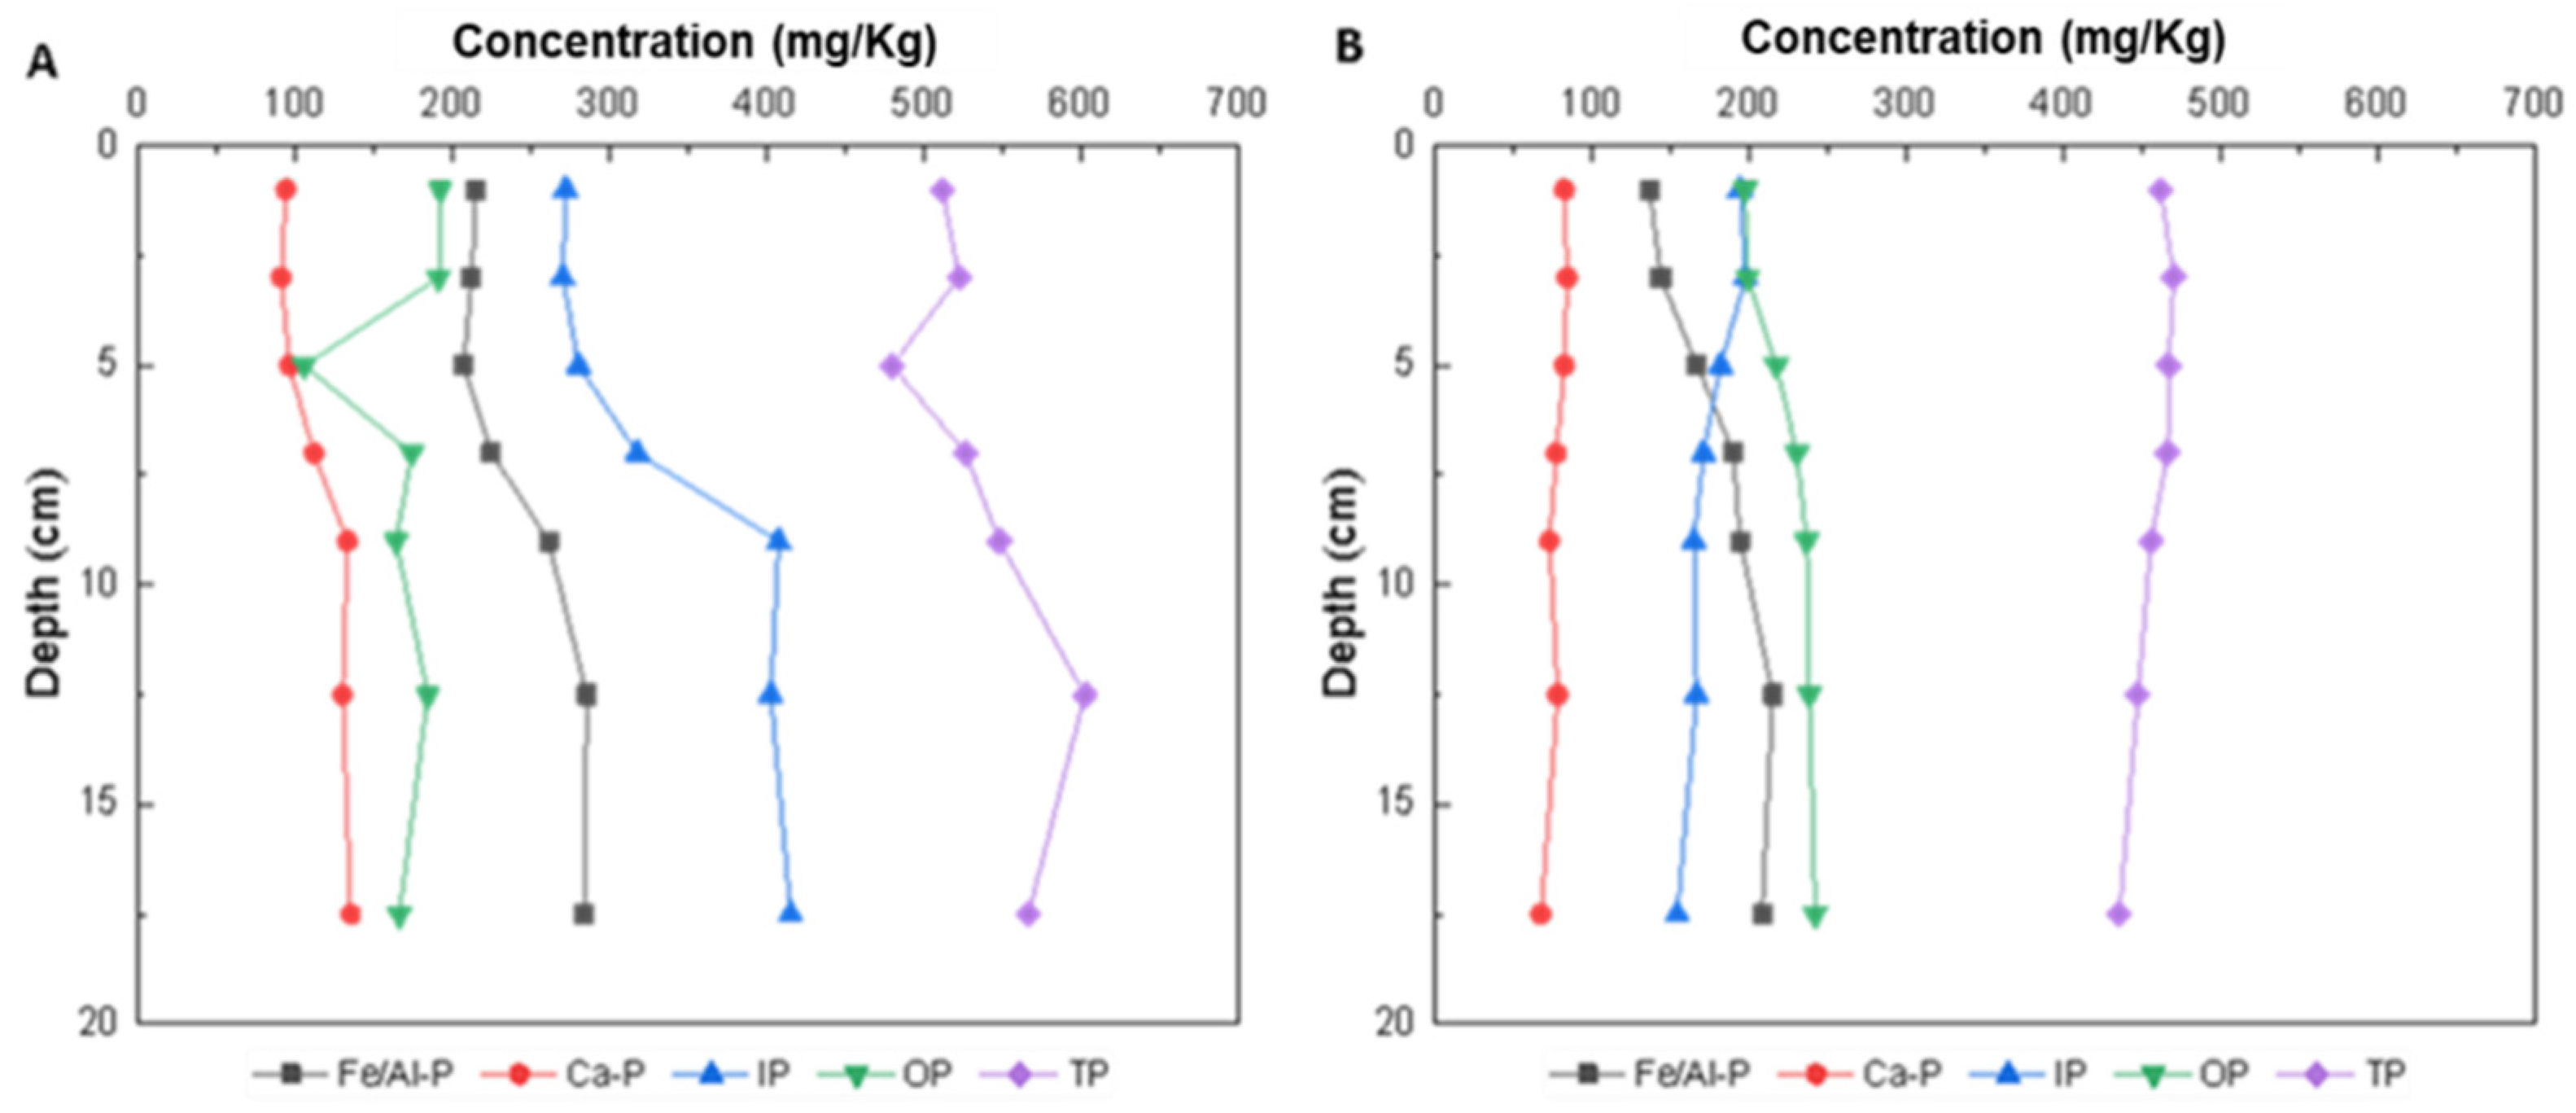
3.1.2. Distribution of the P Content in the Vertical Surface Sediments

The data shows the vertical TP and P fraction concentrations in the sediments’ profile during summer and autumn (Figure 4). The concentration of TP in the vertical range was 436.2 ± 21.3 to 602.9 ± 31.4 mg/kg. The OP concentration decreased when depth increased, which appears to be related to gradual mineralization and decomposition after sedimentation occurs.

3.1.3. Characteristics of P in the Surface Sediments

The P concentrations from July and October in Figure 5 indicate that the surface sediments in the Sanshiliujiao Lake area mainly contained IP, accounting for 62.2% of the TP concentration. In comparison, OP accounted for 37.8% of the TP. IP was mainly Fe/Al-P, which accounted for approximately 41.4% of the TP, whereas Ca-P accounted for approximately 20.8% of the TP. In July and October (excluding S8), approximately 52.1% (45.8~60.5%) and 49.2% (46.2~51.7%) of the TP was IP. In October, the percentage of OP was significantly higher than in July (p < 0.05, n = 5) by approximately 39.6% (37.6~42.0%) in October and 36.2% (32.4~38.6%) in July. These percentages appear to correspond with the OP concentration from human activities. In July and October, Fe/Al-P accounted for approximately 45.5% (36.6~62.2%) and 40.0% (36.9~43.7%) of the IP, and Ca-P accounted for approximately 21.9% (17.7~32.5%) and 18.7% (16.8~20.5%) of the IP. Overall, both the Fe/Al-P and Ca-P concentrations decreased in October (Supplementary Material Table S1).

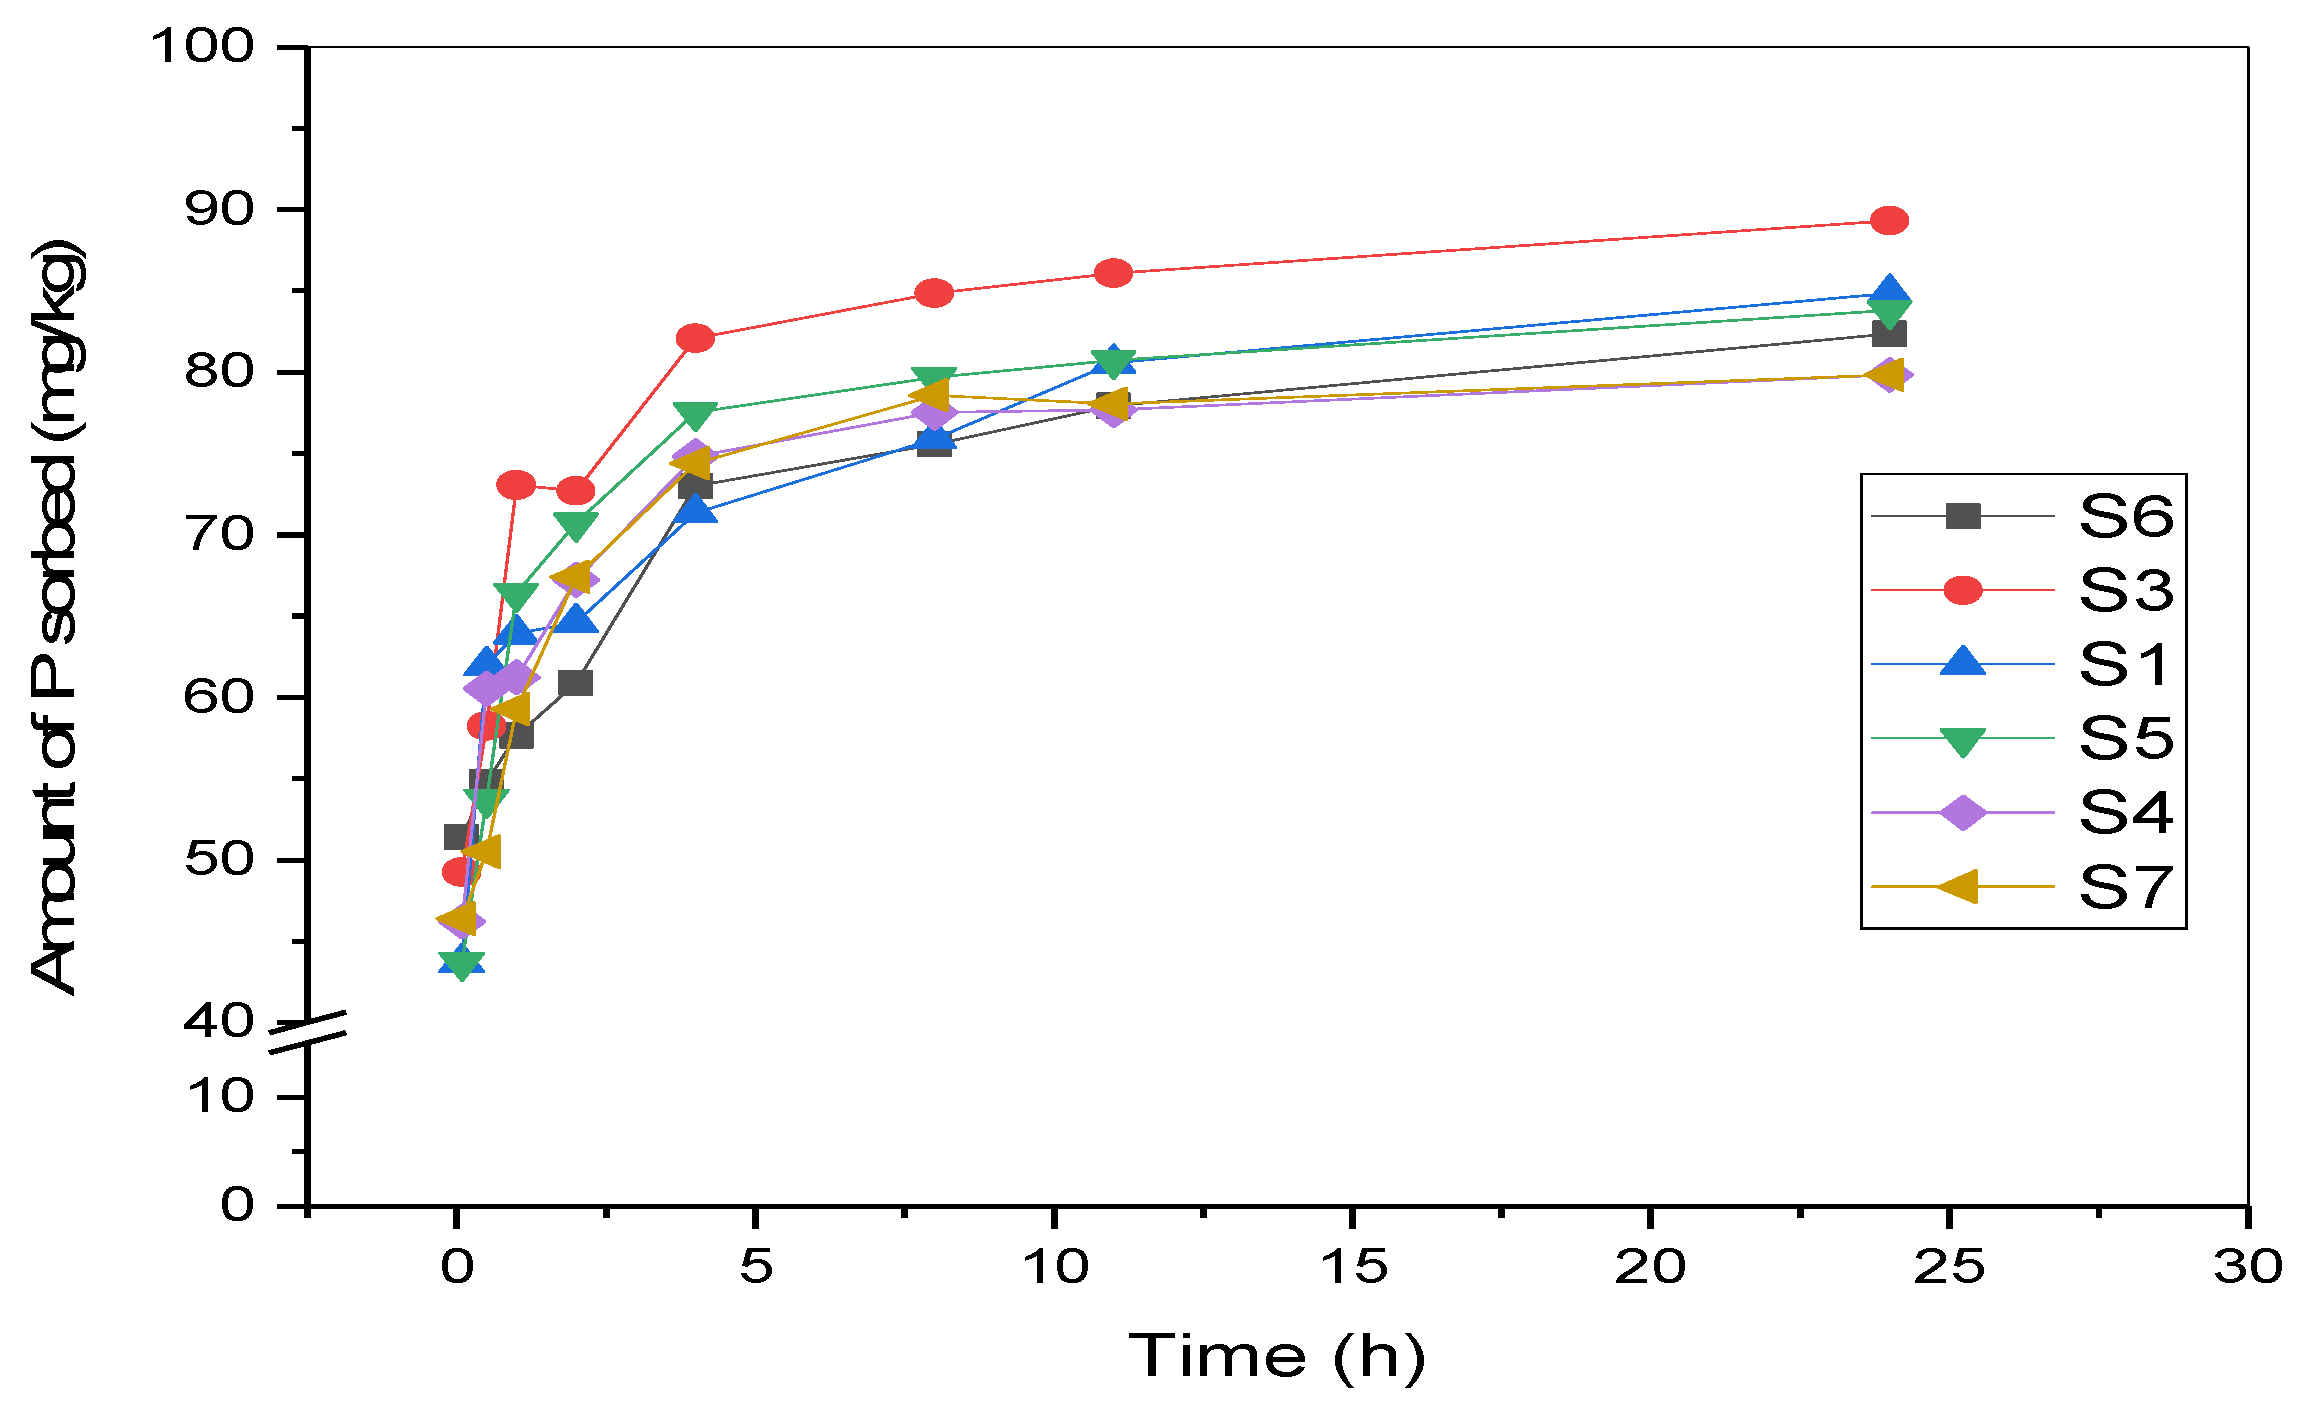
3.2. P Adsorption Kinetics of Surface Sediments

The following kinetics models were used to clarify the adsorption type of P by deposits [35]:
First - order   reaction   kinetic   model :   ln   q = B   +   k     t
Parabolic   diffusion   model :   q = a + k t
Modified   Elovich   model :   q   =   a   +   b     ln   t
Double - constant   rate   model : ln   q = a   +   b     ln   t
In these equations, t is the time (h); q is the P adsorption capacity in t hours (mg/kg); and a, b, k, and B are constants.
P’s adsorption on the solid medium was characterized by a rapid adsorption stage, followed by a slow phase. P’s adsorption kinetics by sediments, based on the different models listed above, can be found in Table 1. The modified Elovich model (R2 = 0.90~0.97, mean 0.94) and the double-constant rate model (R2 = 0.92~0.95, mean 0.93) resulted in better fits, with a significance level of p < 0.01 (R2 = 0.68~0.88). The first-order reaction kinetics model, conversely, did not result in a good fit (R2 = 0.33~0.62) (p < 0.01). The modified Elovich model resulted in the best fit (p < 0.01) (Supplementary Material Figure S1). On the whole, the first-order reaction kinetics model, the parabolic diffusion model, the modified Elovich model, and the double-constant velocity model were generally more useful in describing the P adsorption kinetics of the surface sediments.
The six study sites in the Sanshiliujiao Lake area manifested similar adsorption processes. The adsorption rates at all six sites were between 284.91 and 351.47 (mg/kg/h) based on the adsorption rate during the first two hours of adsorption. The adsorption rate reached its highest level in the earliest two hour period. The maximum amount of adsorption at each site decreased as follows: S3 > S1 > S5 > S6 > S4 > S7 and the average adsorption rate was only 2.39 ± 0.1 mg/kg/h. (Figure 6).

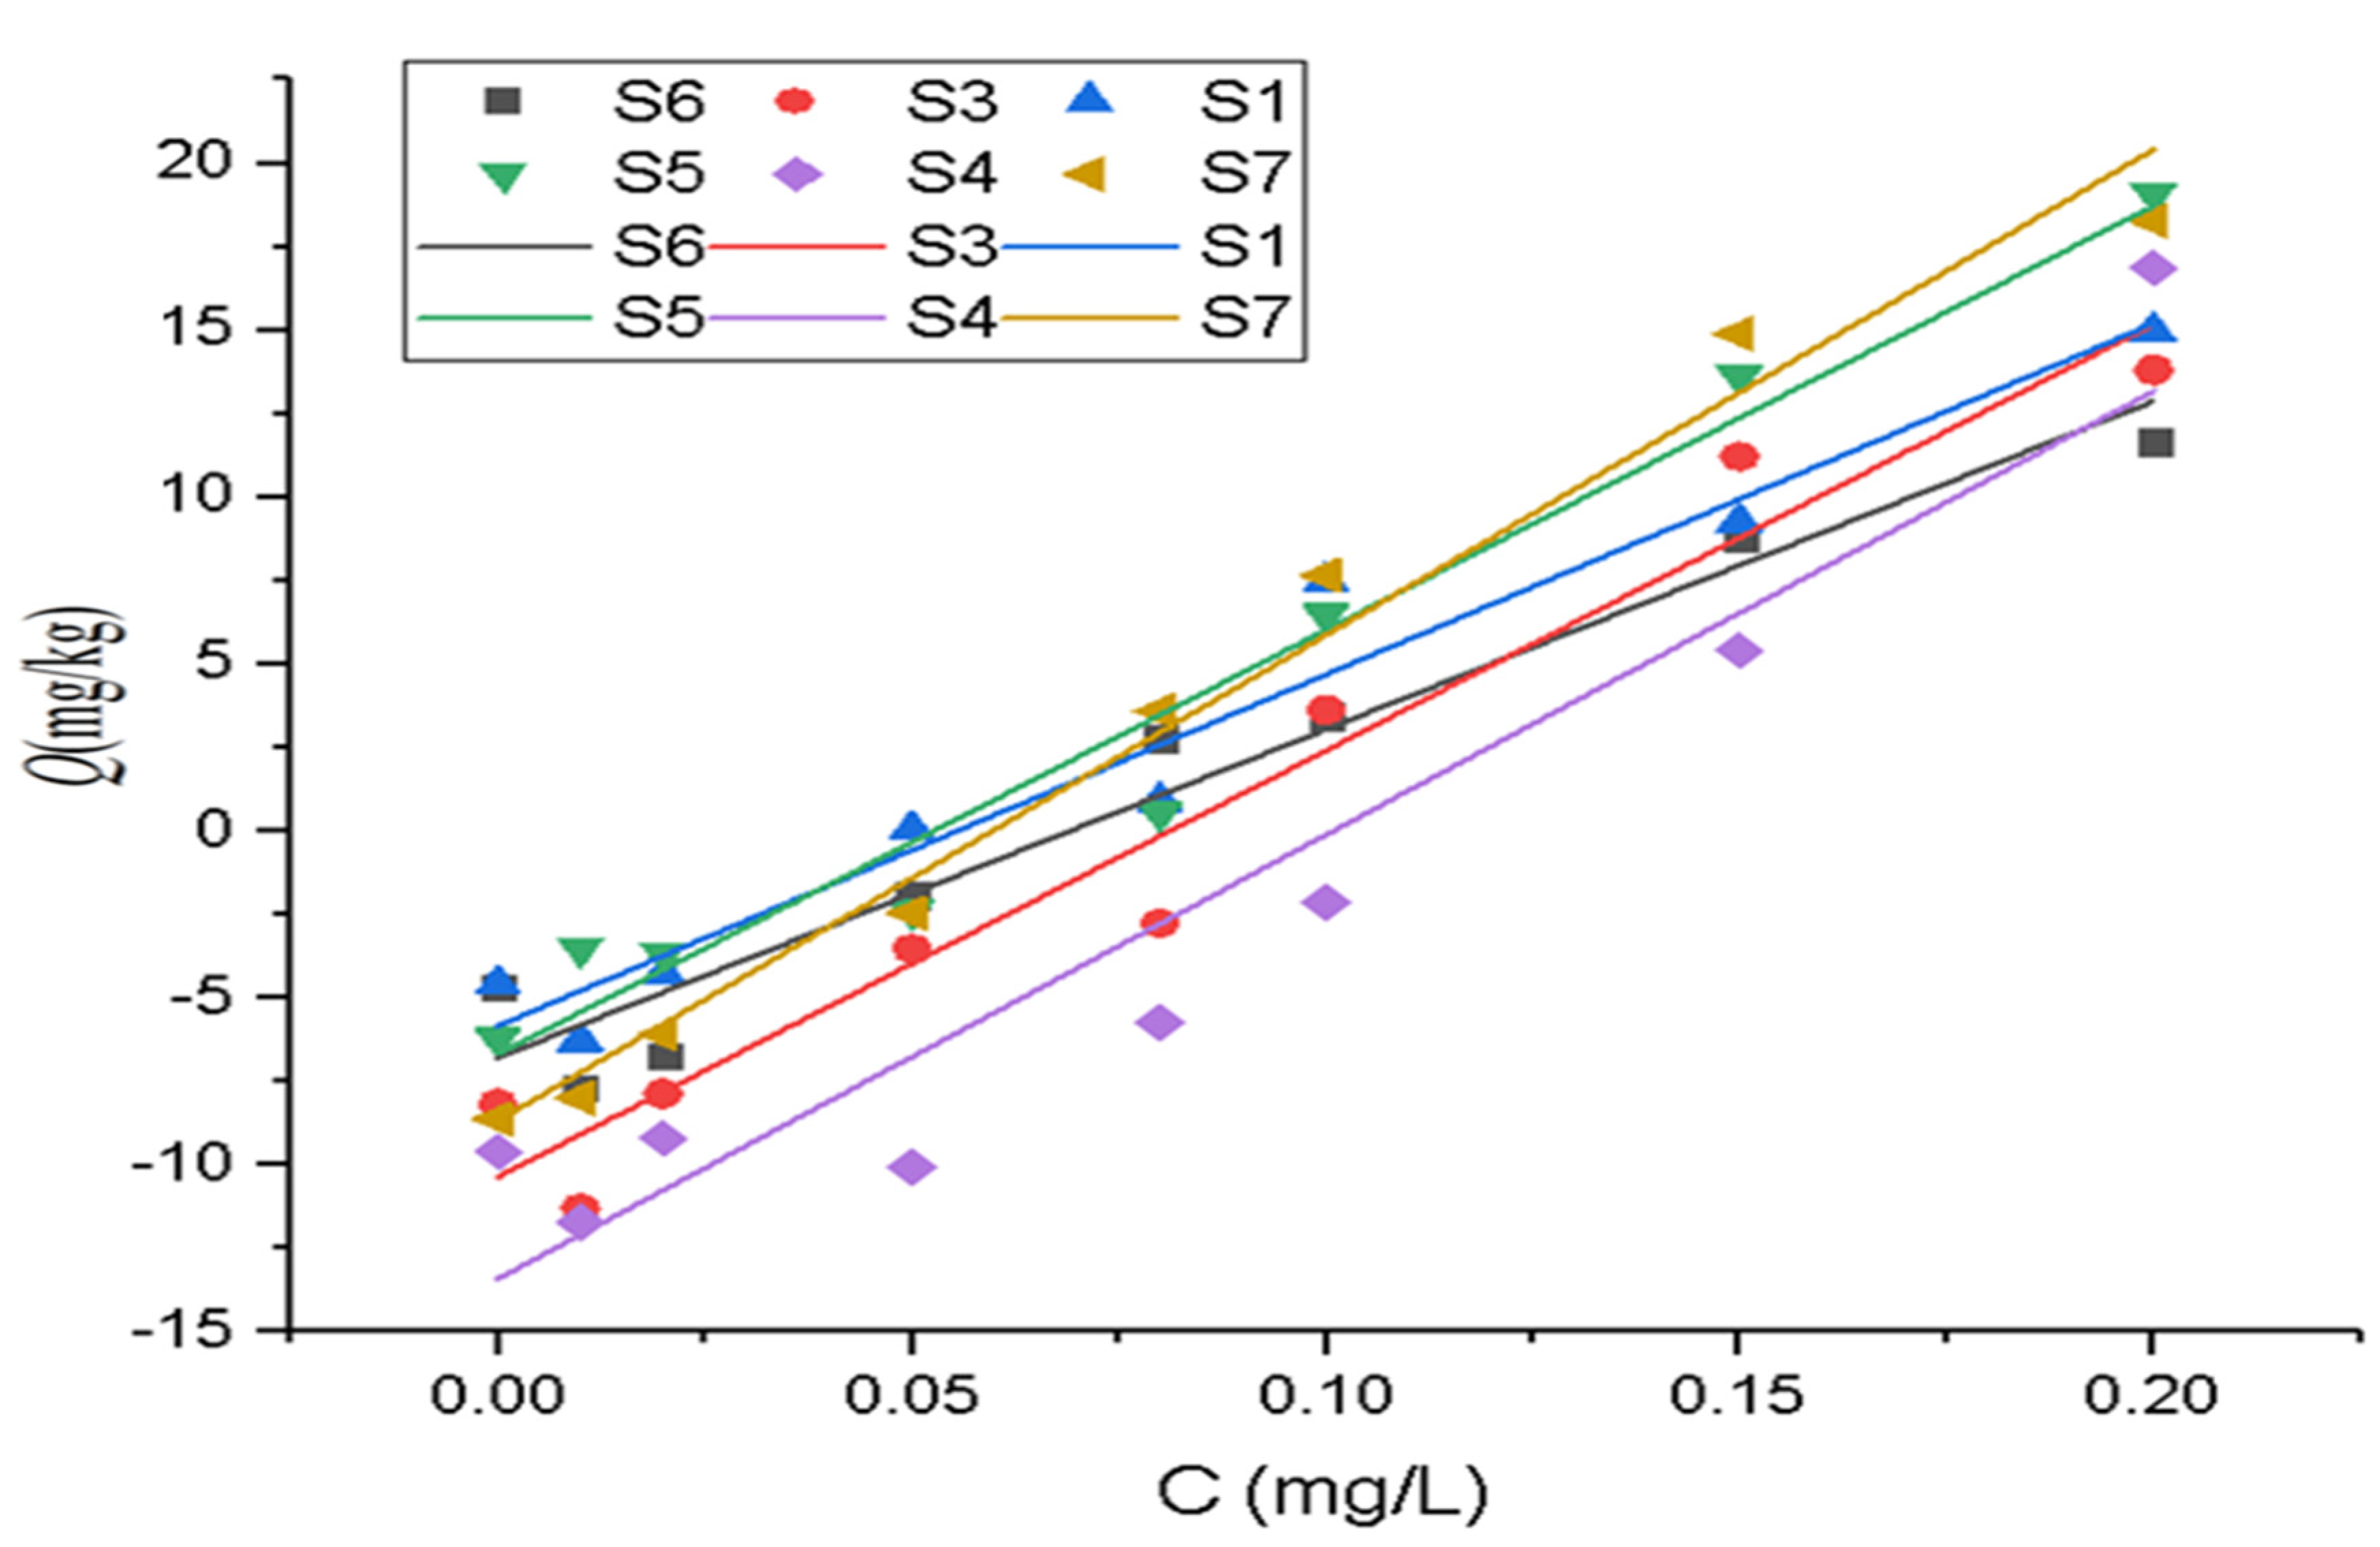
3.3. Isothermal Characteristics of Phosphorus Adsorption

Langmuir and Freundlich’s equations are commonly used as models to express adsorption isotherms [36].
Langmuir equation: Q = Qmax KC/(1 + KC)
where Q and Qmax respectively represent the adsorption capacity and maximum adsorption capacity (mg/kg) of the sediment for phosphate. C and K represent the equilibrium adsorption concentration (mg/L) and equilibrium adsorption coefficient (L/mg).
Freundlich equation: log q = log K + 1/n log C
In this equation, q, C, and K represent the weight (mg/g) of the adsorbed adsorbent, the solution (mg/L), and the equilibrium constant, respectively.
The Langmuir model fitting results show (Table 2) that the equilibrium adsorption coefficient K is 0.02~0.09 L/mg. The magnitude of K at each point is in the order of S3 > S6 > S1 > S4 > S5 > S7. The adsorption capacity Q is 1.00~5.00 mg/g, the size of each point Q is the opposite to that of K, and the order is S3 < S6 < S1 < S4 < S5 < S7.

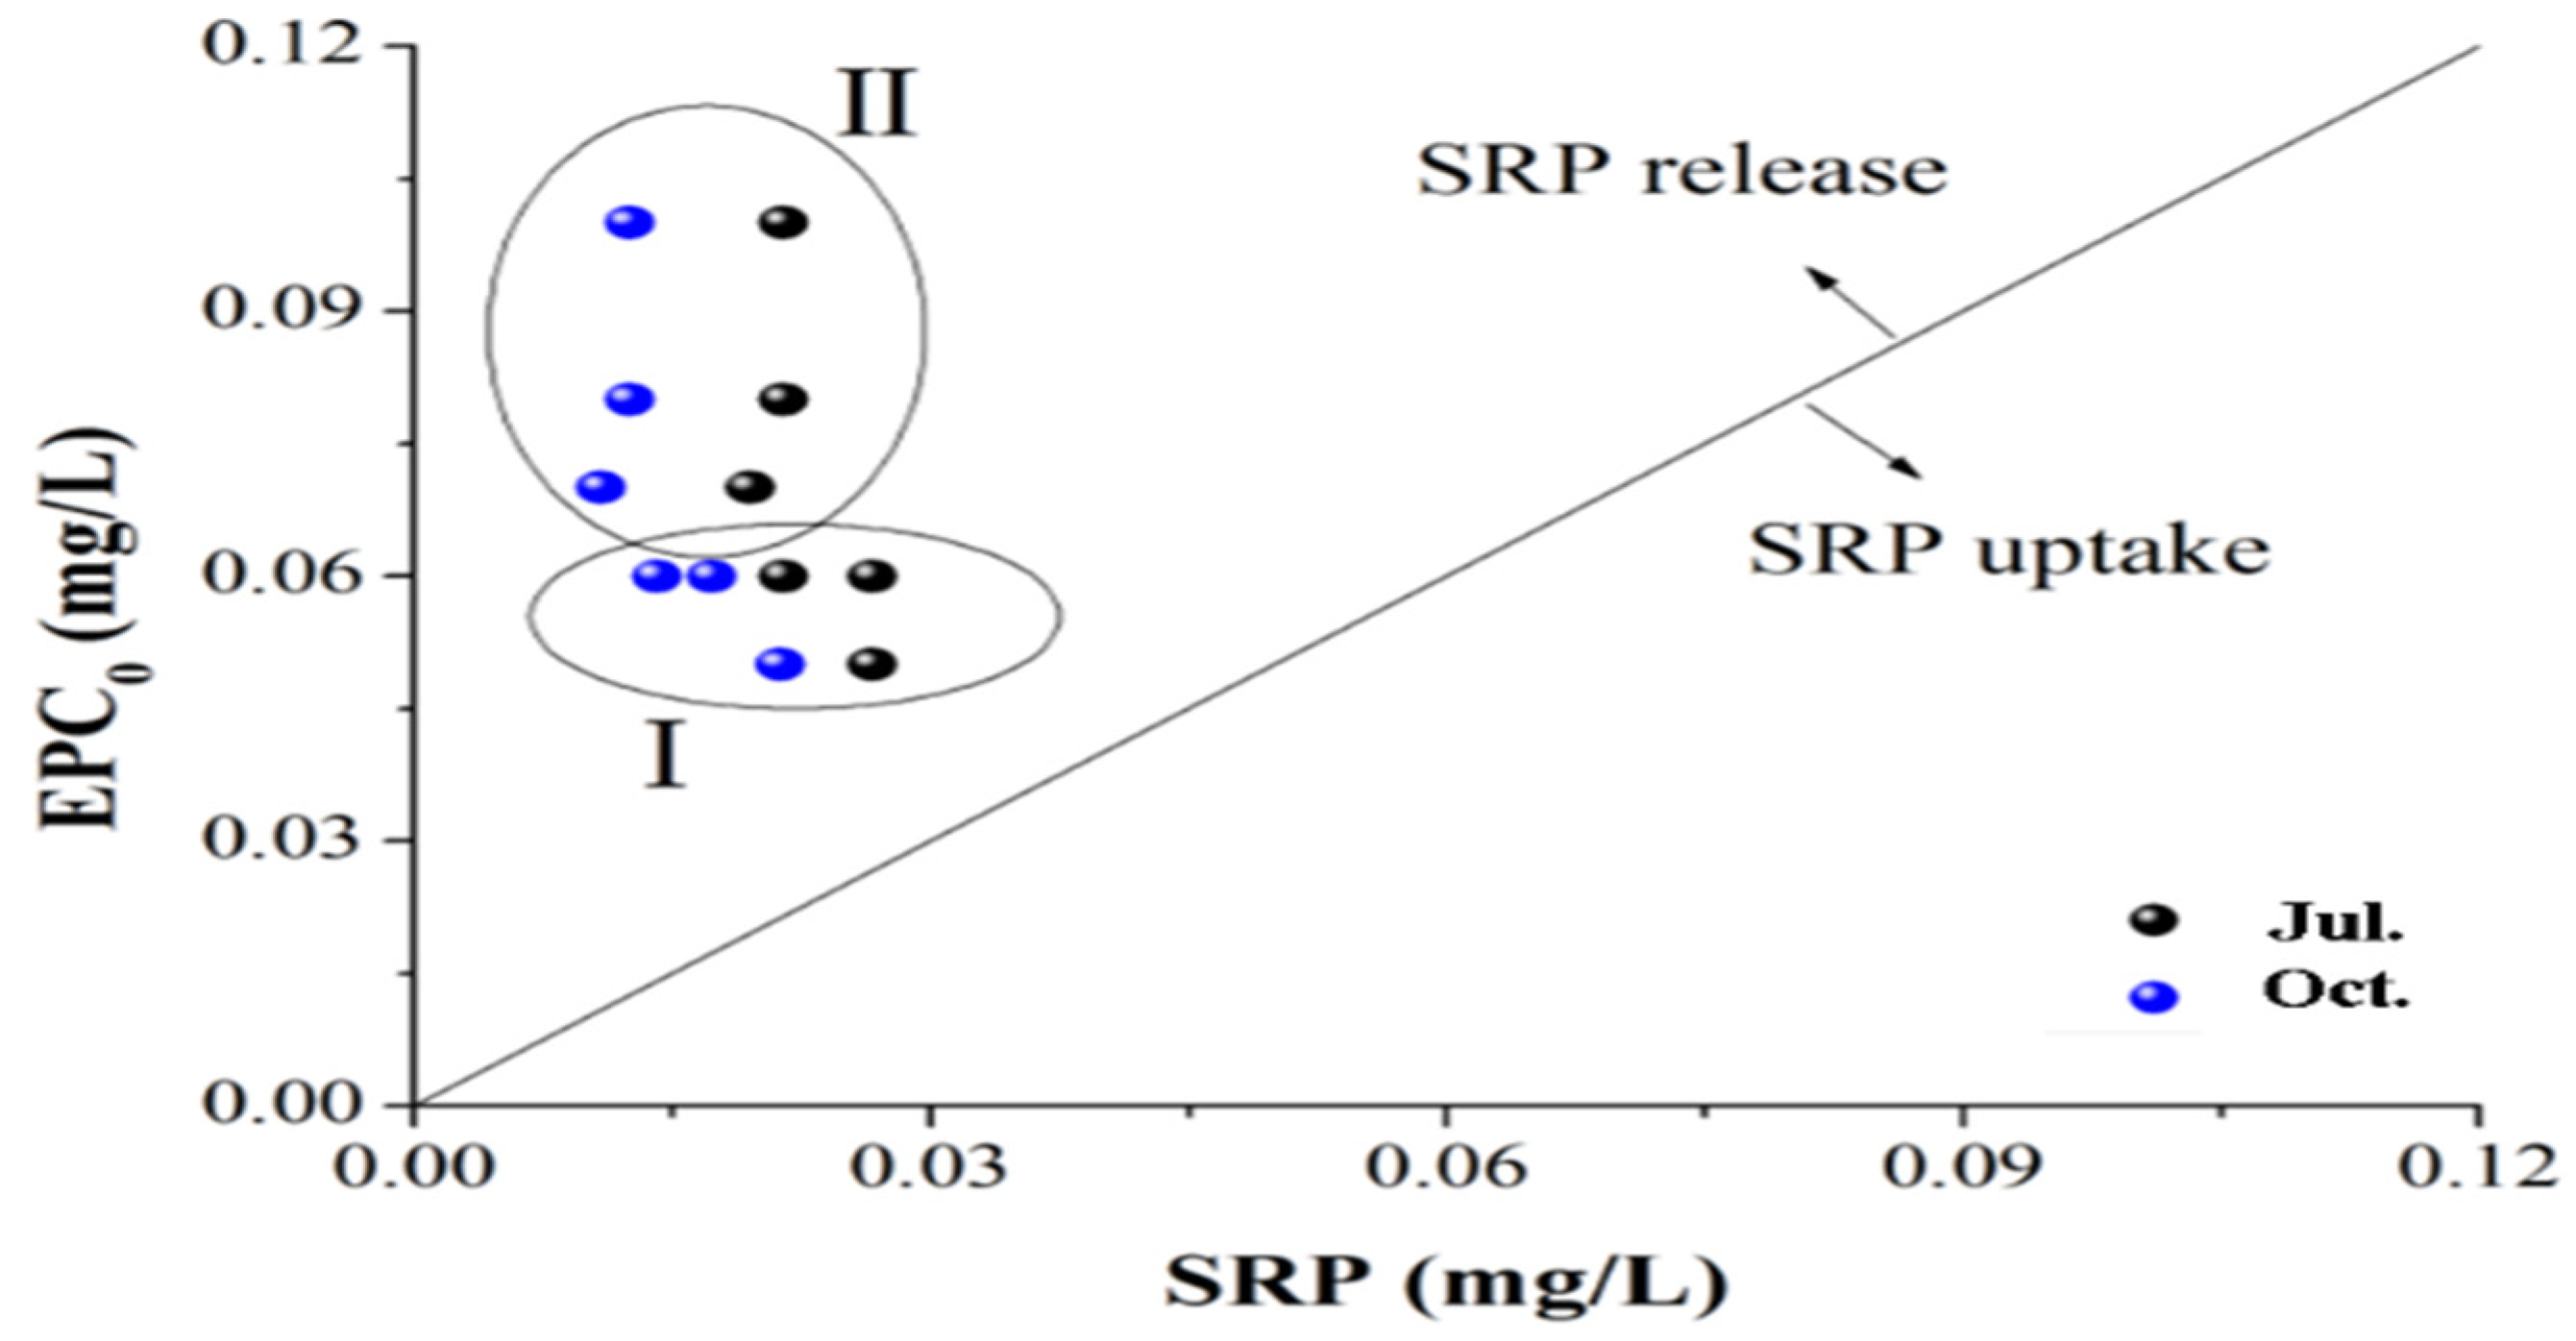
3.4. Risk of P Release from the Sediments of the Sanshiliujiao Lake

An isotherm adsorption test where the initial phosphorus solution concentration is close to natural lake water (less than 0.2 mg/L) revealed that the relationship between the initial phosphorus concentration and phosphorus amount adsorption meets a linear relationship to some extent (Figure 7). Therefore, using a linear equation can express the relationship as
Q = b × C0 + a
where Q is the amount of P adsorbed to the sediment and C0, b, a correspondingly represents the initial P concentration (mg/L), the slope (L/g), and the intercept (mg/g).
The concentration of P adsorbed in the sediment was expressed by the native adsorbed phosphorus (NAP), where NAP was the concentration of background adsorbed phosphorus in the sediments (mg/g). The relevant results in Table 3 illustrate that the fitting R2 was between 0.91 and 0.98. The EPC0 of each point was between 0.05 and 0.10 mg/L, and S4 > S3 > S6 > S1 > S7 > S5. S4 was the largest, in which EPC0 concentration was 0.10 mg/L. S5 was the lowest at 0.05 mg/L. The concentration of NAP was originally 5.82~13.40 mg/kg and decreased as S4 > S3 > S7 > S6 > S5 > S1. The maximum NAP concentration of −13.40 mg/kg at S4 was observed to follow a minimum concentration of −5.82 mg/kg at S1, as shown in Table 3.
Two methods were used based on the EPC0-SRP concentration method and the pore diffusion model. The results of both methods showed that phosphorous released the sediment. Therefore, the risk of release/adsorption of Sanshiliujiao Lake was determined based on the concentration of EPC0-SRP. The results show that the positional relationship between the scatter point and the SRP = EPC0 line can reflect the adsorption/release state of the sediment, and the scatter point was above the line SRP = EPC0, which means that when EPC0 > SRP, the deposit was in a released condition. The projection distance from the scattered points to the SRP = EPC0 line represents the release intensity (Figure 8), which also indicates that EPC0 at all points in the two seasons of July and September was more significant than the SRP concentration of surface water (p < 0.05, n = 12), and the release intensity was more potent in October than in July (p < 0.05, n = 6) (Figure 8). Spatially, S4, S3, and S6 (Class Ⅱ) classify the high release sites of SRP, among which S4 had the greatest phosphorus release intensity. In contrast, S1, S5, S7 (Class Ⅱ) sites had relatively low phosphorus release intensity. This lower intensity may relate to the high release characteristics of S4 and S3 to higher NAP (Table 3).

Risk of P Release from the Sediments of the Sanshiliujiao Lake

The calculation results using the water concentration diffusion model (Figure 9) demonstrate that the model y = 0.0013x2 − 0.0115x + 0.0754 better fit the law of TP variation with depth (R2 = 0.926). After calculation, the release rate F of P through the sediment to the overlying water interface was −2.69 × 10⁻² mg/m2/d. The area of Sanshiliujiao lake is 2.1 km2. Therefore, the fluxes of P released by the lake through the sediments were 0.020 t/a.

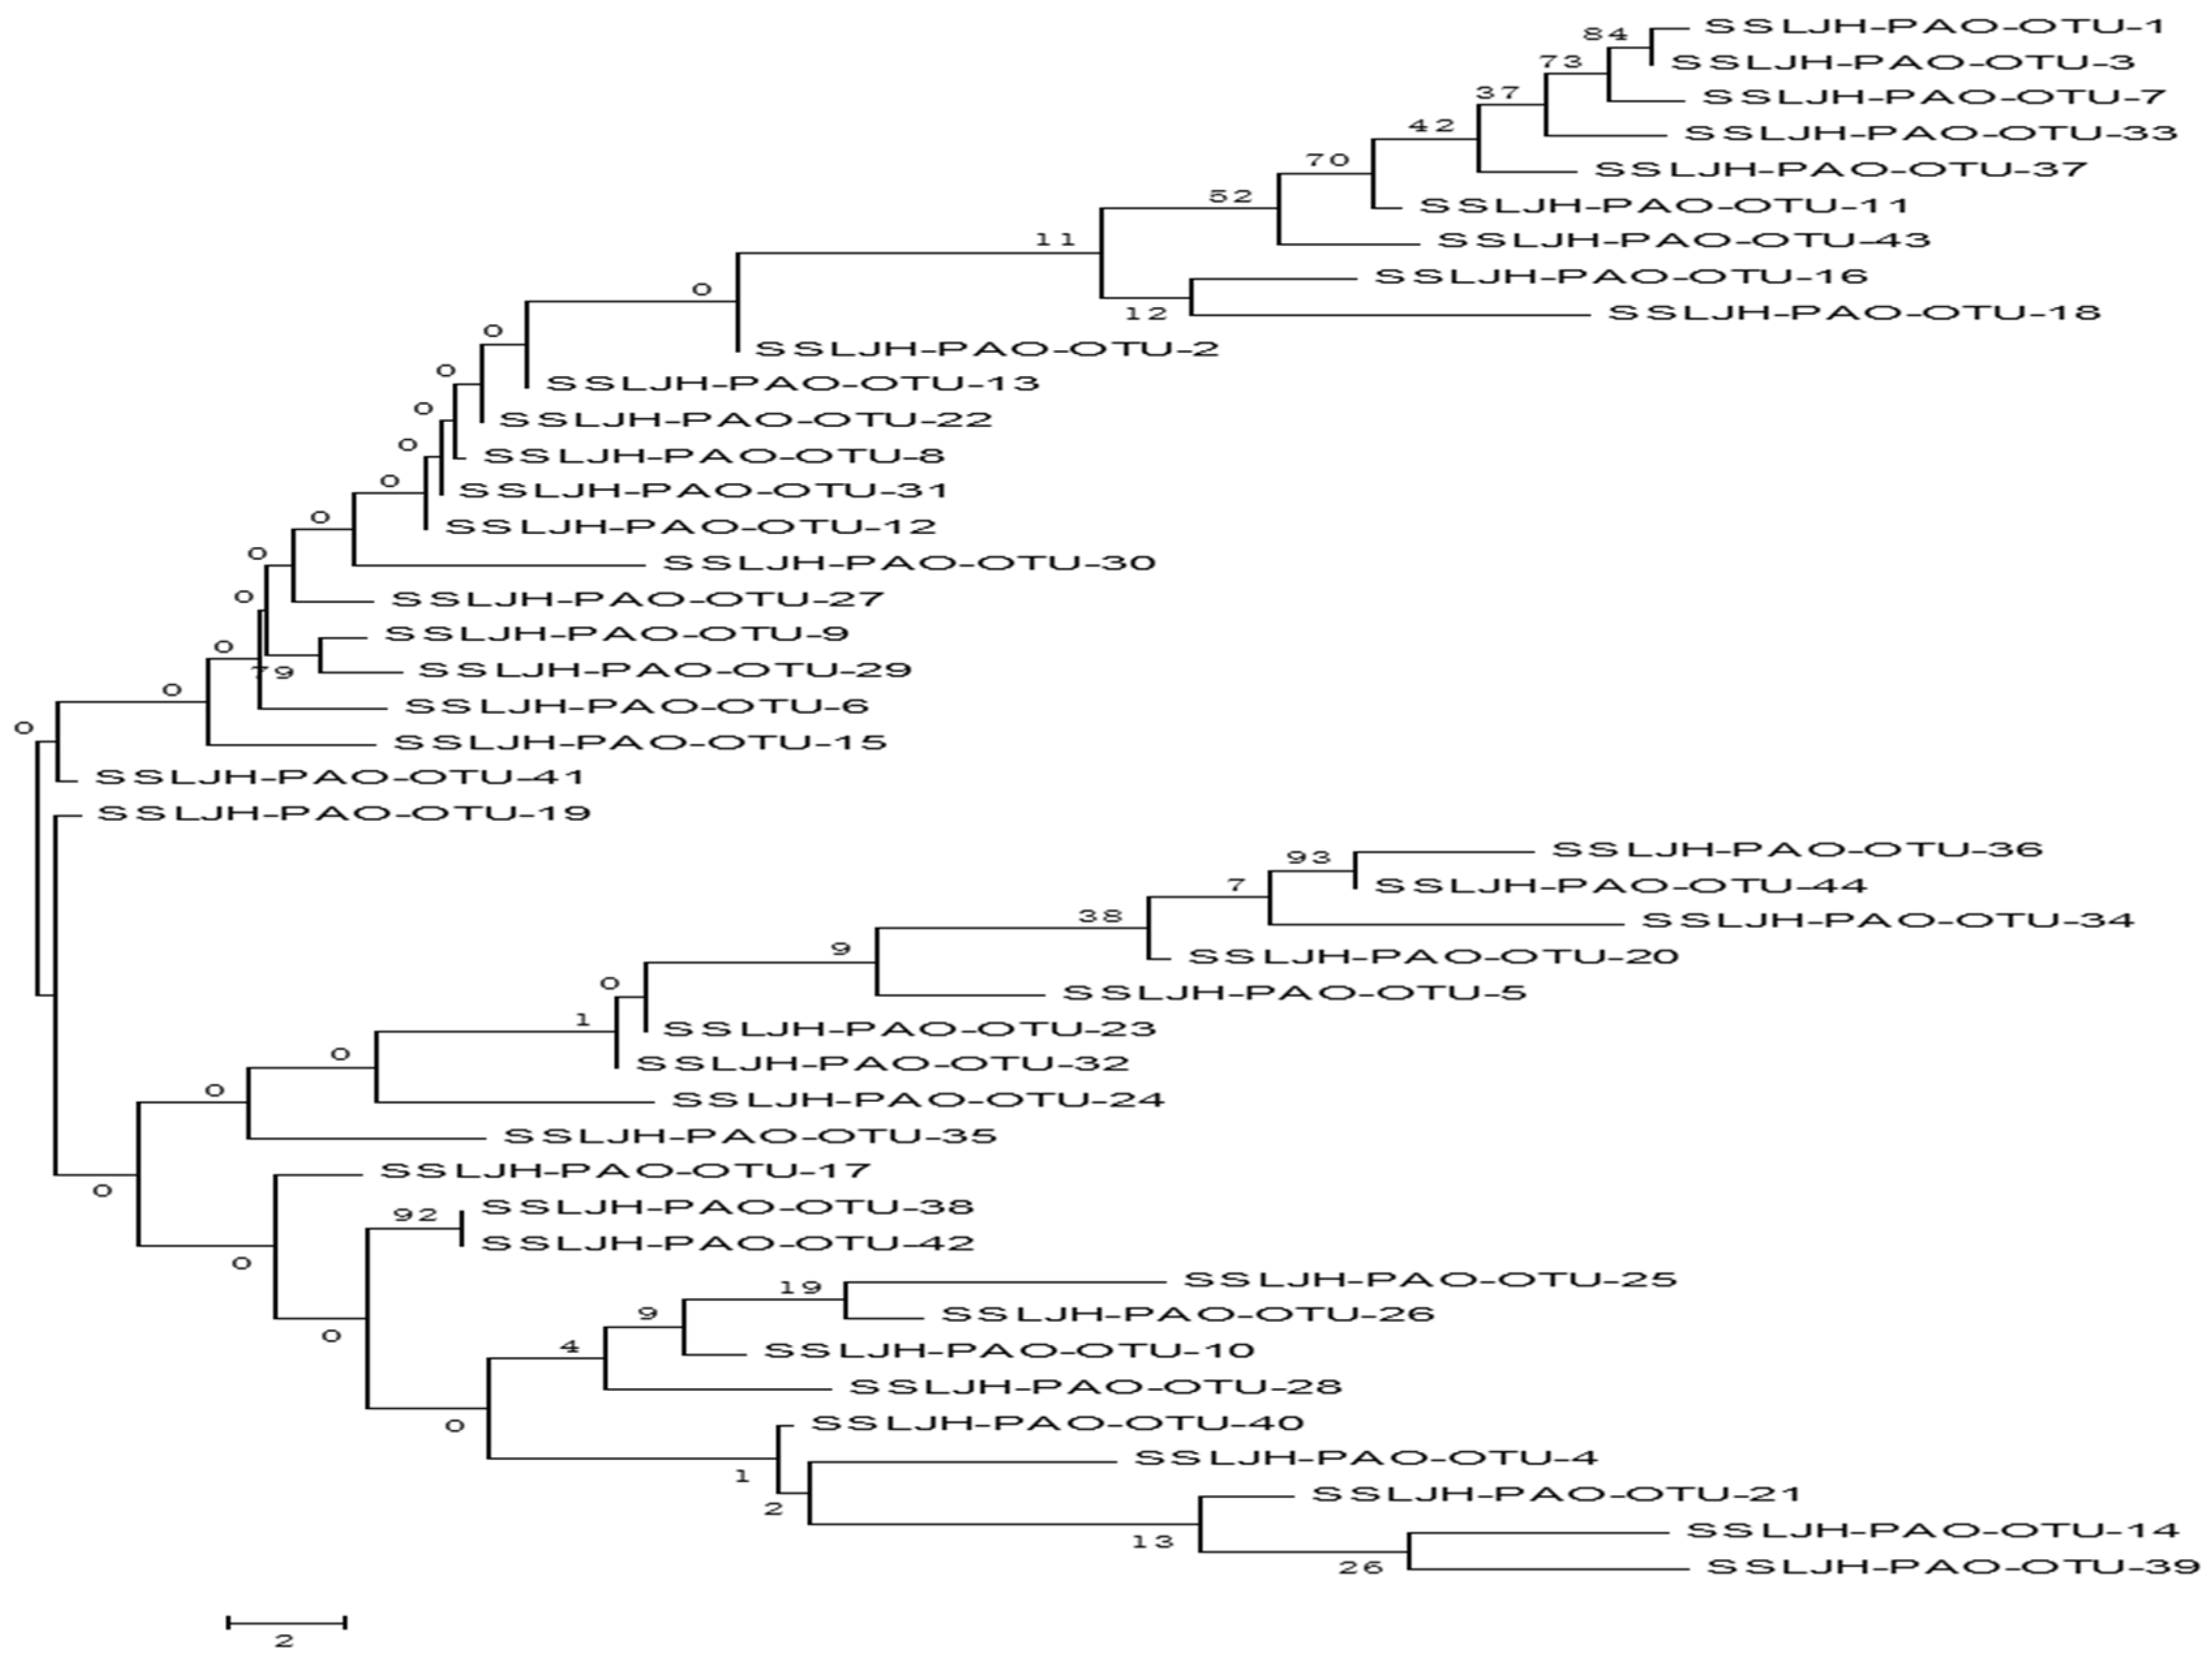
3.5. Diversity and Community Composition of Phosphorus Accumulating Organisms (PAOs) in the Sediments

The diversity of PAOs in summer samples was significantly higher than that in the autumn. The dominant T-RFs segments of PAOs were concentrated in the range of 200 to 300 bp in summer, whereas concentrations in the range of 150 to 200 bp in autumn are shown in Table 4. The species of dominant phosphorus accumulating bacteria were different, the community variation was evident, and the length of the detected T-RFs fragments in summer was complex. Each diversity index in Table 5 highlights that the diversity of phosphorus accumulating bacteria community in summer was more significant than that in autumn, but the Shannon index difference in the same season was not significant. The Pielou index shows that the homogeneity of the polyphosphorus community in sediment samples in different seasons was minor, maintaining the same trend as the dominance index.
Our analysis showed that the biological diversity of phosphorus accumulating bacteria in the sediments of the lake varied more in the autumn than in the summer. The dominant genera in the autumn and summer seasons also differed from each other. Proteobacteria species appeared in both seasons, especially during the low oxygen period in summer. In autumn, the oxygen concentration was high, but the temperature was at its lowest. The low temperature limited the growth of some microorganisms that were not tolerant to low temperatures. In the recent autumn samples, the dominant genus was the Proteobacteria bacteria, which was resistant to lower temperatures. The temperature was high in summer, but the dissolved oxygen was at its lowest. The number of facultative anaerobic phosphate solubilizing bacteria isolated in summer was also more significant than that of aerobic phosphate solubilizing bacteria.
Four clone libraries were constructed in the summer and the autumn. After RFLP analysis, a total of 44 OTU types were obtained. After sequencing the clones and constructing the phylogenetic tree, a total of 11 phyla were detected in sediment samples from Sanshiliujiao Lake (Figure 10); these are: Proteobacteria, Cyanobacteria, Acidobacteria, Verrucomicrobia, Euryarchaeota, Firmicutes, Actinobacteria, Emmatimonadetes, Chloroflexi, Nitrospirae, and Bacteroidetes. Among these, the dominant polyphosphorus groups were concentrated in Proteobacteria, Actinobacteria, and Acidobacteria, which then solubilized a considerable amount of P through producing phosphatases. The relationship between phosphorus content of sediment and diversity of polyphosphate bacteria was preliminarily analyzed, as shown in Table 6. The results showed that the correlation between the Shannon index and Fe/Al-P was significant. The correlation between the Shannon index and phosphorus was between 0.91 and 0.99, and the correlation between the Simpson index and dominance index was more than 0.97. Due to the differences in sediment in different water types, it is evident that the relationship between the diversity of phosphorus accumulating bacteria and the phosphorus forms still requires further analysis.

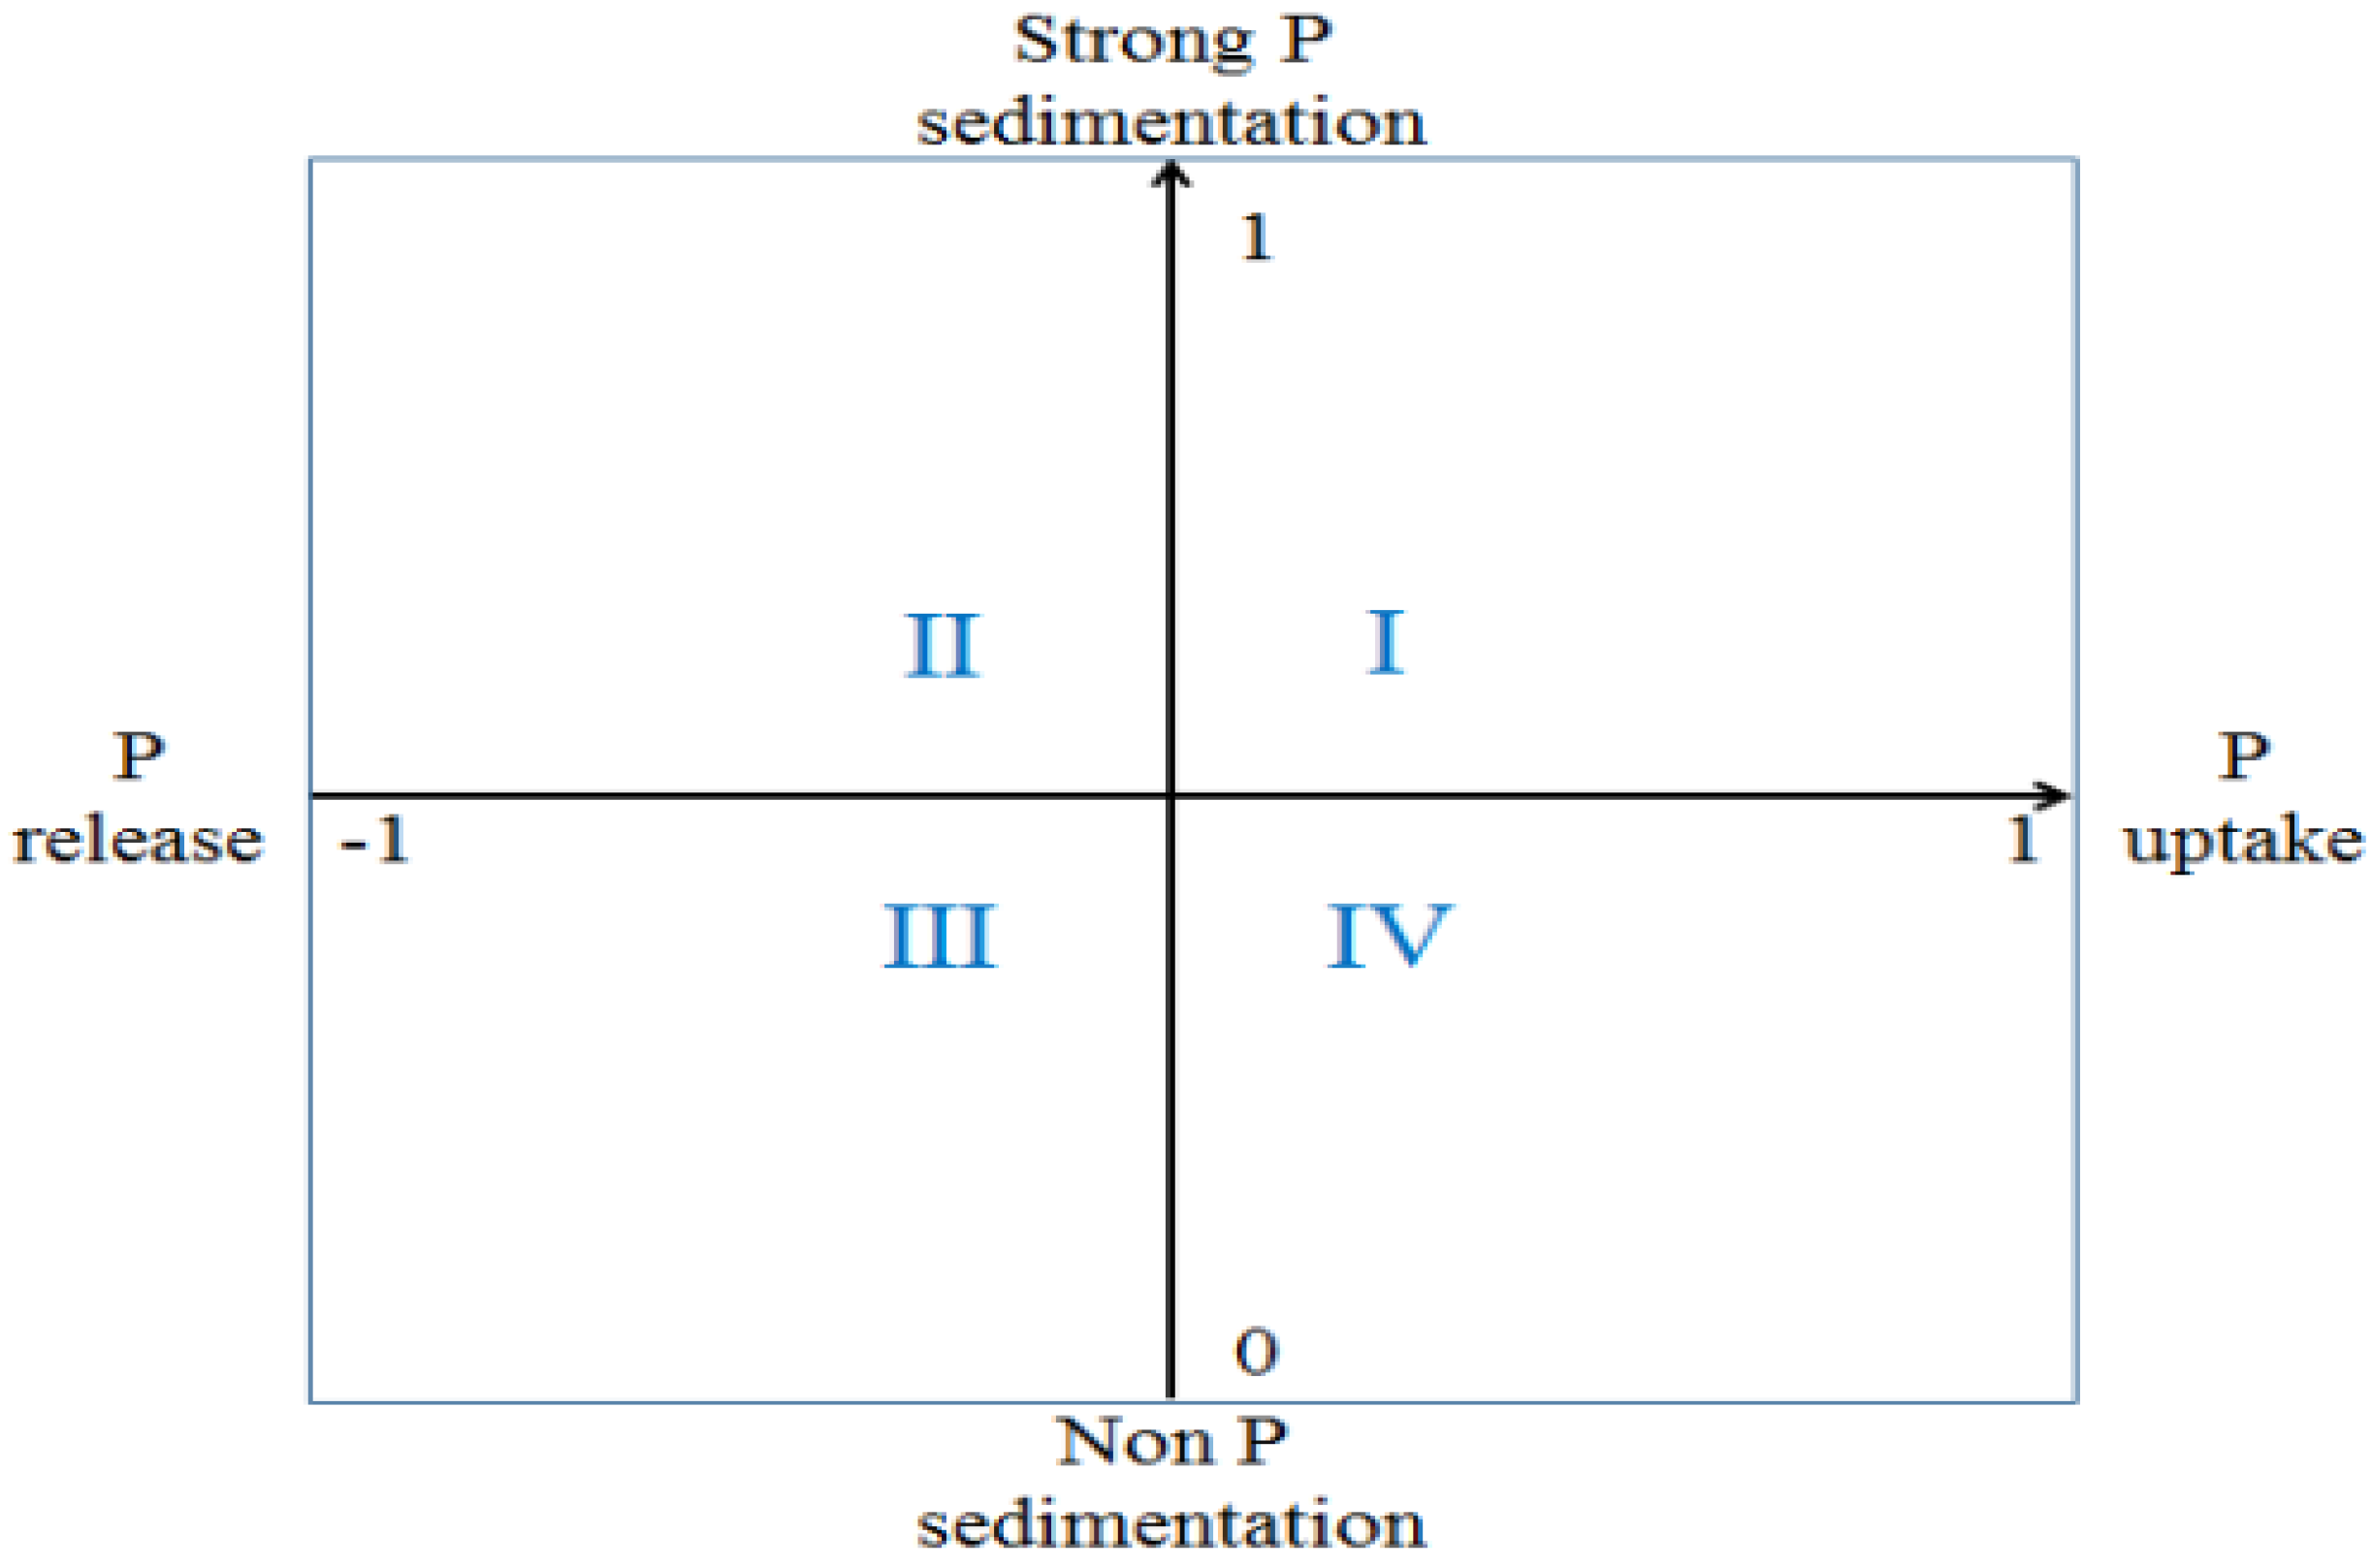
3.6. Migration and Deposition Mechanism of Phosphorus-Poor Sediments

PP includes bio-organism P particles (BP) and MP but overlooks the interactions between matter and P-reported minerals, which can compete with algae, bacteria for P, and the dissolved P’s adsorption on the surface sediments. The sedimentation of BP belongs to the water results in the sedimentary system’s internal circulation, temporarily affecting the migration of deposits, but does not impact P. The input and deposition of exogenous PP (especially MP) is the root cause of eutrophication.
This study considered lakes that were divided into four macro-level lake sediment types (Figure 11). In lake sediment types I-II, rapid deposition resulted in high P loads, and high P loads led to eutrophication. In lake sediment types III-IV, high P deposition reduced the effects of the high P load, indicating that the eutrophication process was slow for weak P deposition. In table IV lake sediments, the P adsorption status reflected a low sediment P concentration, thus speeding up eutrophication. The II and III lake sediments were in a P-release state that tended to mitigate eutrophic lake water. The Sanshiliujiao Lake area was classified as class II; thus, with substantial exogenous P inputs, the eutrophication process appeared to be rapid but slowed over time. In the poor P-type sediments of Sanshiliujiao Lake, the effects of P entering the lake from the river sediments led to a rapid eutrophication process. In recent years, as a result of factory closures and the implementation of a plant breeding ban and other measures, both the load and the basin buffer capacity have improved and reduced the external P input. The vertical TP concentrations in the lake sediments also decreased, supporting the hypothesis that the concentrations are responsible for reducing the P input.

4. Discussion

Due to the sediment’s depth and other characteristic properties, such as lake mixing regimes, it is easy for sediment to accumulate; thus, the lake has often had a significant TP content. The lake sediment at S8 was mainly composed of gravel, with a small proportion of fine sediment, and the adsorption of P was low, resulting in a low TP content [37]. In addition, biological respiration activity at the bottom of the lake tended to be intense. As a result, dissolved oxygen consumption and anaerobic conditions also increased. These conditions contributed to the release of P and other unstable micro-elements into the overlying water. In addition, anaerobic bacteria may have caused P’s rapid departure, releasing more P in the summer than in the autumn [38]. However, this change also reflects the effects of human activities on lakes in recent decades. Furthermore, the vertical concentration exhibited no significant change in the stability of P. The concentration of Fe/Al-P increased and then decreased with increasing depth. The P concentration was lower in the bottom layer because of the anaerobic environment and higher at 10~15 cm. The higher Fe/Al-P concentration likely leads to more significant amounts of iron and aluminum in the deposit.
Moreover, an unknown factor related to the OP concentration increased sedimentation, as the animal and plant residue inputs increased due to seasonal lake metabolism in autumn to significantly higher levels than those at the other points (p < 0.05). The highest percentage of OP was observed in October at S1, and this percentage was significantly higher than the OP rates at the other points (p < 0.05, n = 5), which related the high OP ratio of S1 to the nearby water and the mixing regime’s inputs. Fe/Al-P is quickly released from sediments under specific redox, pH, and other conditions, and the released P then becomes bio-available. In contrast, Ca-P is a relatively stable P and typically remains biologically unavailable [39]. The optimum adsorption rate was calculated using the double-constant rate model and the modified Elovich model. Through utilizing this model, the average adsorption rate could be calculated from the time points. The results are included in Figure 6 and Supplementary Material Table S2. P’s adsorption in sediments is a dynamic process divided into two stages: fast adsorption and slow adsorption [40]. The fitting results show that, compared with the relevant impacts of the Freundlich model (R2 = 0.984~0.993), the Langmuir model has a better appropriate effect (R2 = 0.994~0.999) (Supplementary Material Figure S2), which is comparable to the Danjiangkou Reservoir [41] and Dianchi Lake [42], for which previous studies have produced the same results.
The “cross-type” relationship between the phosphorus adsorption-desorption curve and the axis of the horizontal axis in the figure explains the principal transformation roles of the “source” and “sink” of sediments (Figure 7). The adsorption/desorption equilibrium concentration can determine part of this release or adsorption (EPC0) [43]. The correlation analysis implies that EPC0 is positively correlated with NAP, pH, and Ca-P and is significantly positively correlated with NAP (p < 0.05) (Supplementary Material Table S3). The study results are also similar to the conclusions of [18]. However, the current research on the influencing factors of EPC0 has not reached a consistent finding that is noticeably different, so additional avenues of research may need to be further explored. The NAP concentrations at S4, S3, and S7 were substantial. The correlation analysis showed that the NAP concentration was positively correlated with the Ca-P concentration and related to the sediment pH. The main components of NAP, Fe/Al-P and Ca-P are alkaline extractable and acid extractable phosphorus, which are greatly affected by pH [19].
Based on the EPC0-SRP concentration release/adsorption risk results, lake sediments were evidently in a P release state, as the results of the diffusion model confirmed this finding. However, how do nutrients accumulate in the sediments during eutrophication? Kleeberg (2002) studied lake sedimentation in Scharmützel Lake and showed that they mainly derived the lake’s sediments from exogenous particulate P (PP). However, in addition to PP, P’s sources for the deposits include surface sedimentation and mineral-bound P (MP) adsorption. What form is a PP in when it is initially deposited? Studies have shown that the source of P deposition differs by season. PP mainly forms BP in the rainy season, which sinks to the lake’s bottom to form sediments. During the rainy season (especially the heavy rain period), it is deposited primarily in apatite P (phosphorus that can extract HCl). Moreover, it deposits more quickly from organisms during the stage of less rain [44]. During the rainy season, PP mainly forms BP, which settles to the lake’s bottom to form sediments; during the rainy period (especially the storm rain phase), PP was primarily deposited as apatite P (P that can extract HCl). PP was also deposited faster from organisms in the lesser rain phase [44]. The Sanshiliujiao Lake area is along the southeast coast and has a rainy climate; thus, MP may be the primary P deposited in the lake.
Furthermore, diatoms are the dominant type of BP deposition. Poister and Armstrong [45] studied the influence of diatoms on precipitation and found that diatoms can remove an enormous amount of phosphorus in water through precipitation. During the monitoring period throughout the year, the average abundance of diatoms in Sanshiliujiao Lake was 3.30 × 10⁶ Cells/L, accounting for 24.17% of algae’s total quantity. Especially in May, the number of diatoms was as high as 1.68 × 10⁷ Cells/L, which accounted for 57.20% of the total abundance of algae (Supplementary Material Figure S3). Therefore, diatoms may contribute to the phosphorus deposition of Sanshiliujiao Lake, and the specific mechanism needs to be further explored.
Sediment microorganism is the main power of material circulation and energy flow in the lake ecosystem, which plays a vital role in material circulation, energy flow, and bloom formation of the sediment–water body and the importance of benthic P fluxes in the functioning of lake ecosystems. Exactly which processes lead to the enhanced release of P from sediments under anoxia remain unclear. Although the biological and chemical processes responsible for a higher P release at the onset of anoxia are well described [46], they cannot account for the prolonged enhanced release of P under sustained anoxia. Microbial activity has been proposed as a potential control on P fluxes. However, the direct relation between P regeneration and microbial activity occurring in lake sediments has not been thoroughly studied. The preferential regeneration of P under anoxia on a regional scale by its contribution to eutrophication and oxygen depletion is significant. The role of microbes in P release is potentially sensitive to changes in redox conditions. Oxygen availability determines the metabolic pathways accessible to bacterial communities and can, in this manner, impact bacterial community structure. Oxygen is a powerful electron acceptor and is preferentially used over other acceptors to oxidize organic matter [47]. However, not all microorganisms are capable of oxic respiration, whereas other microorganisms strictly depend on oxygen for their metabolism [48]. Therefore, the absence or presence of oxygen can have a considerable influence on the community structure of sediment bacteria. Studies have shown that low-oxygen environments tend to increase phosphorus flux at the sediment–water interface [49]. In addition to the changes in the sediment oxidation-reduction environment caused by hypoxia, the enhanced phosphorus cycle with bacteria such as Proteobacteria, Actinobacteria, and Acidobacteria appears to be related to summer conditions, providing an essential factor for high phosphate flux at the bottom interface.
As one of the functional flora of the sediment endogenous phosphorus metabolism cycle, polyphosphoric is closely related to sediment phosphorus transformation [27]. The insoluble inorganic phosphorus and organic phosphorus in the sediment can be converted into soluble inorganic phosphorus under phosphorus-increasing bacteria and released into the water body. The primary function of polyphosphate is to synthesize polyphosphate through the excessive absorption of soluble phosphate in water and accumulation in the body. Phosphorus solubilization by organophosphate solubilizing bacteria mainly uses the phosphatase produced by its metabolism to play a role in organophosphate solubilization. This enzyme has been reported to be produced in the heterotrophic bacteria in the Proteobacteria and Firmicutes [50]. The analysis of these study results suggests that the Proteobacteria and Firmicutes occupy a dominant position in the sediments of the Yangtze River Estuary. These findings strongly supported the results of this study by illuminating a specific relationship between phosphorus diversity that accumulates bacteria in sediment and the phosphorus of each form. The soluble phosphorus can be assimilated into organic phosphorus by microorganisms, although there are differences in deposits between different water types. It is likely that the relationships between phosphorus diversity, accumulating bacteria, and the sediment phosphorus cycle in the specific environment need further analysis.
In summary, the phosphorus enrichment of phosphorus-poor sediments appears to be caused by the input of external PP. The intake of PP is generally dominated by MP, especially for lakes with more precipitation. PP inputs also show temporal and spatial differences from each other. BP input is dominant during low-rainfall periods, and MP is dominant during wet periods. Spatially, areas with a high proportion of fine particles (such as lake centers) contain more phosphorous deposits. Governance, therefore, needs to address these issues according to each specific lake eutrophication process.

5. Conclusions

The P content in Lake Sanshiliujiao was low compared to other lake sediments; however, the low value at one station was probably due to the larger grain size, which suggests a problem with the reference system used. Typically, element composition is related to a size <20 µm. The TP concentration of sediments ranged from 390.1 to 470.7 mg/kg and gradually decreased with the depth increased. The lake sediments were in a released state (p < 0.05, n = 12), and the flux of P emitted by the lake sediments to the overlying water body was 0.020 t/a. Phosphorus enrichment in sediments by external P input and the EPC0 concentrations of 0.05~0.10 mg/L were the P release-adsorption threshold points. In the study experiments, the species characteristics of PAOs in the sediments off the Sanshiliujiao Lake in different seasons were preliminarily analyzed. The data included in this study strongly provides a scientific basis for studying the phosphorus-enriching biogeochemical cycle and the evolution of the lake environment. In addition, future research should consider the influence of the differing dissolved oxygen content on the distribution of PAOs under the same temperature conditions. The biological function of Proteobacteria, Actinobacteria, and Acidobacteria microorganisms in transforming phosphorus-containing compounds under different temperatures and dissolved oxygen conditions should also be considered in future prospective research projects. The phosphorus content in sediment and diversity of polyphosphorus indicates that phosphorus had a particular effect on the diversity of PAOs, and its correlation with Fe/Al-P is quite significant. However, the relationship between the diversity of phosphorus accumulating bacteria and the phosphorus forms still requires further analysis.

Supplementary Materials

The following are available online at https://www.mdpi.com/article/10.3390/su132011501/s1.

Author Contributions

B.B.P.: Data curation, Formal analysis, Writing—original draft. Writing—review & editing. Z.-R.L.: Writing—original draft. Y.-P.S.: Conceptualization, Resources, Supervision, Writing—review & editing. C.-X.S.: Data curation, C.-W.Z.: Formal analysis, Writing-original draft. H.L.: Writing—original draft. H.Y.: Writing—review & editing. All authors have read and agreed to the published version of the manuscript.

Funding

This study was supported by National Key Research & Development Plan “Strategic International Scientific and Technological Innovation Cooperation” (2016YFE0202100), and National Natural Science Foundation of China (41573075) and Science and Technology Project of Fujian Provincial Department of Water Resources(SC-292), Fujian Province Innovation Strategy Research Joint Project(2020R0157); Natural Science Foundation of Fujian Province (20YXC00292), the Natural Science Foundation of Fujian Province (2018J01742) and Mingjiang Scholar Programme.

Institutional Review Board Statement

Not applicable.

Informed Consent Statement

Not applicable.

Data Availability Statement

The data presented in this study are available on request from the corresponding author. The data are not publicly available.

Acknowledgments

We thank Michael Hupfer (Leibniz institute of freshwater ecology and inland Fisheries Berlin, Germany) for reading a former version of manuscript and for helpful suggestion for improvement. The authors are also indebted to the anonymous reviewers for their constructive comments and suggestions for the improvement of this manuscript.

Conflicts of Interest

The authors declare no conflict of interest.

References

  1. Canfield, D.E.; Glazer, A.N.; Falkowski, P.G. The Evolution and Future of Earth’s Nitrogen Cycle. Science 2010, 330, 192–196. [Google Scholar] [CrossRef] [Green Version]
  2. Le Moal, M.; Gascuel-Odoux, C.; Menesguen, A.; Souchon, Y.; Etrillard, C.; Levain, A.; Moatar, F.; Pannard, A.; Souchu, P.; Lefebvre, A.; et al. Eutrophication: A new wine in an old bottle? Sci. Total Environ. 2019, 651, 1–11. [Google Scholar] [CrossRef] [Green Version]
  3. Wang, T.; Liu, J.; Xu, S.; Qin, G.; Sun, Y.; Wang, F. Spatial Distribution, Adsorption/Release Characteristics, and Environment Influence of Phosphorus on Sediment in Reservoir. Water 2017, 9, 724. [Google Scholar] [CrossRef] [Green Version]
  4. Huisman, J.; Codd, G.A.; Paerl, H.W.; Ibelings, B.W.; Verspagen, J.M.H.; Visser, P.M. Cyanobacterial blooms. Nat. Rev. Microbiol. 2018, 16, 471–483. [Google Scholar] [CrossRef]
  5. O’Neil, J.M.; Davis, T.W.; Burford, M.A.; Gobler, C.J. The rise of harmful cyanobacteria blooms: The potential roles of eutrophication and climate change. Harmful Algae 2012, 14, 313–334. [Google Scholar] [CrossRef]
  6. Tang, X.; Li, R.; Han, D.; Scholz, M. Response of Eutrophication Development to Variations in Nutrients and Hydrological Regime: A Case Study in the Changjiang River (Yangtze) Basin. Water 2020, 12, 1634. [Google Scholar] [CrossRef]
  7. Jeppesen, E.; Søndergaard, M.; Jensen, J.P.; Havens, K.E.; Anneville, O.; Carvalho, L.; Coveney, M.F.; Deneke, R.; Dokulil, M.; Foy, B.; et al. Lake responses to reduced nutrient loading-an analysis of contemporary long-term data from 35 case studies. Freshw. Biol. 2005, 50, 1747–1771. [Google Scholar] [CrossRef]
  8. Ho, J.C.; Michalak, A.M. Phytoplankton blooms in Lake Erie impacted by both long-term and springtime phosphorus loading. J. Great Lakes Res. 2017, 43, 221–228. [Google Scholar] [CrossRef]
  9. Paytan, A.; Roberts, K.; Watson, S.; Peek, S.; Chuang, P.-C.; Defforey, D.; Kendall, C. Internal loading of phosphate in Lake erie central basin. Sci. Total Environ. 2017, 579, 1356–1365. [Google Scholar] [CrossRef] [PubMed]
  10. Paerl, H.W.; Otten, T.G. Harmful Cyanobacterial Blooms: Causes, Consequences, and Controls. Microb. Ecol. 2013, 65, 995–1010. [Google Scholar] [CrossRef]
  11. Boström, B.; Andersen, J.M.; Fleischer, S.; Jansson, M.J.H. Exchange of phosphorus across the sediment water interface. Hydrobiologia 1998, 170, 229–244. [Google Scholar] [CrossRef]
  12. Vitousek, P.M.; Porder, S.; Houlton, B.Z.; Chadwick, O.A. Terrestrial phosphorus limitation: Mechanisms, implications, and nitrogen-phosphorus interactions. Ecol. Appl. 2010, 20, 5–15. [Google Scholar] [CrossRef] [PubMed] [Green Version]
  13. Sakamoto, M.; Hayashi, H.; Otsuki, A.; Aoyama, K.; Watanabe, Y.; Hanazato, T.; Iwakuma, T.; Yasuno, M. Role of Bottom Sediments in Sustaining Plankton Production in a Lake Ecosystem: Experimental Demonstration Using Enclosed Water Bodies in a Shallow Eutrophic Lake. Ecol. Res. 1989, 4, 1–16. [Google Scholar] [CrossRef]
  14. Kamiya, K.; Fukushima, T.; Ouchi, T.; Aizaki, M. Phosphorus budgetary analysis of sediment-water interface in a short-term anoxic condition in shallow Lake Kasumigaura, Japan. Limnology 2017, 18, 131–140. [Google Scholar] [CrossRef]
  15. Xu, Y.Q.; Xiong, H.X.; Xiu, L.Z. Research progress of phosphorus adsorption and release from sediment. Chongqing Environ. Sci. 2003, 11, 147–149. [Google Scholar]
  16. Wang, L.; Liang, T. Distribution Characteristics of Phosphorus in the Sediments and Overlying Water of Poyang Lake. PLoS ONE 2015, 10, e0125859. [Google Scholar] [CrossRef] [Green Version]
  17. Pedro, T.; Kimberley, S.; Fernando, P. Dynamics of phosphorus in sediments of a naturally acidic lake. Int. J. Sediment Res. 2013, 28, 90–102. [Google Scholar] [CrossRef]
  18. An, W.; Li, X. Phosphate Adsorption Characteristics on Surface Sediments of Nansi Lake and Its Main Inflow Rivers. Environ. Sci. 2008, 291, 1295–1302. [Google Scholar]
  19. Huang, Q.H.; Wang, Z.J.; Wang, C.X.; Wang, S.R.; Jin, X.C. Phosphorus release in response to pH variation in the lake sediments with different ratios of iron-bound P to calcium-bound P. Chem. Spec. Bioavail. 2005, 17, 55–61. [Google Scholar] [CrossRef]
  20. Kisand, A.; Nõges, P. Sediment phosphorus release in phytoplankton dominated versus macrophyte dominated shallow lakes: Importance of oxygen conditions. Hydrobiologia 2003, 506–509, 129–133. [Google Scholar] [CrossRef]
  21. Gallego, I.; Venail, P.; Ibelings, B.W. Size differences predict niche and relative fitness differences between phytoplankton species but not their coexistence. ISME J. 2019, 13, 1133–1143. [Google Scholar] [CrossRef]
  22. Cao, X.; Xiaoyue, L.; Jiamei, Z.; Lisha, W.; Sumei, L.; Guipeng, Y. Characterization of phosphorus sorption on the sediments of Yangtze River Estuary and its adjacent areas. Mar. Pollut. Bull. 2017, 114, 277–284. [Google Scholar] [CrossRef]
  23. Li, M.; Hou, Y.L.; Zhu, B. Phosphorus sorption-desorption by purple soils of China in relation to their properties. Aust. J. Soil Res. 2007, 45, 182–189. [Google Scholar] [CrossRef]
  24. Chardon, W.J.; Blaauw, D. Kinetic Freundlich equation applied to soils with a high residual phosphorus content. Soil Sci. 1998, 163, 30–35. [Google Scholar] [CrossRef]
  25. Nürnberg, G.K.; Tarvainen, M.; Ventellä, A.-M.; Sarvala, J. Internal phosphorus load estimation during biomanipulation in a large polymictic and mesotrophic lake. Inland Waters 2012, 2, 147–162. [Google Scholar] [CrossRef]
  26. Bao, L.L.; Li, X.Y.; Su, J.J. Alteration in the potential of sediment phosphorus release along series of rubber dams in a typical urban landscape river. Sci. Rep. 2020, 10, 2714. [Google Scholar] [CrossRef] [PubMed] [Green Version]
  27. Cao, X.Y.; Chen, X.Y.; Song, C.L.; Zhou, Y.Y. Comparison of phosphorus sorption characteristics in the soils of riparian buffer strips with different land use patterns and distances from the shoreline around Lake Chaohu. J. Soils Sediments 2019, 19, 2322–2329. [Google Scholar] [CrossRef]
  28. Wen, C.-Y. Brief analysis on the environmental problems of 36 feet lake in pingtan county and the countermeasures of surrounding projects. Straits Sci. 2010, 3, 11–13. [Google Scholar]
  29. Azizian, S. Kinetic models of sorption: A theoretical analysis. J. Colloid Interface Sci. 2004, 276, 41–52. [Google Scholar] [CrossRef]
  30. Cao, X.; Wang, Y.; He, J.; Luo, X.; Zheng, Z. Phosphorus mobility among sediments, water and cyanobacteria enhanced by cyanobacteria blooms in eutrophic Lake Dianchi. Environ. Pollut. 2016, 219, 580–587. [Google Scholar] [CrossRef]
  31. Ruban, V.; López-Sánchez, J.F.; Pardo, P.; Rauret, G.; Muntau, H.; Quevauviller, P. Harmonized protocol and certified reference material for the determination of extractable contents of phosphorus in freshwater sediments—A synthesis of recent works. Fresenius J. Anal. Chem. 2001, 370, 224–228. [Google Scholar] [CrossRef]
  32. Mittal, M.; Rockne, K.J. Diffusional losses of amended anaerobic electron acceptors in sediment field microcosms. Mar. Pollut. Bull. 2010, 60, 1217–1225. [Google Scholar] [CrossRef] [PubMed]
  33. Ullman, W.J. Diffusion coefficients in near-shore marine sediments. Limnol. Oceanogr. 1982, 27, 552–556. [Google Scholar] [CrossRef]
  34. Murphy, J.; Riley, J.P. A modified single solution method for the determination of phosphate in natural waters. Anal. Chim. Acta 1962, 27, 31–36. [Google Scholar] [CrossRef]
  35. Islas-Espinoza, M.; Solís-Mejía, L.; Esteller, M.V. Phosphorus release kinetics in a soil amended with biosolids and vermicompost. Environ. Earth Sci. 2013, 71, 1441–1451. [Google Scholar] [CrossRef] [Green Version]
  36. Zhu, G.; Yang, Y. Variation laws and release characteristics of phosphorus on surface sediment of Dongting Lake. Environ. Sci. Pollut. Res. 2018, 25, 1–10. [Google Scholar] [CrossRef] [PubMed]
  37. Meng, J.; Yao, Q.; Yu, Z. Particulate phosphorus speciation and phosphate adsorption characteristics associated with sediment grain size. Ecol. Eng. 2014, 70, 140–145. [Google Scholar] [CrossRef]
  38. Weng, Y.; Su, Y.; Zhang, Y.; Shao, K.; Zhan, X.; Liu, Y.; Jiang, B. Analysis of endogenous phosphorus load in surface sediments of Shanzi Reservoir in Fujian in different seasons. J. Lake Sci. 2014, 26, 871–878. [Google Scholar]
  39. Tammeorg, O.; Haldna, M.; Nõges, P.; Appleby, P.; Horppila, J. Factors behind the variability of phosphorus accumulation in Finnish lakes. J. Soils Sediments 2018, 18, 2117–2129. [Google Scholar] [CrossRef] [Green Version]
  40. Al-Enezi, E.; Bockelmann-Evans, B.; Falconer, R. Phosphorus adsorption/desorption processes of estuarine sediment: A case study-Loughor Estuary, UK. Arab. J. Geosci. 2016, 9, 1–9. [Google Scholar] [CrossRef]
  41. Tang, X.; Wu, M.; Dai, X.; Chaia, P. Phosphorus storage dynamics and adsorption characteristics for sediment from a drinking water source reservoir and its relation with sediment compositions. Ecol. Eng. 2014, 64, 276–284. [Google Scholar] [CrossRef]
  42. Chen, C.; Xu, X.; Deng, W.; He, J.; Wng, S.; Jiao, L.; Li, S.; Xu, D. Adsorption characteristics of phosphorus on the surface sediments of Dianchi Lake. Acta Sci. Circum. 2014, 34, 3065–3075. [Google Scholar]
  43. Sun, W.; Du, B.; Zhao, X.; He, B. Study on the Forms and Adsorption Characteristics of Phosphorus in the Sediment of Pengxi River in the Three Gorges Reservoir Area and the Soil Phosphorus in the Drawdown Zone. Environ. Sci. 2013, 34, 1107–1113. [Google Scholar]
  44. Garcia-Ruiz, R.; Parra, G.; Guerrero, F.; Lucena, J. Sedimentation of phosphorus fractions and temporal variation in the C:P ratio in La Concepcion reservoir, southern Spain. N. Z. J. Mar. Freshw. Res. 2001, 35, 711–723. [Google Scholar] [CrossRef] [Green Version]
  45. Poister, D.; Armstrong, D.E. Seasonal sedimentation trends in a mesotrophic lake: Influence of diatoms and implications for phosphorus dynamics. Biogeochemistry 2003, 65, 1–13. [Google Scholar] [CrossRef]
  46. Brock, J.R.; Schulz-Vogt, H.N. Sulfide induces phosphate release from polyphosphate in cultures of a marine Beggiatoa strain. ISME J. 2010, 5, 497–506. [Google Scholar] [CrossRef] [PubMed]
  47. Chen, J.; Hanke, A.; Tegetmeyer, H.E.; Kattelmann, I.; Sharma, R.; Hamann, E.; Hargesheimer, T.; Kraft, B.; Lenk, S.; Geelhoed, J.S.; et al. Impacts of chemical gradients on microbial community structure. ISME J. 2017, 11, 920–931. [Google Scholar] [CrossRef] [PubMed]
  48. Schreiber, F.; Littmann, S.; Lavik, G.; Escrig, S.; Meibom, A.; Kuypers, M.M.M.; Ackermann, M. Phenotypic heterogeneity driven by nutrient limitation promotes growth in fluctuating environments. Nat. Microbiol. 2016, 1, 16055. [Google Scholar] [CrossRef] [PubMed] [Green Version]
  49. Liu, H.; Du, Y.; Deng, Y.; Ye, P.D. Semiconducting black phosphorus: Synthesis, transport properties and electronic applications. Chem. Soc. Rev. 2015, 44, 2732–2743. [Google Scholar] [CrossRef] [Green Version]
  50. Martinez, R.J.; Wu, C.H.; Beazley, M.J.; Andersen, G.L.; Conrad, M.E.; Hazen, T.C. Microbial Community Responses to Organophosphate Substrate Additions in Contaminated Subsurface Sediments. PLoS ONE 2014, 9, e100383. [Google Scholar] [CrossRef] [Green Version]
Figure 1. Location and sampling sites in the studied Sanshiliujiao Lake (Groups 1 and 2 represent rivers flowing into the studied lake and lake region).
Sustainability 13 11501 g001
Figure 2. The main process of the SMT method used to determine the fraction of phosphorus.
Sustainability 13 11501 g002
Figure 3. Total phosphorus (TP) concentration in the surface sediments from each sampling station.
Sustainability 13 11501 g003
Figure 4. Vertical profiles of P fractions in the sediment core collected in Sanshiliujiao Lake: (A) summer and (B) autumn.
Sustainability 13 11501 g004
Figure 5. The P fraction concentration of summer and autumn in Sanshiliujiao Lake. The lowercase letters in the figure indicate significant differences between different locations according to LSD test (p ≤ 0.05).
Sustainability 13 11501 g005
Figure 6. Adsorption kinetics of phosphate on the surface sediments in Sanshiliujiao Lake.
Sustainability 13 11501 g006
Figure 7. Phosphate adsorption-desorption isotherms for the sediments from Sanshiliujiao Lake.
Sustainability 13 11501 g007
Figure 8. Release/adsorption risks based on the EPC0-SRP concentration P.
Sustainability 13 11501 g008
Figure 9. Fitting curve of the TP concentration with depth.
Sustainability 13 11501 g009
Figure 10. Phylogenetic tree of PAOs from Sanshiliujiao Lake sediment sample based on ppk1 sequence.
Sustainability 13 11501 g010
Figure 11. Classification of lake eutrophication based on P deposition.
Sustainability 13 11501 g011
Table 1. Parameters of the kinetic equations used to fit the observed phosphate absorption in the sediment.
Siteln q = B + ktq = a + kt1/2q = a + b ln tln q = a + b ln t
BkR2akR2abR2abR2
S14.090.020.4651.777.260.8861.686.120.904.120.110.94
S34.180.020.3758.037.980.7168.267.550.944.200.110.93
S44.110.020.3752.727.600.8062.706.900.974.130.100.95
S54.100.020.3353.387.860.6863.347.560.954.120.120.93
S64.070.020.6254.736.520.7163.056.210.964.110.090.92
S74.070.020.4051.377.500.7261.116.960.924.090.110.92
Table 2. Isotherm parameters of phosphate adsorption on the surface sediments from Sanshiliujiao Lake.
SiteLangmuir ModelFreundlich Model
Qmax
(mg/g)
K
(L/mg)
cR2Kf1/nR2
S11.600.050.220.9990.080.70.993
S31.000.090.010.9970.080.770.984
S43.300.020.280.9960.070.730.987
S53.360.020.290.9940.070.710.990
S61.180.080.070.9990.080.770.986
S75.000.020.260.9960.080.760.988
Table 3. The phosphate adsorption isotherms and sediments parameters from Sanshiliujiao Lake.
PointaB (L/g)R2EPC0 (mg/L)NAP
(mg/kg)
S1−5.82105.120.960.065.82
S3−10.34127.620.950.0810.34
S4−13.4132.880.910.113.4
S5−6.68127.030.960.056.68
S6−6.7898.280.950.076.78
S7−8.67145.410.980.068.67
Table 4. The results of PAO T-RFs detected in the reservoir sediments in different seasons.
Seasons and SampleLength of T-RFs Fragments(bp)
SummerS3106 107 109 110 172 225 229 236 240 242 244 248 249 253 255 259 260 282 286 481
S143 48 62 63 65 92 102 107 110 112 126 132 135 140 181 224 228 230 232 236 238 243 245 246 247 251 252 253 262 264 294 319 321 322 474 476 562
AutumnS335 39 40 48 55 58 177 179 180 181 182 184
S138 46 54 57 176 178 179 180 181 183
Table 5. Diversity index of PAOs in different season’s sediment samples.
Seasons and SampleShannon IndexPielou IndexDominance Index
SummerS32.730.9160.790
S12.870.8340.765
AutumnS32.190.8760.691
S12.070.8900.674
Table 6. Content of the forms of phosphorus in the sediments of different seasons.
SampleFe/Al-P
(mg/kg)
Ca-P
(mg/kg)
IP
(mg/kg)
OP
(mg/kg)
TP
(mg/kg)
SummerS3215.4 ± 6.9 94.5 ± 4.5272.5 ± 2.5192.6 ± 1.2512.3 ± 7.2
S1129.9 ± 6.774.2 ± 2.9 199.1 ± 4.9159.3 ± 1.2362.1 ± 7.4
AutumnS3164.6 ± 6.588.7 ± 0.9 210.4 ± 2.4218.4 ± 1.2522.9 ± 7.0
S1152.6 ± 3.386.2 ± 1.4222.0 ± 9.4208.8 ± 3.5 503.7 ± 2.3
Publisher’s Note: MDPI stays neutral with regard to jurisdictional claims in published maps and institutional affiliations.

