Abstract
The main objective of this study was characterised by analysing the barriers associated with the insertion of sustainable practices in small and medium-sized companies in the metalworking sector, considering the Brazilian reality. Thirteen barriers were previously listed from the literature, and information about them was collected from 24 experienced managers who know the realities of small and medium-sized companies in the sector. Data were analysed using descriptive statistics. The frequency distribution showed that in each barrier, there was more than 50% of the responses allocated in the upper range, that is, medium or intense observation, demonstrating that SMEs experience many difficulties in this theme. When comparatively analysed via Fuzzy TOPSIS, difficulties associated with lack of knowledge and financial resources/incentives that can support SMEs in adopting sustainable practices are highlighted. The main contribution of this study is to provide robust information that company managers and other researchers can use. In addition, the provided information can support more complex debates for structuring public policies.
1. Introduction
Regardless of their size, companies are key factors in searching for a more sustainable future [1]. By adopting sustainable practices, they can contribute to the development of countries’ economies, innovation, and job creation, thus contributing in different aspects to the development of society [1].
The contributions of the companies to sustainable development are even more evident when the Sustainable Development Goals (SDGs) 9 and 12 are highlighted. They have direct relations with industry, production and sustainable consumption, and their targets present terms essential for sustainable development such as regional development, human well-being, employment generation, sustainable and inclusive economic growth, technological evolution, efficient use of resources, and encouragement of sustainable consumption, among others [2].
Focusing on Small and Medium Enterprises (SMEs), their role towards the development of nations should be highlighted. Generally, they are in greater quantity than the large companies in a country, and they contribute with a significant share of wealth and employment generation [3,4,5,6]. The classification of SMEs varies from each country; however, their general administrative characteristics are always very similar.
Despite its importance, it faces different management difficulties that prevent them from better performances [7]. Lewis et al. [8] mention as examples: lack of resources, underdeveloped strategic focus, lack of regulation, and lack of knowledge about sustainable concepts, among others. Marconatto et al. [3] and Razif et al. [4] highlight that difficulties faced by SMEs have become even more critical with the COVID-19 pandemic. Some impacts of the COVID-19 pandemic to SMEs can be cited: reduction of credit lines due to increased financial risks, and rapid depletion of financial reserves to deal with daily expenses, among others [3].
Denicolai et al. [9] advocates that internationalisation, digitisation and sustainability are characterised as the natural path for business growth, and this will not be different for SMEs. In this sense, the adoption of sustainable practices by them is necessary. Razif et al. [4] corroborate this statement when they argue that digitisation and sustainability are challenges to be overcome by SMEs. In short, it is observed that sustainability is highlighted in organisational models for SMEs.
Ahmad et al. [10] mention, however, that although models to SMEs consider sustainability as the “new normal”, this reality is not always presented in the quotidian of the companies localised in developing countries, as many barriers to adopting this kind of practice exist. According to Tilley [11], small and medium company managers always focus on short-term and financial returns; thus, they believe that sustainable practices do not bring returns for their companies.
Even in those SMEs that believe have sustainable practices, it is still possible to identify improvement opportunities in terms of their management. As an example, Hernández-Díaz [12] analysing the reality of Puerto Rican companies evidenced improvement opportunities associated with business models, creation of more innovative and sustainable products and services, and development of partnerships, among other actions.
When focused on the Brazilian context, the importance of SMEs is evident by their contribution to the GDP. In particular, SMEs present a significant relevance to the industrial sector in the country. In this sector, segments such as the metalworking sector have a long tradition and importance in the Brazilian economy and drive many SMEs [13]. As in large companies, it is increasingly necessary that Brazilian SMEs develop and progress accordingly to the sustainability concepts. Companies are interested in meeting this demand, however, there are many barriers to be faced by them to adopt sustainable practices. Logically, the barriers depend on the reality and context of each country and this study on Brazilian reality can be considered a research gap.
In this sense, the main objective of this study is characterised by analysing the barriers associated with the insertion of sustainable practices in small and medium-sized companies in the metalworking sector, considering the Brazilian reality. The main contribution of this study is to provide robust information that company managers and other researchers can use. In addition, the provided information can support more complex debates for structuring public policies.
In addition to this expanded introduction, the paper presents more three sections. Section two is dedicated to explaining methodological procedures, section three results and debates, section four conclusions and final considerations. References are listed at the end.
2. Methodological Procedures
The development of this research was performed through five well-defined stages, as shown in Figure 1. These stages are described in detail below.
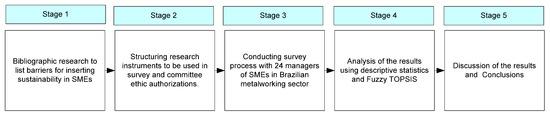
Figure 1.
Stages performed to develop the research (Source: authors).
In the first stage, bibliographic research was carried out to identify the barriers to the insertion of sustainability in small and medium-sized companies. To this end, the following terms were used with their possible combinations: barriers, difficulties, small companies, medium-sized companies, SMEs, sustainability, and sustainable practices. It should be noted that some synonyms for some words were used, as an example, for the company (enterprise, organisation). The main scientific bases were consulted and as result of this search, it was possible to obtain Table 1, which presents 13 barriers associated with the adoption of sustainable practices in SMEs.

Table 1.
Barriers to inserting sustainability in SMEs. Source: vide Table 1.
Considering the 13 barriers presented in Table 1, a questionnaire was structured and used to survey 24 managers of SMEs in the Brazilian metalworking sector (stage 2). The first part of the questionnaire focused on sample characterisation and the second part was regarding the analysis of the barriers. For each barrier, considering the metalworking sector as a whole, the respondents should assign one of the following options: “barrier not observed” (NO), “barrier observed subtly” (OS), “barrier observed on an average level” (OA), and “barrier intensely observed” (OI). It should be noted that, in Brazil, research involving people must be assessed by a research ethics committee before data collection, and this was done. The above ethics committee approved the research.
Stage 3 corresponded to the execution of the survey with 24 managers of SMEs in the Brazilian metalworking sector. Considering the argument of Chen [40], regarding the uncertainties on the answers of respondents of a survey, this scale was transformed into triangular fuzzy numbers (TFN) as presented in Figure 2.
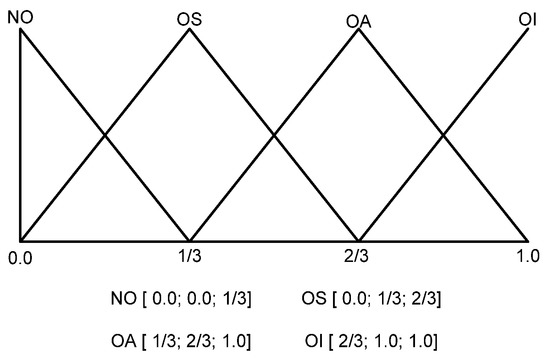
Figure 2.
The questionnaire scale transformed into triangular fuzzy numbers.
Analysing the characteristics of the 24 respondents, it was possible to notice that they are at different position levels in their companies (from engineers/coordinator to director), they have different levels of education (from technician to postgraduate), and different levels of experience (ranging from 14 to 45 years of experience in business management). Thus, they were classified into three levels, L3, L2 and L1, in which L3 is the level for those with the greatest ability to infer about the barriers presented for the sector and N1 is the level for those with the lowest ability to infer about the barriers presented. The authors made the classification of this article analysing the characteristics of the respondents, but as mentioned by Chen [40], this process also presents uncertainties; thus, the classifications were also considered using fuzzy triangular numbers, as shown in Figure 3.
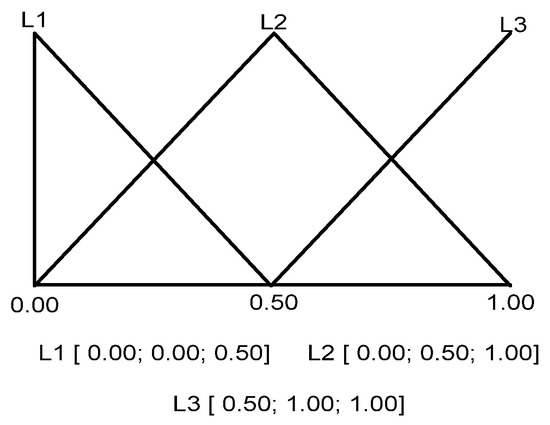
Figure 3.
Respondents’ classifications into levels through triangular fuzzy numbers.
Data analysis was conducted through descriptive statistics and the Fuzzy TOPSIS technique (stage 4), according to the guidelines of Chen [40]. For this, the first step was to define the Matrix , using the scores attributed by the respondents using TFN format and the vector that represents respondents’ levels of qualification also using TFN format.
It is necessary to normalise the Matrix in the next step. For this, data was normalised by the greatest value to make the greatest barrier the first in the rank. The Equation (1) was used in this step. From this procedure, the Matrix (matrix 3) is obtained.
In the sequence, Matrix is weighted by the vector , and the Matrix (Matrix 4) is developed.
Once the Matrix is obtained, the distances from each element to the positive and negative ideal solutions are calculated. In this case, the following positive and negative ideal solutions were used and , respectively. The calculus of the distances is calculated through Equation (2).
The total positive and negative distances concerning each alternative (in this study, “the barriers for sustainable practices adoption in SMEs of Brazilian metalworking sector”) is obtained through the sum of the partial distances, as evidenced in Equations (3) and (4). Finally, the closeness coefficient (CCi) that enables rank the alternatives is calculated using Equation (5).
The sensitivity analysis of the ordering created by Fuzzy TOPSIS was based on the guidelines developed by Memari et al. [41]. In the particular case of this research, respondents were classified according to their experiences in classes N1, N2 and N3. Regarding the traditional Fuzzy TOPSIS proposed by Chen (2000), in this study, the categories N1, N2 and N3 assume the role of the “criteria”. Thus, for the sensitivity analysis, three additional scenarios were analysed, in which the impact on the ranking was analysed in case one of the categories was totally omitted. Subsequently, the discussion and conclusions are done at the end of the article (stage 5).
3. Results and Debates
The first result to be presented here refers to the classification of respondents concerning their greater ability to infer on the barriers for inserting sustainable practices in SMEs. As previously mentioned, it is understood that in the extreme, those respondents in board positions that have postgraduate training and many years of experience in the sector present a greater knowledge on the subject and, consequently, they have a greater capacity for inference (they are at level L3). Using this logic for the other relationships, the 24 respondents were carefully analysed and classified according to the levels presented in Table 2.
Table 2.
Respondents’ classification according to their background. (Source: Research data).
Performing a frequency distribution analysis for each of the analysed barriers (see Table 3), it is possible to notice that more than 50% of the responses measured by the sample are in the “average observed” or “intensely observed” range, clearly showing that practically all barriers are present in the daily lives of SMEs in the Brazilian metalworking sector when they aim to introduce sustainable practices. In a general way, this result can be considered in line with statements presented by Ahmad et al. [10] when they argue that SMEs face many barriers to adopt sustainable practices in developing countries.
Table 3.
Frequency distribution of respondents’ answers for each barrier. Source: Research data.
Through the application of the Fuzzy TOPSIS technique, it was possible to carry out a comparative analysis between the barriers studied, considering the ability of each respondent to assess the topic and the uncertainties associated with their allocation at levels N1, N2 and N3 and the uncertainties inherent to the process of measuring responses in the survey, as previously mentioned [40]. Due to the matrices size, which present several lines and columns, it is not possible to present them here. Thus, it is presented the calculation of the distances of each of the elements of the matrix in relation to the positive and negative ideal distances. These distances are presented in Table 4 and Table 5. In these tables, the total positive and negative distances for each barrier are also presented.
Table 4.
Distances from each element of the matrix concerning the positive ideal solution and total distance for each barrier. Source: Research data.
Table 5.
Distances from each element of matrix concerning negative ideal solution and total distance for each barrier. Source: Research data.
Considering positive and negative total distances for each barrier, it was possible to calculate the closeness coefficients using these coefficients, it was possible to rank the barriers according to their difficulty level, based on respondents’ answers. The coefficients calculated for each barrier are presented in Table 6 and the rank of the analysed barriers is presented in Table 7.
Table 6.
Closeness coefficient for each barrier. Source: Research data.
Table 7.
Final rank of the barriers. Source: Research data.
To perform the sensitivity analysis, three scenarios were structured considering the combination of two classes of respondents and the exclusion of others. Therefore, the scenarios structures were: Scenario 1 (only data from respondents classes N2 and N3); Scenario 2 (only data from respondents classes N1 and N3); Scenario 3 (only data from respondents classes N1 and N2). As mentioned in Section 2, this sensitivity analysis procedure was based on the guidelines developed by Memari et al. [41]. As a result, it is possible to have a better idea of the influence of each class on the responses. The results of these scenarios are shown in Table 8.
Table 8.
Sensitivity analysis. Source: Research data.
Analysing the results obtained, via Table 7, in the first positions, there are difficulties B2 and B1 regarding the lack of knowledge and financial resources/incentives that can support SMEs in adopting sustainable practices.
These two barriers are broadly aligned with what the literature points out, not only for the adoption of sustainable practices, but for improvements in all aspects of management for SMEs. With small and overloaded work teams, it is not easy to achieve time to assimilate new knowledge, whether associated with innovation, sustainability, or any other concept. Furthermore, one of the characteristics of SMEs is that they have a more volatile reality, with more uncertain financial resources. In this way, managers end up prioritising resources for those needs they consider every day. It is also worth remembering, as mentioned [3,4], the COVID-19 pandemic further highlighted the uncertainties discussed above.
Next, the barriers associated with employees appear, especially those related to resistance to change and engagement; government deficiency in not encouraging the adoption of sustainable practices through regulations, difficulty in measuring risks and establishing partnerships. In the sequence, it is possible to observe a block composed of barriers that result from the daily consequences of SMEs and, finally, a block already has more specific characteristics.
When the sensitivity analysis is performed, the removal of the N1 category of respondents has very little influence on the ordering, only with a change in the positions between barriers 9 and 12. When removing the N2 category of respondents, it is observed that barrier 7 has the relevance increased. With the elimination of N3, the B6 barrier gains evidence. Overall, B2 and B1 are evidenced in all situations. As in the study of Memari et al. [41], the scenarios analysis is an essential part of Fuzzy TOPSIS analysis.
A suggestion to overcome many of the obstacles presented in this study would be to create a governmental program to train employees of the metalworking sector regarding sustainability knowledge and encouraging SMEs to adopt sustainable practices. As an example, an online government platform could be created for the training mentioned above and a tax incentive program. Small and medium-sized companies that encourage their employees to learn about sustainability and invest resources in sustainable practices in their processes could deduct part of these investments in taxes.
4. Conclusions and Final Considerations
The main objective of this study was to analyse the barriers associated with the insertion of sustainable practices in small and medium-sized companies in the metalworking sector. Considering the Brazilian reality and face the results presented, it is possible to note that it was achieved.
The main conclusion is that the Brazilian SMEs of the metalworking sector face considerable barriers to adopt sustainable practices and, comparatively, the lack of knowledge related to sustainable practices and the resources to implant them are highlighted. Other difficulties are also present and, as a possible way to overcome all of them, we propose structuring a government program to train employees of this kind of companies regarding sustainability knowledge and incentives for SMEs that invest in sustainable practices.
The study presented in this article has an exploratory character, it was carried out from information provided by experienced managers who have been acting in the metalworking sector for many years, having already experienced both good times and periods of crisis. They broadly expressed their opinion about the sector, but this can still be understood as a research limitation and we presented here.
As a future study possibility, we recommended carrying out case studies with SMEs adopting sustainable practices to better understand the details of each barrier. In addition, debates about other possible forms to overcome the barriers presented here can be explored by future studies.
Author Contributions
Conceptualisation, G.C.d.O.J., J.d.S.P. and R.A.; methodology, G.C.d.O.J., J.d.S.P. and R.A.; validation, G.C.d.O.J., J.d.S.P. and R.A.; formal analysis, G.C.d.O.J., J.d.S.P. and R.A.; investigation, G.C.d.O.J.; resources, R.A.; data curation, G.C.d.O.J.; writing—original draft preparation, G.C.d.O.J., J.d.S.P., I.S.R., W.L.F., M.P.S. and R.A.; writing—review and editing, G.C.d.O.J., I.S.R., W.L.F., M.P.S. and R.A.; supervision, J.d.S.P. and R.A.; project administration, R.A. All authors have read and agreed to the published version of the manuscript.
Funding
This work was supported by the Conselho Nacional de Desenvolvimento Científico e Tecnológico (CNPq), under the grant 307536/2018-1.
Institutional Review Board Statement
The project of this study and the research instrument used were submitted and approved by a research ethics committee of the University of Campinas (Certificate of Ethical Appreciation Presentation (CAAE) number 39132420.1.0000.5404).
Informed Consent Statement
Informed consent was obtained from all subjects involved in the study.
Data Availability Statement
The raw data of the findings presented are available from the corresponding author [R.A.] on request.
Conflicts of Interest
The authors declare no conflict of interest.
References
- UN The SDGs Explained for Business. Available online: https://www.unglobalcompact.org/sdgs/about (accessed on 1 September 2021).
- UN Transforming Our World: The 2030 Agenda for Sustainable Development. Available online: https://sdgs.un.org/2030agenda (accessed on 6 January 2021).
- Marconatto, D.A.B.; Teixeira, E.G.; Peixoto, G.A.; Faccin, K. Weathering the storm: What successful SMEs are doing to beat the pandemic. Manag. Decis. 2021. [Google Scholar] [CrossRef]
- Razif, M.; Miraja, B.A.; Persada, S.F.; Nadlifatin, R.; Belgiawan, P.F.; Perwira Redi, A.A.N.; Lin, S.-C. Investigating the role of environmental concern and the unified theory of acceptance and use of technology on working from home technologies adoption during COVID-19. Entrep. Sustain. Issues 2020, 8, 795–808. [Google Scholar] [CrossRef]
- Muñoz-Pascual, L.; Galende, J.; Curado, C. Contributions to Sustainability in SMEs: Human Resources, Sustainable Product Innovation Performance and the Mediating Role of Employee Creativity. Sustainability 2021, 13, 2008. [Google Scholar] [CrossRef]
- Gorondutse, A.H.; Arshad, D.; Alshuaibi, A.S. Driving sustainability in SMEs’ performance: The effect of strategic flexibility. J. Strateg. Manag. 2020, 14, 64–81. [Google Scholar] [CrossRef]
- Ayuso, S.; Navarrete-Báez, F.E. How Does Entrepreneurial and International Orientation Influence SMEs’ Commitment to Sustainable Development? Empirical Evidence from Spain and Mexico. Corp. Soc. Responsib. Environ. Manag. 2018, 25, 80–94. [Google Scholar] [CrossRef]
- Lewis, K.V.; Cassells, S.; Roxas, H. SMEs and the Potential for A Collaborative Path to Environmental Responsibility. Bus. Strateg. Environ. 2015, 24, 750–764. [Google Scholar] [CrossRef] [Green Version]
- Denicolai, S.; Zucchella, A.; Magnani, G. Internationalization, digitalization, and sustainability: Are SMEs ready? A survey on synergies and substituting effects among growth paths. Technol. Forecast. Soc. Chang. 2021, 166, 120650. [Google Scholar] [CrossRef]
- Ahmad, N.; Mahmood, A.; Han, H.; Ariza-Montes, A.; Vega-Muñoz, A.; Din, M.U.; Iqbal Khan, G.; Ullah, Z. Sustainability as a “New Normal” for Modern Businesses: Are SMEs of Pakistan Ready to Adopt It? Sustainability 2021, 13, 1944. [Google Scholar] [CrossRef]
- Tilley, F. Small firms’ environmental ethics: How deep do they go? Small Mediu. Enterp. Environ. Bus. Imp. 2017, 35–48. [Google Scholar] [CrossRef]
- Hernández-Díaz, A.; Calderón-Abreu, T.; Castro-Gonzáles, S.; Portales-Derbez, L. Exploring the sustainability of SMEs: The Puerto Rican case. Environ. Dev. Sustain. 2021, 23, 8212–8233. [Google Scholar] [CrossRef]
- CNI Perfil da Industria Brasileira. Available online: https://industriabrasileira.portaldaindustria.com.br/ (accessed on 12 August 2021).
- Cassells, S.; Lewis, K. SMEs and environmental responsibility: Do actions reflect attitudes? Corp. Soc. Responsib. Environ. Manag. 2011, 18, 186–199. [Google Scholar] [CrossRef]
- Walker, H.; Di Sisto, L.; McBain, D. Drivers and barriers to environmental supply chain management practices: Lessons from the public and private sectors. J. Purch. Supply Manag. 2008, 14, 69–85. [Google Scholar] [CrossRef]
- Gadenne, D.L.; Kennedy, J.; McKeiver, C. An Empirical Study of Environmental Awareness and Practices in SMEs. J. Bus. Ethics 2009, 84, 45–63. [Google Scholar] [CrossRef]
- Hasan, M.N. Measuring and understanding the engagement of Bangladeshi SMEs with sustainable and socially responsible business practices: An ISO 26000 perspective. Soc. Responsib. J. 2016, 12, 584–610. [Google Scholar] [CrossRef] [Green Version]
- Hillary, R. Environmental management systems and the smaller enterprise. J. Clean. Prod. 2004, 12, 561–569. [Google Scholar] [CrossRef]
- Mathiyazhagan, K.; Govindan, K.; NoorulHaq, A.; Geng, Y. An ISM approach for the barrier analysis in implementing green supply chain management. J. Clean. Prod. 2013, 47, 283–297. [Google Scholar] [CrossRef]
- Mudgal, R.K.; Shankar, R.; Talib, P.; Raj, T. Modelling the barriers of green supply chain practices: An Indian perspective. Int. J. Logist. Syst. Manag. 2010, 7, 81. [Google Scholar] [CrossRef]
- Santos, M. CSR in SMEs: Strategies, practices, motivations and obstacles. Soc. Responsib. J. 2011, 7, 490–508. [Google Scholar] [CrossRef]
- Shrivastava, P. The Role of Corporations in Achieving Ecological Sustainability. Acad. Manag. Rev. 1995, 20. [Google Scholar] [CrossRef]
- Studer, S.; Welford, R.; Hills, P. Engaging Hong Kong businesses in environmental change: Drivers and barriers. Bus. Strateg. Environ. 2006, 15, 416–431. [Google Scholar] [CrossRef]
- Jenkins, H. A Critique of Conventional CSR Theory: An SME Perspective. J. Gen. Manag. 2004, 29, 37–57. [Google Scholar] [CrossRef]
- Ghadge, A.; Kaklamanou, M.; Choudhary, S.; Bourlakis, M. Implementing environmental practices within the Greek dairy supply chain. Ind. Manag. Data Syst. 2017, 117, 1995–2014. [Google Scholar] [CrossRef]
- Lawrence, S.R.; Collins, E.; Pavlovich, K.; Arunachalam, M. Sustainability practices of SMEs: The case of NZ. Bus. Strateg. Environ. 2006, 15, 242–257. [Google Scholar] [CrossRef]
- Rutherfoord, R.; Blackburn, R.A.; Spence, L.J. Environmental management and the small firm. Int. J. Entrep. Behav. Res. 2000, 6, 310–326. [Google Scholar] [CrossRef]
- Diabat, A.; Kannan, D.; Mathiyazhagan, K. Analysis of enablers for implementation of sustainable supply chain management—A textile case. J. Clean. Prod. 2014, 83, 391–403. [Google Scholar] [CrossRef]
- Tilley, F. Small-Firm Environmental Strategy. Greener Manag. Int. 1999, 25, 67. [Google Scholar]
- van Hemel, C.; Cramer, J. Barriers and stimuli for ecodesign in SMEs. J. Clean. Prod. 2002, 10, 439–453. [Google Scholar] [CrossRef]
- Masurel, E. Why SMEs invest in environmental measures: Sustainability evidence from small and medium-sized printing firms. Bus. Strateg. Environ. 2007, 16, 190–201. [Google Scholar] [CrossRef]
- Ammenberg, J.; Hjelm, O. Tracing business and environmental effects of environmental management systems?a study of networking small and medium-sized enterprises using a joint environmental management system. Bus. Strateg. Environ. 2003, 12, 163–174. [Google Scholar] [CrossRef]
- Govindan, K.; Khodaverdi, R.; Jafarian, A. A fuzzy multi criteria approach for measuring sustainability performance of a supplier based on triple bottom line approach. J. Clean. Prod. 2013, 47, 345–354. [Google Scholar] [CrossRef]
- Shi, H.; Peng, S.Z.; Liu, Y.; Zhong, P. Barriers to the implementation of cleaner production in Chinese SMEs: Government, industry and expert stakeholders’ perspectives. J. Clean. Prod. 2008, 16, 842–852. [Google Scholar] [CrossRef]
- Roberts, S.; Lawson, R.; Nicholls, J. Generating Regional-Scale Improvements in SME Corporate Responsibility Performance: Lessons from Responsibility Northwest. J. Bus. Ethics 2006, 67, 275–286. [Google Scholar] [CrossRef]
- Ghazilla, R.A.R.; Sakundarini, N.; Abdul-Rashid, S.H.; Ayub, N.S.; Olugu, E.U.; Musa, S.N. Drivers and Barriers Analysis for Green Manufacturing Practices in Malaysian SMEs: A Preliminary Findings. Procedia CIRP 2015, 26, 658–663. [Google Scholar] [CrossRef] [Green Version]
- Noci, G.; Verganti, R. Managing ‘green’ product innovation in small firms. R&D Manag. 1999, 29, 3–15. [Google Scholar] [CrossRef]
- Revell, A.; Blackburn, R. The business case for sustainability? An examination of small firms in the UK’s construction and restaurant sectors. Bus. Strateg. Environ. 2007, 16, 404–420. [Google Scholar] [CrossRef]
- Simpson, M.; Taylor, N.; Barker, K. Environmental responsibility in SMEs: Does it deliver competitive advantage? Bus. Strateg. Environ. 2004, 13, 156–171. [Google Scholar] [CrossRef]
- Chen, C.-T. Extensions of the TOPSIS for group decision-making under fuzzy environment. Fuzzy Sets Syst. 2000, 114, 1–9. [Google Scholar] [CrossRef]
- Memari, A.; Dargi, A.; Akbari Jokar, M.R.; Ahmad, R.; Abdul Rahim, A.R. Sustainable supplier selection: A multi-criteria intuitionistic fuzzy TOPSIS method. J. Manuf. Syst. 2019, 50, 9–24. [Google Scholar] [CrossRef]
Publisher’s Note: MDPI stays neutral with regard to jurisdictional claims in published maps and institutional affiliations. |
© 2021 by the authors. Licensee MDPI, Basel, Switzerland. This article is an open access article distributed under the terms and conditions of the Creative Commons Attribution (CC BY) license (https://creativecommons.org/licenses/by/4.0/).