
A Multi-Dimensional Clustering Applied to Classify the Typology of Urban Public Parks in Bangkok Metropolitan Area, Thailand


Abstract
:1. Introduction
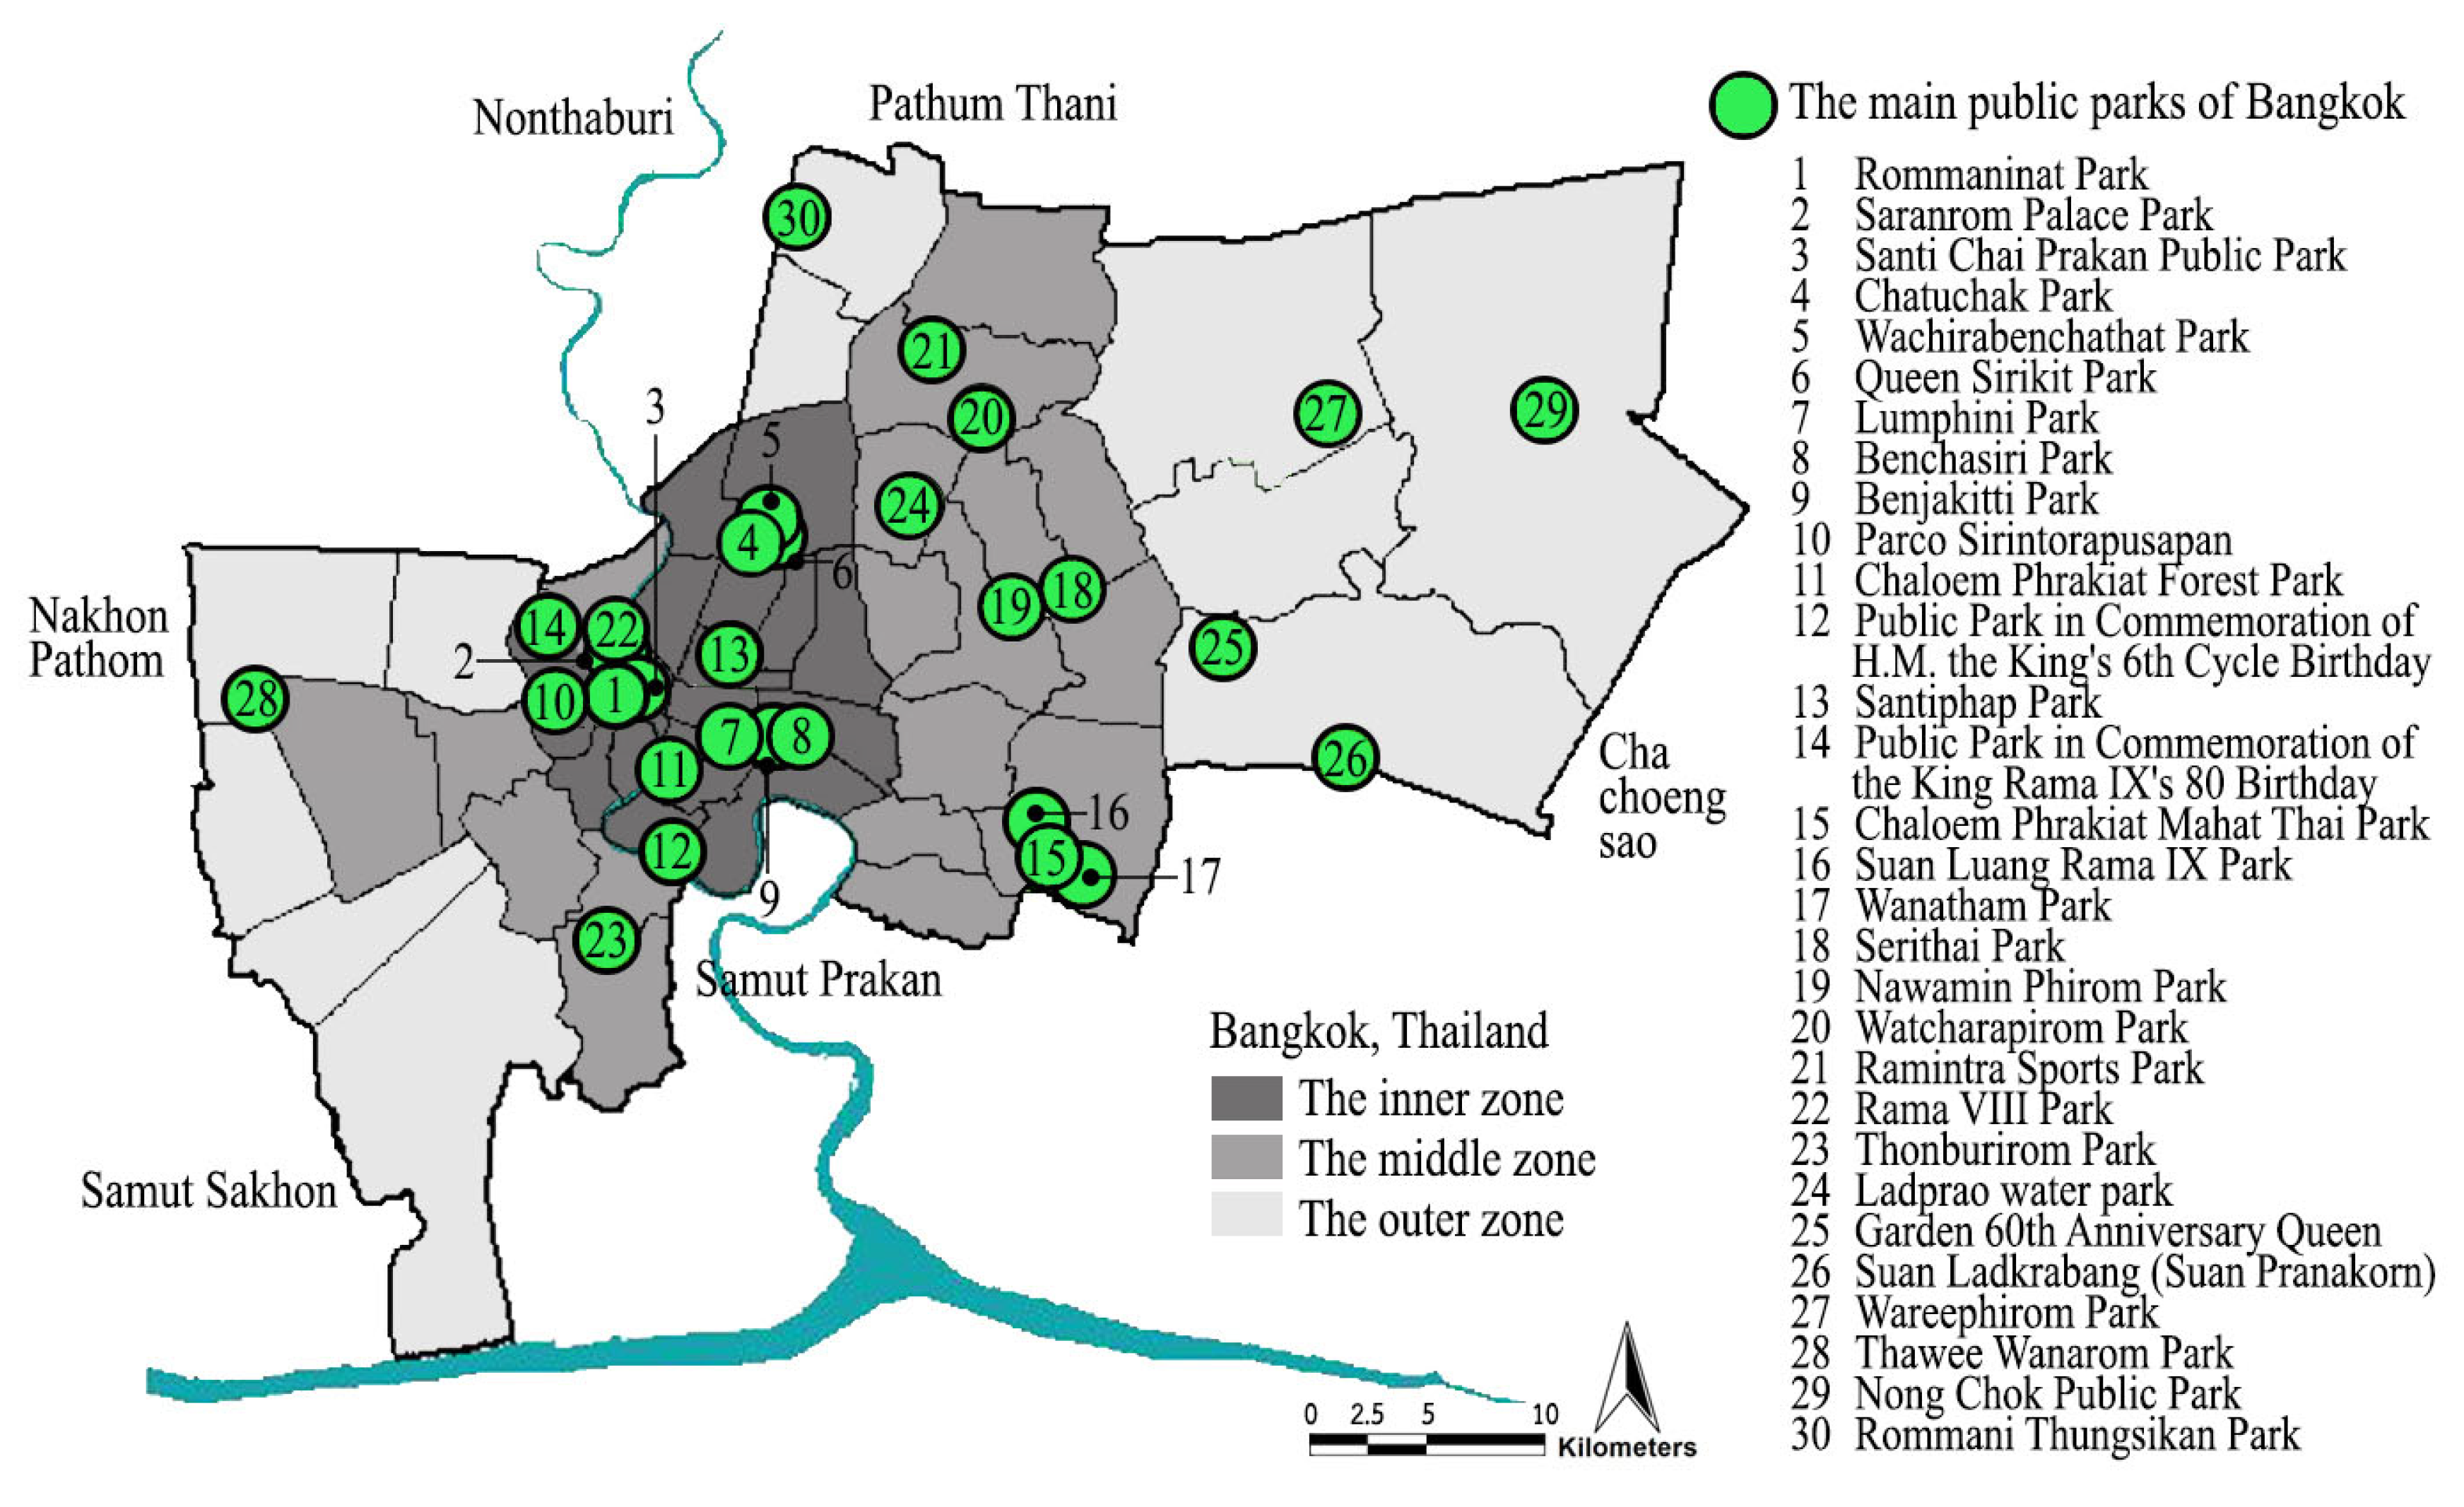
2. Study Area
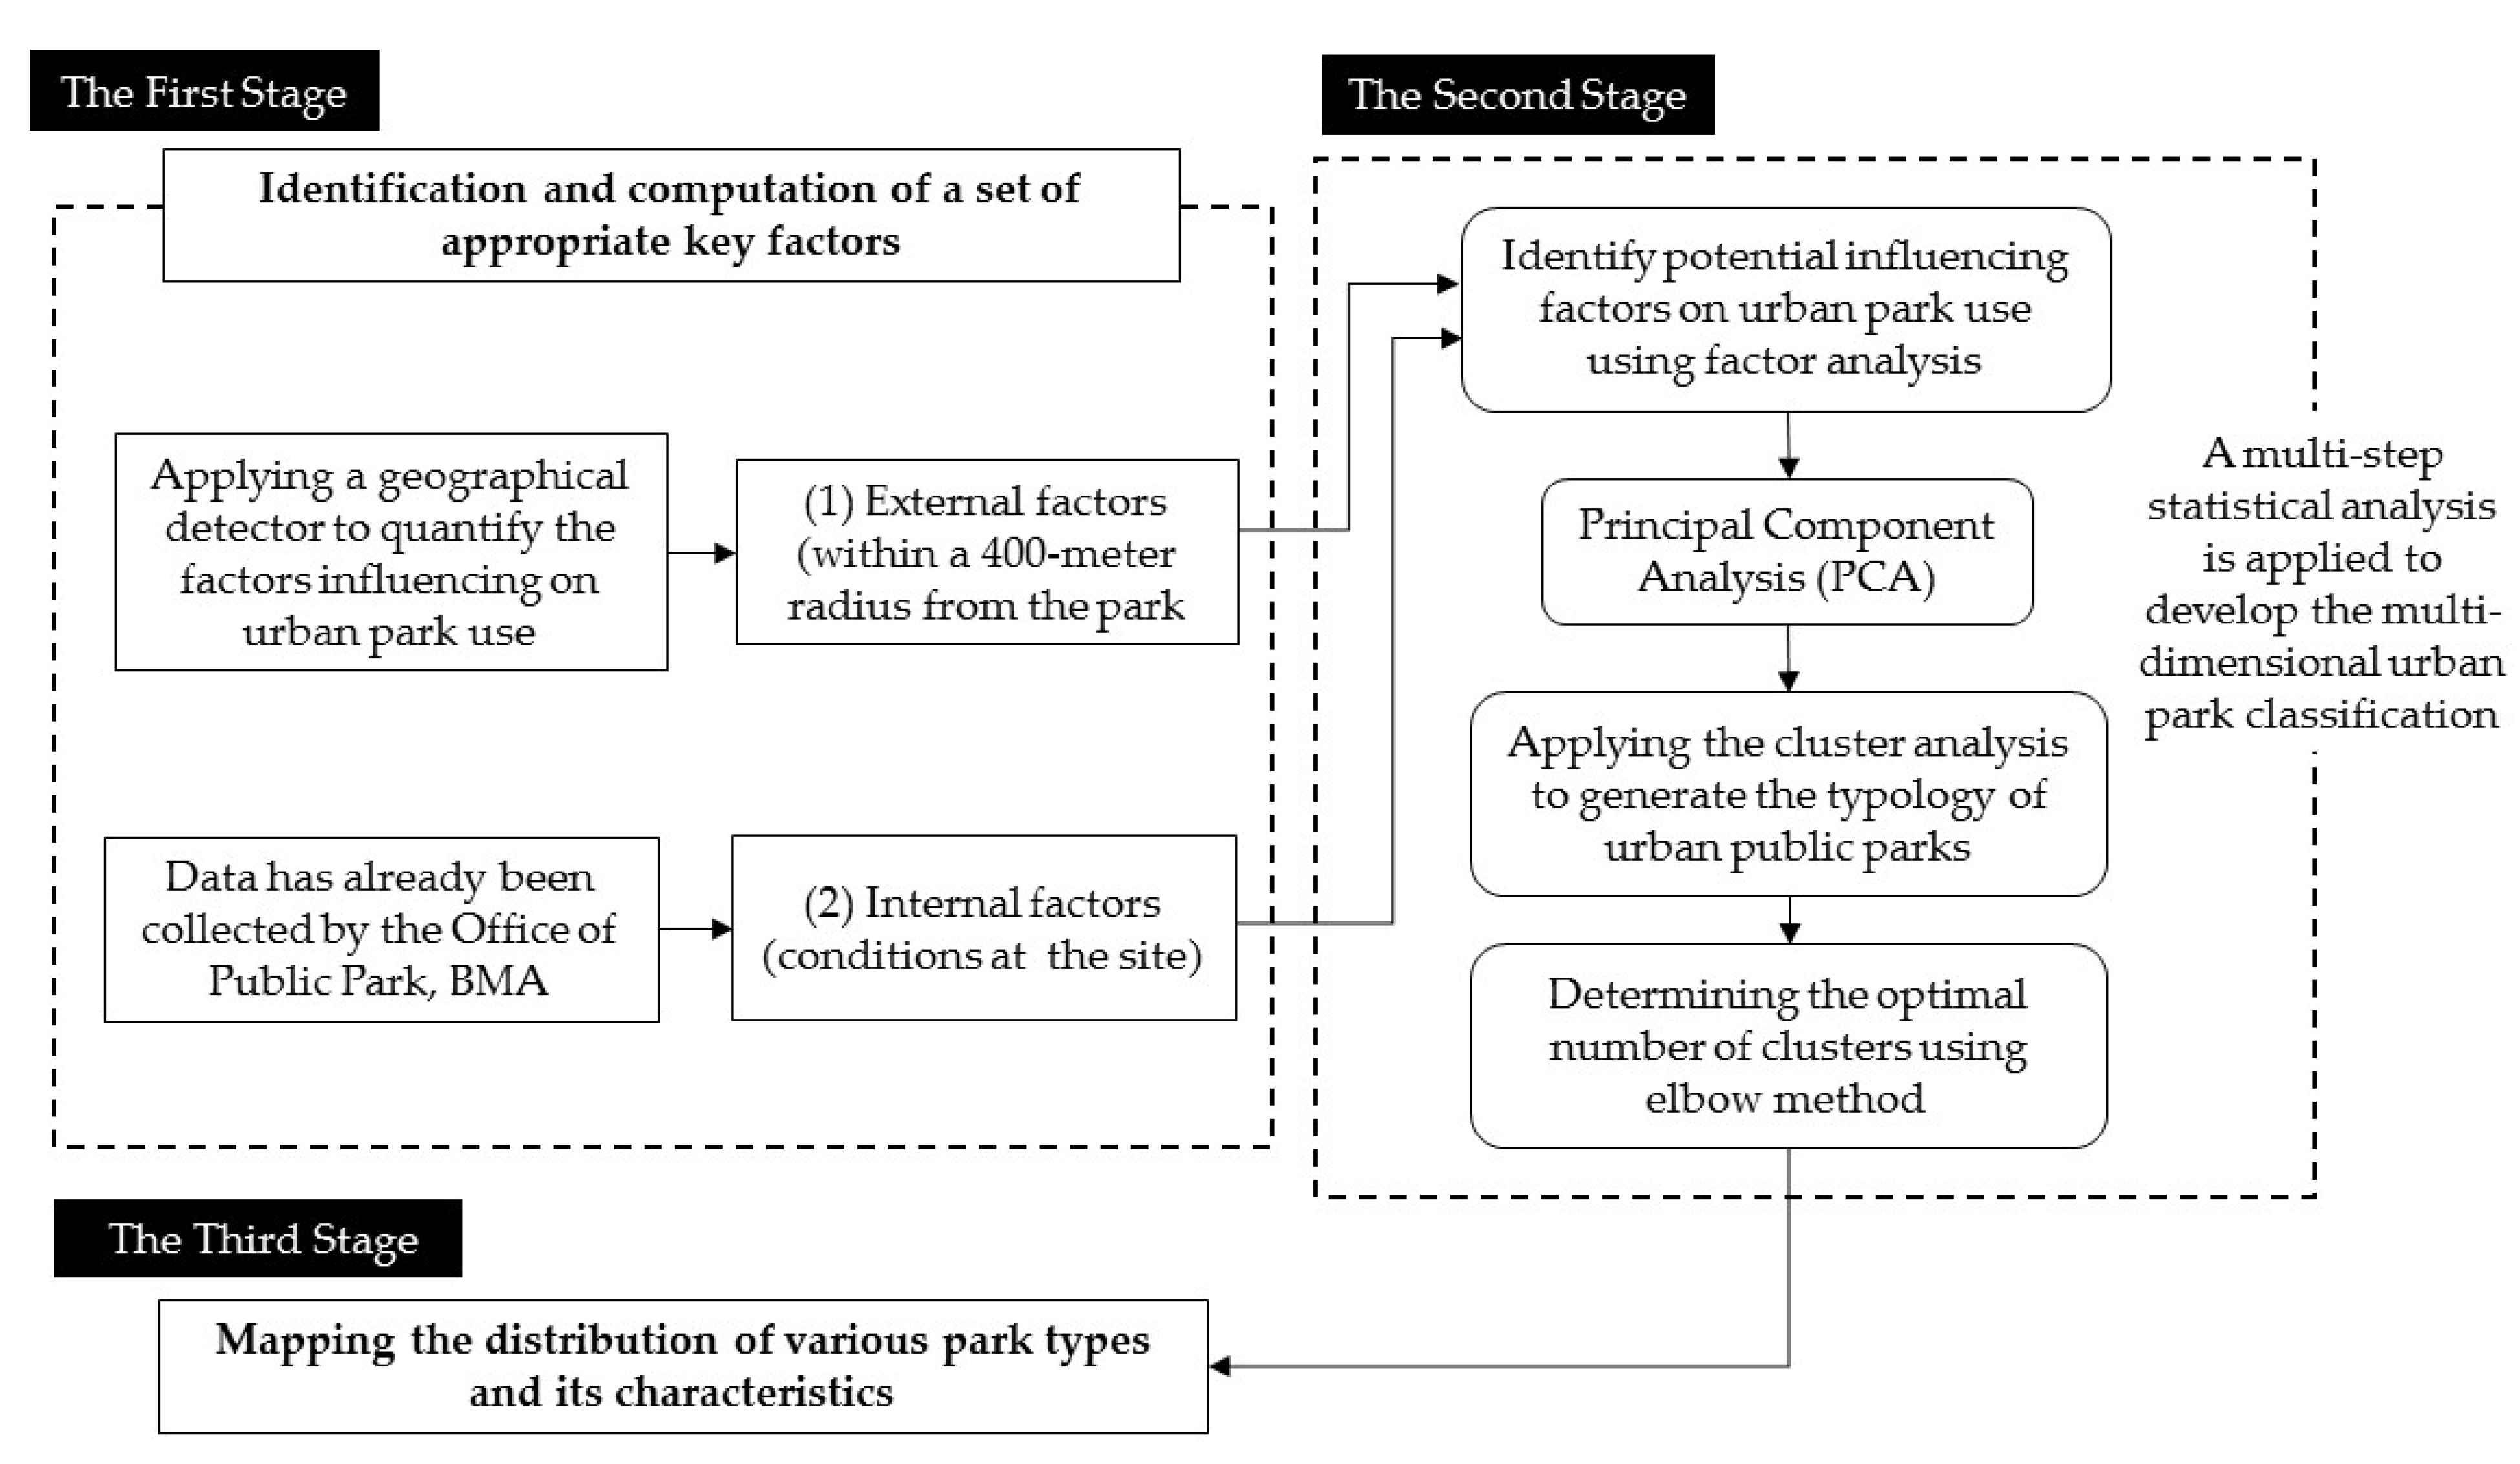
3. Methodology and Study Framework
3.1. Potential Influencing Factors on Urban Park Use
3.1.1. External Factors
3.1.2. Internal Factors
3.2. Factor Analysis and Urban Park Classification
4. Results
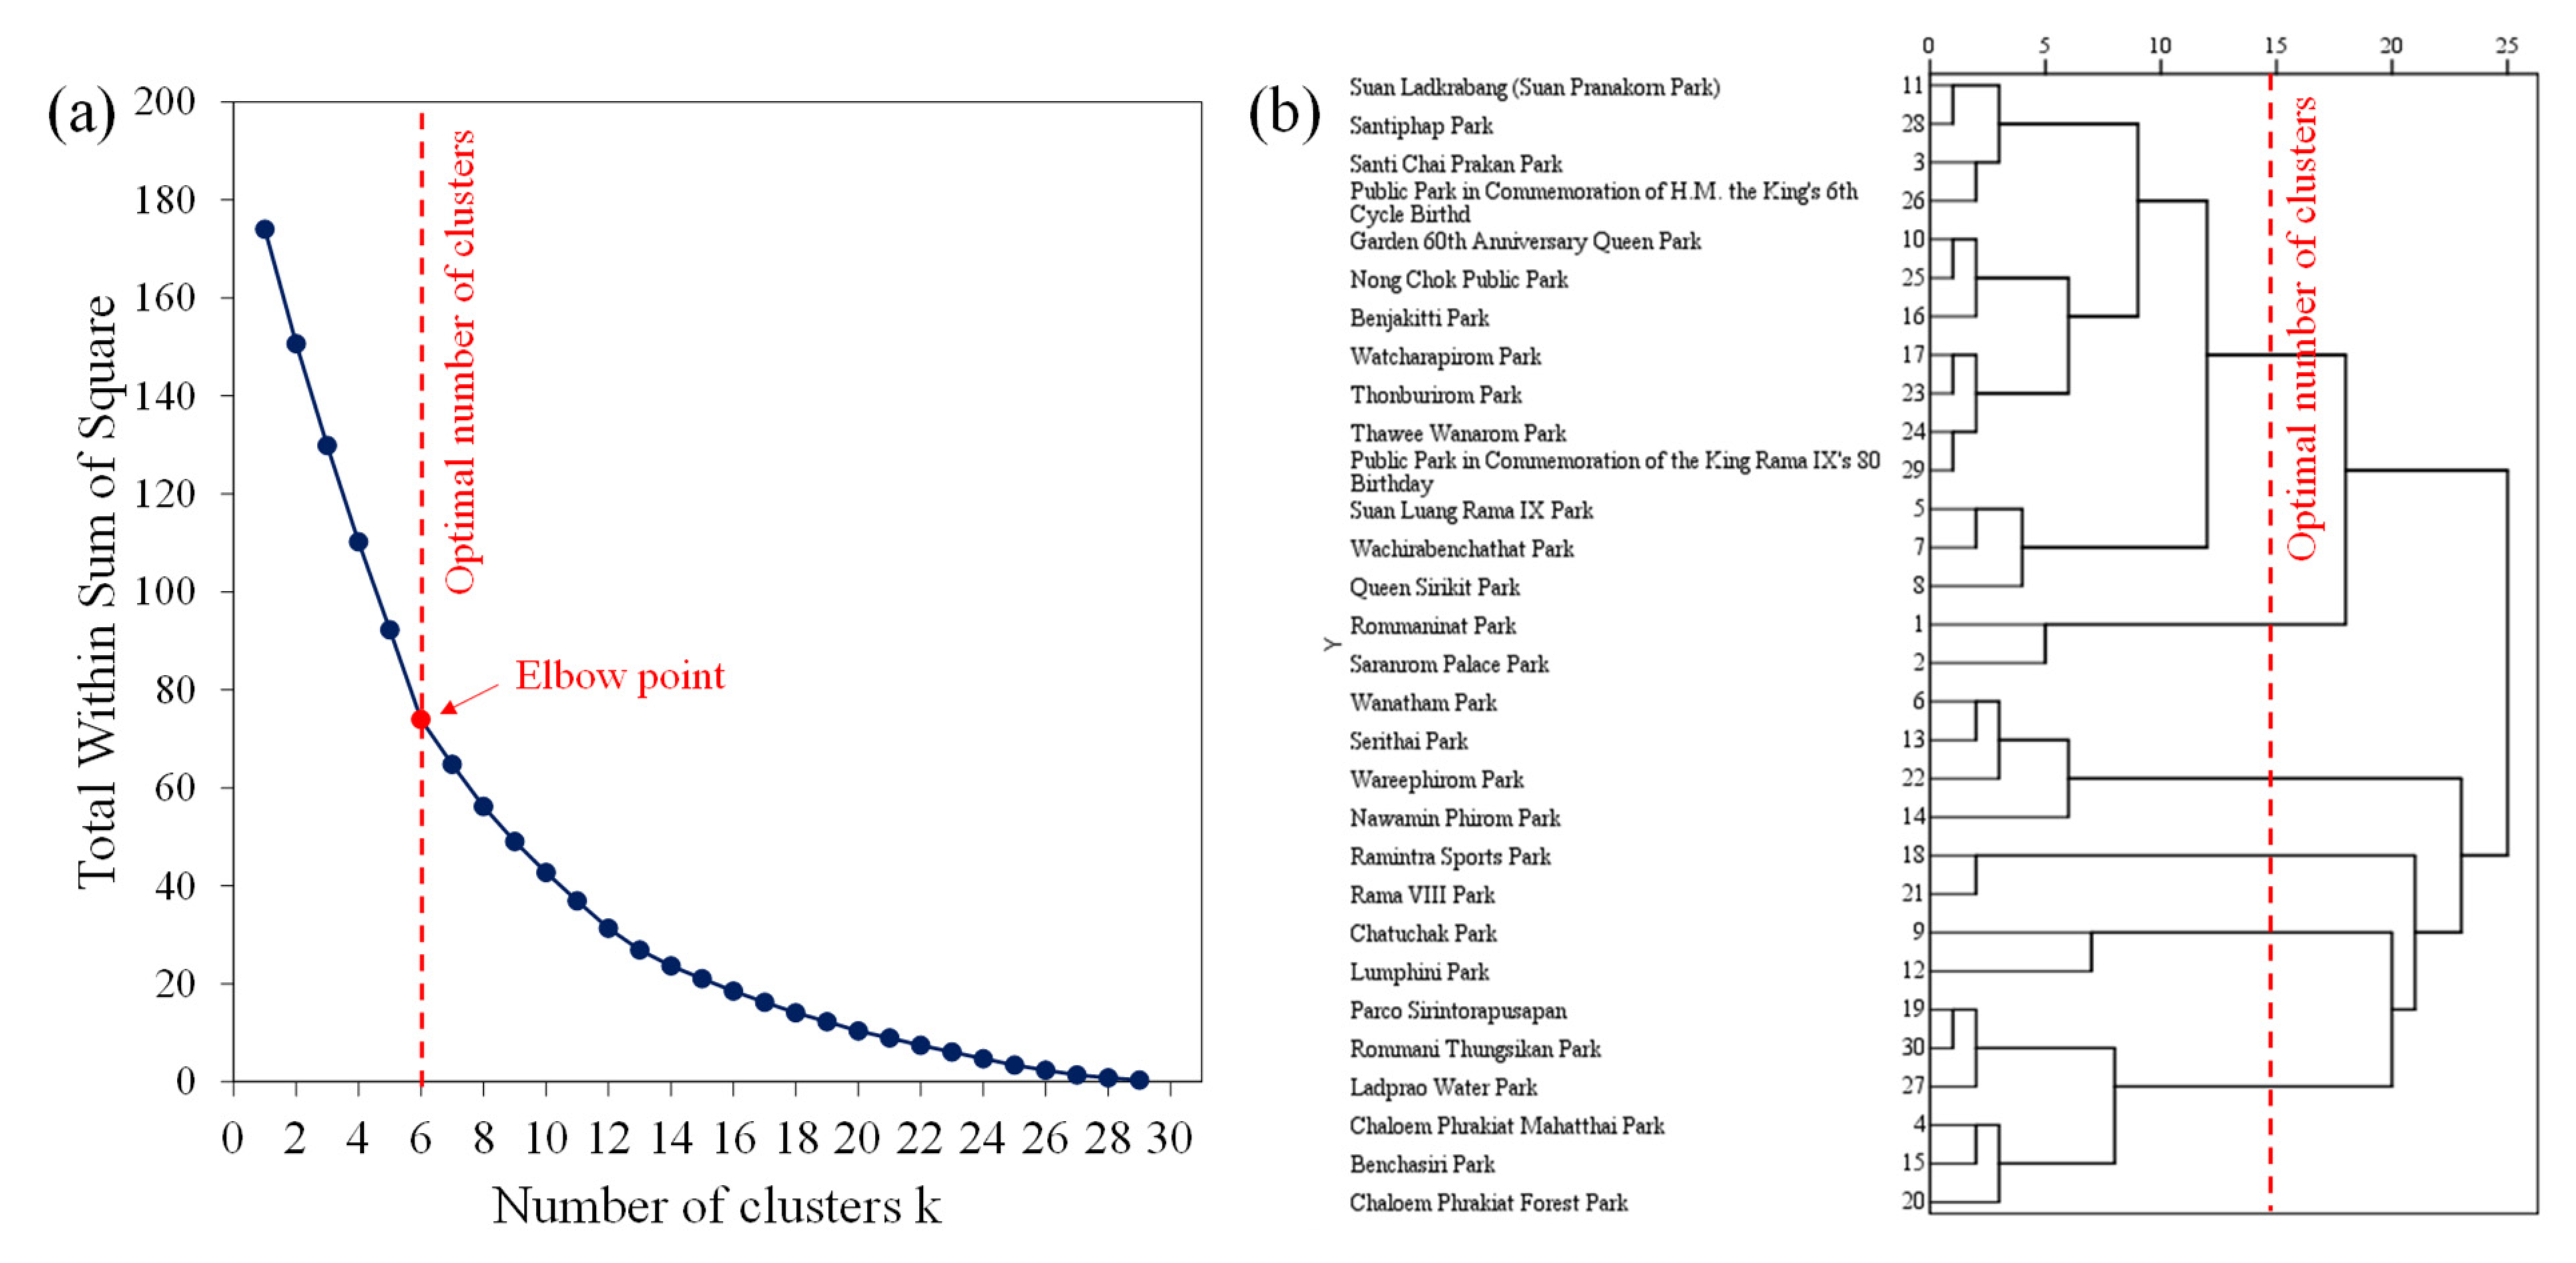
4.1. Identifying the Influencing Factors
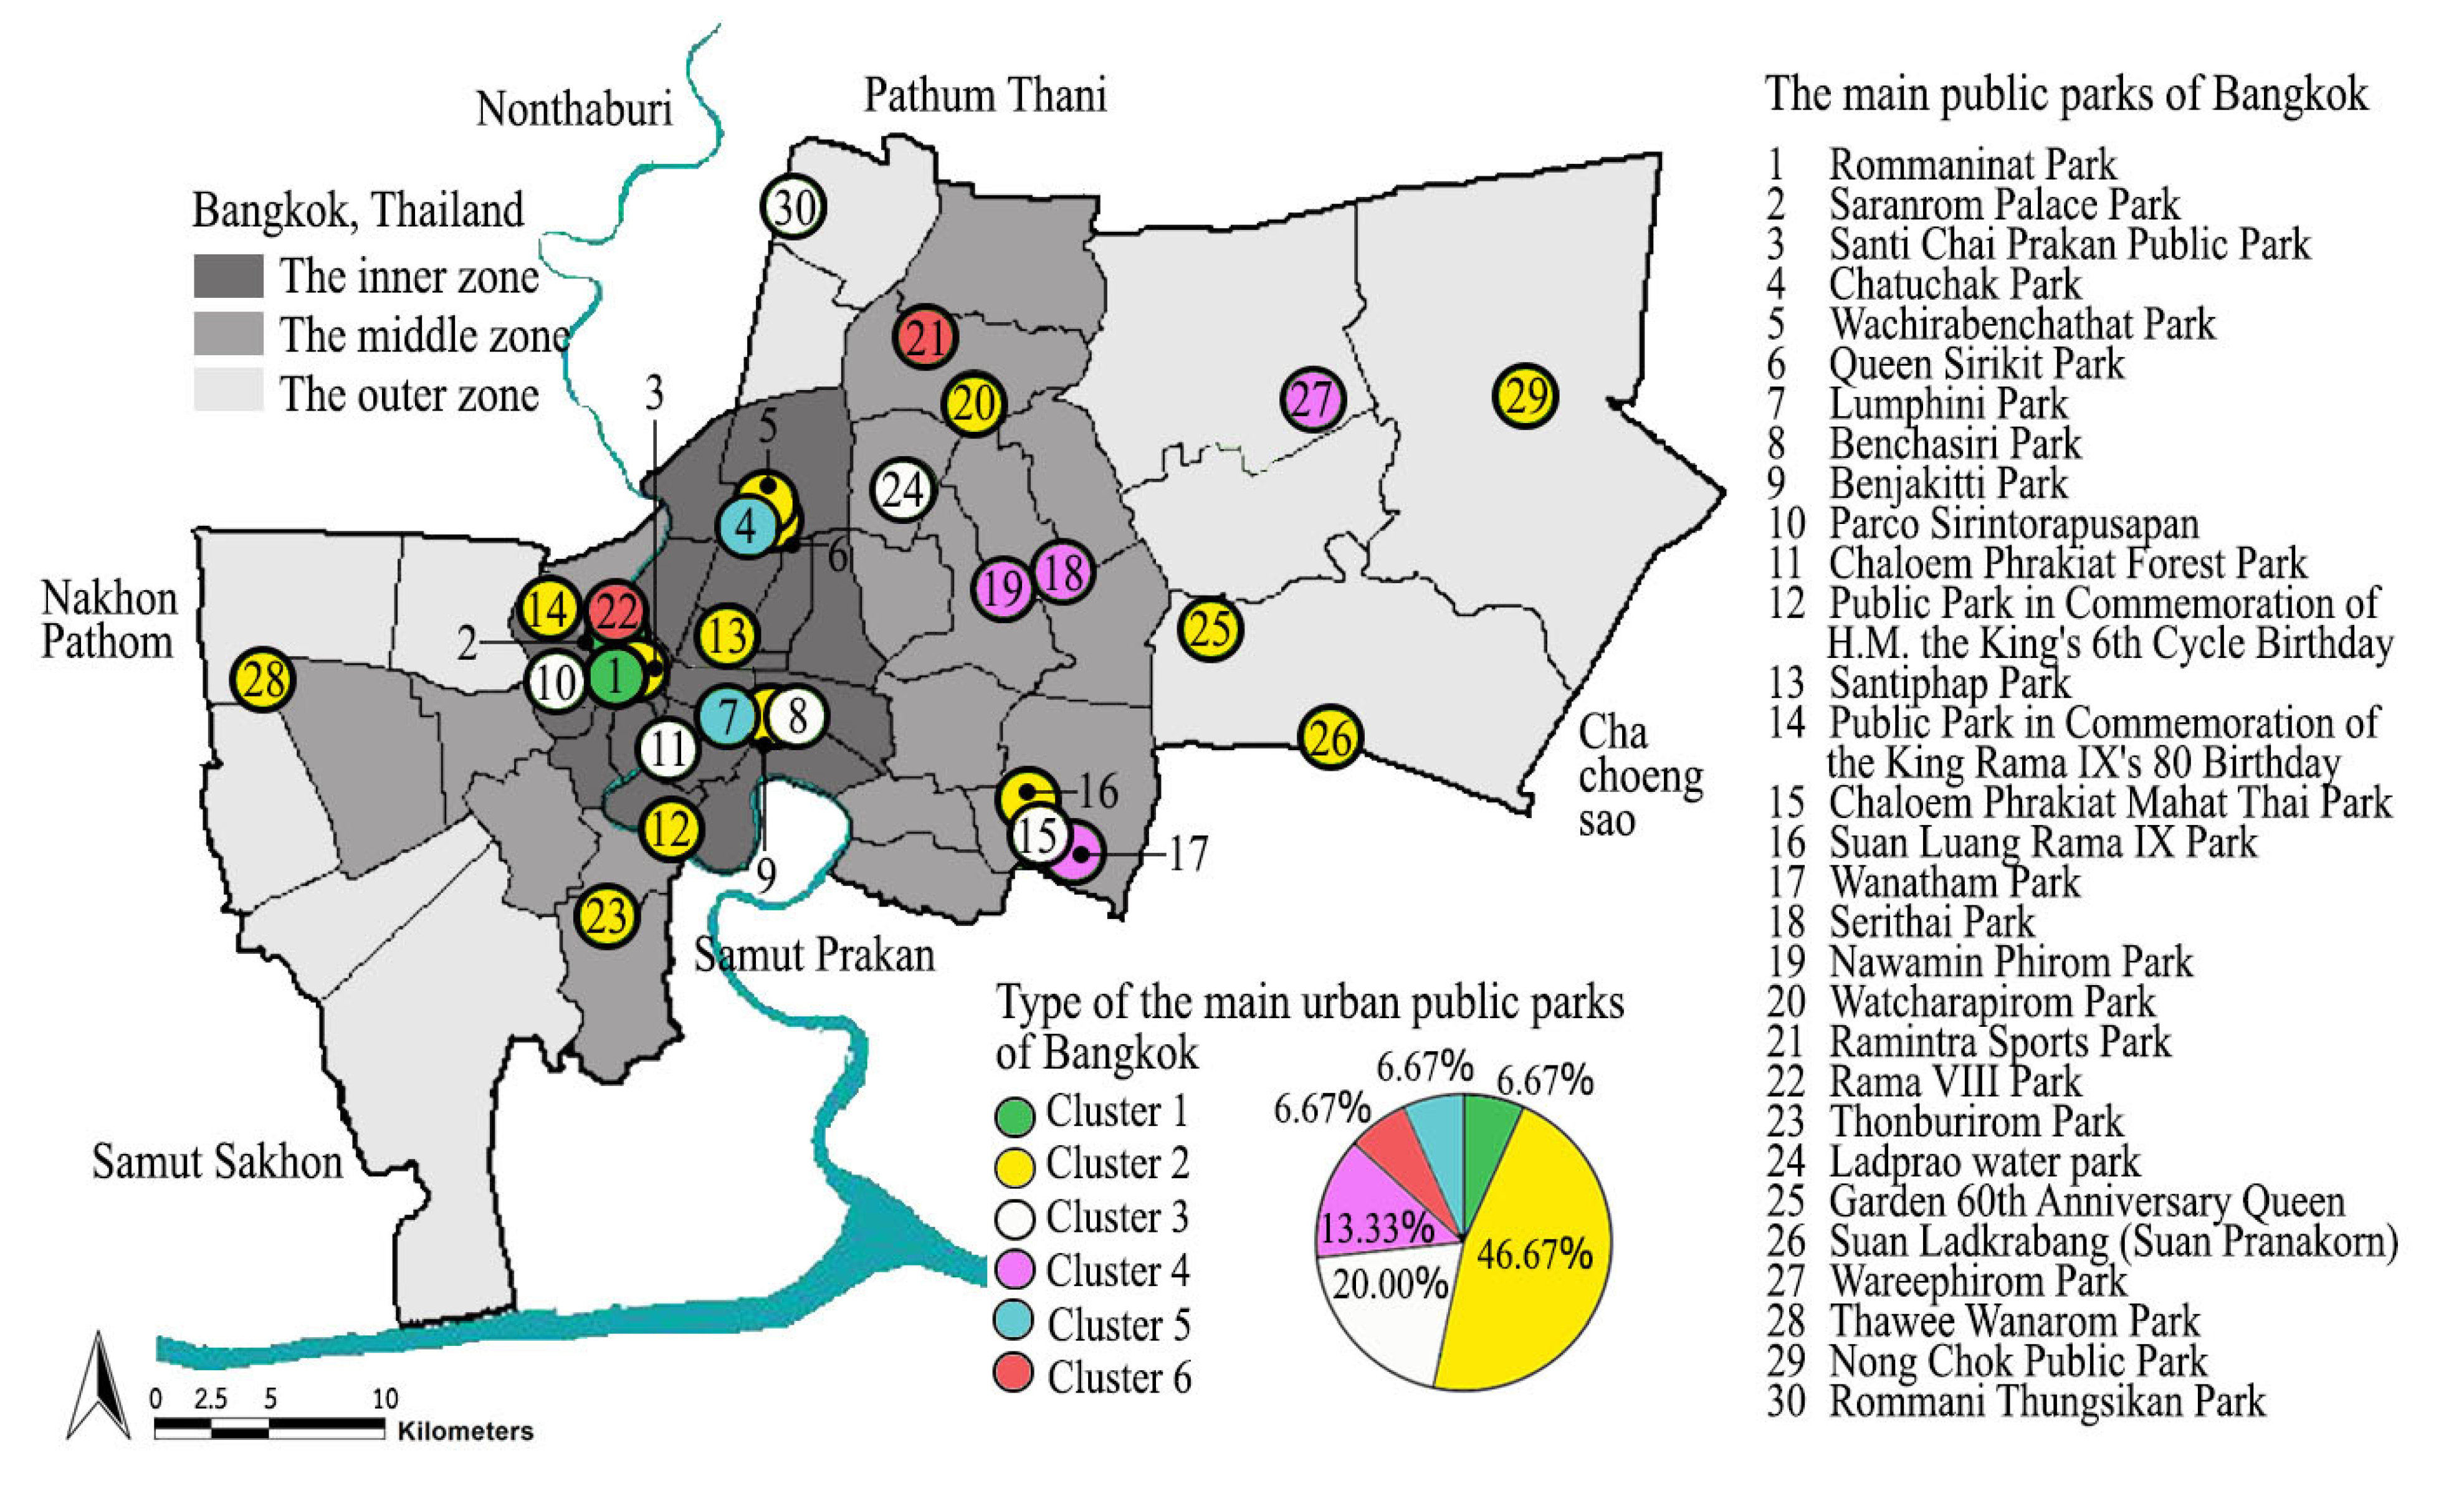
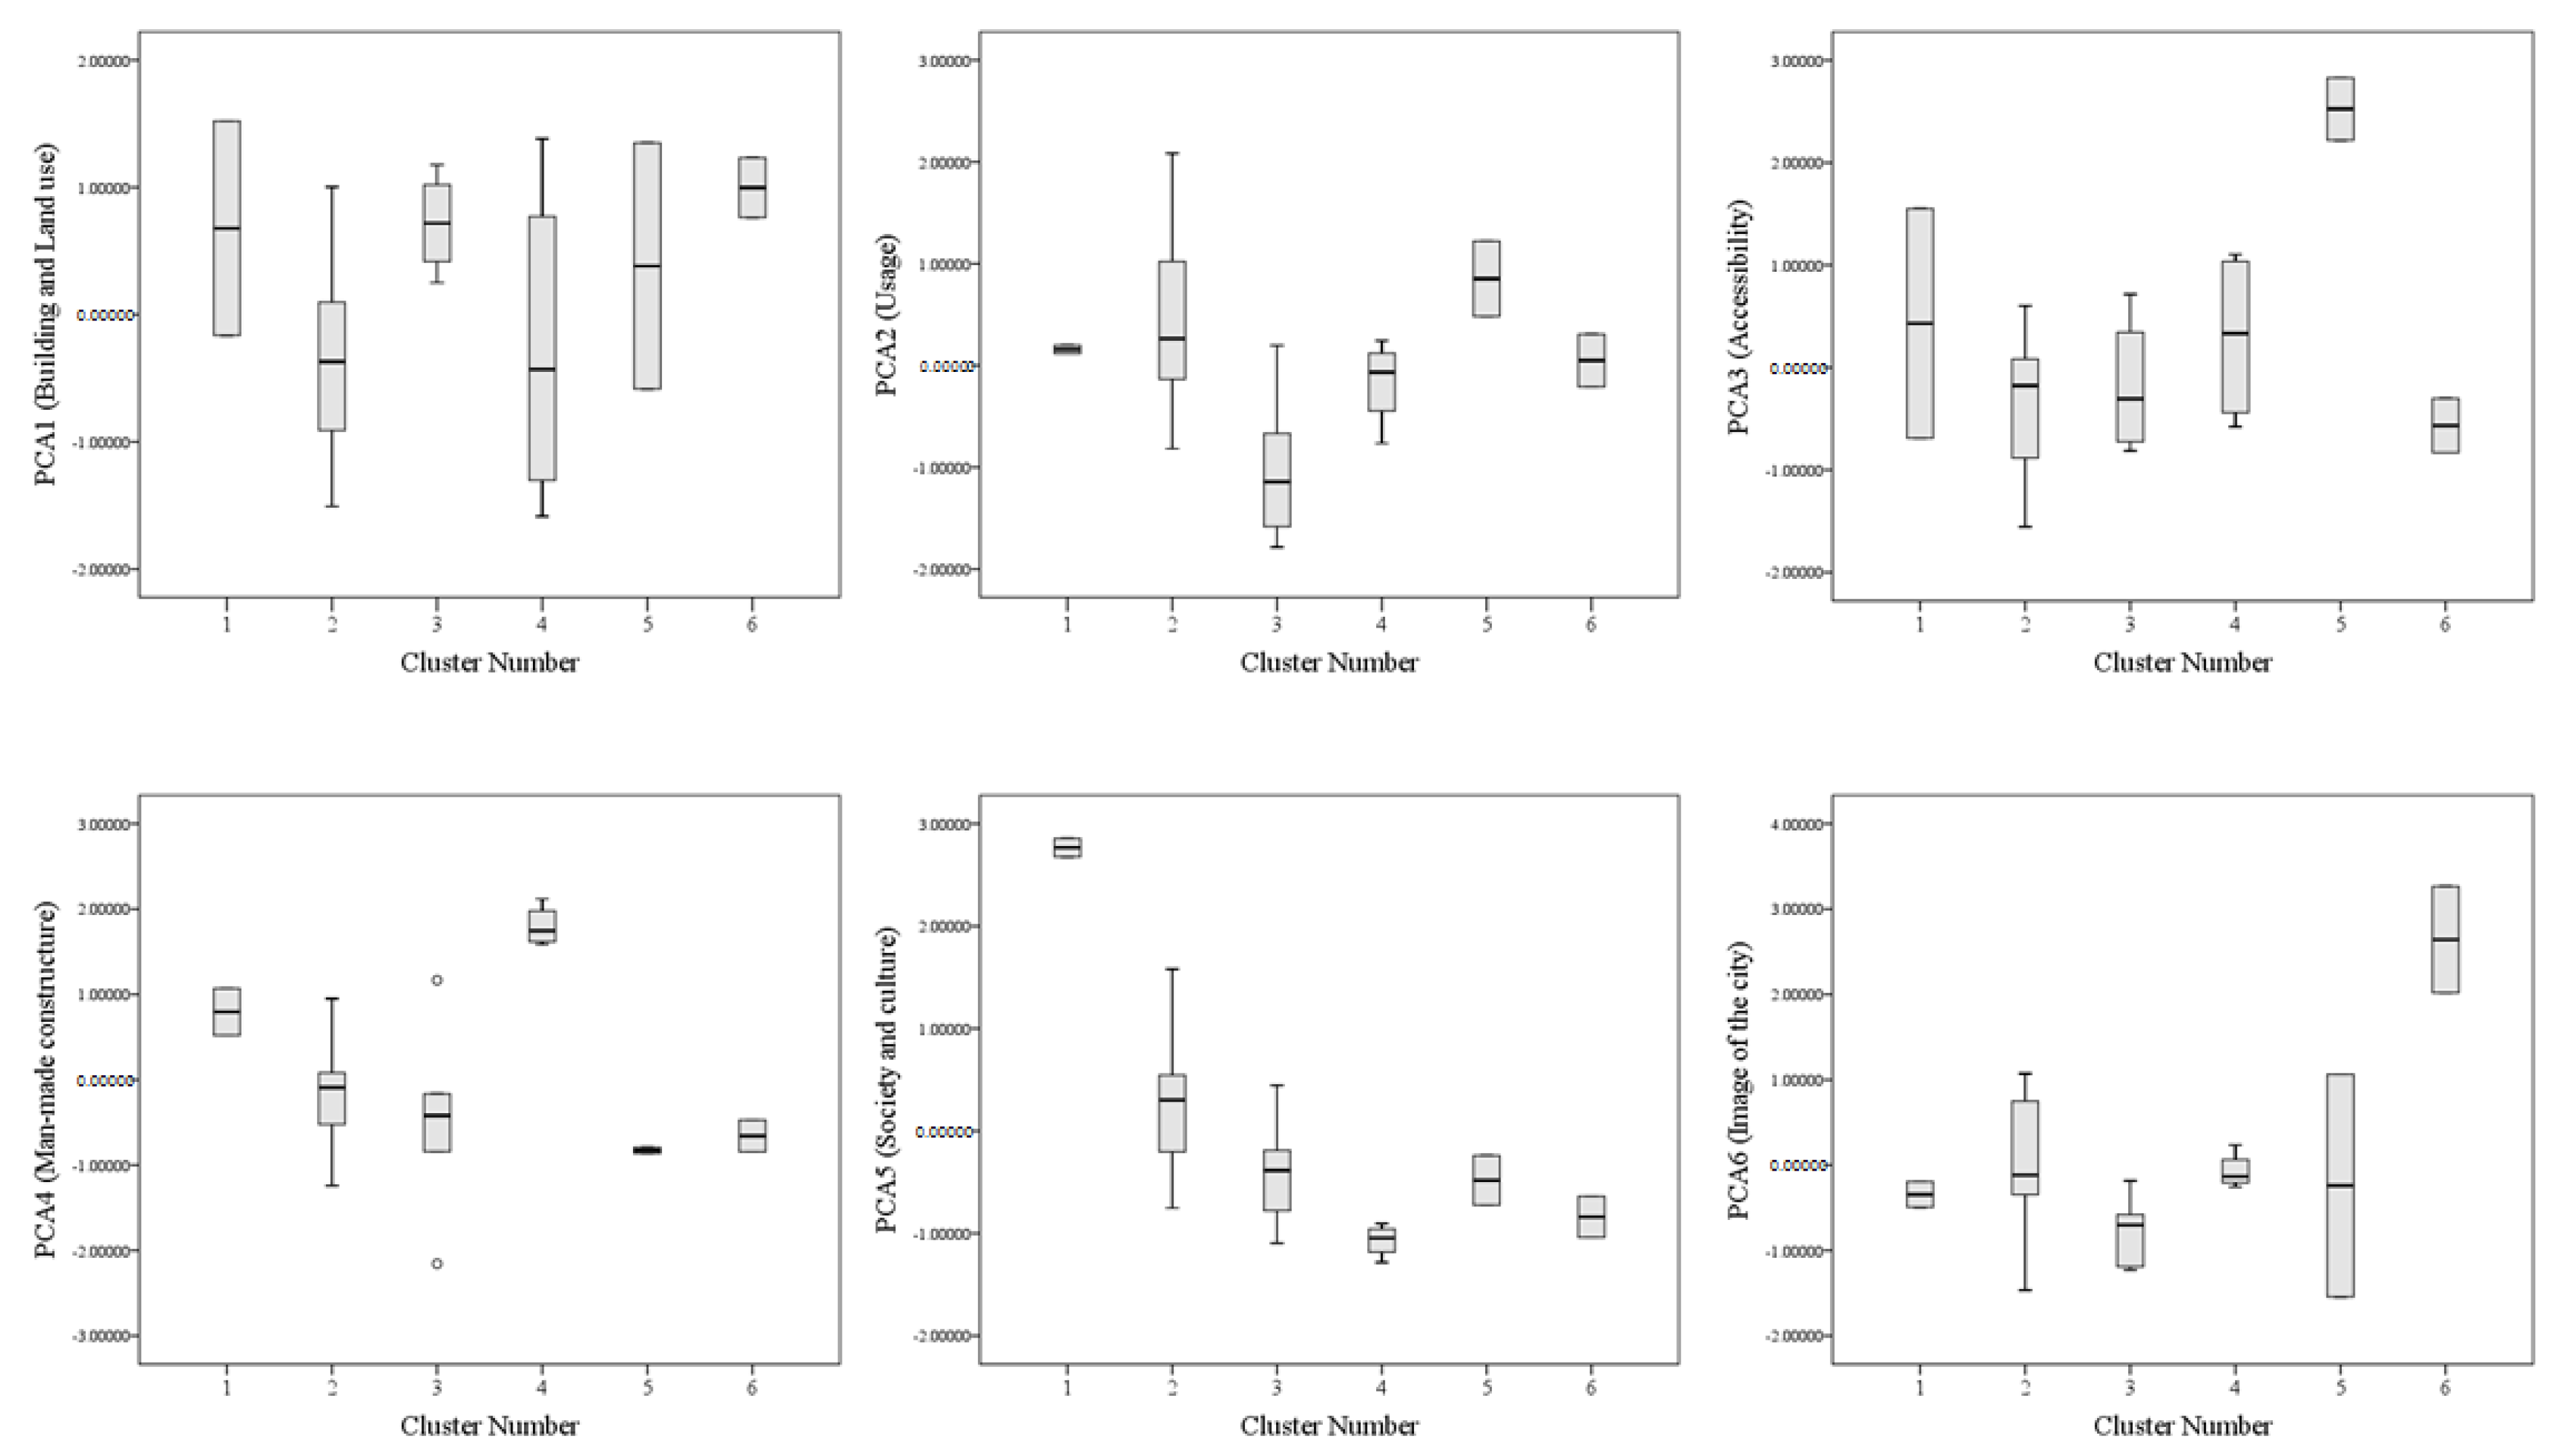
4.2. Classification of the Typology of Urban Public Parks and Their Characteristics
5. Discussion
6. Conclusions
Author Contributions
Funding
Institutional Review Board Statement
Informed Consent Statement
Data Availability Statement
Acknowledgments
Conflicts of Interest
References
- Jacobs, J. The Death and Life of Great American Cities; Random House: New York, NY, USA, 1961; pp. 89–112. [Google Scholar]
- Lynch, K. A Theory of Good City Form; The MIT Press: London, UK, 1981; pp. 293–318. [Google Scholar]
- Mumford, L. The Cultures of Cities; Harcourt Brace Jovanovich: New York, NY, USA, 1970; pp. 51–58. [Google Scholar]
- Mensch, J. Public Space: Continental Philosophy Review; Springer Nature Switzerland AG: Cham, Switzerland, 2007; Volume 40, pp. 31–47. [Google Scholar]
- Olanescu, O.S.; Agachi, M.I. Public Space as a Sustainable Built Environment Feature. Acta Tech. Napoc. Civ. Eng. Archit. 2015, 58, 154–159. [Google Scholar]
- Loures, L.; Santos, R.; Panagopoulos, T. Urban parks and sustainable city planning-The case of Portimão, Portugal. WSEAS Trans. Environ. Dev. 2007, 3, 171–180. [Google Scholar]
- Marcus, C.; Francis, C. PEOPLE PLACES: Design Guidelines for Urban Open Space, 2nd ed.; John Willey & Sons: New York, NY, USA, 1998; pp. 85–89. [Google Scholar]
- Madanipour, A. WHOSE PUBLIC SPACE? International Case Studies in Urban Design and Development; Routledge: New York, NY, USA, 2010; pp. 49–55. [Google Scholar]
- Kongphunphin, C.; Iamtrakul, P. Roles of Public Spaces in Transition: Case Study of Thailand. J. Fac. Archit. King Monkut’s Inst. Technol. Ladkrabang 2019, 26, 30–40. [Google Scholar]
- Carmona, M.; Tiesdell, S.; Heath, T.; Oc, T. Public Places-Urban Spaces: The Dimensions of Urban Design, 2nd.; Architectural Press: Burlington, MA, USA, 2010; pp. 89–95. [Google Scholar]
- Bolund, P.; Hunhammar, S. Ecosystem services in urban areas. Ecol. Econ. 1999, 29, 293–301. [Google Scholar] [CrossRef]
- Crane, P.; Kinzig, A. Nature in the metropolis. Sci. Am. Assoc. Adv. Sci. 2005, 308, 1225–1226. [Google Scholar] [CrossRef] [Green Version]
- Gaston, K.J.; Warren, P.H.; Thompson, K.; Smith, R.M. Urban domestic gardens (IV): The Extent of the Resource and its Associated Features. Biodivers. Conserv. 2005, 14, 3327–3349. [Google Scholar] [CrossRef]
- Smith, R.M.; Gaston, K.J.; Warren, P.H.; Thompson, K. Urban domestic gardens (V): Relationships between landcover composition, housing and landscape. Landsc. Ecol. 2005, 20, 235–253. [Google Scholar] [CrossRef]
- Panagopoulos, T. Using Microclimatic Landscape Design to Create Thermal Comfort and Energy Efficiency. Actas da 1a Conferencia sobre Edificios Eficientes Universidade do Algarve 2008, 25, 1–4. [Google Scholar]
- Twohig-Bennett, C.; Jones, A. The health benefits of great outdoors: A systematic review and meta-analysis of greenspace exposure and health outcomes. Environ. Res Natl. Libr. Med. 2018, 166, 628–637. [Google Scholar] [CrossRef] [PubMed]
- Amani-Beni, M.; Zhang, B.; Xie, G.; Xu, J. Impact of urban park’s tree, grass and waterbody on microclimate in hot summer days: A case study of Olympic Park in Beijing, China. Urban For. Urban Green. 2018, 32, 1–6. [Google Scholar] [CrossRef]
- Transforming Our World: The 2030 Agenda for Sustainable Development. Available online: http://www.un.org/ga/search/view_doc.asp?symbol=A/RES/70/1&Lang=E (accessed on 26 August 2020).
- Wu, J.; Plantinga, A.J. The influence of public open space on urban spatial structure. J. Environ. Econ. Manag. 2003, 46, 288–309. [Google Scholar] [CrossRef]
- Placemaking with Project for Public Spaces. Available online: https://www.pps.org/pdf/pps_brochure.pdf (accessed on 24 August 2020).
- Oliveira, V. Urban Morphology: An Introduction to the Study of the Physical Form of Cities; Springer International Publishing: Cham, Switzerland, 2016; pp. 142–145. [Google Scholar]
- Brown, G.; Schebella, M.F.; Weber, D. Using participatory GIS to measure physical activity and urban benefits. Landsc. Urban Plan 2014, 121, 34–44. [Google Scholar] [CrossRef]
- Donahue, M.L.; Keeler, B.L.; Wood, S.A.; Fisher, D.M.; Hamstead, Z.A.; McPlearson, T. Using social media to understand drivers of urban park visitation in the Twin Cities, MN. Landsc. Urban Plan. 2018, 175, 1–10. [Google Scholar] [CrossRef]
- Koohsari, M.J.; Mavoa, S.; Villanueva, K.; Sugiyama, T.; Badland, H.; Kaczynski, A.T.; Owen, N.; Giles-Corti, B. Public open space, physical activity, urban design and public health: Concepts, methods and research agenda. Health Place 2015, 33, 75–82. [Google Scholar] [CrossRef] [Green Version]
- Carr, S.; Francis, M.; Rivilin, L.G.; Stone, A.M. Public space; Cambridge University Press: New York, NY, USA, 1992; pp. 232–236. [Google Scholar]
- Whyte, W.H. The Social Life of Small Urban Spaces; Project for Public Spaces: New York, NY, USA, 2001; pp. 66–79. [Google Scholar]
- Mowen, A.; Orsega-Smith, E.; Payne, L.; Ainsworth, B.; Godbey, G. The role of park proximity and social support in shaping park visitation, physical activity, and perceived health among older adults. J. Phys. Act. Health 2007, 2, 167–179. [Google Scholar] [CrossRef] [PubMed]
- Ye, Y.; Nes, A.V. Quantitative tools in urban morphology: Combining space syntax, Spacematrix, and Mixed-use Index in a GIS framework. Urban Morphol. 2014, 18, 97–118. [Google Scholar]
- Open Space Strategies: Best Practice Guidance. Available online: https://www.designcouncil.org.uk/sites/default/files/asset/document/open-space-strategies.pdf (accessed on 19 April 2021).
- Choi, H.S. How are public spaces sustaining cultural identities in the context of China’ s increasingly globally focused urban developments: Using a case study of Putuo in Shanghai. J. Archit. Urban. 2016, 40, 198–205. [Google Scholar] [CrossRef]
- Zucker, P. Town and Square: From the Agora to Village Green; Columbia University Press: New York, NY, USA, 1959; pp. 142–145. [Google Scholar]
- Gehl, J. Life Between Buildings; Van Nostrand Reinhold: New York, NY, USA, 1987; pp. 49–53. [Google Scholar]
- Hume City Council. Open Space Strategy 2010–2015; Hume City Council: Victoria, Australia, 2003; pp. 50–62. [Google Scholar]
- Basri, B.H. Valuing the Attributes of Malaysian Recreational Parks: A Choice Experiment Approach. Ph.D. Thesis, School of Agriculture, Food and Rural Development, Newcastle University, Newcastle, UK, June 2011. [Google Scholar]
- Department of Sport and Recreation. Classification Framework for Public Open Space; Department of Sport and Recreation: Perth, Australia, 2013; pp. 5–8. [Google Scholar]
- Kongphunphin, C.; Iamtrakul, P.; Srivanit, M. The attitude in Urban Planning of Thai Urban Public Space. Int. J. Build. Urban Inter. Landsc. Technol. 2018, 12, 59–74. [Google Scholar]
- Van Herzele, A.; Wiedemann, T. A monitoring tool for the provision of accessible and attractive urban green spaces. Landsc. Urban Plan. 2003, 63, 109–126. [Google Scholar] [CrossRef]
- Bedimo-Rung, A.L.; Mowen, A.J.; Cohen, D.A. The significance of parks to physical activity and public health: A conceptual model. Am. J. Prev. Med. 2005, 28, 159–168. [Google Scholar] [CrossRef]
- Giles-Corti, B.; Timperio, A.; Bull, F.; Pikora, T. Understanding physical activity environmental correlates: Increased specificity for ecological models. Exerc. Sport Sci. Rev. 2005, 33, 175–181. [Google Scholar] [CrossRef]
- The Bangkok Comprehensive Plan. Available online: http://cpd.bangkok.go.th:90/web2/kitja56/kitja56 (accessed on 5 March 2021).
- Office of Public Park, Department of Environment, Bangkok Metropolitan Administration. Report on the implementation of the Annual Work Plan for Bangkok. Available online: http://office.bangkok.go.th/publicpark/index.asp (accessed on 16 September 2020).
- The New Urban Agenda for Achieving Sustainable Urbanization in Thailand. United Nations Human Settlements Programme. Available online: https://unhabitat.org/es/node/142441 (accessed on 9 April 2021).
- Statistical Profile of Bangkok Metropolitan Administration. Strategy and Evaluation Department of Bangkok Metropolitan Administration. Available online: http://www.bangkok.go.th/pipd (accessed on 24 April 2021).
- Kongphunphin, C.; Srivanit, M. Public spaces in Bangkok and the factors affecting the good public space quality in urban areas. IOP Conf. Ser. Mater. Sci. Engineering 2020, 910, 012024. [Google Scholar] [CrossRef]
- Report of the Main Parks in Bangkok. Available online: http://203.155.220.118/green-parks-admin (accessed on 19 April 2021).
- Evenson, K.R.; Jones, S.A.; Holliday, K.M.; Cohen, D.A.; Mckenzie, T.L. Park characteristics, use, and physical activity: A review of studies using SOPARC (system for observing play and recreation in communities). Prev. Med. 2016, 86, 153–166. [Google Scholar] [CrossRef] [Green Version]
- Goličnik, B.; Thompson, C.W. Emerging relationships between design and use of urban park spaces. Landsc. Urban Plan. 2010, 94, 38–53. [Google Scholar] [CrossRef]
- Schipperijn, J.; Bentsen, P.; Troelsen, J.; Toftager, M.; Stigsdotter, U.K. Associations between physical activity and characteristics of urban green space. Urban For. Urban Green. 2013, 12, 109–116. [Google Scholar] [CrossRef]
- Hillsdon, M.; Panter, J.; Foster, C.; Jones, A. The relationship between access and quality of urban green space with population physical activity. Public Health 2006, 120, 1127. [Google Scholar] [CrossRef]
- Li, F.; Zhang, F.; Li, X.; Wang, P.; Liang, J.; Mei, Y.; Cheng, W.; Qian, Y. Spatiotemporal patterns of the use of urban green spaces and external factors contributing to their use in central Beijing. Int. J. Environ. Res. Public Health 2017, 14, 237. [Google Scholar] [CrossRef] [PubMed]
- Mertes, J.D.; Hall, J.R. Park, Recreation, Open Space and Greenway Guidelines; Urban Land: Arlington, VA, USA, 1996; pp. 155–163. [Google Scholar]
- Brander, L.M.; Koetse, M.J. The value of urban open space: Meta-analyses of contingent valuation and hedonic pricing results. J. Environ. Manag 2011, 92, 2763–2773. [Google Scholar] [CrossRef]
- Annual report of Department of Public Works and Town & Country Planning of BMA. Available online: http://www.bangkok.go.th/upload/user/00000354/plan/reportyear/AR2563.pdf (accessed on 15 April 2021).
- Ibes, D.C. A multi–dimensional classification and equity analysis of an urban park system: A novel methodology and case study application. Landsc. Urban Plan. 2015, 137, 122–137. [Google Scholar] [CrossRef]
- Ye, Y.; Nes, A.V.A. Measuring urban maturation processes in Dutch and Chinese new towns: Combining street network configuration with building density and degree of land use diversification through GIS. J. Space Syntax. 2013, 4, 17–37. [Google Scholar]
- Chrysoulakis, N.; Feigenwinter, C.; Triantakonstantis, D.; Penyevskiy, I.; Tal, A.; Parlow, E.; Fleishman, G.; Duzgun, S.; Esch, T.; Marconcini, M. A Conceptual List of Indicators for Urban Planning and Management Based on Earth Observation. Int. J. Geo-Inf. 2014, 3, 908–1002. [Google Scholar] [CrossRef] [Green Version]
- What Makes A Successful Place? Available online: https://www.pps.org/article/grplacefeat (accessed on 29 May 2021).
- Kaczynski, A.T.; Potwarka, L.R.; Saelens, E.B. Association of Park Size, Distance, and Features with Physical Activity in Neighborhood Parks. Am. J. Public Health 2008, 98, 1451–1456. [Google Scholar] [CrossRef] [PubMed]
- Sallis, J.F.; Glanz, K. The Role of Built Environments in Physical Activity, Eating, and Obesity in Childhood. Future Child. 2006, 16, 89–108. [Google Scholar] [CrossRef] [PubMed]
- Zhang, R.; Wulff, H.; Duan, Y.; Wagner, P. Associations between the physical environment and park-based physical activity: A systematic review. J. Sport Health Sci. 2019, 8, 412–421. [Google Scholar] [CrossRef]
- Marshall, S.; Caliskan, O. A joint framework for urban morphology and design. Built Environ. 2011, 37, 409–426. [Google Scholar] [CrossRef]
- Urban Indicators for Managing Cities. Available online: https://www.adb.org/sites/default/files/publication/30020/urban-indicators-managing-cities.pdf (accessed on 15 June 2020).
- Lynch, K. The Image of the City; The MIT Press: London, UK, 1960; pp. 46–48. [Google Scholar]
- Lee, S.; Yang, G.; Pei, T.; Ma, T.; Song, C.; Shu, H.; Du, Y.; Zhou, C. Analysis of factors affecting urban park service area in Beijing: Perspectives from multi-source geographic data. Landsc. Urban Plan. 2019, 181, 103–117. [Google Scholar] [CrossRef]
- Chan, C.S.; Marafa, L.M. Components of urban park systems: United States and Hong Kong. Parks Recreat. 2006, 41, 26–30. [Google Scholar]
- Burns, R.B.; Burns, R.A. Business Research Methods and Statistics Using SPSS; Sage Publishing: Los Angeles, CA, USA, 2008; pp. 145–149. [Google Scholar]
- Matsunaga, M. How to factor-analyze your data right: Do’s, don’ts, and how-to’s. Int. J. Psychol. Res. 2010, 3, 97–110. [Google Scholar] [CrossRef]
- Srivanit, M.; Auttarat, S. Classifying Spatial Homogeneity of Thermally-Stabilized Surface to Define Differentiation Local Atmospheric Zones in Chiang Mai City. J. Archit. Plan. Res. Studies. 2016, 13, 1–21. [Google Scholar]
- Rapkin, B.D.; Luke, D.A. Cluster analysis in community research: Epistemology and practice. Am. J. Community Psychol. 1993, 21, 247–277. [Google Scholar] [CrossRef]
- Thorndike, R.L. Who Belongs in the Family? Psychometrika 1953, 18, 267–276. [Google Scholar] [CrossRef]
- McCormack, G.R.; Rock, M.; Toohey, A.M.; Hignell, D. Characteristics of urban parks associated with park use and physical activity: A review of qualitative research. Health Place 2010, 16, 712–726. [Google Scholar] [CrossRef] [PubMed]
- Chen, S.; Sleipness, O.; Xu, U.; Park, K.; Christensen, K. A systematic review of alternative protocols for evaluating non-spatial dimensions of urban parks. Urban For. Urban Green. 2020, 53, 126718. [Google Scholar] [CrossRef]
- Kaczynski, A.T.; Wilhelm Stanis, S.A.; Besenyi, G.M. Development and testing of a community stakeholder park audit tool. Am. J. Prev. Med. 2012, 42, 242–249. [Google Scholar] [CrossRef]
- Bedimo-Rung, A.L.; Gustat, J.; Tompkins, B.J.; Rice, J.; Thomson, J. Development of a direct observation instrument to measure environmental characteristics of parks for physical activity. J. Phys. Act. Health 2006, 3, S176–S189. [Google Scholar] [CrossRef] [PubMed]
- Saelens, B.E.; Frank, L.D.; Auffrey, C.; Whitaker, R.C.; Burdette, H.L.; Colabianchi, N. Measuring physical environments of parks and playgrounds: EAPRS instrument development and inter-rater reliability. J. Phys. Act. Health 2006, 3, S190–S207. [Google Scholar] [CrossRef] [PubMed] [Green Version]
- Chandrasiri, O.; Arifwidodo, S. Inequality in Active Public Park: A Case Study of Benjakitti Park in Bangkok, Thailand. Procedia Eng. 2017, 198, 193–199. [Google Scholar] [CrossRef]
- Wissink, B.; Hazelzet, A. Bangkok living: Encountering others in a gated urban field. Cities 2016, 59, 164–172. [Google Scholar] [CrossRef]
- Srichuae, S.; Nitivattananon, V.; Perera, R. Aging society in Bangkok and the factors affecting mobility of elderly in urban public spaces and transportation facilities. IATSS Res. 2016, 40, 26–34. [Google Scholar] [CrossRef] [Green Version]

| Types of Parks | Number of Parks | Total Area of Parks | |
|---|---|---|---|
| Sq km | Proportion (%) | ||
| Pocket park | 3758 | 3.97 | 47.99 |
| Neighborhood park | 1060 | 9.77 | 13.54 |
| Community park | 80 | 6.12 | 1.02 |
| District park | 19 | 7.49 | 0.24 |
| City park | 2 | 2.32 | 0.03 |
| Street garden park | 2892 | 7.23 | 36.93 |
| Specialized garden park | 14 | 0.29 | 0.18 |
| Not specified | 6 | 0.003 | 0.08 |
| Total | 7831 | 37.20 | 100.00 |
| Category | Factor (Abbreviation) | Description (Units) |
|---|---|---|
| External factor (within a 400-m radius from the park) | Degree of land-use mix | The combination of the number of functional mix in neighborhood development such as residential, commercial activity, mixed-use buildings, manufacturing and processing activities, and educational and governmental services |
| Community component | Number of pivotal areas of the Thai community (educational areas and religious institutions) | |
| Religious diversity | Number of religious places of users surrounding park | |
| Road density | The ratio of the length of the total road network to the reachable park area within a radius of 400 m (km/sq. km) | |
| Diversity of housing types | Number of types of residential buildings | |
| Building density | Number of buildings per square kilometer | |
| Floor area ratio | The total gross floor area of all buildings within 400 m from park | |
| Open space ratio | The open area that is relevant to the building floor area in the form of a percentage | |
| Image of the city | Number of elements of the image of the city (path, edge, node, landmark) | |
| Internal factor (conditions at the site) | Park use on weekday | Number of park users on a weekday (square meters of urban park space per person) |
| Weekend park usage | Number of park users on weekend (square meters of urban park space per person) | |
| Size of park | The size of the space in the park in square meters | |
| Age of park | Age of the park (2020 subtracted by the year of construction) | |
| Significant history and culture | Dummy variable that describes significant history and culture; 1 indicates significant history and culture, while 0 means no significant history or culture | |
| Recreation facilities provided | Number of amenities within the urban park (rest area, play areas, sports activity areas, cultural and recreational centers, and other facilities) | |
| Public transport services | Number of public transport services that reach the park (buses, subways, and boats) | |
| Modes of transportation | Types of transport supporting the accessibility of the park | |
| The critical role of park | Number of critical roles of the park such as recreation, heritage, health and wellness, natural environment, education | |
| Coverage of blue infrastructure | Percentage of water resource area (i.e., ponds, small lakes) inside the park (in %) |
| Variables | Factor Loadings | |||||
|---|---|---|---|---|---|---|
| PC1 | PC2 | PC3 | PC4 | PC5 | PC6 | |
| Diversity of housing types | 0.924 | −0.008 | −0.030 | −0.009 | 0.048 | −0.224 |
| OSR | −0.924 | −0.220 | −0.168 | −0.095 | −0.001 | −0.032 |
| Building density | 0.862 | 0.033 | −0.229 | 0.163 | 0.132 | 0.158 |
| FAR | 0.819 | 0.113 | 0.304 | 0.131 | −0.037 | −0.021 |
| Park use on weekday | 0.132 | 0.905 | 0.207 | −0.125 | 0.005 | −0.096 |
| Weekend park usage | 0.115 | 0.914 | 0.216 | −0.086 | −0.049 | −0.034 |
| Size of park | −0.046 | 0.821 | 0.174 | 0.166 | −0.352 | −0.123 |
| Age of park | 0.271 | 0.605 | 0.376 | −0.061 | 0.276 | 0.073 |
| Public transport services | −0.224 | 0.339 | 0.792 | 0.113 | 0.132 | 0.040 |
| Significant historical and cultural | 0.239 | 0.178 | 0.754 | 0.098 | 0.060 | −0.091 |
| Critical role of park | 0.095 | 0.125 | 0.731 | −0.064 | −0.295 | −0.194 |
| Modes of transportation | −0.020 | 0.376 | 0.601 | −0.347 | 0.128 | 0.131 |
| Coverage of blue infrastructure | 0.145 | −0.335 | 0.025 | 0.776 | −0.184 | −0.045 |
| Road density | 0.187 | 0.172 | 0.029 | 0.735 | 0.238 | 0.016 |
| Degree of land-use mixture | 0.223 | −0.026 | 0.157 | 0.242 | 0.802 | −0.062 |
| Community component | −0.154 | −0.168 | −0.274 | −0.423 | 0.690 | 0.207 |
| Image of the city | −0.197 | −0.087 | 0.067 | 0.063 | 0.243 | 0.787 |
| Religious diversity | 0.266 | 0.013 | −0.151 | −0.176 | −0.224 | 0.705 |
| Facilities element provided | 0.240 | 0.369 | 0.298 | −0.413 | −0.060 | −0.467 |
| Cluster | Examples of Parks Closest to the Cluster Center | ||
|---|---|---|---|
| Name and Location of the Park | 400-m Radius from the Park | Characteristics and Context | |
| 1. Historical Park (n = 2) | Saranrom Palace Park 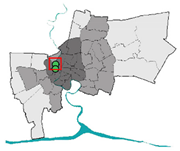 | 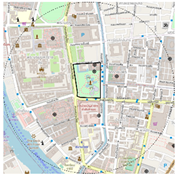 | 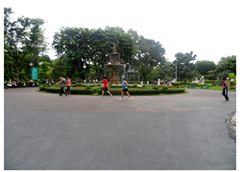 |
| 2. Community Park (n = 14) | Garden 60th Anniversary Queen 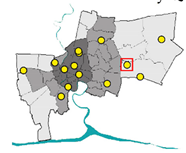 | 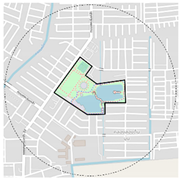 | 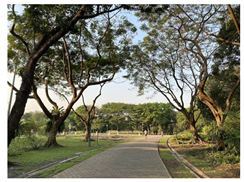 |
| 3. Forest Park (n = 6) | Parco Sirintorapusapan 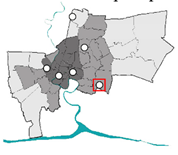 | 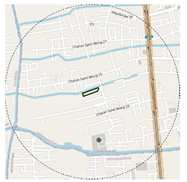 | 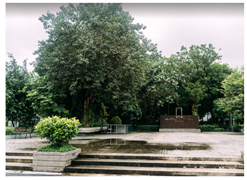 |
| 4. Artificial Park (n = 4) | Wanatham Park 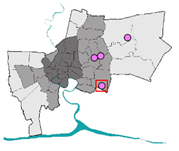 | 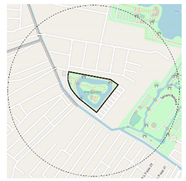 | 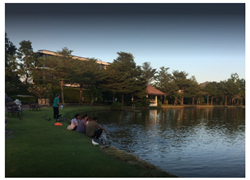 |
| 5. Creative Park (n = 2) | Lumphini Park 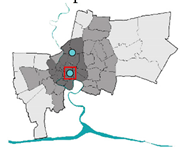 | 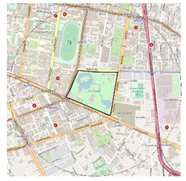 | 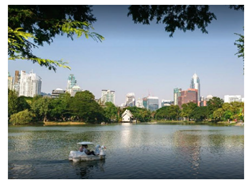 |
| 6. Appreciated Park (n = 2) | Rama VIII Park 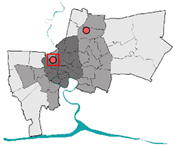 | 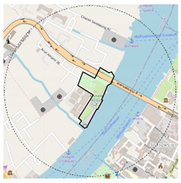 | 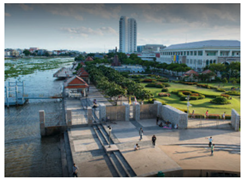 |
Publisher’s Note: MDPI stays neutral with regard to jurisdictional claims in published maps and institutional affiliations. |
© 2021 by the authors. Licensee MDPI, Basel, Switzerland. This article is an open access article distributed under the terms and conditions of the Creative Commons Attribution (CC BY) license (https://creativecommons.org/licenses/by/4.0/).
Share and Cite
Kongphunphin, C.; Srivanit, M. A Multi-Dimensional Clustering Applied to Classify the Typology of Urban Public Parks in Bangkok Metropolitan Area, Thailand. Sustainability 2021, 13, 11426. https://doi.org/10.3390/su132011426
Kongphunphin C, Srivanit M. A Multi-Dimensional Clustering Applied to Classify the Typology of Urban Public Parks in Bangkok Metropolitan Area, Thailand. Sustainability. 2021; 13(20):11426. https://doi.org/10.3390/su132011426
Chicago/Turabian StyleKongphunphin, Chompoonut, and Manat Srivanit. 2021. "A Multi-Dimensional Clustering Applied to Classify the Typology of Urban Public Parks in Bangkok Metropolitan Area, Thailand" Sustainability 13, no. 20: 11426. https://doi.org/10.3390/su132011426
APA StyleKongphunphin, C., & Srivanit, M. (2021). A Multi-Dimensional Clustering Applied to Classify the Typology of Urban Public Parks in Bangkok Metropolitan Area, Thailand. Sustainability, 13(20), 11426. https://doi.org/10.3390/su132011426