1. Introduction
Walking is the simplest class of physical movement that benefits individual health. In addition, walking is regarded as a sustainable transport mode that benefits an individual, society, and environment [
1,
2,
3]. Several studies focused on identifying pedestrian needs [
4,
5]. These studies identified a range of factors that affect pedestrian behavior and decisions. These factors can be summarized into four main groups that include accessibility [
6,
7,
8,
9,
10], safety [
11,
12,
13,
14,
15,
16], comfort [
4,
5,
17,
18,
19], and pleasurability [
4,
5,
20]. A few studies also focused on a single dimension of walking needs. For example, Tiwari [
21] explored the safety concerns of an individual while accessing metro stations, and Zakaria and Ujang [
22] determined pedestrian comfort based on walking experience.
Several studies used these walking needs to develop assessment tools, including pedestrian level of service (PLOS) methods and walkability assessment tools [
23,
24,
25,
26,
27,
28,
29,
30]. Factors used in the aforementioned studies include accessibility, traffic factors, safety (from crime and traffic), geometry/environmental/footpath factors, pedestrian movement factors, aesthetics, comfort, attractiveness, functionality, destinations, environmental appearance, activity potential, shade, convenience, walking facilities, usability, and exploration.
The existing physical activity tools and walkability assessment tools aim to assess the walking environment and improve recreational spaces for health advancement in societies [
31]. Walkability assessment tools use audits [
13,
32,
33,
34] and questionnaires [
35,
36] to collect the required data. In order to perform an audit, the streets are split into segments, and each part is examined by one or more evaluators. In audits, a set of qualitative judgments or quantitative measurements is designated for each assessment item. Like the audits, the questionnaires are effective instruments to assess pedestrian environments. The questionnaires are utilized to evaluate the perceptions of neighborhood residents towards walking and cycling facilities in their area.
According to Litman [
37], walkability is considered an essential indicator of sustainable mobility. Typically, researchers and practitioners from various domains, including urban planning, transport planning, urban design, and public health have an interest in the topic of walkability. In addition, they are the main users of the walkability assessment tools. There are many walkability assessment tools, and it is a challenging task to select the best one. Furthermore, there is no guideline or a systematic manner to help these users to select the most appropriate walkability assessment tool. They need to ensure that the tool that they select to work with is comprehensive and sufficiently detailed. This is because the future investments in infrastructures may depend on this assessment. Thus, if an inappropriate tool is used, undesirable consequences will be brought about. Each type of walkability assessment tool uses certain indicators to assess the walking environment and urban design-related factors. The walking needs are extremely diverse, and thus it is important to ensure that the assessment tools consider a wide range of urban design-related factors to the maximum possible extent for assessment purposes. Consequently, there is a need to develop an instrument to appraise the strength of assessment tools to evaluate walking needs. Currently, there is a paucity of research dedicated to the measurement quality examination of walkability assessment tools [
11]. The present study aims to develop a measurement quality appraisal instrument (MQAI) to evaluate walkability assessment tools based on walking needs. This paper presents the development process of the MQAI. To exhibit this process, the MQAI was applied to some walkability assessment tools and indicated the reliability, validity, and applicability of these tools. The successful development of MQAI ensures planners and researchers can efficiently employ this tool for choosing the most appropriate walkability assessment tool among the candidate tools.
2. Walking Needs
Various walking needs and their contributory urban design variables affect people’s decision to walk. Accessibility is among the most cited walking needs that must be met to motivate people to walk. Accessibility simply refers to the ability (easiness) of obtaining desired services and activities [
4,
6,
7,
8,
9,
10]. Several urban design factors affect the accessibility needs of walking, including, but not limited to, availability/completeness of sidewalk network, number of destinations, proximity to transit points, presence/number of barriers, and public spaces.
Safety is another important walking need that is frequently found in the literature. Safety of walking refers to whether an individual feels safe from the danger of falling due to wet conditions, the hazard of conflicts with vehicles, and the threat of crime [
2,
4,
11,
12,
13,
14,
38]. Urban design factors that may affect safety from crime include lighting, landscape and trees, and vacant buildings. Design factors that may contribute to safety from traffic include signage, signals, and pedestrian crossings. Safety from falling also can be affected by surface, materials, and lighting.
A considerable amount of literature has been published on comfort as an important need for walking. Comfort refers to a person’s level of satisfaction, ease, and pleasure [
4,
5,
17]. The design factors that may affect the comfort needs of walking include landscape and trees, the presence of traffic calming features, canopies, and drinking fountains. Pleasurability is also an important need for walking. Pleasurability simply refers to whether an individual experiences an enjoyable and interesting area for walking [
4,
5,
20]. The presence of a varied streetscape, architectural elements, and outdoor dining areas can affect the pleasurability level of pedestrians.
Table 1 illustrates the walking needs and the urban design factors that affect these needs.
The existing walkability assessment tools have various factor classifications. In walkability assessment tools, the major groups of assessment items are street facilities, sidewalk characteristics, land use, and road attributes. Street facilities include signage, signals, drinking fountains, surveillance, and items related to the disabled [
33,
34,
68]. Sidewalk characteristics include items such as sidewalk completeness, the width of the sidewalk, presence/number of barriers (obstacles), and surface/material of the sidewalk [
69,
70,
71]. Land use is another frequently used grouping that contains a mixture of land use, undesirable land uses, and destinations [
72,
73]. The walkability assessment tools also use items related to road attributes, including traffic calming features, street width, cleanliness, lighting, and directness of walkways/routes [
71,
74].
Table 2 presents walking needs-related factors based on the major factor classifications in the existing walkability assessment tools. The walking needs information obtained from the literature and summarized in
Table 1 and
Table 2 were used to develop a comprehensive instrument to assess current tools based on walking needs. This instrument can assess the quality of the existing walkability assessment tools and determine their capability for assessing pedestrian environments. Such an instrument also can act as a decision-making system for selecting the most appropriate assessment tool for evaluating the walking environments.
3. Methods
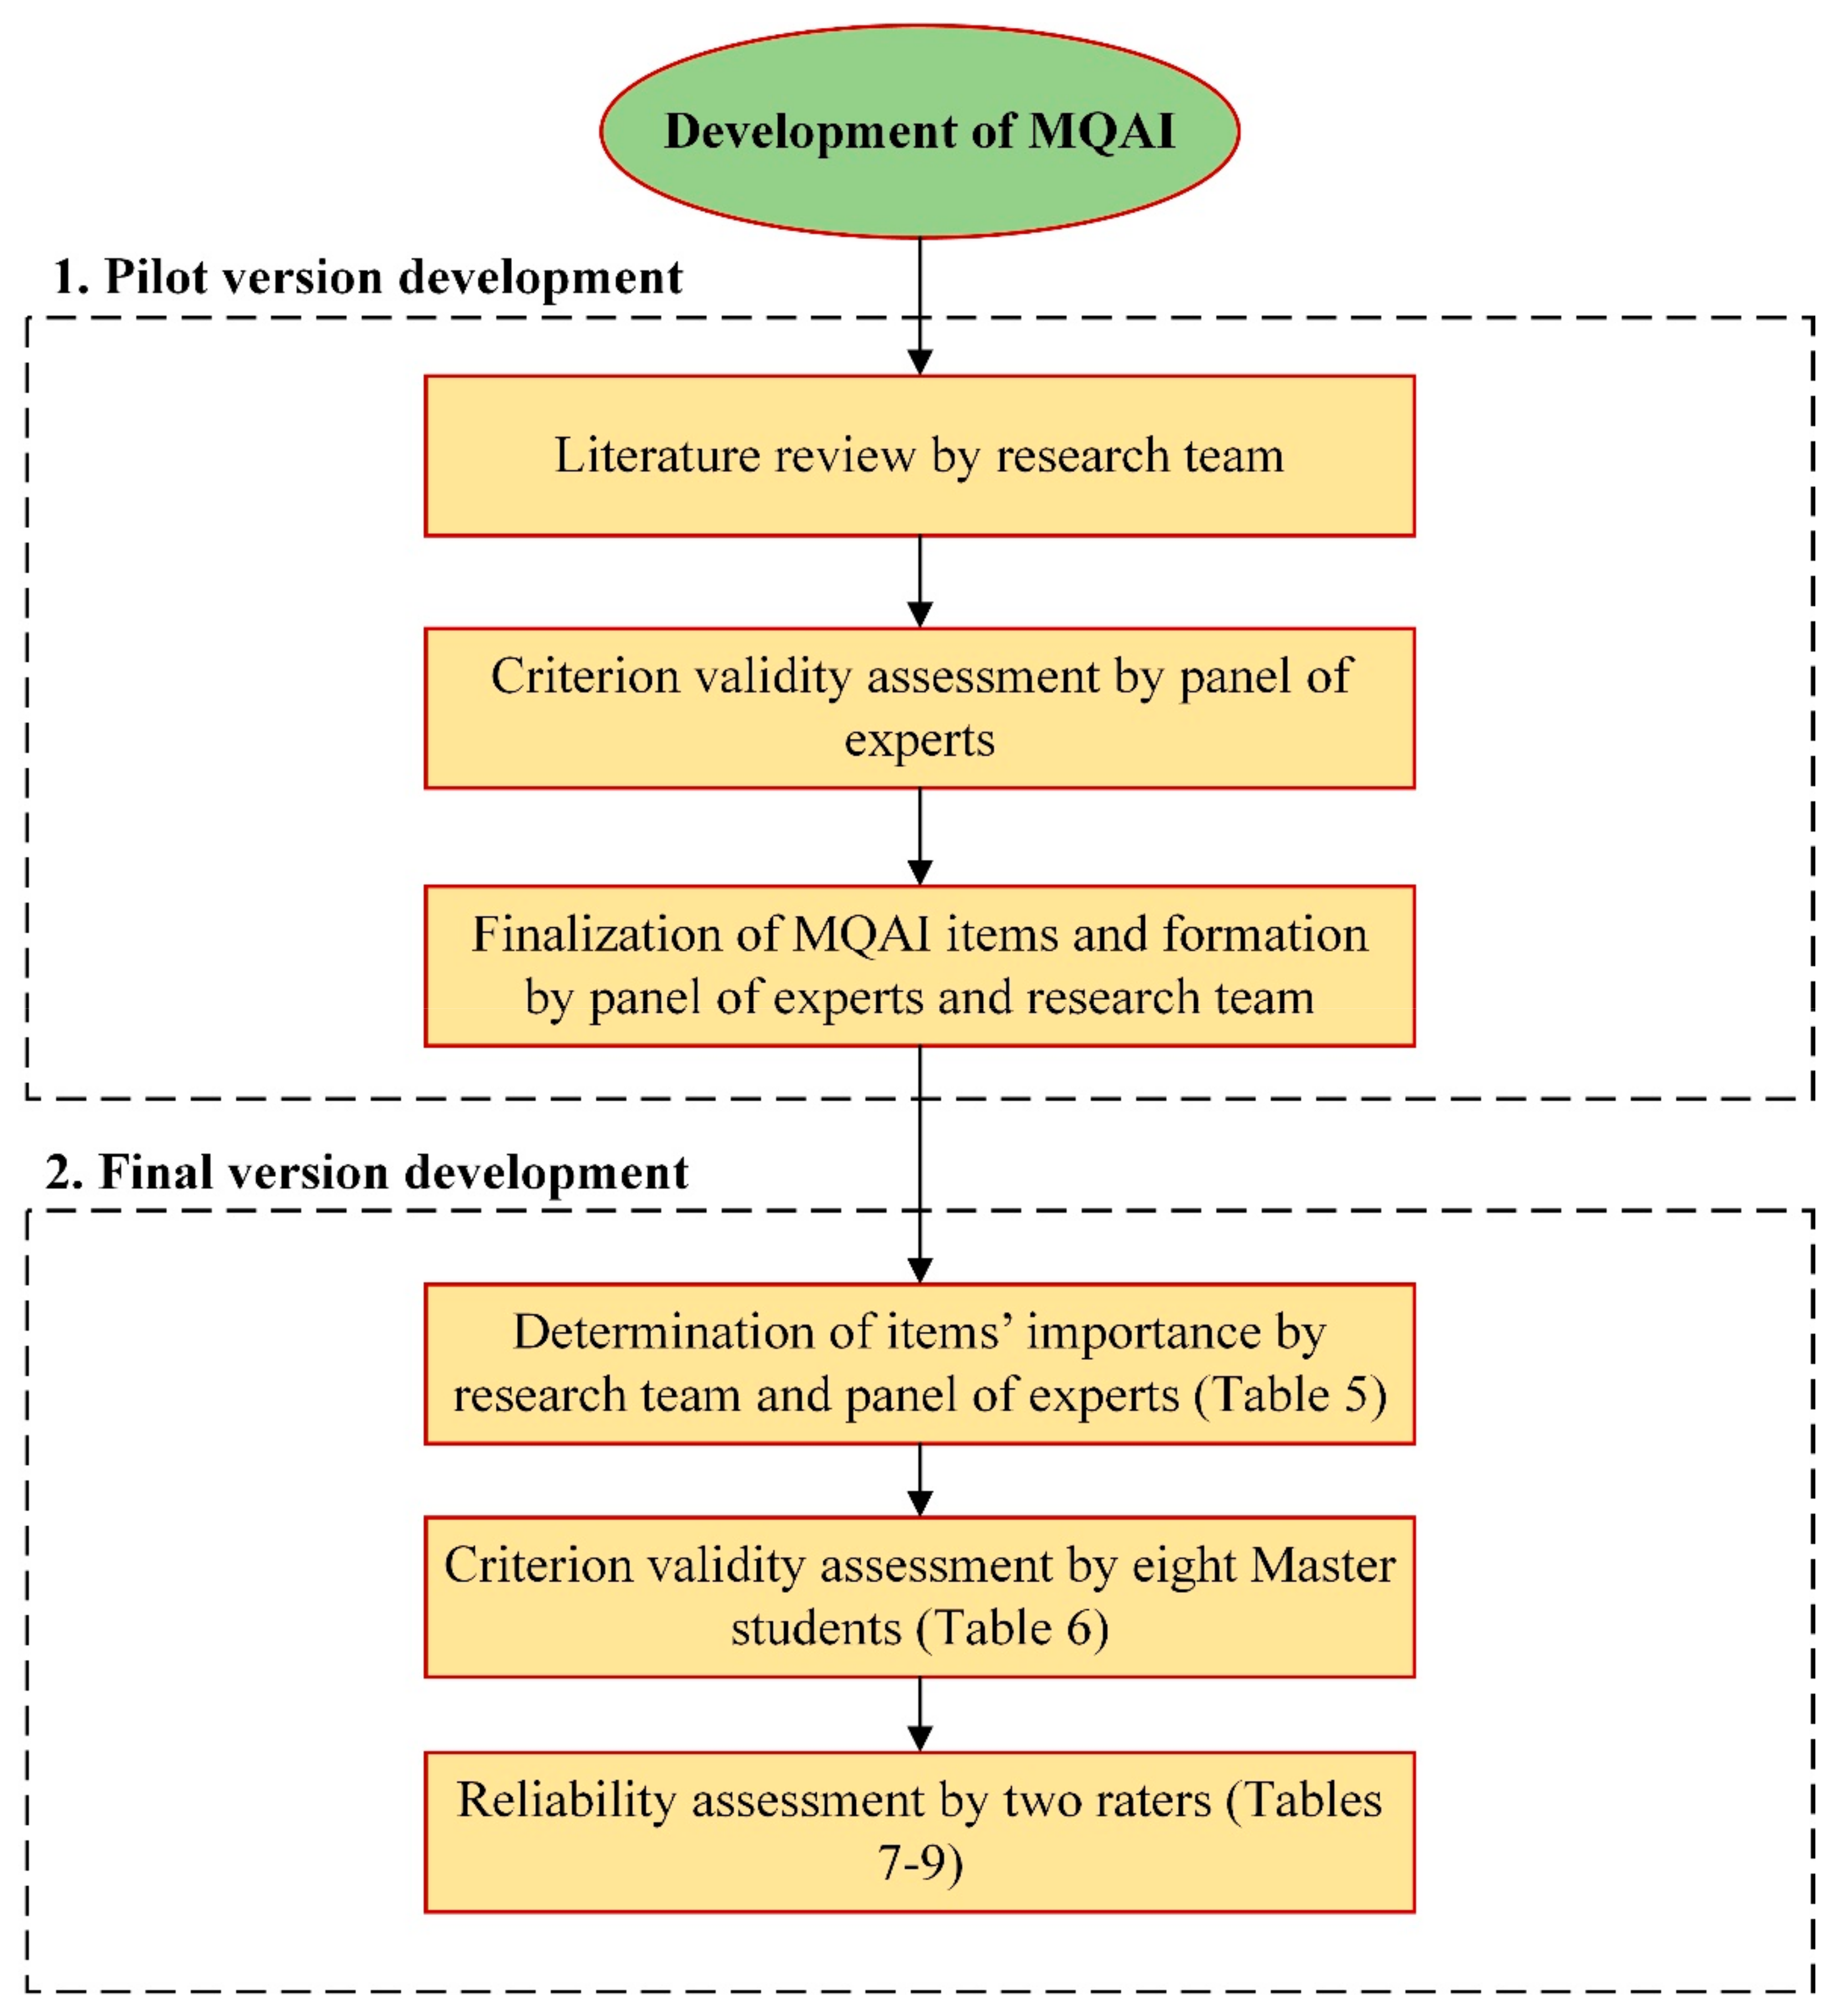
As previously mentioned, this paper shows the development process of the MQAI. This process included two main parts: (1) pilot version development and (2) final version development. Each part involved a series of assessments and techniques. The development process of MQAI is indicated in
Figure 1.
3.1. Identifying Walking Needs and Developing the Pilot MQAI
A literature review has been conducted to identify the walking needs and their widest range of contributory urban design factors. The walking needs information extracted from this literature (refer to
Table 1 and
Table 2) were used to develop a pilot MQAI (refer to
Appendix A) to assess the current tools based on walking needs.
Table 3 lists the key characteristics of the MQAI. This tool is based on a pointing system in which each point corresponds to a specific condition. In this system, the worst and best conditions receive the lowest and greatest points, respectively. This method facilitates a systematic comparison among the walkability assessment tools and allows for determining the tools’ capability for evaluating the walkability. To assess each item, the evaluator must select ‘no assessment’ (determines that the tool does not assess the indicator); ‘simple assessment’ (determines that the tool simply assesses the availability of an indicator and does not assess the quality of indicator); ‘partial assessment’ (determines that the tool assesses the availability in addition to the quality but does not provide a complete assessment for the quality); and ‘complete assessment’ (determines that the tool presents a complete assessment (availability and quality) for the indicator). The ’no assessment’, ’simple assessment’, ’partial assessment’, and ’complete assessment’ conditions receive points of zero, one, two, and three, respectively. These four levels of responses allow for simultaneously assessing both availabilities of design factors and their assessment quality in the tools. The score of each measurement scale is computed by the sum of the marks assigned to the different items.
Appendix A shows the scoring pattern and related explanations.
To investigate the content validity of the proposed MQAI, some meetings were held with a panel of experts which included two experts in urban transport planning and public health. The outcomes of these meetings were minimal changes to the content of some scales and/or the explanation attached. The pilot version of MQAI was made through the results of this step.
A criterion validity test was conducted in this step. Two pedestrian environment assessment tools, including one audit and one questionnaire, were assessed utilizing the pilot version of MQAI by the research team (authors). Each member of the research team was benchmarked relative to the team leader (first author). The average level of agreement was 41.5%.
Once the assessment of criterion validity of the MQAI pilot version was completed, the outcomes of this evaluation were discussed in a series of meetings in which both the research team and experts were involved. These meetings engaged the experts in discussion and the developing of a refined list of suitable MQAI appraisal items. During the meetings, the research team and experts confirmed the purpose and scope of the MQAI. They also ensured that the widest range of appraisal items was included in the proposed instrument. Thus, a few changes were implemented, such as adding more explanations to the description of the responses to clarify the differences between answer categories in a better way (refer to
Table 4). Additional improvements included adding an instruction to respond to the appraisal items. Step-by-step instructions were provided to aid users in selecting a suitable answer concerning ‘No, simple, partial, and complete’ (refer to
Appendix A). Additionally, a graphical scale was provided to help the users recognize the right response (refer to
Figure 2).
3.2. Final Version Development
The research team and panel of experts assessed the significance of each tool item. They rated the importance of the items by utilizing a five-point scale varying between ’not important’ and ’very important’. The median score for each item was calculated to determine the weight of the items. In order to gain the consensus of the research team, the team computed the agreement level for the importance of every factor. Then, the weight for each item was adjusted based on the number of items in each category.
The formula that was utilized is [weight − expected weight]. The expected weight is the score that is assigned if the items equally contributed to a category. For instance, if it is required to weigh two items, the expected weight is 2.50 for each; and if it is needed to measure four items, then the expected weight is 1.25. The inter-quartile range (IQR) is calculated for these modified weights to assess the degree of consensus among the evaluators on the scored importance of items. Items with an IQR < 1 correspond to a high level of consensus among the evaluators.
The final version of MQAI was tested for criterion validity and reliability. The reference degree of correlation and agreement for individuals with a background and familiarity with urban planning and urban design was investigated to assess the criterion validity of the MQAI. For each rater, the agreement level was calculated with respect to the leader of the research team. A total of eight students who registered for a Master of Science (advanced urban planning course) participated in this step. Two tools were selected by the team leader and were classified based on the MQAI% interpretation section (
Appendix A) as poor (20 ≤ MQAI% < 40) and regular (40 ≤ MQAI% < 60). A tool was given to each student, and they were asked to complete the assignment in four days.
In order to test the reliability, two raters were asked to evaluate six walkability assessment tools (three audits and three questionnaires). The users of walking assessment tools are mainly from the domains of urban planning, transportation planning, and public health. Thus, two raters were selected, namely an urban and transport planner and a public health expert. The main goals of this step were: (1) to verify the inter-rater degree of agreement for each of the four levels of answers employed in the MQAI; and (2) to assess the inter-rater degree of agreement for each of the six tools. The inter-rater reliability was tested by using Kappa, which is a statistical measure of inter-rater reliability.
4. Results
Based on the IQR definition, an IQR of less than one indicates a high level of agreement, and an IQR of more than one indicates a low level of agreement. Thus, sixteen factors exhibited high levels while five factors exhibited moderate levels of consensus (
Table 5). All items, including ’sidewalk’, ’land use and destinations’, and ’road attributes’, exhibited high levels of agreement while those items with moderate levels belonged to the ’street facilities’ category.
The final version of MQAI was tested for criterion validity and reliability. As shown in
Table 6, the total baseline of agreement level between the evaluators and the team head was 82%. The lowest agreement belonged to the sidewalk scale (75%). Agreement values for the other three scales were 79% for land use and destinations, 83% for street facilities, and 88% for road attributes. The Spearman correlations were 0.78 for the regular tool and 0.92 for the poor tool. The average MQAI% for the tools was 38% for the poor tool and 43% for the regular tool. The difference in MQAI% between the ’poor’ and ’regular’ tools were statistically non-significant at the 5% level. Additionally, there was no statistically significant difference in MQAI% between the tools assessed by the research team leader and the tools assessed by the individuals (
p-value = 0.3 for the poor tool;
p-value = 0.1 for the regular tool).
Table 7 reveals the inter-rater agreement level for every of the four levels of response employed in the MQAI.
Table 8 presents the reliability data by appraisal type and includes the number of questions evaluated within each component. With respect to the questions assessed in audits and questionnaires, averages of 69.84% and 73%, respectively, corresponded to a high agreement (≥75%) between the raters. The aggregated results of the inter-rater agreement level for each of the tool types are shown in
Table 9. The weighted Kappa values for the four scales varied based on the tool type, and the K values for the audits were in the moderate to good range. Concerning the questionnaires, the K values ranged from fair/moderate to very good. The overall inter-rater reliability for the audits and questionnaires were 70% and 73%, respectively.
5. Discussion
The baseline agreement level for the overall instrument was 82% for persons with a background in urban planning and urban design with respect to the team leader. The land use and destinations, street facilities, and road attributes scored the agreement levels in the range of 79–88%. The sidewalk scale had the lowest value, that is, a 75% agreement level. The main reason for this is that this scale includes only two items; therefore, missing an item will have a larger influence on the agreement level.
The improvement of the final version of MQAI compared to the pilot version was demonstrated through testing the final version with two raters with planning and public health backgrounds. This improvement might be related to adding instructions and the items’ details. A simple check on the reliability results shows that the Kappa value is different for the same scale in audits and questionnaires. For example, the sidewalk attained a lower K value in audits than questionnaires. A possible explanation for this is the inherent difference of assessment in audits and questionnaires besides the dearth of knowledge in a specific field of proficiency. During testing of the MQAI instrument, the team noted that raters had difficulty choosing the ’partial’ response. However, the raters did not experience any difficulty in assigning other response categories. The interpretation skill of raters was further significantly improved through in-depth training and supervision.
The results also showed that ’poor’ tools are easier to assess than regular tools. The total scoring for a ’poor’ tool by raters was very similar to that of the team leader. Based on the classification of the tools proposed in this study, the ’poor’ tool represents a tool that considers a few numbers of urban design factors. Hence, the raters were required to easily score items as ’no’ or ’simple’.
Both researchers in practice and academia can employ the MQAI to select the most suitable walkability assessment tool. The walkability assessment tools help decision-makers to identify shortcomings in the living environments. Decision-makers then conclude about the improvement strategies for a living environment with undesirable walking conditions. These strategies may include financial and cultural aspects, which may impact the everyday life of the residents. It is vital that a sufficient amount of investments be allocated to an area with inadequate walking conditions. A better walking infrastructure encourages people to walk and, in turn, increases the overall walking level of residents in a neighborhood. Thus, choosing a suitable walkability assessment tool that assesses the walking environment accurately is of great interest. Moreover, this can impact the plans for improving the walking conditions in a neighborhood indirectly. The employment of MQAI enables practitioners to (1) classify the walkability assessment tools, (2) select the most suitable one, and finally (3) identify walkability shortcomings within neighborhoods using the selected tool.
Researchers in academia also can benefit from the MQAI. Researchers in the domains of urban planning, transport planning, and public health need a comprehensive tool for assessing the walkability condition in a certain area and link this condition with the overall walking level in that area. Typically, this relationship is assessed using traditional statistical methods. However, the abundance of walkability assessment tools, in both the forms of audits and questionnaires, makes it challenging for these researchers to pick the most appropriate one, which can truly reflect the walking condition within a certain area. Thus, the MQAI can help them choose the most comprehensive tool that can capture the details of the walking environment and find the associations of this environment and overall walking and physical activity levels.
6. Conclusions
In recent decades, walkability assessment tools have been developed to assess the suitability of a walking environment for pedestrians. These tools used numerous environmental factors in order to assess the built environments. To date, several reviews were published on walkability assessment tools, and they highlighted challenges faced by extant studies [
11,
69,
70,
71]. However, there is a paucity of a system for assessing the walkability assessment tools based on walking needs. The present study developed and tested an instrument to appraise walkability assessment tools based on walking needs. The main goal of the proposed instrument is to assess whether the walkability assessment tools consider the walking needs and urban design-related factors. This tool can serve as a decision-making system for researchers and practitioners to select the most appropriate assessment tool for evaluating the walking environment.
The present instrument can be used for meta-analyses and systematic reviews. This instrument is easy to use for planners and public health experts. The MQAI can aid practitioners and researchers in selecting the tool to assess the pedestrian environments in both the neighborhood and street scale based on their priorities. The instrument considers the majority of the walking needs to assess the existing tools. However, the planners can select the required items based on their priorities and adjust the proposed MQAI based on their selected items. Additionally, the instrument can serve as a base to develop future walkability assessment tools. The MQAI can be utilized to decide whether the design of a new walkability assessment tool adheres to the walking needs of diverse pedestrian groups. The MQAI did not perform the reliability and validity tests on virtual assessment tools. However, to keep abreast with new technological advancements, this tool also can be employed to assess the virtual assessment tools, which were recently released. Additionally, the methodology employed in this study can be followed to develop similar tools for assessing the virtual walkability/bikeability tools. The MQAI can also inspire future decision-making tools to select the best assessment tools that involve physical environment indicators.
Author Contributions
Conceptualization, M.A. and S.T.; methodology, M.A. and S.T.; formal analysis, S.T., M.A.; investigation, M.A., A.M., S.T.; writing, S.T., M.A., A.M., R.Z., S.I. All authors have read and agreed to the published version of the manuscript.
Funding
This research was funded by Universiti Teknologi Malaysia, Cost Centre No. Q.J130000.21A2.05E23 and the APC was paid using the authors’ discount vouchers provided by MDPI.
Institutional Review Board Statement
Not applicable.
Informed Consent Statement
Not applicable.
Data Availability Statement
Not applicable.
Acknowledgments
The first author is a researcher of Universiti Teknologi Malaysia under the PostDoctoral Fellowship Scheme. The authors also would like to acknowledge the University of Malaya (UM) for providing the necessary resources for this study.
Conflicts of Interest
The authors declare no conflict of interest. The funders had no role in the design of the study; in the collection, analyses, or interpretation of data; in the writing of the manuscript, or in the decision to publish the results.
Appendix A. Measurement Quality Appraisal Instrument (MQAI)
Instrument Description
Please answer all questions pertaining to the depth of evaluation of each scale.
To respond to the questions, one may choose one of four levels, i.e., ‘No assessment’, ‘Simple assessment’, ‘Partial assessment’, and ‘Complete assessment’.
Your judgment for choosing a response from ‘No/Simple/Partial/Complete’ should follow a three-step process. Initially, you are required to determine if the answer is ‘No’ (the indicator of interest is not assessed) or ‘Simple’/‘Partial’/‘Complete’ (i.e., the indicator(s) of interest is/are assessed). Second, you need to choose ‘Simple’ if the tool only assesses the availability of an indicator without considering the quality. Third, if the answer is ‘Partial’/‘Complete’ (the tool considers the availability in addition to the quality), you need to decide if it is a ‘Partial’ (the tool does not consider all quality-related factors) or ‘Complete’ (the tool considers all quality-related factors). If you need to assess the tool many times to judge, there is a high probability that the response is ‘Partial’.
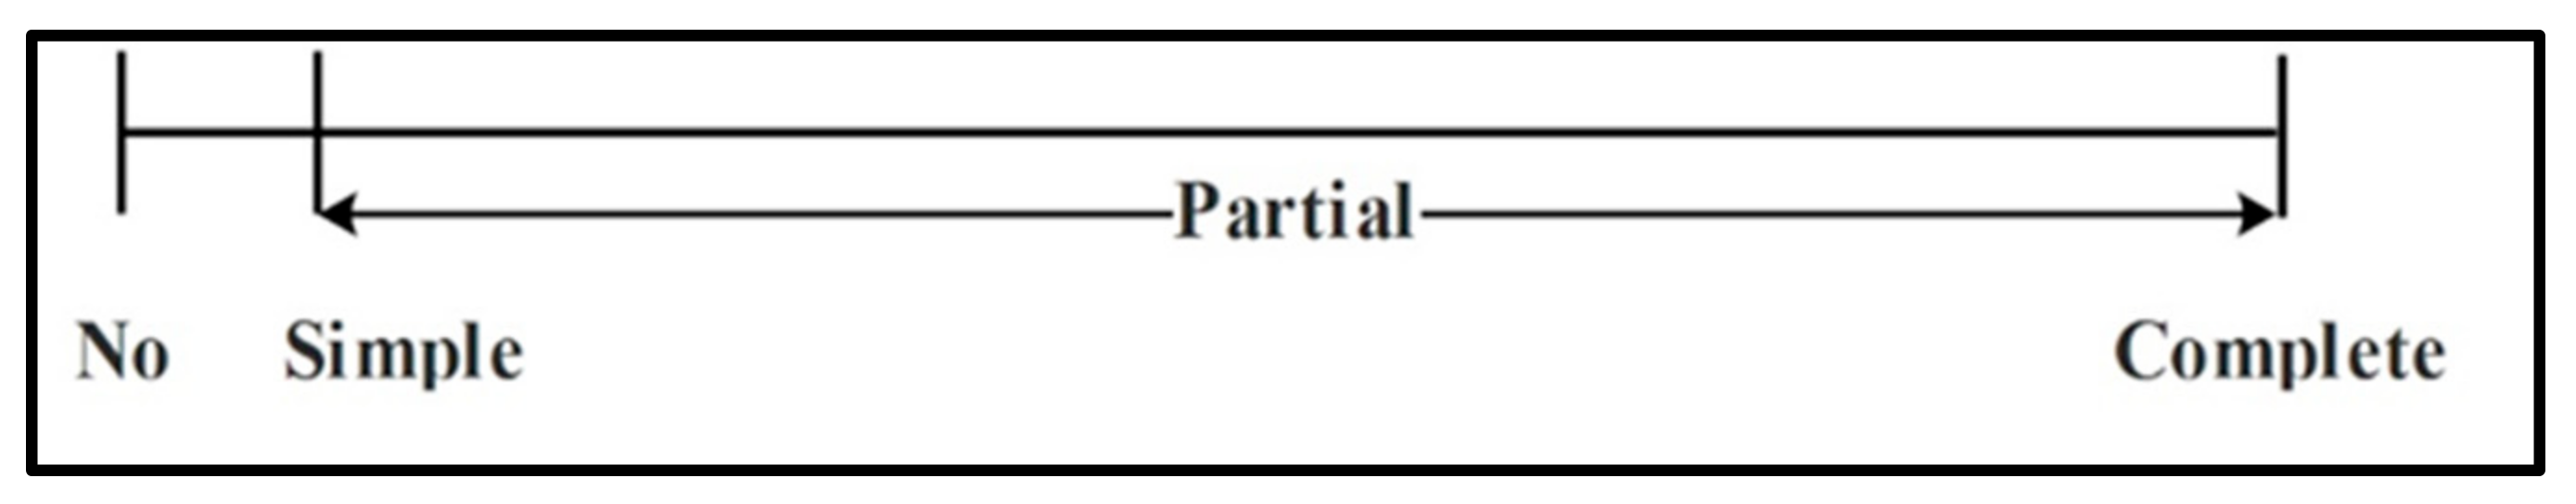
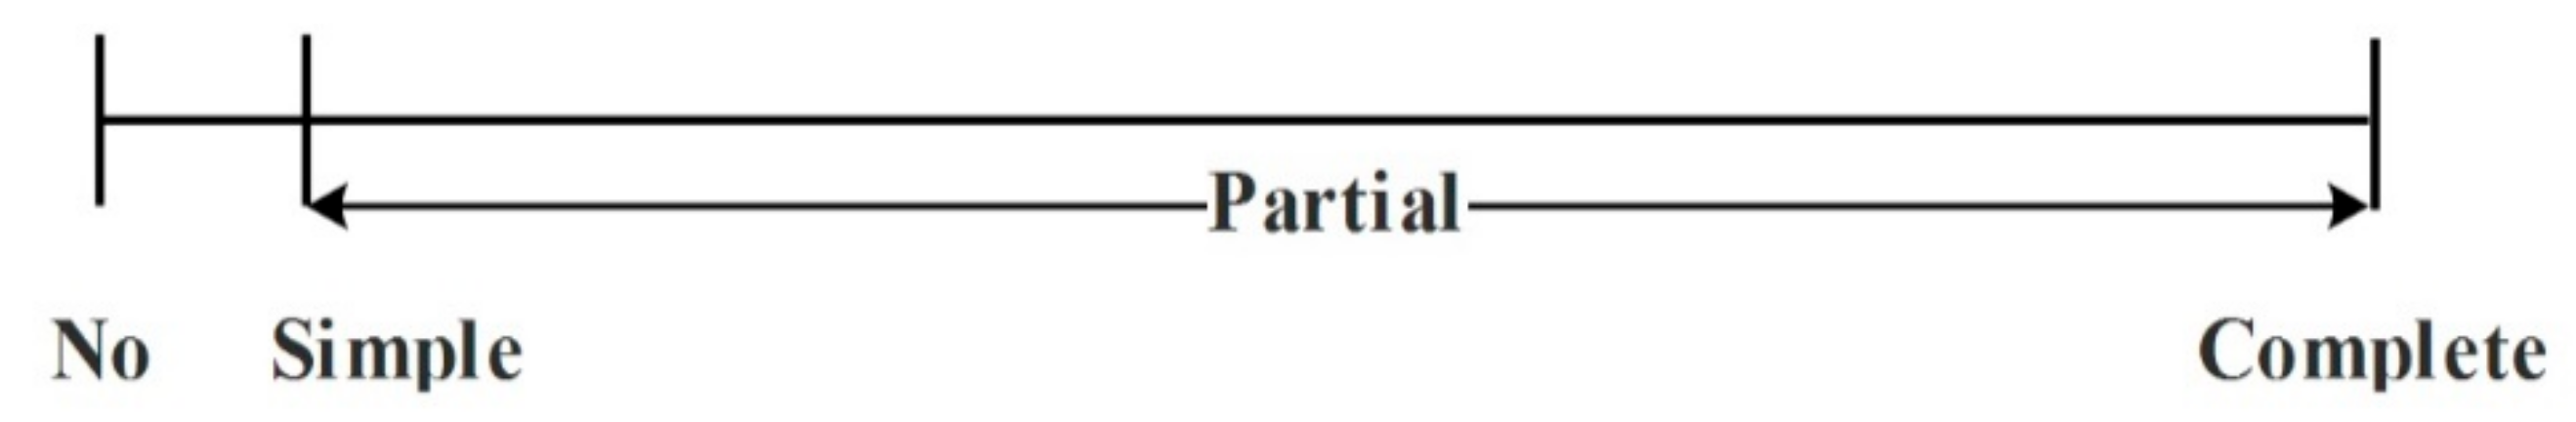
A different approach to determine if it is a ‘Partial’ or ‘Complete’ is by checking the scale below. As presented, the endpoints of the scale are marked with ’Complete’ and ’No’. Hence, the ’Partial’ response is the whole space within the ‘Simple’ and ’Complete’.
Figure A1.
Graphical scale for determining the right response.
Figure A1.
Graphical scale for determining the right response.
| Mathematical Calculation |
Mathematically, the NSAT score is defined as follows: Here, MQAI% = strength of the tool of interest to assess the environmental factors, Pi = point given by the rater to the indicator of interest, Wi = relative weight of each indicator, 12 = total achievable points by each tool ().
|
| MQAI% Interpretation |
Table A1.
Interpretation of the assessment result.
Table A1.
Interpretation of the assessment result.
| MQAI% | Strength of Appraisal | Description |
|---|
| 80 ≤ MQAI% ≤ 100 | Very good | The tool considers a large number of urban design factors |
| 60 ≤ MQAI% < 80 | Good | The tool considers an appropriate number of urban design factors |
| 40 ≤ MQAI% < 60 | Regular | The tool considers an acceptable number of urban design factors |
| 20 ≤ MQAI% < 40 | Poor | The tool considers very few urban design factors |
| 0 ≤ MQAI% < 20 | Awful | The tool considers an insignificant number of urban design factors |
Assessment Items
Sidewalk
- 1.
How does the tool assess the sidewalk network?
| Answer | Description | Point |
| No assessment | The tool does not assess the availability of the sidewalk network along the street | 0 |
| Simple assessment | The tool only assesses the availability of the sidewalk network along the street | 1 |
| Partial assessment | The tool assesses the availability of the sidewalk along the street and one of the following issues of the sidewalk network: (1) completeness; (2) width of the sidewalk network along the street; and (3) presence/number of barriers along the sidewalk | 2 |
| Complete assessment | The tool assesses the availability of the sidewalk along the street and two to three of the following issues of the sidewalk network: (1) completeness; (2) width of the sidewalk network along the street; and (3) presence/number of barriers (obstacles) along the sidewalk | 3 |
- 2.
How does the tool assess path conditions?
| Answer | Description | Point |
| No assessment | The tool does not assess the condition of the path | 0 |
| Simple assessment | The tool simply assesses the path condition * in the study area | 1 |
| Partial assessment | The tool assesses the path condition, and one of the following path condition issues: (1) material ** used; and (2) slope *** | 2 |
| Complete assessment | The tool assesses the path condition and all of the following path condition issues: (1) material used; and (2) slope | 3 |
| * Poor (several bumps, cracks, holes, and weeds), moderate (a few bumps, cracks, holes, and weeds), good (very few bumps, cracks, holes, and weeds), under repair. ** Flat segmented concrete slabs, paving stones, rustic natural stones, and Portuguese mosaic, slippery material (smooth ceramic tiles), rough material (hydraulic tiles, interlocked blocks, flattened concrete), regular, firm, antiskid, and ant vibration material (high strength paving). *** Flat or gentle, moderate slope, steep slope. |
Land Use and Destinations
- 3.
How does the tool assess the mixture of land use?
| Answer | Description | Point |
| No assessment | The tool does not assess the mixture of land uses and activities | 0 |
| Simple assessment | The tool simply assesses the availability of various land uses and activities in the study area | 1 |
| Partial assessment | The tool assesses the availability of land uses and activities in the study area and determines the number of each activity such as residential, retail/commercial, office, public, and/or industrial | 2 |
| Complete assessment | The tool assesses the availability of land uses and activities in the study area and determines the number of each activity and overall desirable land use planning | 3 |
- 4.
How does the tool assess the undesirable land uses (e.g., dilapidated buildings, abandoned buildings, and rights of way of utilities and rail)?
| Answer | Description | Point |
| No assessment | The tool does not assess the undesirable land uses | 0 |
| Simple assessment | The tool simply assesses the availability of various undesirable land uses in the study area | 1 |
| Partial assessment | The tool assesses the availability of undesirable land uses in the study area and determines the number of each undesirable land use | 2 |
| Complete assessment | The tool assesses the availability of undesirable land uses in the study area and determines the number of each undesirable land use and the overall undesirable land use planning | 3 |
- 5.
How does the tool assess the destinations (e.g., local facilities, parks, public transport, services, shops, vehicle parking facilities, and bike parking facilities)?
| Answer | Description | Point |
| No assessment | The tool does not assess the destinations | 0 |
| Simple assessment | The tool simply assesses the availability of various destinations in the study area | 1 |
| Partial assessment | The tool assesses the availability of destinations in the study area and determines the number of destinations OR distance to destinations | 2 |
| Complete assessment | The tool assesses the availability of destinations in the study area and determines the number of destinations AND distance to destinations | 3 |
Street Facilities
- 6.
How does the tool assess the signage?
| Answer | Description | Point |
| No assessment | The tool does not assess the signage | 0 |
| Simple assessment | The tool simply assesses the availability of signage along the path | 1 |
| Partial assessment | The tool assesses the availability of signage along the path and one to three of the following issues in the signs: (1) simplicity of graphics and phrase; (2) contrast to the background; (3) placement of signs in the furnishing zone; (4) height of the signs; and (5) presentation of information in alternative formats | 2 |
| Complete assessment | The tool assesses the availability of signage along the path and four to five of the following issues in the signs: (1) simplicity of graphics and phrase; (2) contrast to the background; (3) placement of signs in the furnishing zone; (4) height of the signs; and (5) presentation of information in alternative formats | 3 |
- 7.
How does the tool assess the signals?
| Answer | Description | Point |
| No assessment | The tool does not assess the signals | 0 |
| Simple assessment | The tool simply assesses the availability of signals along the path | 1 |
| Partial assessment | The tool assesses the availability of signals along the path and one of the following issues in the signals: (1) counter timer for the signal poles; (2) audible signal for the signal poles; and (3) accessibility of the signal buttons to the wheelchair users | 2 |
| Complete assessment | The tool assesses the availability of signals along the path and two to three of the following issues in the signals: (1) counter timer for the signal poles; (2) audible signal for the signal poles; and (3) accessibility of the signal buttons to the wheelchair users | 3 |
- 8.
How does the tool assess the drinking fountains?
| Answer | Description | Point |
| No assessment | The tool does not assess the drinking fountains | 0 |
| Simple assessment | The tool simply assesses the availability of drinking fountains | 1 |
| Partial assessment | The tool assesses the availability of drinking fountains and one of the following issues in the drinking fountains: (1) distance between the drinking fountains; (2) height of drinking fountains; and (3) placement of water fountains in the furnishing zone | 2 |
| Complete assessment | The tool assesses the availability of drinking fountains and two to three of the following issues in the drinking fountains: (1) distance between the drinking fountains; (2) height of drinking fountains; and (3) placement of water fountains in the furnishing zone | 3 |
- 9.
How does the tool assess the bollards?
| Answer | Description | Point |
| No assessment | The tool does not assess the bollards | 0 |
| Simple assessment | The tool simply assesses the availability of bollards in the study area | 1 |
| Partial assessment | The tool assesses the availability of bollards and one of the following issues in the bollards: (1) space between bollards; (2) placement of bollards in the curb extension; and (3) height of bollards | 2 |
| Complete assessment | The tool assesses the availability of bollards and two to three of the following issues in the bollards: (1) space between the bollards; (2) placement of bollards in the curb extension; and (3) height of bollards | 3 |
- 10.
How does the tool assess landscape and trees?
| Answer | Description | Point |
| No assessment | The tool does not assess landscape and trees | 0 |
| Simple assessment | The tool simply assesses the availability of landscape and trees in the study area | 1 |
| Partial assessment | The tool assesses the availability of landscape and trees and one of the following issues in the landscape and trees: (1) vertical clearance of tree branches; (2) placement of trees in the furnishing zone; and (3) distance between trees | 2 |
| Complete assessment | The tool assesses the availability of landscape and trees and two to three of the following issues in the landscape and trees: (1) vertical clearance of tree branches; (2) placement of trees in the furnishing zone; and (3) distance between trees | 3 |
- 11.
How does the tool assess buffers?
| Answer | Description | Point |
| No assessment | The tool does not assess the buffers | 0 |
| Simple assessment | The tool simply assesses the availability of buffers and barriers along the street such as on-street parking | 1 |
| Partial assessment | The tool assesses the availability of buffers and barriers along the street such as on-street parking and type of buffer(s) OR width of a buffer | 2 |
| Complete assessment | The tool assesses the availability of buffers and barriers along the street such as on-street parking and type of buffer(s) AND width of a buffer | 3 |
- 12.
How does the tool assess benches and sitting areas?
| Answer | Description | Point |
| No assessment | The tool does not assess the bench and sitting areas | 0 |
| Simple assessment | The tool simply assesses the availability of bench and sitting areas | 1 |
| Partial assessment | The tool assesses the availability of bench and sitting areas, and one to two of the following issues in the landscape and trees: (1) placement of benches in the furnishing zone; (2) distance from the curb; (3) space for parking a wheelchair or stroller; and (4) distance between the benches | 2 |
| Complete assessment | The tool assesses the availability of benches and sitting areas, and three to four of the following issues in the landscape and trees: (1) placement of benches in the furnishing zone; (2) distance from curb; (3) space for parking a wheelchair or stroller; and (4) distance between the benches | 3 |
- 13.
How does the tool assess surveillance?
| Answer | Description | Point |
| No assessment | The tool does not assess the surveillance | 0 |
| Simple assessment | The tool simply assesses the availability of surveillance in the study area | 1 |
| Partial assessment | The tool assesses the surveillance and active * OR passive ** surveillance | 2 |
| Complete assessment | The tool assesses the surveillance and active AND passive surveillance | 3 |
| * CCTV and security patrols. ** Active frontages, façade solid-void ratio, windows, verandas, and gardens. |
- 14.
How does the tool assess the items related to the disabled?
| Answer | Description | Point |
| No assessment | The tool does not assess the items related to the disabled * | 0 |
| Simple assessment | The tool assesses one of the following issues in the items related to disabled individuals: (1) accessible drinking fountain; (2) accessible toilet; (3) tactile pavement; (4) curb cut; (5) accessible signage and signals; and (6) elevator next to the sky-bridge | 1 |
| Partial assessment | The tool assesses two to four of the following issues in the items related to disabled individuals: (1) accessible drinking fountain; (2) accessible toilet; (3) tactile pavement; (4) curb cut; (5) accessible signage and signals; (6) elevator next to sky-bridge | 2 |
| Complete assessment | The tool assesses five to six of the following issues in the items related to disabled individuals: (1) accessible drinking fountain; (2) accessible toilet; (3) tactile pavement; (4) curb cut; (5) accessible signage and signals; and (6) elevator next to the sky-bridge | 3 |
| * Accessible drinking fountain, accessible toilet, tactile pavement, curb cut, accessible signage and signals, and elevator next to sky-bridge. |
- 15.
How does the tool assess streetscape characters?
| Answer | Description | Point |
| No assessment | The tool does not assess the streetscape characters * | 0 |
| Simple assessment | The tool assesses the availability of one of the following streetscape characters: (1) architectural elements; (2) historic or unique architecture; (3) presence of public space; (4) outdoor-dining areas; (5) abandoned buildings; (6) rundown buildings; and (7) vacant buildings | 1 |
| Partial assessment | The tool assesses the availability of two to five of the following streetscape characters: (1) architectural elements; (2) historic or unique architecture; (3) presence of public space; (4) outdoor-dining areas; (5) abandoned buildings; (6) rundown buildings; and (7) vacant buildings | 2 |
| Complete assessment | The tool assesses the availability of six to seven of the following streetscape characters: (1) architectural elements; (2) historic or unique architecture; (3) presence of public space; (4) outdoor-dining areas; (5) abandoned buildings; (6) rundown buildings; and (7) vacant buildings | 3 |
| * Architectural elements, historic or unique architecture, presence of public space, outdoor dining areas, abandoned buildings, rundown buildings, vacant buildings. |
- 16.
How does the tool assess driveways?
| Answer | Description | Point |
| No assessment | The tool does not assess driveways | 0 |
| Simple assessment | The tool only assesses the availability of the driveways | 1 |
| Partial assessment | The tool assesses the availability of the driveways and driveway width * OR availability of warning facilities ** | 2 |
| Complete assessment | The tool assesses the availability of the driveways and driveway width AND availability of warning facilities | 3 |
| * More than a garage, equal to a garage, and less than a garage. ** Special paving, signs, auditory warning, and mirrors. |
- 17.
How does the tool assess the transit points?
| Answer | Description | Point |
| No assessment | The tool does not assess the transit points | 0 |
| Simple assessment | The tool simply assesses the availability of transit points along the path | 1 |
| Partial assessment | The tool assesses the proximity to transit points * OR accessibility of transit stations ** in the study area | 2 |
| Complete assessment | The tool assesses the proximity to transit points AND accessibility of transit stations in the study area | 3 |
| * The proximity of transit stations to popular landmarks such as squares, towers, and malls. ** Connectivity and continuity of walkways to transit stations. |
Road Attributes
- 18.
How does the tool assess traffic calming features?
| Answer | Description | Point |
| No assessment | The tool does not assess traffic calming features * | 0 |
| Simple assessment | The tool assesses the availability of one of the following traffic calming features: (1) roundabouts; (2) medians; (3) curb bulb-outs; (4) traffic signals; and (5) speed humps | 1 |
| Partial assessment | The tool assesses the availability of two to three of the following traffic calming features: (1) roundabouts; (2) medians; (3) curb bulb-outs; (4) traffic signals; and (5) speed humps | 2 |
| Complete assessment | The tool assesses the availability of four to five of the following traffic calming features: (1) roundabouts; (2) medians; (3) curb bulb-outs; (4) traffic signals; and (5) speed humps | 3 |
| * Roundabouts, medians, curb bulb-outs, traffic signals, and speed humps. |
- 19.
How does the tool assess road attributes?
| Answer | Description | Point |
| No assessment | The tool does not assess road attributes * | 0 |
| Simple assessment | - | 1 |
| Partial assessment | The tool assesses the number of lanes OR street width | 2 |
| Complete assessment | The tool assesses the number of lanes AND street width | 3 |
| * Number of lanes and street width. |
- 20.
How does the tool assess qualitative characteristics?
| Answer | Description | Point |
| No assessment | The tool does not assess traffic qualitative characteristics * | 0 |
| Simple assessment | The tool assesses one of the following issues with respect to the qualitative characteristics: (1) cleanliness; (2) lighting; (3) shading; and (4) color | 1 |
| Partial assessment | The tool assesses two of the following issues with respect to the qualitative characteristics: (1) cleanliness; (2) lighting; (3) shading; and (4) color | 2 |
| Complete assessment | The tool assesses three to four of the following issues with respect to the qualitative characteristics: (1) cleanliness; (2) lighting; (3) shading; and (4) color | 3 |
| * Cleanliness/graffiti, lighting, shading, and color. |
- 21.
How does the tool assess the network design?
| Answer | Description | Point |
| No assessment | The tool does not assess the network design | 0 |
| Simple assessment | The tool simply assesses one of the flowing network design factors: (1) pattern of street network *; (2) directness of walkways/routes **; (3) length of blocks; (4) alternative routes ***; and (5) the presence and frequency of pedestrian crossings along the network | 1 |
| Partial assessment | The tool simply assesses two of the flowing network design issues: (1) pattern of street network; (2) directness of walkways/routes; (3) length of blocks; (4) alternative routes; and (5) the presence and frequency of pedestrian crossings along the network | 2 |
| Complete assessment | The tool simply assesses three to four of the flowing network design issues: (1) pattern of street network; (2) directness of walkways/routes; (3) length of blocks; (4) alternative routes; and (5) the presence and frequency of pedestrian crossings along the network | 3 |
| * Grid or cul-de-sac. ** The number of directional changes. *** Number and type of alternative routes available between the origin and destination. |
References
- Hatamzadeh, Y. Working commuters’ tendency toward a travel pattern with potentially more walking: Examining the relative influence of personal and environmental measures. Res. Transp. Econ. 2021, 86, 101060. [Google Scholar] [CrossRef]
- Oxley, J.; O’Hern, S.; Burtt, D.; Rossiter, B. Falling while walking: A hidden contributor to pedestrian injury. Accid. Anal. Prev. 2018, 114, 77–82. [Google Scholar] [CrossRef] [PubMed]
- Peng, H.; Ma, X.; Chen, F. Examining Injury Severity of Pedestrians in Vehicle–Pedestrian Crashes at Mid-Blocks Using Path Analysis. Int. J. Environ. Res. Public Health 2020, 17, 6170. [Google Scholar] [CrossRef] [PubMed]
- Alfonzo, M.A. To walk or not to walk? The hierarchy of walking needs. Environ. Behav. 2005, 37, 808–836. [Google Scholar] [CrossRef]
- Mehta, V. Walkable streets: Pedestrian behavior, perceptions and attitudes. J. Urban. 2008, 1, 217–245. [Google Scholar] [CrossRef]
- Handy, S.L.; Clifton, K.J. Evaluating Neighborhood Accessibility: Possibilities and Practicalities. J. Transp. Stat. 2001, 4, 67–78. [Google Scholar]
- Litman, T. Evaluating accessibility for transportation planning. Vic. Transp. Policy Inst. Vic. Can. 2012, 1, 1–50. [Google Scholar]
- Litman, T. Evaluating Transportation Equity; Victoria Transport Policy Institute: Victoria, BC, Canada, 2013. [Google Scholar]
- Singleton, P.A. A Theory of Travel Decision-Making with Applications for Modeling Active Travel Deman; Portland State University: Portland, OR, USA, 2013. [Google Scholar]
- Majid, M.R.; Nordin, A.; Johar, F.; Tifwa, H. Travel Emission Profile of Iskandar Malaysia Neighbourhoods from Pre-1980s to 2000s. IOP Conf. Ser. Earth Environ. Sci. 2014, 18, 12161. [Google Scholar] [CrossRef]
- Aghaabbasi, M.; Moeinaddini, M.; Zaly Shah, M.; Asadi Shekari, Z.; Kermani, M.A. Evaluating the capability of walkability audit tools for assessing sidewalks. Sustain. Cities Soc. 2018, 37, 475–484. [Google Scholar] [CrossRef]
- Alfonzo, M.; Boarnet, M.G.; Day, K.; McMillan, T.; Anderson, C.L. The Relationship of Neighbourhood Built Environment Features and Adult Parents’ Walking. J. Urban. Des. 2008, 13, 29–51. [Google Scholar] [CrossRef]
- Evenson, K.R.; Sotres-Alvarez, D.; Herring, A.H.; Messer, L.; Laraia, B.A.; Rodríguez, D.A. Assessing urban and rural neighborhood characteristics using audit and GIS data: Derivation and reliability of constructs. Int. J. Behav. Nutr. Phys. Act. 2009, 6, 44. [Google Scholar] [CrossRef]
- Haans, A.; de Kort, Y.A.W. Light distribution in dynamic street lighting: Two experimental studies on its effects on perceived safety, prospect, concealment, and escape. J. Environ. Psychol. 2012, 32, 342–352. [Google Scholar] [CrossRef]
- Park, Y.; Garcia, M. Pedestrian safety perception and urban street settings. Int. J. Sustain. Transp. 2020, 14, 860–871. [Google Scholar] [CrossRef]
- Ulak, M.B.; Kocatepe, A.; Yazici, A.; Ozguven, E.E.; Kumar, A. A stop safety index to address pedestrian safety around bus stops. Saf. Sci. 2021, 133, 105017. [Google Scholar] [CrossRef]
- Shumi, S.; Zuidgeest, M.; Martinez, J.; Efroymson, D.; van Maarseveen, M. Understanding the Relationship Between Walkability and Quality-of-Life of Women Garment Workers in Dhaka, Bangladesh. Appl. Res. Qual. Life 2015, 10, 263–287. [Google Scholar] [CrossRef]
- Fahed, J.; Kinab, E.; Ginestet, S.; Adolphe, L. Impact of urban heat island mitigation measures on microclimate and pedestrian comfort in a dense urban district of Lebanon. Sustain. Cities Soc. 2020, 61, 102375. [Google Scholar] [CrossRef]
- Kim, H.; Lee, K.; Kim, T. Investigation of pedestrian comfort with wind chill during winter. Sustainability 2018, 10, 274. [Google Scholar]
- Lindelöw, D.; Svensson, Å.; Sternudd, C.; Johansson, M. What limits the pedestrian? Exploring perceptions of walking in the built environment and in the context of every-day life. J. Transp. Health 2014, 1, 223–231. [Google Scholar] [CrossRef]
- Tiwari, R. Designing a safe walkable city. Urban. Des. Int. 2014, 20, 12–27. [Google Scholar] [CrossRef]
- Zakaria, J.; Ujang, N. Comfort of Walking in the City Center of Kuala Lumpur. Procedia Soc. Behav. Sci. 2015, 170, 642–652. [Google Scholar] [CrossRef]
- Cerin, E.; Chan, K.W.; Macfarlane, D.J.; Lee, K.Y.; Lai, P.C. Objective assessment of walking environments in ultra-dense cities: Development and reliability of the Environment in Asia Scan Tool--Hong Kong version (EAST-HK). Health Place 2011, 17, 937–945. [Google Scholar] [CrossRef] [PubMed]
- Talavera-Garcia, R.; Soria-Lara, J.A. Q-PLOS, developing an alternative walking index: A method based on urban design quality. Cities 2015, 45, 7–17. [Google Scholar] [CrossRef]
- Sdoukopoulos, A.; Verani, E.; Nikolaidou, A.; Gavanas, N.; Pitsiava-Latinopoulou, M.; Mikiki, F.; Mademli, E.; Pallas, C. Development and implementation of walkability audits in Greek medium-sized cities: The case of the Serres’ city centre. Transp. Res. Procedia 2017, 24, 337–344. [Google Scholar] [CrossRef]
- Samarasekara, G.N.; Fukahori, K.; Kubota, Y. Environmental correlates that provide walkability cues for tourists: An analysis based on walking decision narrations. Environ. Behav. 2011, 43, 501–524. [Google Scholar] [CrossRef]
- Millington, C.; Ward Thompson, C.; Rowe, D.; Aspinall, P.; Fitzsimons, C.; Nelson, N.; Mutrie, N.; Collaboration, S.P.-t.S.P.A.R. Development of the Scottish Walkability Assessment Tool (SWAT). Health Place 2009, 15, 474–481. [Google Scholar] [CrossRef]
- Ferrer, S.; Ruiz, T.; Mars, L. A qualitative study on the role of the built environment for short walking trips. Transp. Res. Part. F: Traffic Psychol. Behav. 2015, 33, 141–160. [Google Scholar] [CrossRef]
- Aghaabbasi, M.; Moeinaddini, M.; Shah, M.Z.; Asadi-Shekari, Z. A new assessment model to evaluate the microscale sidewalk design factors at the neighbourhood level. J. Transp. Health 2017, 5, 97–112. [Google Scholar] [CrossRef]
- Nasrin, S.; Afifah, F. Walkability assessment tool for a developing country. IOP Conf. Ser. Mater. Sci. Eng. 2019, 527, 12073. [Google Scholar] [CrossRef]
- Albers, P.N.; Wright, C.; Olwoch, J. Developing a south African pedestrian environment. South. Afr. J. Sci. 2010, 106, 1–8. [Google Scholar]
- Clifton, K.J.; Livi Smith, A.D.; Rodriguez, D. The development and testing of an audit for the pedestrian environment. Landsc. Urban. Plan. 2007, 80, 95–110. [Google Scholar] [CrossRef]
- Pikora, T.J.; Bull, F.C.; Jamrozik, K.; Knuiman, M.; Giles-Corti, B.; Donovan, R.J. Developing a Reliable Audit Instrument to Measure the Physical Environment for Physical Activity. Am. J. Prev. Med. 2002, 23, 187–194. [Google Scholar] [CrossRef]
- Troped, P.J.; Cromley, E.K.; Fragala, M.S.; Melly, S.J.; Hasbrouck, H.H.; Gortmaker, S.L.; Brownson, R.C. Development and reliability and validity testing of an audit tool for trail/path characteristics: The Path Environment Audit Tool (PEAT). J. Phys. Act. Health 2006, 3, S158. [Google Scholar] [CrossRef] [PubMed]
- Kihl, M.; Brennan, D.; Gabhawala, N.; List, J.; Mittal, P. Livable Communities: An Evaluation Guide. Available online: http://assets.aarp.org/rgcenter/il/d18311_communities.pdf (accessed on 28 June 2020).
- Saelens, B.E.; Sallis, J.F.; Black, J.B.; Chen, D. Neighborhood-based differences in physical activity: An environment scale evaluation. Am. J. Public Health 2003, 93, 1552–1558. [Google Scholar] [CrossRef] [PubMed]
- Litman, T. Well Measured Developing Indicators for Sustainable and Livable Transport Planning; Victoria Transport Policy Institute: Victoria, BC, Canada, 2019; Volume 19. [Google Scholar]
- Tchinda, P.E.; Kim, S.-N. The paradox of “eyes on the street”: Pedestrian density and fear of crime in Yaoundé, Cameroon. Sustainability 2020, 12, 5300. [Google Scholar] [CrossRef]
- Sapawi, R.; Said, I. Application of Rasch Model in Constructing Walkability Indices for Urban Neighborhood Area. Asian J. Environ. Behav. Stud. 2013, 4, 1–14. [Google Scholar] [CrossRef]
- Cubukcu, E. Walking for Sustainable Living. Procedia Soc. Behav. Sci. 2013, 85, 33–42. [Google Scholar] [CrossRef]
- Hernandez, D. Vulnerable Populations and the Built Environment. Am. J. Public Health 2013, 103, E32–E34. [Google Scholar] [CrossRef]
- Cui, J.; Allan, A.; Taylor, M.A.; Lin, D. Developing Shanghai underground pedestrian system under urbanization: Mobility, functionality and equity. J. Archit. Urban. 2012, 36, 283–297. [Google Scholar] [CrossRef]
- MacNeil, L. Steps to a Walkable Community: A Guide for Citizens, Planners, and Engineers; National Academies of Sciences Engineering Medicine: Washington, DC, USA, 2012. [Google Scholar]
- Matan, A.; Newman, P. Jan Gehl and new visions for walkable Australian cities. Spec. Ed. A Future Beyond Car 2012, 17, 30–41. [Google Scholar]
- Funk, C. Walkability of Transit-Oriented Development: Evaluating the Pedestrian Environment of Metro Vancouver’s Regional City Centres; Queen’s University: Kingston, ON, Canada, 2012. [Google Scholar]
- Southworth, M. Designing the walkable city. J. Urban. Plan. Dev. 2005, 131, 246–257. [Google Scholar] [CrossRef]
- Van Cauwenberg, J.; Van Holle, V.; Simons, D.; Deridder, R.; Clarys, P.; Goubert, L.; Nasar, J.; Salmon, J.; De Bourdeaudhuij, I.; Deforche, B. Environmental factors influencing older adults’ walking for transportation: A study using walk-along interviews. Int J. Behav Nutr Phys. Act. 2012, 9, 85. [Google Scholar] [CrossRef]
- Asadi-Shekari, Z.; Moeinaddini, M.; Zaly Shah, M. Disabled pedestrian level of service method for evaluating and promoting inclusive walking facilities on urban streets. J. Transp. Eng. 2013, 139, 181–192. [Google Scholar] [CrossRef]
- Samarasekara, G.; Fukahori, K.; Kubota, Y. Walkability Evaluation of Streetscapes: Development of Prediction Equations for Walking Needs of Tourists; University of Moratuwa: Moratuwa, Sri Lanka, 2013; pp. 110–117. [Google Scholar]
- Crews, D.E.; Zavotka, S. Aging, disability, and frailty: Implications for universal design. J. Physiol. Anthropol. 2006, 25, 113–118. [Google Scholar] [CrossRef]
- Foster, S.; Giles-Corti, B. The built environment, neighborhood crime and constrained physical activity: An exploration of inconsistent findings. Prev. Med. 2008, 47, 241–251. [Google Scholar] [CrossRef]
- Azemati, H.R.; Bagheri, M.; Hosseini, S.B.; Maleki, S.N. An assessment of pedestrian networks in accessible neighborhoods: Traditional neighborhoods in Iran. Int. J. Archit. Eng. Urban. Plan. 2011, 21, 52–59. [Google Scholar]
- Karim, H.A.; Azmi, D.I. Convenience and Safety of Walking Experience in Putrajaya Neighbourhood Area. Procedia Soc. Behav. Sci. 2013, 101, 318–327. [Google Scholar] [CrossRef][Green Version]
- Slater, S.J.; Nicholson, L.; Chriqui, J.; Barker, D.C.; Chaloupka, F.J.; Johnston, L.D. Walkable communities and adolescent weight. Am. J. Prev. Med. 2013, 44, 164–168. [Google Scholar] [CrossRef]
- Harkey, D.L.; Zegeer, C.V. PEDSAFE: Pedestrian Safety Guide and Countermeasure Selection System; Federal Highway Administration: Washington, DC, USA, 2004; p. 330. [Google Scholar]
- GDOT. Pedestrian and Streetscape Guide; GDOT: Monticello, IL, USA, 2003; pp. 1–222. [Google Scholar]
- Keat, L.K.; Yaacob, N.M.; Hashim, N.R. Campus Walkability in Malaysian Public Universities: A Case-Study of Universiti Malaya. J. Malays. Inst. Plan. 2016, 14, 101–114. [Google Scholar] [CrossRef]
- O’Connor, D.; Borscheid, M.; Reid, O. Northside Partnership “Healthy Community” Pilot Area Walkability Audit. Proc. Ir. Transp. Res. Netw. 2015. [Google Scholar] [CrossRef]
- Kolbe-Alexander, T.L.; Pacheco, K.; Tomaz, S.A.; Karpul, D.; Lambert, E.V. The relationship between the built environment and habitual levels of physical activity in South African older adults: A pilot study. BMC Public Health 2015, 15, 518. [Google Scholar] [CrossRef]
- Lee, B.J.; Jang, T.Y.; Wang, W.; Namgung, M. Design criteria for an urban sidewalk landscape considering emotional perception. J. Urban. Plan. Dev. 2009, 135, 133–140. [Google Scholar] [CrossRef]
- Krambeck, H.V. The Global Walkability Index; Massachusetts Institute of Technology: Cambridge, MA, USA, 2006. [Google Scholar]
- Kim, S.; Choi, J.; Kim, Y. Determining the sidewalk pavement width by using pedestrian discomfort levels and movement characteristics. KSCE J. Civ. Eng. 2011, 15, 883–889. [Google Scholar] [CrossRef]
- Landis, B.W.; Vattikuti, V.R.; Ottenberg, R.M.; McLeod, D.S.; Guttenplan, M. Modeling the roadside walking environment: Pedestrian level of service. Transp. Res. Rec. J. Transp. Res. Board 2001, 1773, 82–88. [Google Scholar] [CrossRef]
- Sarkar, S. Qualitative evaluation of comfort needs in urban walkways in major activity centers. Transp. Q. 2003, 57, 39–59. [Google Scholar]
- Galanis, A.; Eliou, N. Evaluation of the pedestrian infrastructure using walkability indicators. WSEAS Trans. Environ. Dev. 2011, 7, 385–394. [Google Scholar]
- Monteiro, F.B.; Campos, V.B. A proposal of indicators for evaluation of the urban space for pedestrians and cyclists in access to mass transit station. Procedia Soc. Behav. Sci. 2012, 54, 637–645. [Google Scholar] [CrossRef][Green Version]
- Rahimiashtiani, Z.; Ujang, N. Pedestrian Satisfaction with Aesthetic, Attractiveness and Pleasurability: Evaluating the Walkability of ChaharaghAbbasi Street in Isfahan, Iran. ALAM CiptaInt. J. Sustain. Trop. Des. Res. Pract. 2013, 6, 13–22. [Google Scholar]
- Clifton, K.J.; Livi, A.; Rodríguez, D.A. Pedestrian Environment Data Scan (PEDS) Tool. Available online: http://planningandactivity.unc.edu/RP1.htm (accessed on 6 February 2020).
- Emery, J.; Crump, C.; Bors, P. Reliability and validity of two instruments designed to assess the walking and bicycling suitability of sidewalks and roads. Am. J. Health Promot. 2003, 18, 38–46. [Google Scholar] [CrossRef]
- Evenson, K. PIN3 Neighborhood Audit Instrument; MIDSS: Galway, Ireland, 2009. [Google Scholar]
- Boarnet, M.G.; Day, K.; Alfonzo, M.; Forsyth, A.; Oakes, M. The Irvine—Minnesota inventory to measure built environments: Reliability tests. Am. J. Prev. Med. 2006, 30, 153–159. [Google Scholar] [CrossRef]
- Brownson, R.C.; Ramirez, L.K.B.; Hoehner, C.M.; Cook, R.A. Analytic Audit Tool and Checklist Audit Tool; BEL: Trois-Rivières, QC, Canada, 2003; pp. 1–9. [Google Scholar]
- Hoehner, C. Active Neighborhood Checklist; BEL: Trois-Rivières, QC, Canada, 2011. [Google Scholar]
- Cain, K.L.; Millstein, R.A.; Geremia, C.M. Microscale Audit of Pedestrian Streetscapes (MAPS): Data Collection & Scoring Manual; University California San Diego: San Diego, CA, USA, 2012; Available online: http://sallis.ucsd.edu/measures/maps (accessed on 6 February 2020).
| Publisher’s Note: MDPI stays neutral with regard to jurisdictional claims in published maps and institutional affiliations. |
© 2021 by the authors. Licensee MDPI, Basel, Switzerland. This article is an open access article distributed under the terms and conditions of the Creative Commons Attribution (CC BY) license (https://creativecommons.org/licenses/by/4.0/).


 ,
, 


