Article

Prediction of the Infectious Outbreak COVID-19 and Prevalence of Anxiety: Global Evidence

1
Faculty of Computing and Information Technology, King Abdulaziz University, Jeddah 80200, Saudi Arabia
2
Centre for Lifelong Learning, Universiti Brunei Darussalam, Bandar Seri Begawan BE1410, Brunei
3
Faculty of Biological Sciences, Quaid-i-Azam University, Islamabad 44000, Pakistan
4
Maroof International Hospital, Islamabad 44000, Pakistan
5
Department of Artificial Intelligence, Faculty of Computer Science and Information Technology, Universiti Malaya, Kuala Lumpur 50603, Malaysia
6
Center for Modern Information Management, School of Management, Huazhong University of Science and Technology, Wuhan 430074, China
7
Hamdard Institute of Pharmaceutical Sciences, Hamdard University, Islamabad 44000, Pakistan
8
TMR Consulting, Microsoft Gold Partners, Islamabad 44000, Pakistan
9
School of Science and Technology (SST), Bangladesh Open University (BOU), Gazipur 1705, Bangladesh
10
School of Information Management and Engineering, Zhejiang University of Finance and Economics, Hangzhou 310018, China
*
Authors to whom correspondence should be addressed.
Sustainability 2021, 13(20), 11339; https://doi.org/10.3390/su132011339
Submission received: 6 July 2021 / Revised: 28 September 2021 / Accepted: 1 October 2021 / Published: 14 October 2021
(This article belongs to the Special Issue Sustainable Development of Social Commerce in the New Era)

Abstract

:
Forecasting disease outbreaks in real-time using time-series data can help for the planning of public health interventions. We used a support vector machine (SVM) model using epidemiological data provided by Johns Hopkins University Centre for Systems Science and Engineering (JHU CCSE), World Health Organization (WHO), and the Centers for Disease Control and Prevention (CDC) to predict upcoming records before the WHO made an official declaration. Our study, conducted on the time series data available from 22 January till 10 March 2020, revealed that COVID-19 was spreading at an alarming rate and progressing towards a pandemic. The initial insight that confirmed COVID-19 cases were increasing was because these received the highest number of effects for our selected dataset from 22 January to 10 March 2020, i.e., 126,344 (64%). The recovered cases were 68289 (34%), and the death rate was around 2%. Moreover, we classified the tweets from 22 January to 15 April 2020 into positive and negative sentiments to identify the emotions (stress or relaxed) posted by Twitter users related to the COVID-19 pandemic. Our analysis identified that tweets mostly conveyed a negative sentiment with a high frequency of words for #coronavirus and #lockdown amid COVID-19. However, these anxiety tweets are an alarm for healthcare authorities to devise plans accordingly.

1. Introduction

A sequence of mysterious instances of pneumonia-like illnesses began in Wuhan, Hubei Province, China, on 8 December 2019 [1,2]. When it first came out, it was referred to as SARS-CoV-2, but it has since been changed to reflect its new name, the new coronavirus (COVID-19) responsible for infectious coronavirus disease-19 [3,4,5]. In terms of genetic relationships, it is related to the severe acute respiratory syndrome (SARS) virus and the Middle East respiratory syndrome (MERS) [6,7]. The infection has spread to over 200 countries [8] and affected 186,410,350 globally, with 4,024,946 deaths [9] up to 11 July 2021. Scientists believe that COVID-19 originated from the Rhinolophus bat, as a virus isolated from this species has shown >96% similarity [10].
The mortality rate of COVID-19 is 2%; however, its transmission rate seems quite high as observed from day to day increasing COVID-19 cases. COVID-19 expanded its niche to Iran and Italy in mid-February 2020, and cases originating from Iran spread to Afghanistan, Bahrain, Iraq, Kuwait, Lebanon, Oman, Pakistan, Qatar, Saudi Arabia, and the United Arab Emirates, putting GCC countries on a high alert. Our research group kept observing the coronavirus transmission rate, and we felt that it was the right time to analyze available epidemiological data using exploratory data analysis (EDA) and predictive analysis using a support vector machine (SVM) to develop visual models and predict the upcoming COVID-19 pandemic. The discipline of data analysis known as EDA is used to analyze and understand the insights contained within the provided data collection. Furthermore, EDA is a crucial step before implementing algorithms and models, as EDA can generate the further purification of data as well as the profusion of data visualizations [11,12]. In dynamic models, assumptions are made about the values of parameters without looking at the real-world dataset, while EDA uncovers hidden information in a dataset. This analysis helps to increase awareness among the masses about the high rate of transmission and alert the authorities to take timely measures for controlling this global public health crisis [13].
Up to 11 July 2021, 186,410,350 viral infection cases have been reported globally with a death toll of 4,024,946 [9]. The initial cluster of reported cases, namely those who visited the local seafood market in Wuhan, hints towards zoonosis [13]. However, as our research group keenly observed the changing viral transmission statistics being updated daily by John Hopkins [14], CDC [15], and WHO [16], we strongly felt that the epidemic situation was now progressing towards a COVID-19 pandemic. For this purpose, we evaluated the death toll, recovered cases, and the COVID-19 confirmed cases. In this study, the word “pandemic” is used to refer to a global spread of an emerging infection, where the number of individuals infected at a particular time exceeds the treatment capacity [17]. Literature reveals that mathematical modeling has been employed to analyze the movement of infectious illnesses to learn more about them [18]. We as biologists, data scientists, and health care workers felt that our prime responsibility was to predict the upcoming pandemic and anxiety among the public and ring an alarm bell for all concerned authorities, including WHO and CDC so that they could take the critical measures necessary to stop the upcoming pandemic.
Moreover, this study comes up with an alternate, complementary method in line with Shahi et al. [19]. We crawled tweets starting from 10 January 2021 until 15 April 2020 from all around the globe, particularly from Iran and Pakistan. Taking signals from foreign counterparts, Pakistani authorities decided against imposing a country-wide partial lockdown on 23 March for 21 days [20,21]. Pakistan and Iran are neighboring and developing nations with limited health resources with a high risk of irreversible damage. The fact that only aggressive measures could help flatten the curve could not be overlooked. Owing to lockdown situations, individual activity on social media, including Twitter, increased significantly worldwide. In recent times, many studies have highlighted the importance of social media for data extraction for a better understanding of public attitudes during a public health crisis. This can help in the use of social media platforms as supporting tools for health promotion [22,23,24]. The COVID-19 outbreak lockdown provided an opportunity for researchers to study public data from social media platforms to assess people’s attitudes and sentiments. This will assist policymakers and healthcare professionals in identifying the main concerns and solving them more efficiently. People from different regions use different languages to express emotions and or opinions [25,26,27]. However, the most commonly used language is English. People can express their thoughts and feelings more openly than ever before with the use of social media networks such as Twitter [28,29]. Therefore, we used Twitter to gauge people’s feelings (Iranians and Pakistanis) towards the COVID-19 pandemic lockdown. The aim was to predict the spread of disease and public response against it. Therefore, we used machine learning to predict the spread and sentiment analysis to capture people’s sentiments related to COVID-19 pandemic lockdowns to help higher authorities, psychiatrists, and policymakers for predictions and timely actions by looking into people’s sentiments. Several machine learning algorithms can be utilized for predictive analysis, such as SVM, NB, -K-NN, DT, and DL [30,31]. However, we used a support vector machine (SVM), which is recently used in the literature for multi-classification [32,33,34].
The following are the most significant contributions drawn from this research:
  • In connection with the COVID-19 epidemic, a variety of research projects were carried out. However, limited research has paid attention to the prediction of a pandemic. Therefore, in this paper, we used predictive analysis to determine the trend of the growing epidemic curve.
  • This study conducted a sentiment analysis using Twitter in addition to EDA, which was a previously unexplored area in terms of lockdown circumstances. While EDA explores the hidden functionality of the data, sentiment analysis assists to comprehend the emotional state of the behavioral pattern.
  • Additionally, this study validated the usefulness of social media data for examining health-related communications, as well as for determining the emotional condition of the public during a healthcare crisis.
The remainder of the paper is structured as follows: Section 2 follows with related works and then is followed by Methods in Section 3. Section 4 emphasizes the experimental outcomes. Section 5 summarizes the key findings, while Section 6 considers implications and potential limitations.

2. Related Works

EDA is a technique that takes the supplied dataset and analyzes it to obtain information that might be useful. The method uses a visual representation of the facts to assist with betting comprehension and to improve decision-making. We believe that visualization is an excellent tool for detecting patterns, predicting future behavior, and recognizing interconnectedness. The primary goal of performing an EDA is to assist healthcare professionals in determining the pattern of COVID-19 inflation rate variation. EDA mostly assists in the analysis and formation of a comprehensive and wide understanding of the dataset as well as the potential that arises when specific conditions are met. EDA and data processing produces the most critical characteristics that aid in the selection of the most qualified candidates for forming a predictive system [35].
As the COVID-19 epidemic is quickly spreading throughout the globe, we need to determine the number of unique cases that have been affected by COVID-19, as well as examine epidemiological data through the EDA [36] approach. Because of the fast spread of COVID-19, we considered a complete daily data set and determined that it is necessary to combine case review with epidemic analysis to better understand the epidemiological features and seriousness of the illness. In addition to assembling a comprehensive dataset, this investigation examines the various trends in the number of reported instances of COVID-19. The results of this research also raise questions about whether COVID-19 is on the brink of a fast outbreak in the coming days or if there is potential to flatten the disease’s distribution curve.
In addition, the COVID-19 epidemic has had a negative impact on the health and well-being of the general public throughout the globe. For example, in [37] it was shown that hospitalized patients worried about their safety, loneliness, exhaustion, and resentment during the COVID-19 epidemic. They felt nervous as a consequence of fever and insomnia-related symptoms. People directly affected by the illness, as well as the masses, experience anxiety as a result of high levels of participation and danger of mortality. More patients will suffer both physical and psychological issues due to the increased number of infected individuals and their deaths.
Moreover, some researchers have examined the effects of COVID-19 on students’ psychological well-being, while others have emphasized the risks to students even during the lockdown. Hasan and Bao [38] indicated that the leading cause of students’ psychological distress during COVID-19 is their fear of academic year loss.
COVID-19 lockdowns have restricted movement, and people have canceled their travel plans, which has impacted the transportation sector as well [39,40]. Recent research has examined the inequalities in learning resulting from digital discrimination during COVID-19, and it showed that students are receiving unbalanced learning chances because of it and fall into mental distress [41,42,43,44]. When schools are not open, and children are being told to stay indoors, their mental health may be negatively impacted in many ways. To fully comprehend the psychological ramifications of a pandemic of this scale, mental health research must be performed. This study attempts to investigate the relationship between lockdown and social media use, measure the level of health information sharing, and include more data to support future research.
Social media has permeated every aspect of our lives, and because of this, it is an excellent platform for individuals to express their concerns by crossing geographical borders [45]. Social media analytics may be used by public health experts and government officials for a variety of purposes. The functionality allows its users to understand and experience the emotional transitions of the population while delivering dynamic and up-to-date information on public knowledge and understanding and reaction to crises, helping emergency responders to handle the situation more effectively [46]. To explore how news information has been disseminated, Petersen and Gerken [47] examined social media and studied the structure of Twitter networks to see how news stories were shared. Petersen and Gerken [47] found 13 distinct themes associated with COVID-19 hashtag use in 6.9 million tweets. The most popular themes were “COVID-19 identifying”, “measure taken”, “geographical”, and, “news and media”. Singh et al. [48] have a major issue with the fact that many Twitter users worry and are fearful of the pandemic. Furthermore, the increased usage of social media data allows for the monitoring of people’s health communication behavior in real-time and at no cost. For the sake of this specific context, social media platforms like Twitter are particularly pertinent, since they exhibit patterns of communication, such as using hashtags to showcase individual-generated information [49].

3. Materials and Methods

3.1. Epidemiological Data

We utilized a reliable open COVID-19 dataset provided by the JHU CCSE [14]. This time-series data is available in both the dashboard and Google sheet format and is daily updated. Therefore, cases reported every day are cumulative cases for the respective day in the respective country. This dataset became publicly available on 22 January 2020. We analyzed a time series of data, from 22 January 2020 to 10 March 2020. The date of 10 March 2020 was chosen as a cutoff, as we regularly monitored reliable data-sharing resources that reflected a spike in several confirmed cases. It was observed that the COVID-19 had spread to former safer zones.

3.1.1. Time-Series Data Analysis

We used two data analysis methods, i.e., EDA and predictive analysis using SVM. We also compared the time-series data from multiple reliable web sources, i.e., WHO, (JHU CCSE), CDC, and CAN [14,15,16]. The main aim of applying EDA was to gain insight into the data trends and obtain confidence for further analysis in conjunction with a machine-learning algorithm. Such analysis is crucial in data science, which allows us to achieve particular insights and essential statistical measures [50].

3.1.2. Data Preprocessing

Initially, raw data were cleaned, followed by identifying missing data and removing duplicates through manual labeling [51,52].

3.1.3. Support Vector Machine (SVM) Model for Prediction

Specific machine learning algorithms such as SVM are used frequently for predictive analysis [53,54,55]. We divided input data into three classes in this work: confirmed COVID-19 cases, recovered cases, and deaths. Data were used for training the SVM model to predict the threat of an emerging pandemic. SVM is a binary classification tool that cannot be applied directly to multiclass problems. To classify multiclass instances, we used the one-against-all technique, which clusters binary classifications by class [56]. Specifically, three binary SVMs (3 is the number of classes) were constructed in this study, with each binary classifier distinguishing one level from the rest of the classes. Choosing the parameter (C) and the type of kernel function to use while running an SVM model is another critical step [57]. Parameter C was selected, and the value of 2 was achieved as the best value in this research using the leave-one-out cross-validation technique [58].
h ( x ) = w T x + b ;
For any new point z, the class of support vector machines classifier is predicted as
ˆ y = s i g n ( h ( z ) ) = s i n g ( w T z + b )
where the sign (·) function returns −1 if its argument is negative and +1 if its argument is positive [59]. SVMs are intrinsically two-class classifiers; a multiclass problem is formed through the construction of multiclass support vector machines, where a two-class classifier is developed over a feature vector Φ ( x , y ) obtained from the pair that constitutes the class of the datum and the input characteristics.
The classifier selects the class at test time using the following expression:
y = a r g m a x y   w T Φ ( x , y )
We used the discussed model for this study.

3.2. Twitter Data

We analyzed Twitter tweets for assessing sentiments of the Iranian and Pakistani public amid the COVID-19 lockdown. The Twitter source data was provided by GNIP, a social media analytics company acquired by Twitter in 2014; since then, GNIP has become the official Twitter data vendor. For this study, to access the Twitter API, we used the well-supported Python package named Tweepy, which offers very comprehensive Twitter API compatibility. Tweets were extracted using the hashtag #LockdownPakistan from 22 January to 15 April 2020. The hashtags #LocdownPakistan and #LockdownIran, and #coronavirus used were all about the novel coronavirus, which is one of the most often used scientific and news media terminologies. A total of 2500 tweets were considered for the analysis.

Model Building

For model building, we used the training set composed of 70% tweets of the polarity. A supervised machine learning algorithm in Python was used for this purpose. We wrote the script using the stochastic gradient descent machine learning method to validate the model.

4. Results

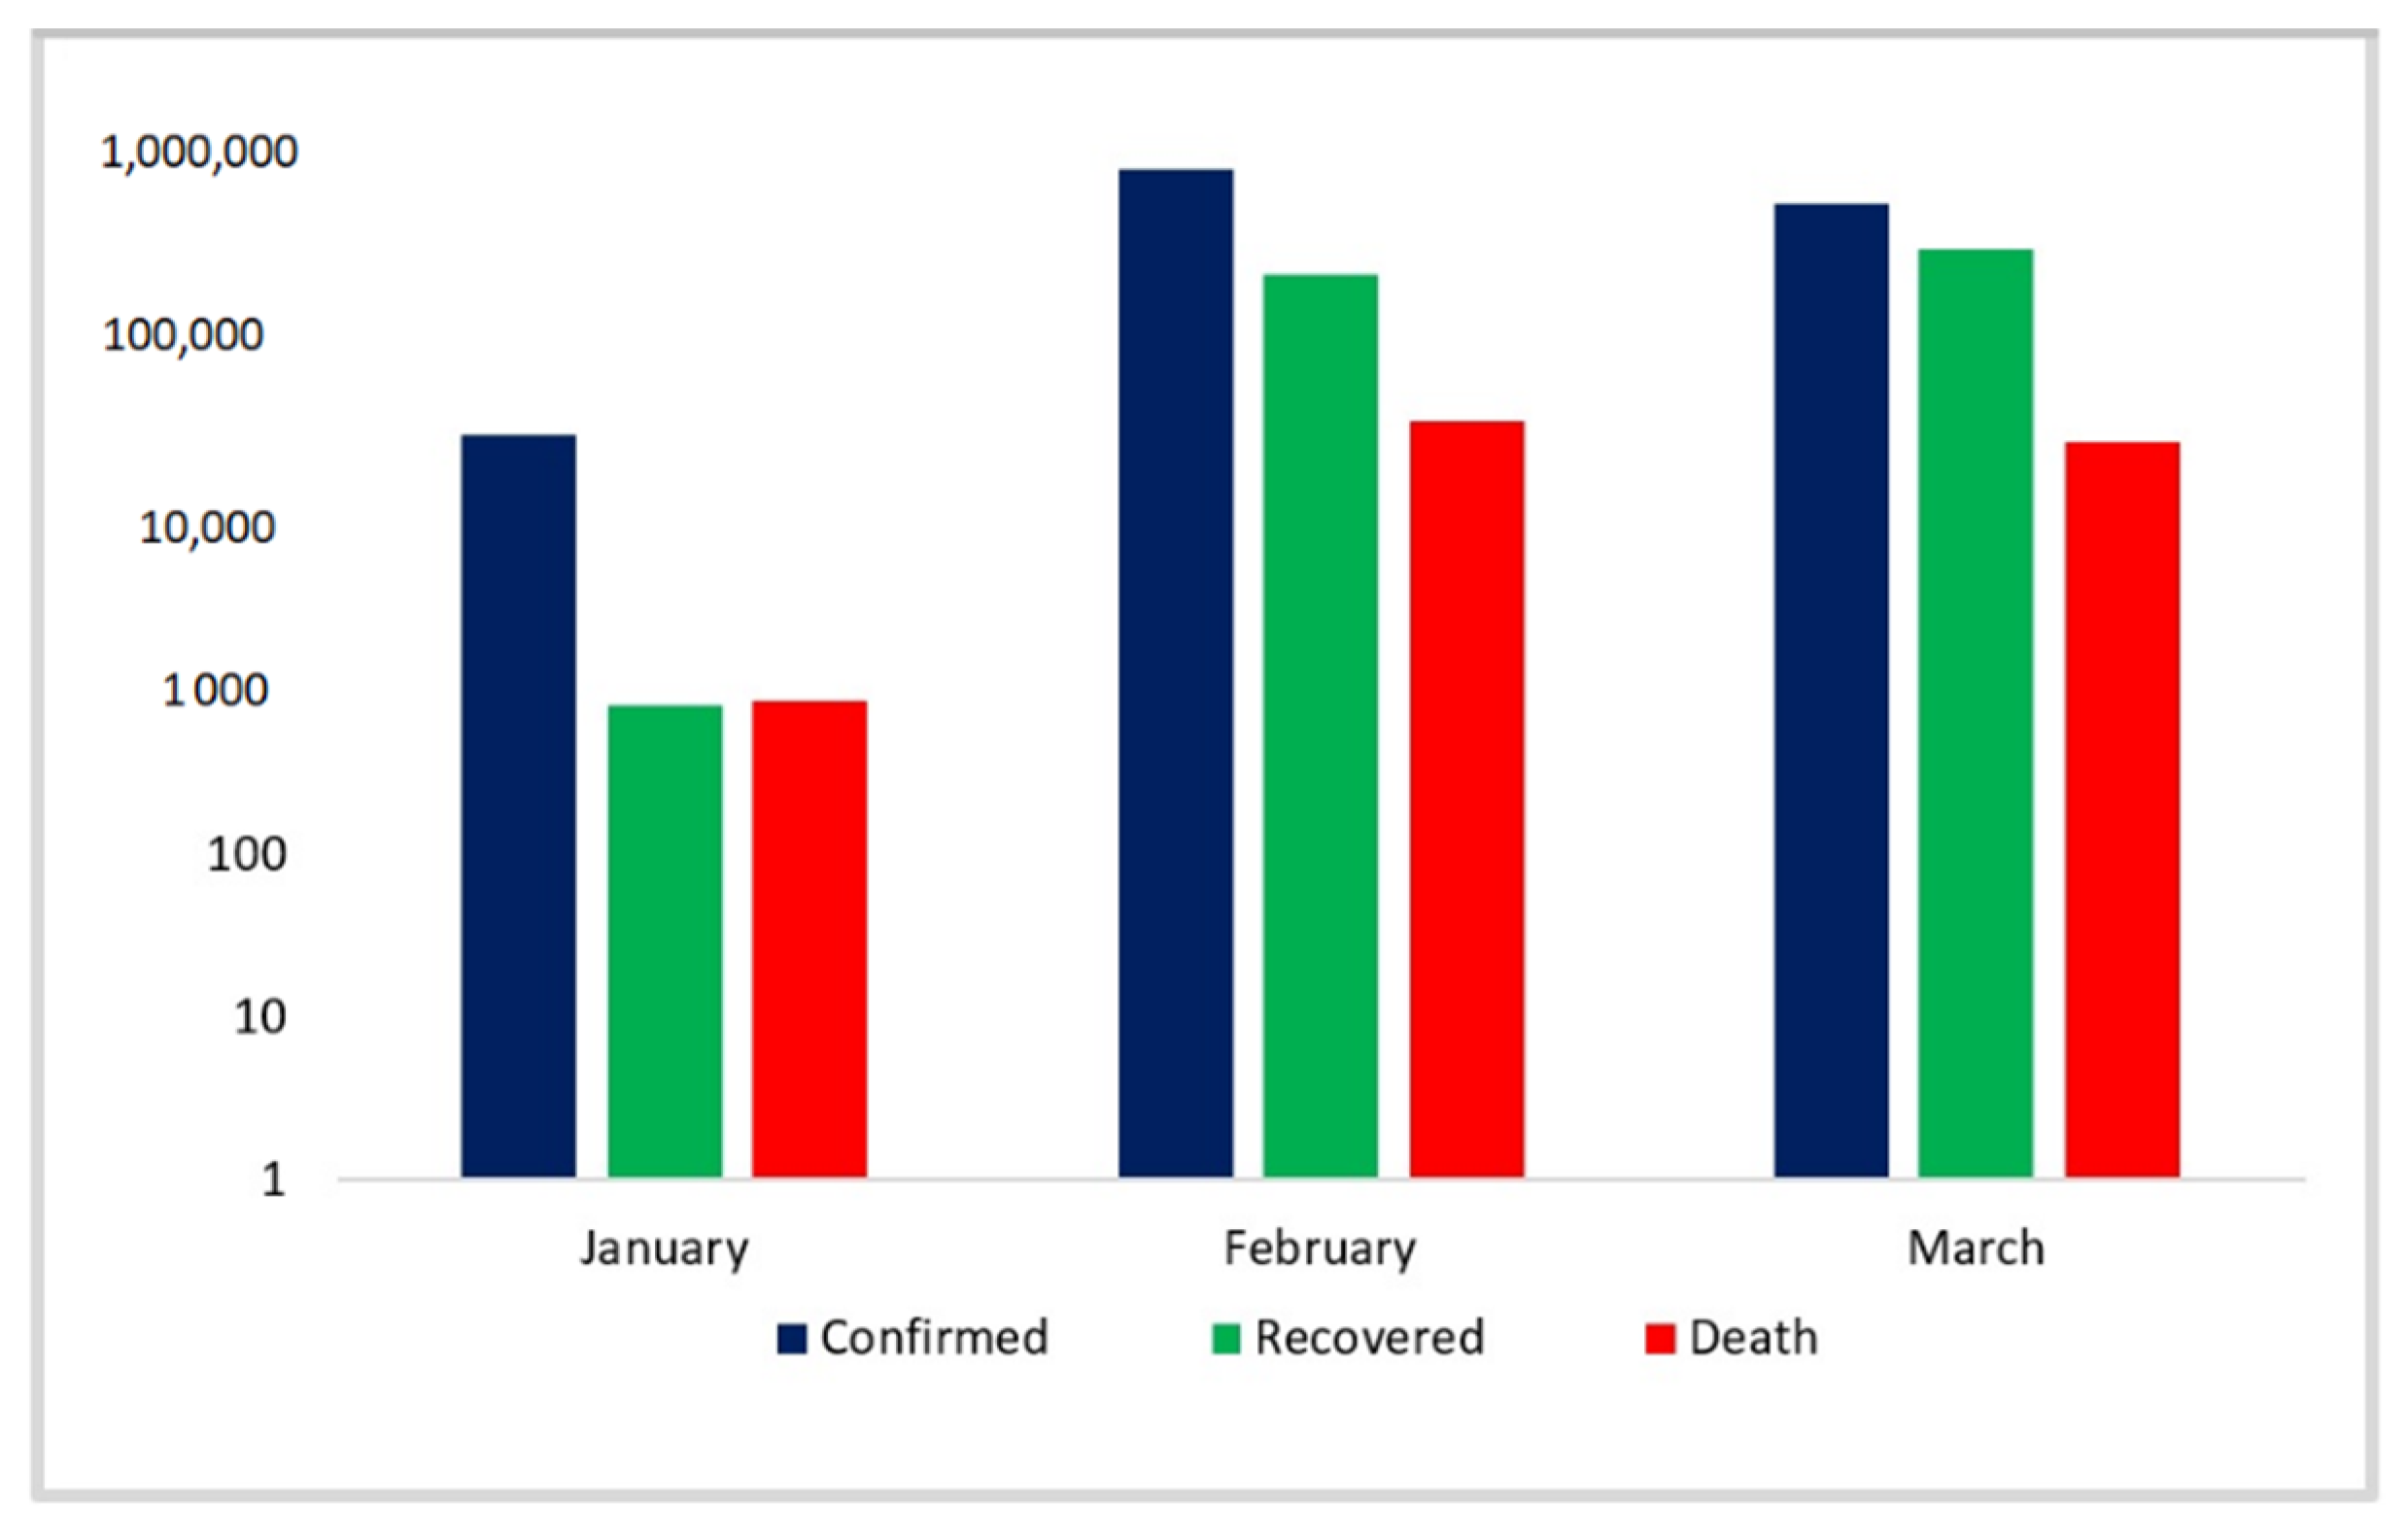
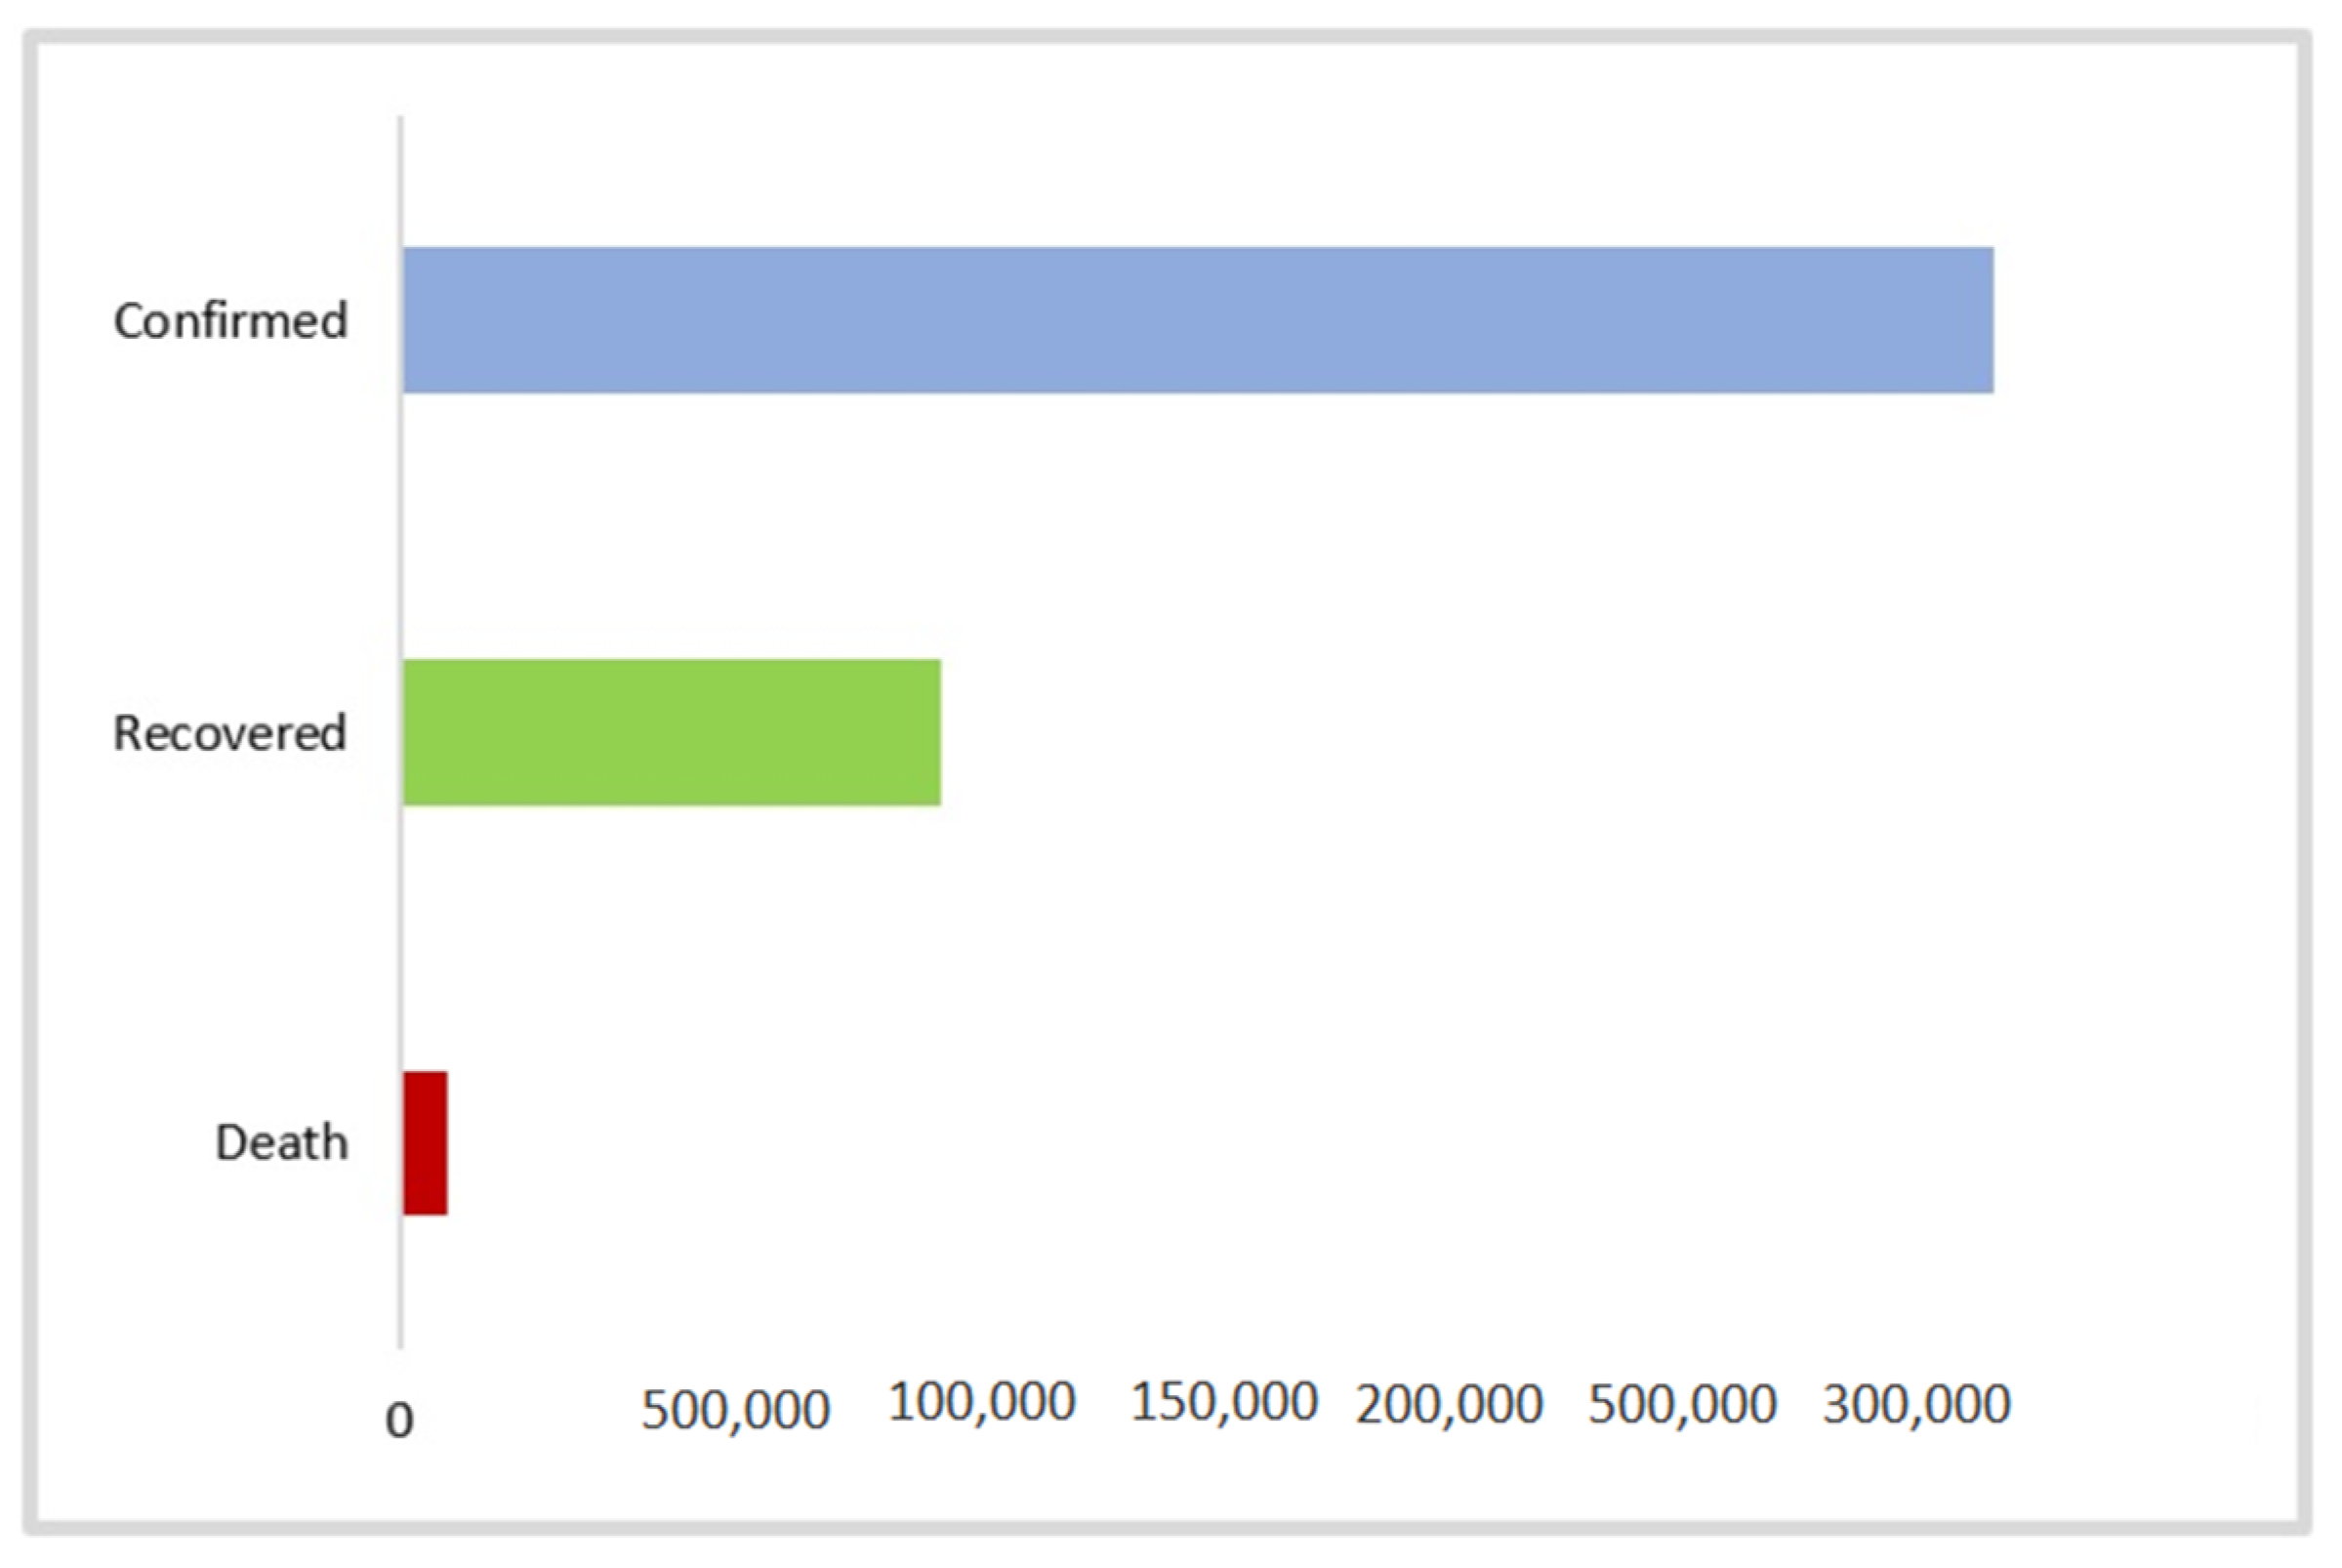
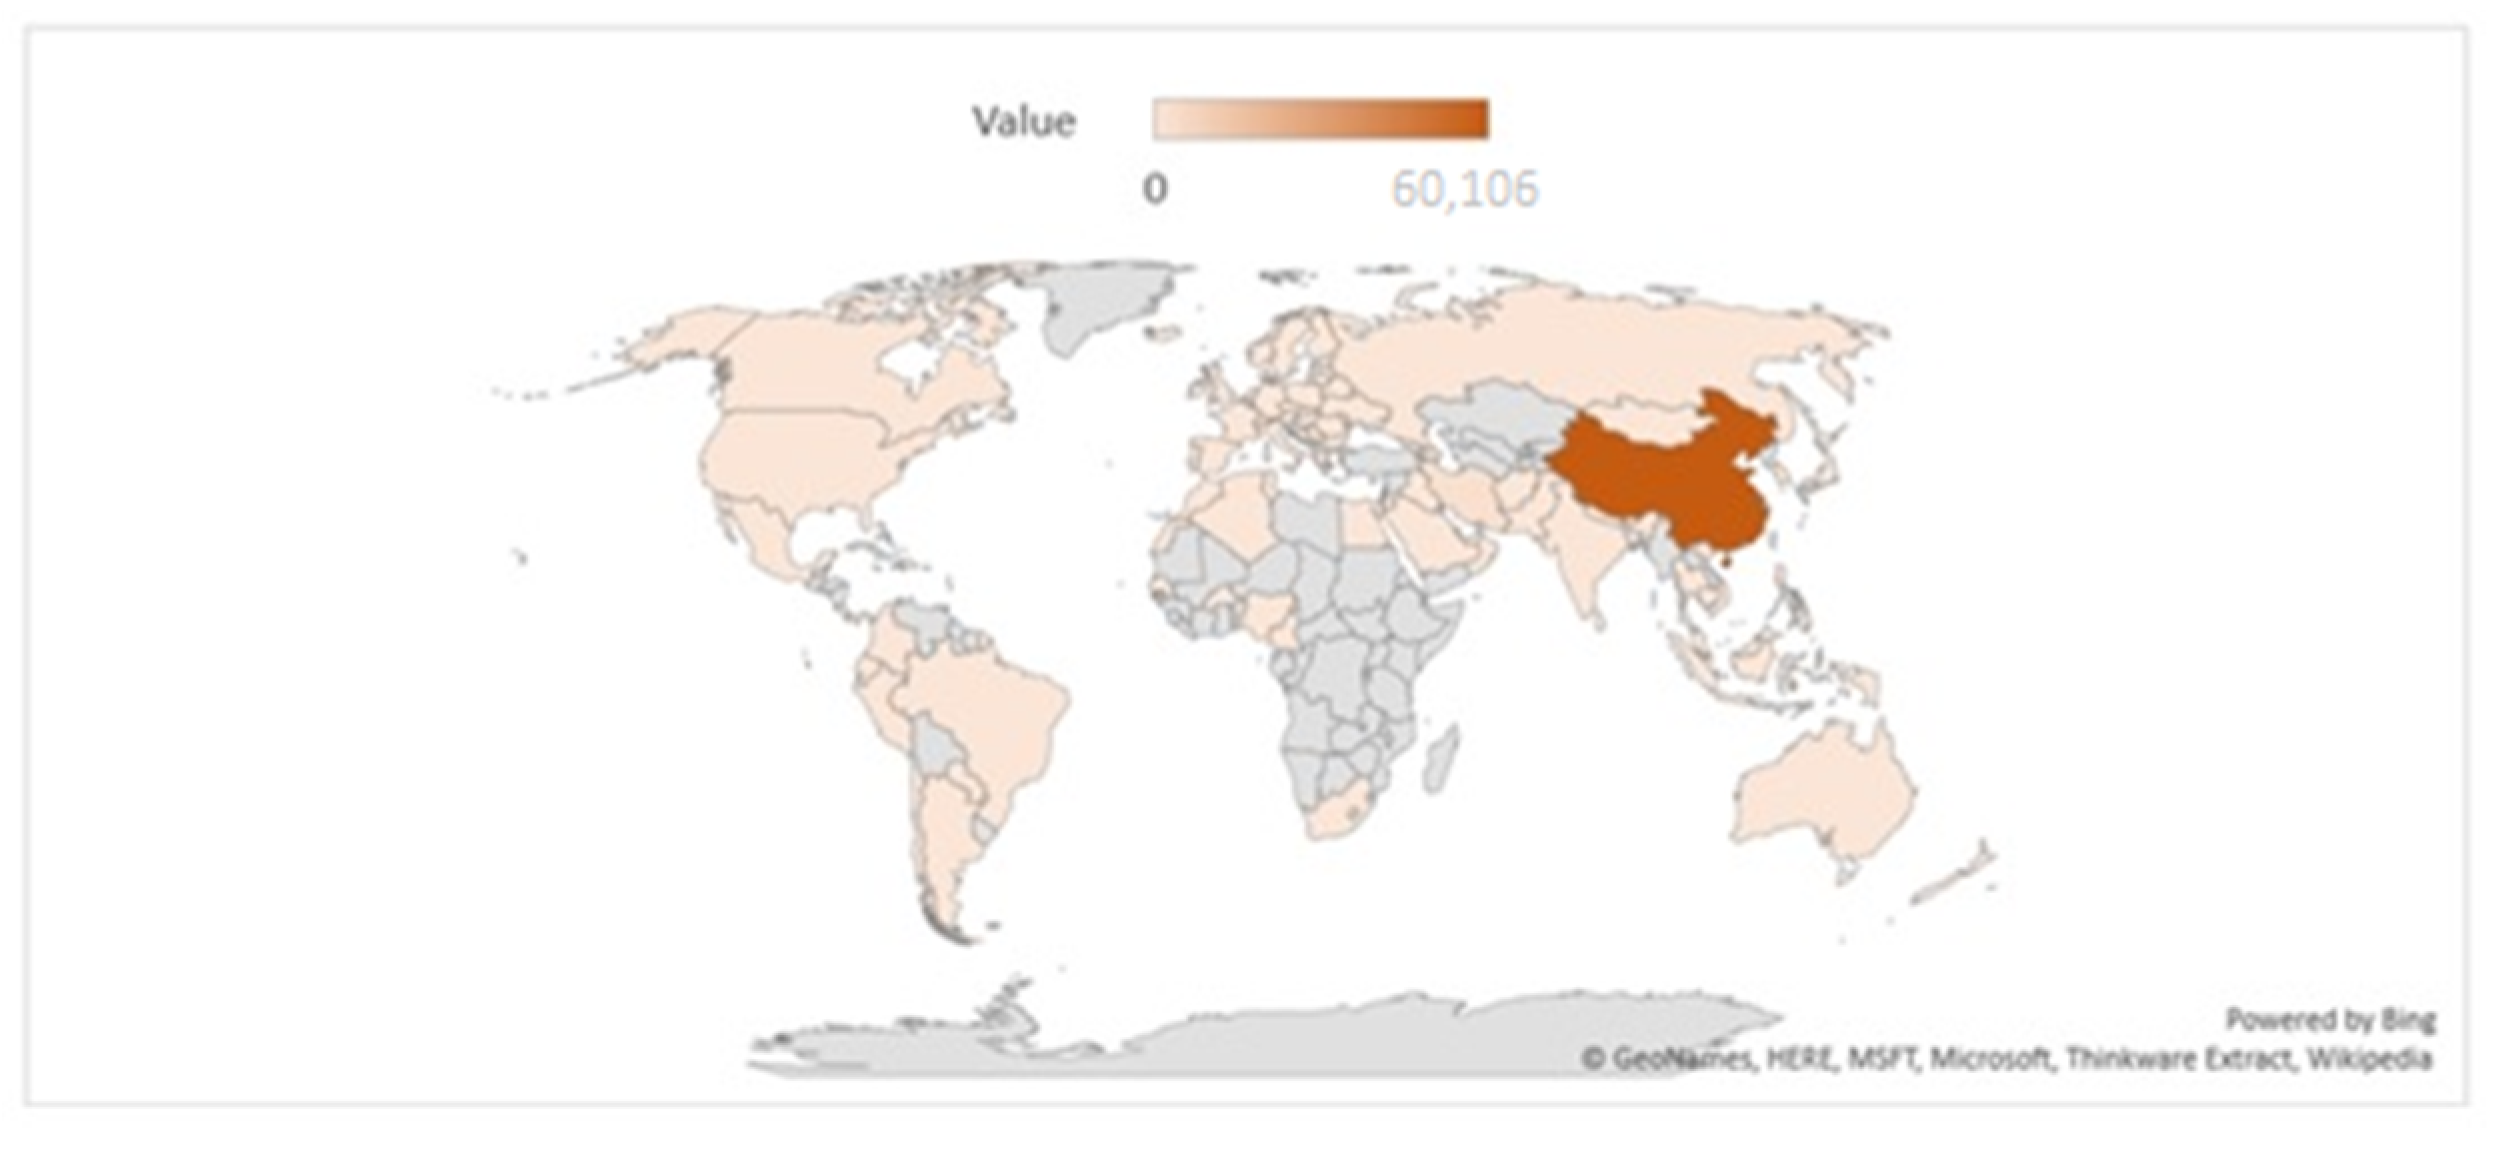
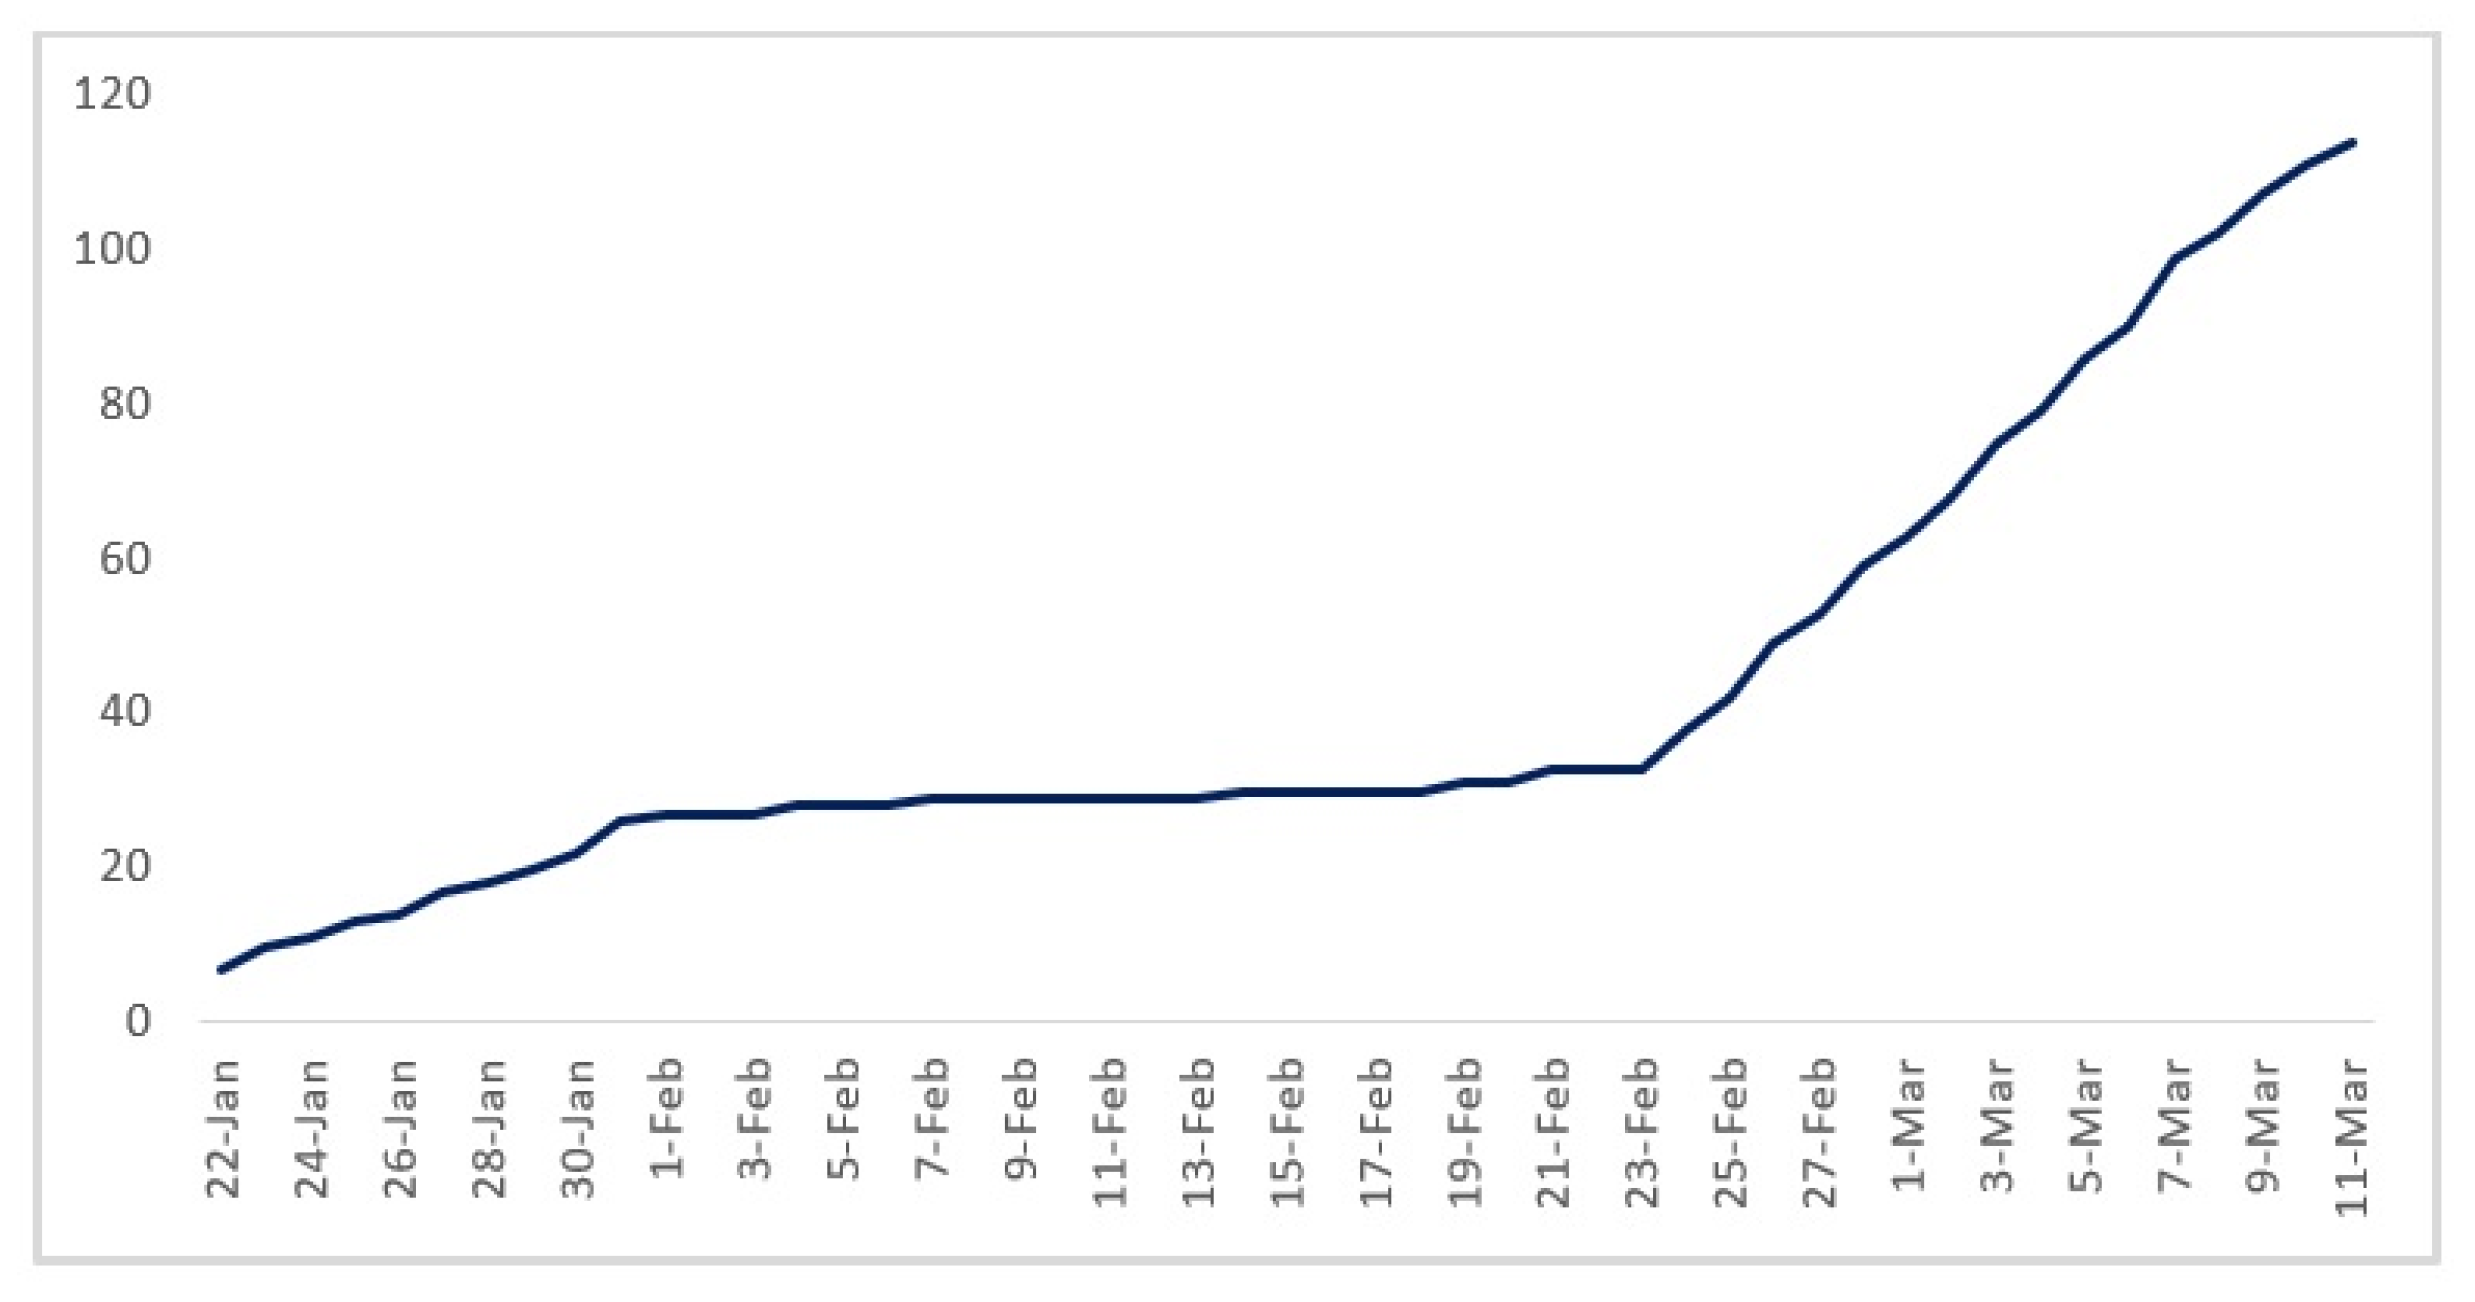
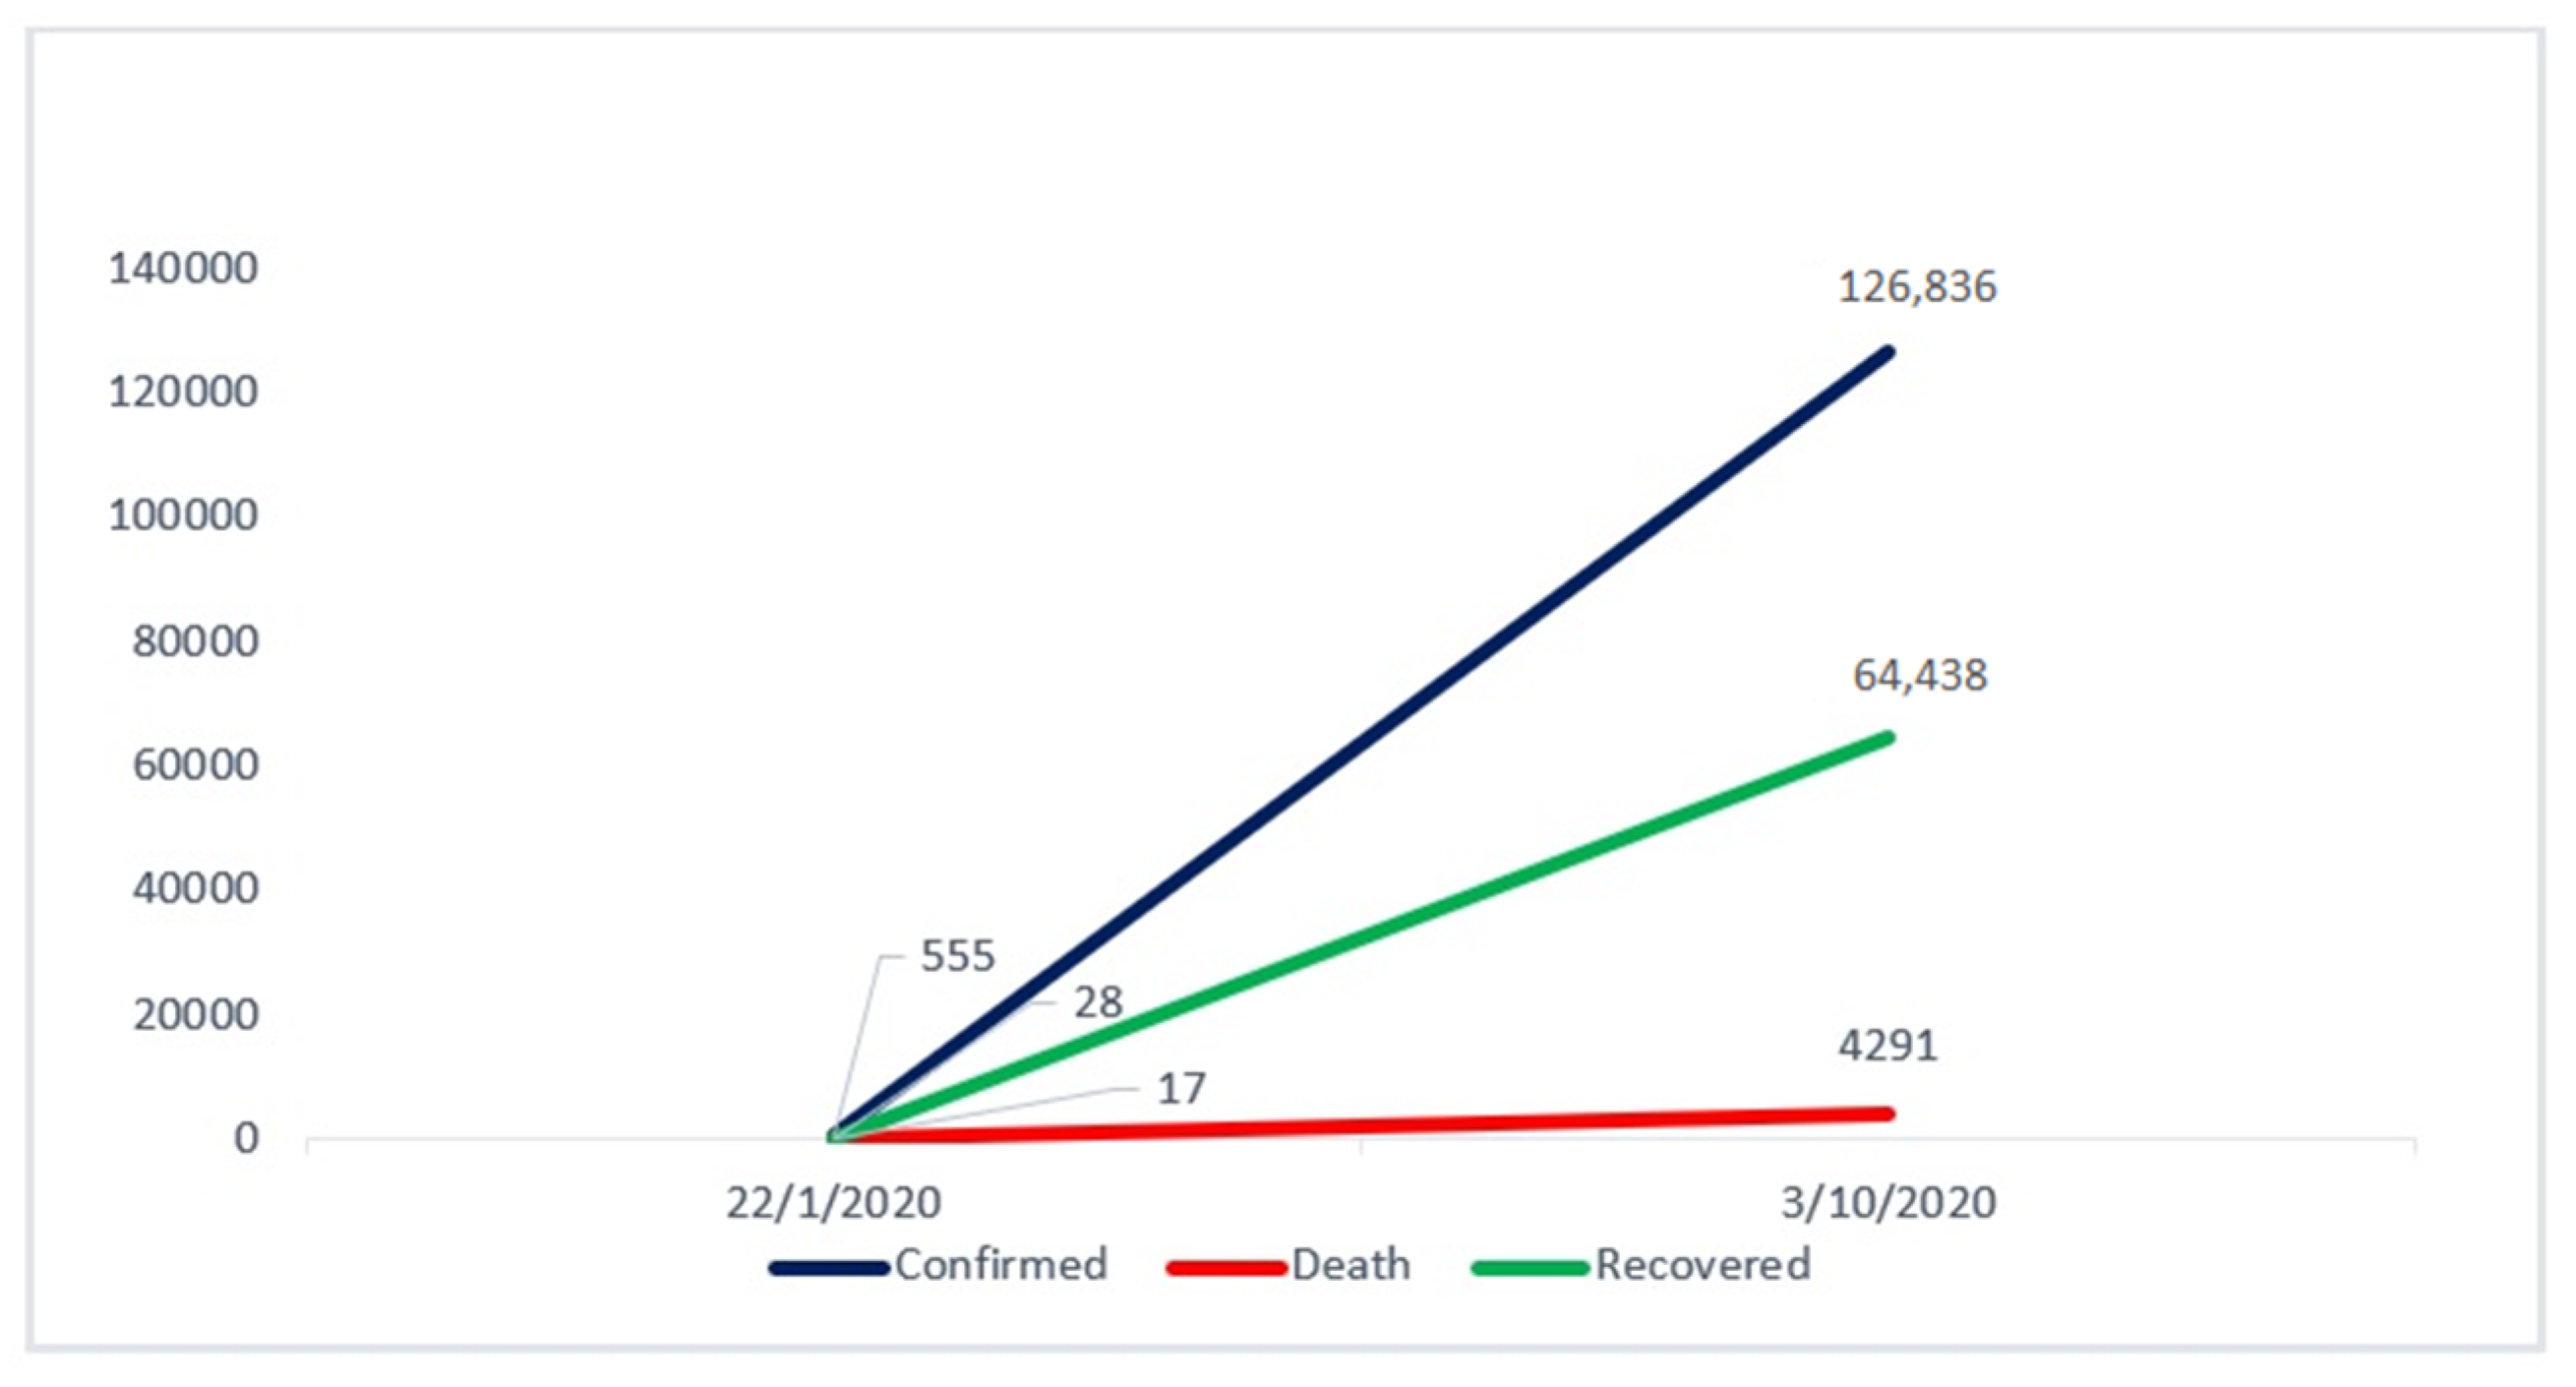
4.1. Exploratory Data Analysis

We performed EDA on the COVID-19 dataset (22 January 2020 to 10 March 2020). The graph in Figure 1 based upon the time series data shows the cases for 22 January, February, and 10 March 2020. According to the visual representation, verified COVID-19 instances were growing, since they received the greatest number of impacts for our chosen dataset from 22 January to 10 March 2020, i.e., 126,344 (64 percent). The number of cases that recovered was 34%, and the mortality rate was approximately 2%. Figure 2 shows the overall cases for January, February, and March 2020.
Until now, COVID-19 has spread to 115 countries worldwide and 33 states/provinces in China. The total reported cases outside China were 126,258 for March (10 March 2020). In comparison with February, the virus spread rapidly. The death rate outside China also seemed to be an interesting parameter, as it seemed that the death rate was also increasing, with 1582 deaths outside China reported until 10 March 2020. However, the number of recovered cases remained higher in comparison to the mortality rate, i.e., 17,973 patients recovered outside mainland China. The value indicator started from 0 to 60,106 from a light red color to brown colors showing high confirmed cases in China (Figure 3).
Figure 4 depicts that COVID-19 was quickly hitting other countries such as Iran and Italy, showing a rapid increase. This increase was affecting neighboring countries, and this made a total of 114 countries until 10 March 2020. Figure 5 visually represents the three worst-hit nations individually.

4.2. Predictive Analysis Using Support Vector Machine (SVM)

To perform predictive analysis, we used SVM. The results revealed that the COVID-19 epidemic was fulfilling all the criteria of progressing towards a pandemic. Figure 6 is a visual representation of three variables, i.e., COVID-19 confirmed, death, and recovered cases starting from 22 January 2020. Further, results revealed that although the number of cases being reported from China was declining, the virus was still propagating. The study observed that confirmed cases increased at an alarming rate with 126,838 cases reported till 10 March 2020.
This visualization (Figure 6) shows the SVM-based prediction for the results, which shows COVID-19 confirmed (blue), death (red), and recovered (green) cases. It shows that the virus was transmitting rapidly and was moving towards a pandemic. The projection was carried out using time-series data up to 10 March 2020.
Classification of the selected dataset was based on global confirmed cases (22 January 2020 to 10 March 2020). There was a slow increase in viral transmission initially (from 22 January to 1 February), where it affected 27 countries. However, from the 30 of January, WHO conducted an assessment to determine whether or not the situation would be reported as an international public health emergency [60]. This emergency call alerted government officials worldwide, leading to the suspension of air travel to and from China [61,62,63]. Our result strongly supports that quarantining measures did play a crucial role in containing viral transmission. The graphs depicted a stable line in the period when quarantine measures were being practiced effectively. Results indicate that COVID-19 transmission entered a lag phase, and only 15 more nations were affected until 26 February. Unfortunately, this stability achieved in the transmission rates led to a relaxation in the quarantine measures adopted globally. The results of the predictive analysis made evident that from the end of February to 10 March 2020 there was a rapid upsurge in viral transmission, and 72 countries were hit in a short span of 14 days.
The Figure 7A–C shows the confirmed cases in China, Italy and Iran. This graph represents the viral transmission pattern. It shows that when travel bans were imposed, and strict quarantine measures were implemented, there was a lag phase of transmission of COVID-19 (1–26 February). As soon as quarantine and travel bans were relaxed, the transmission exploded on an exponential trajectory.

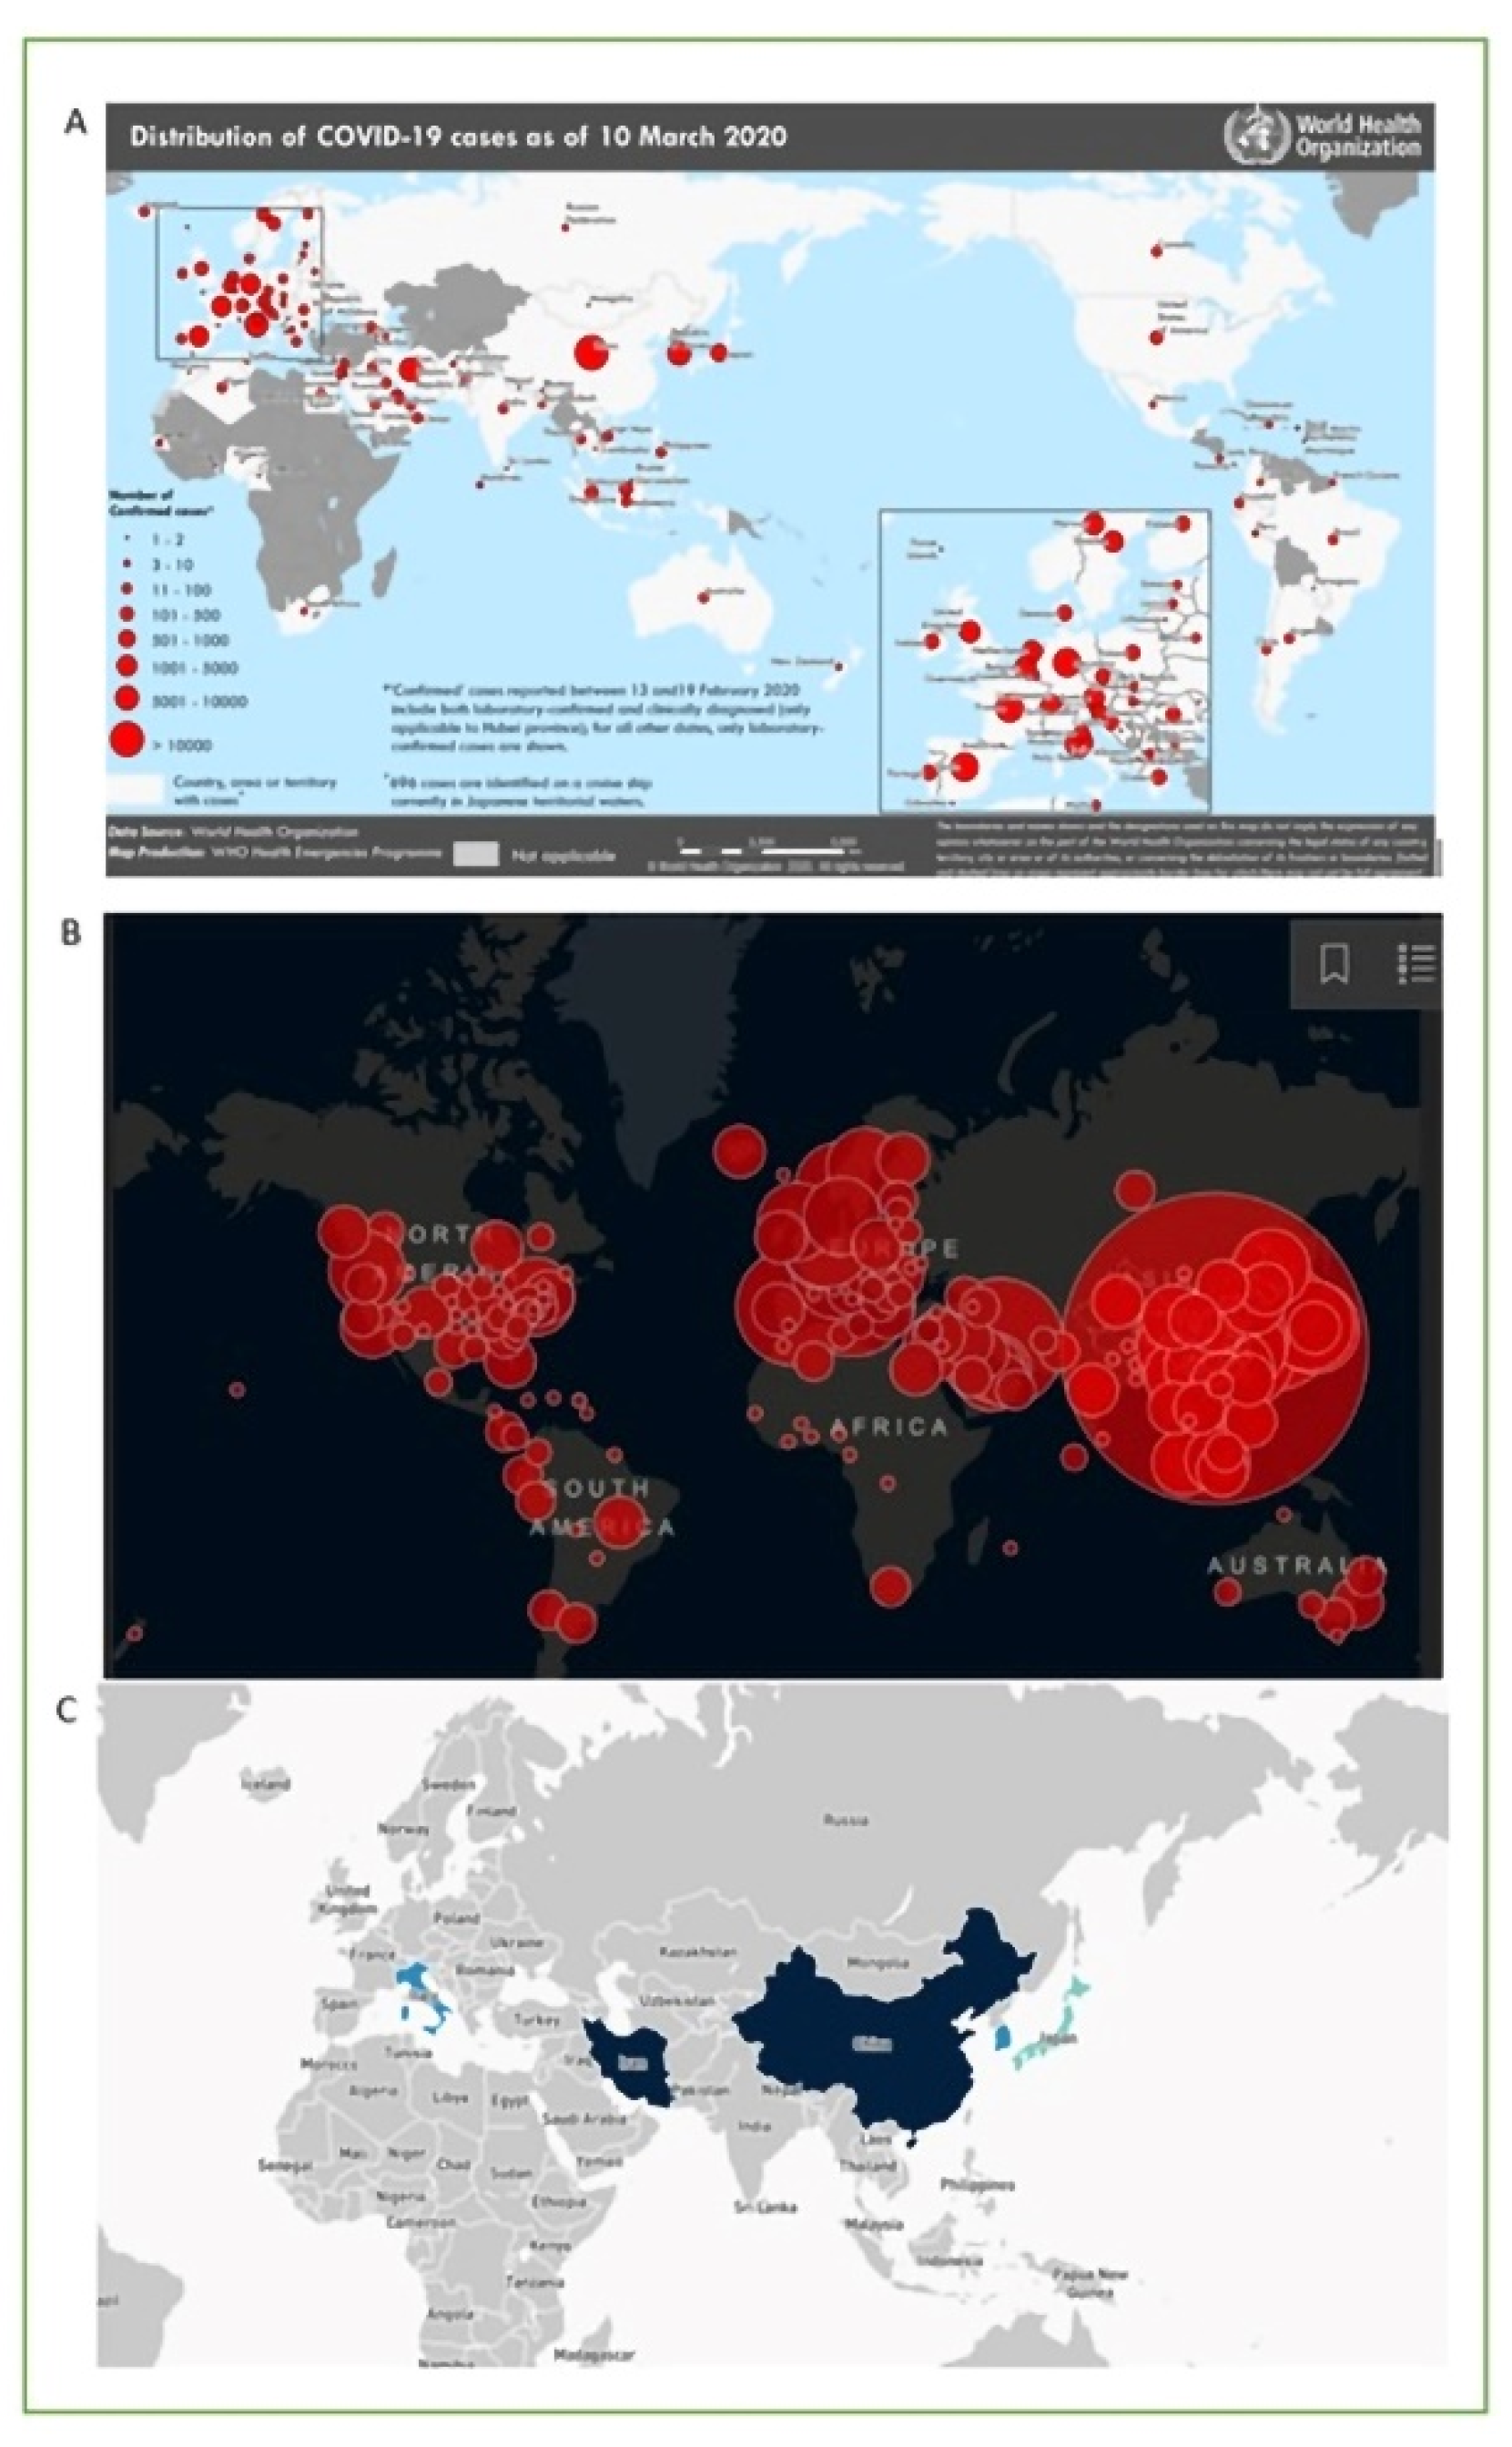
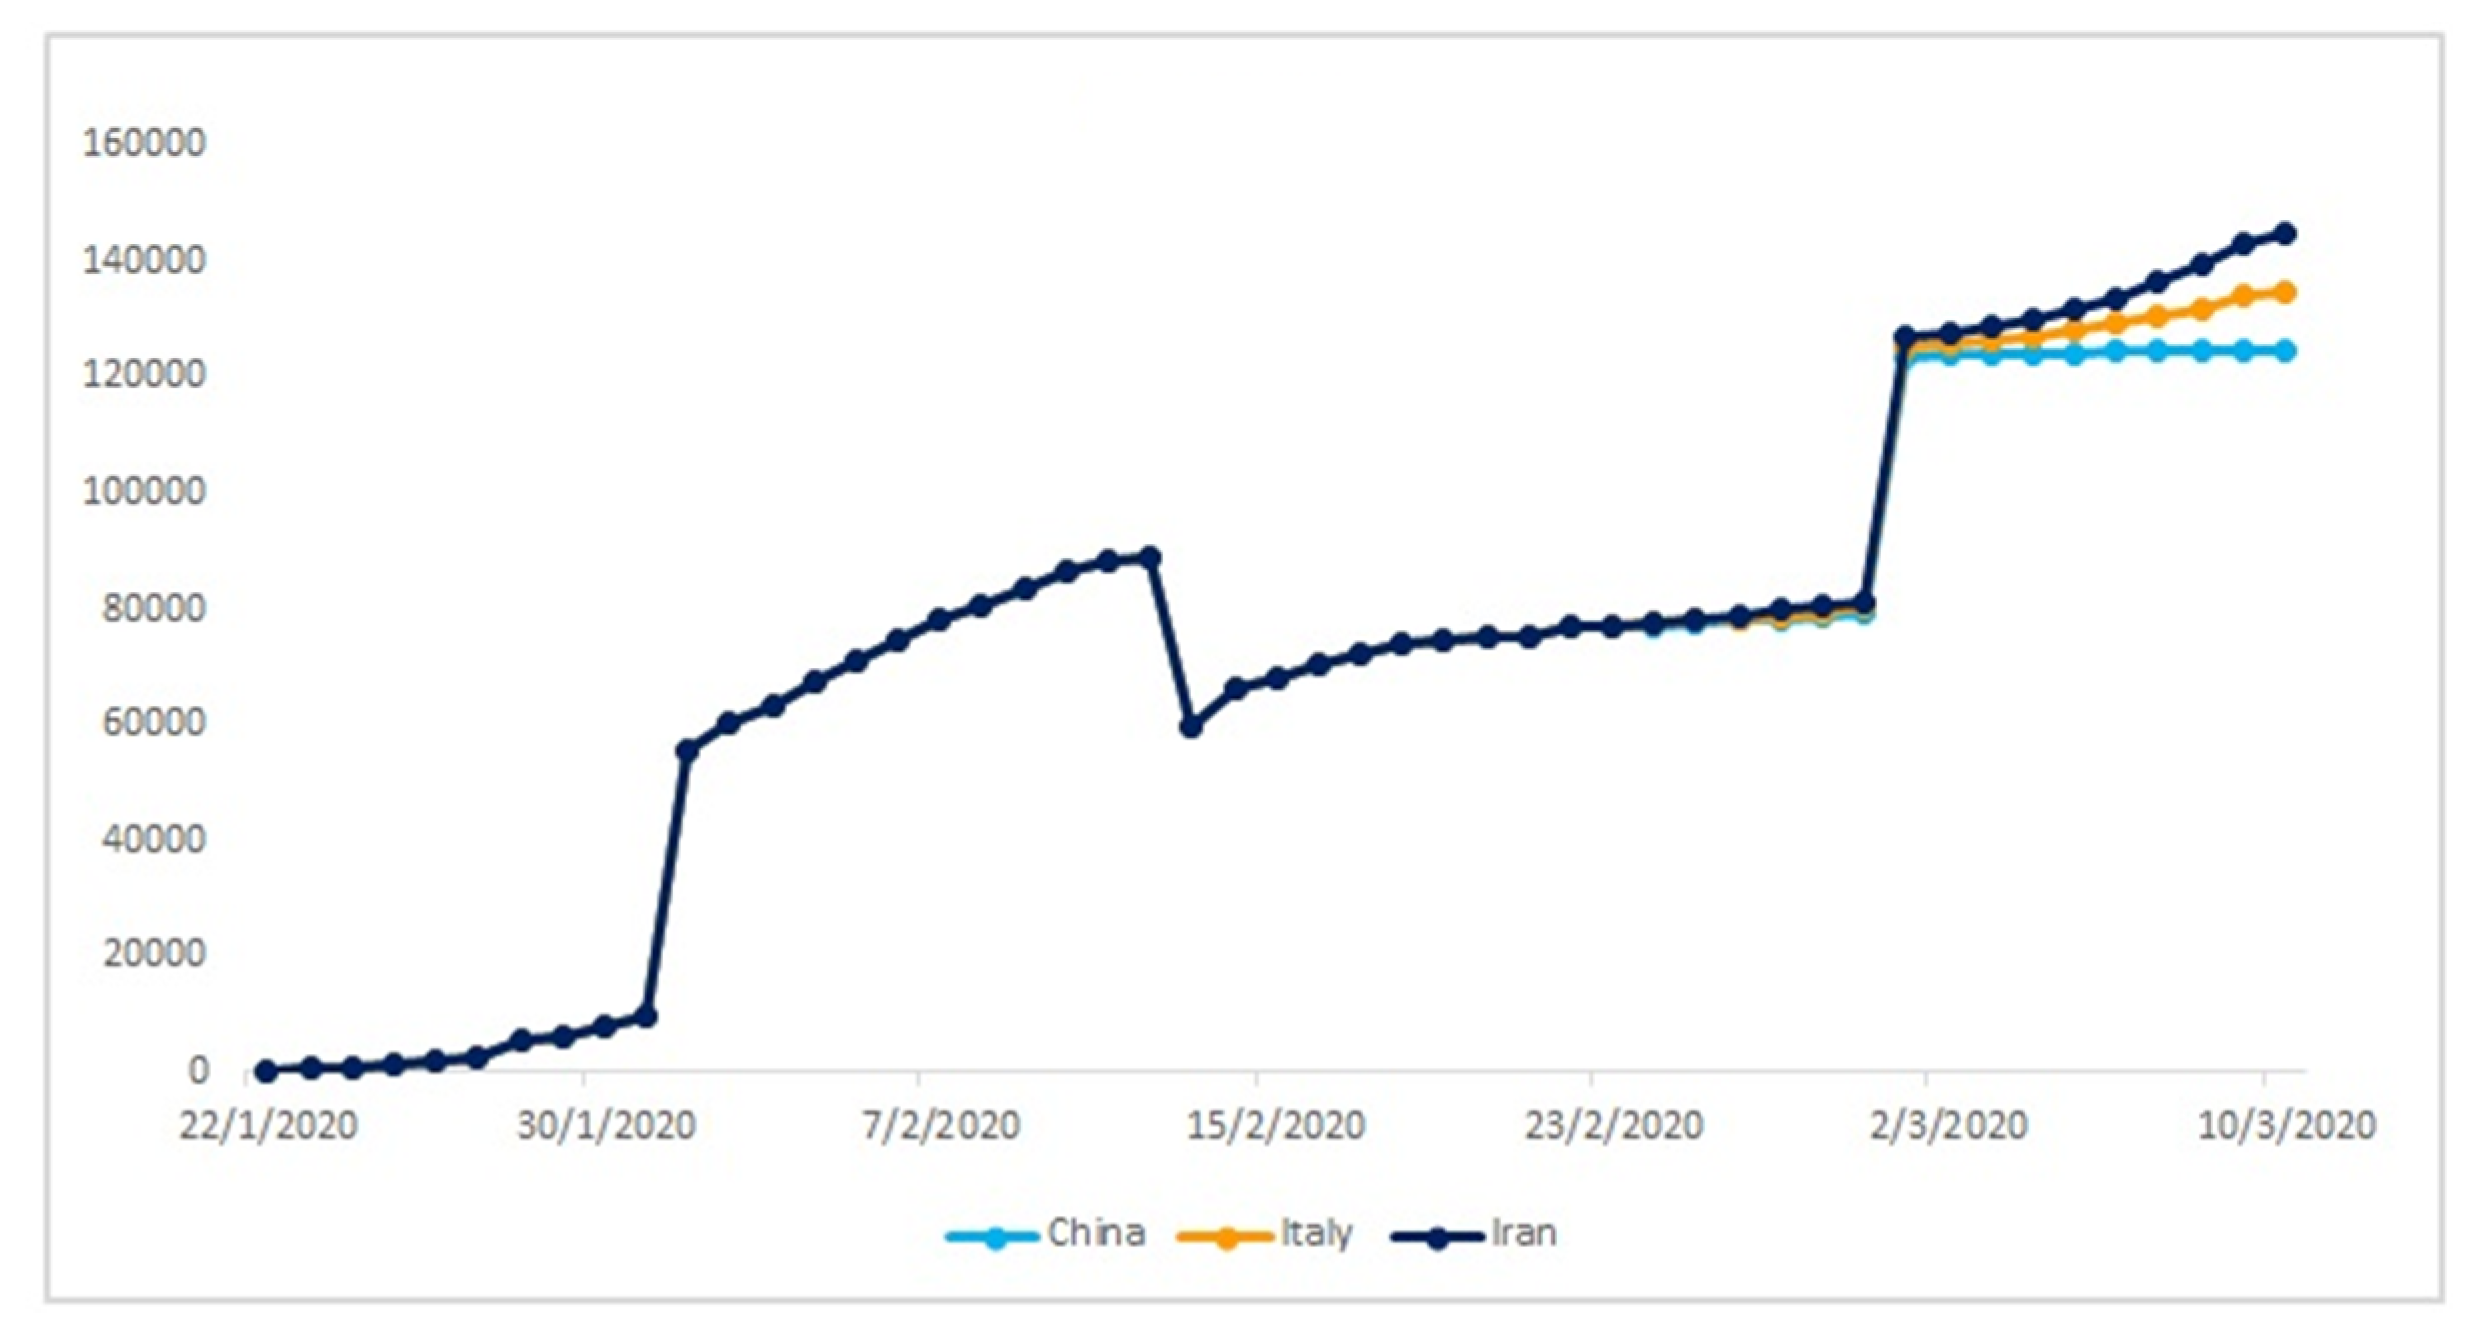
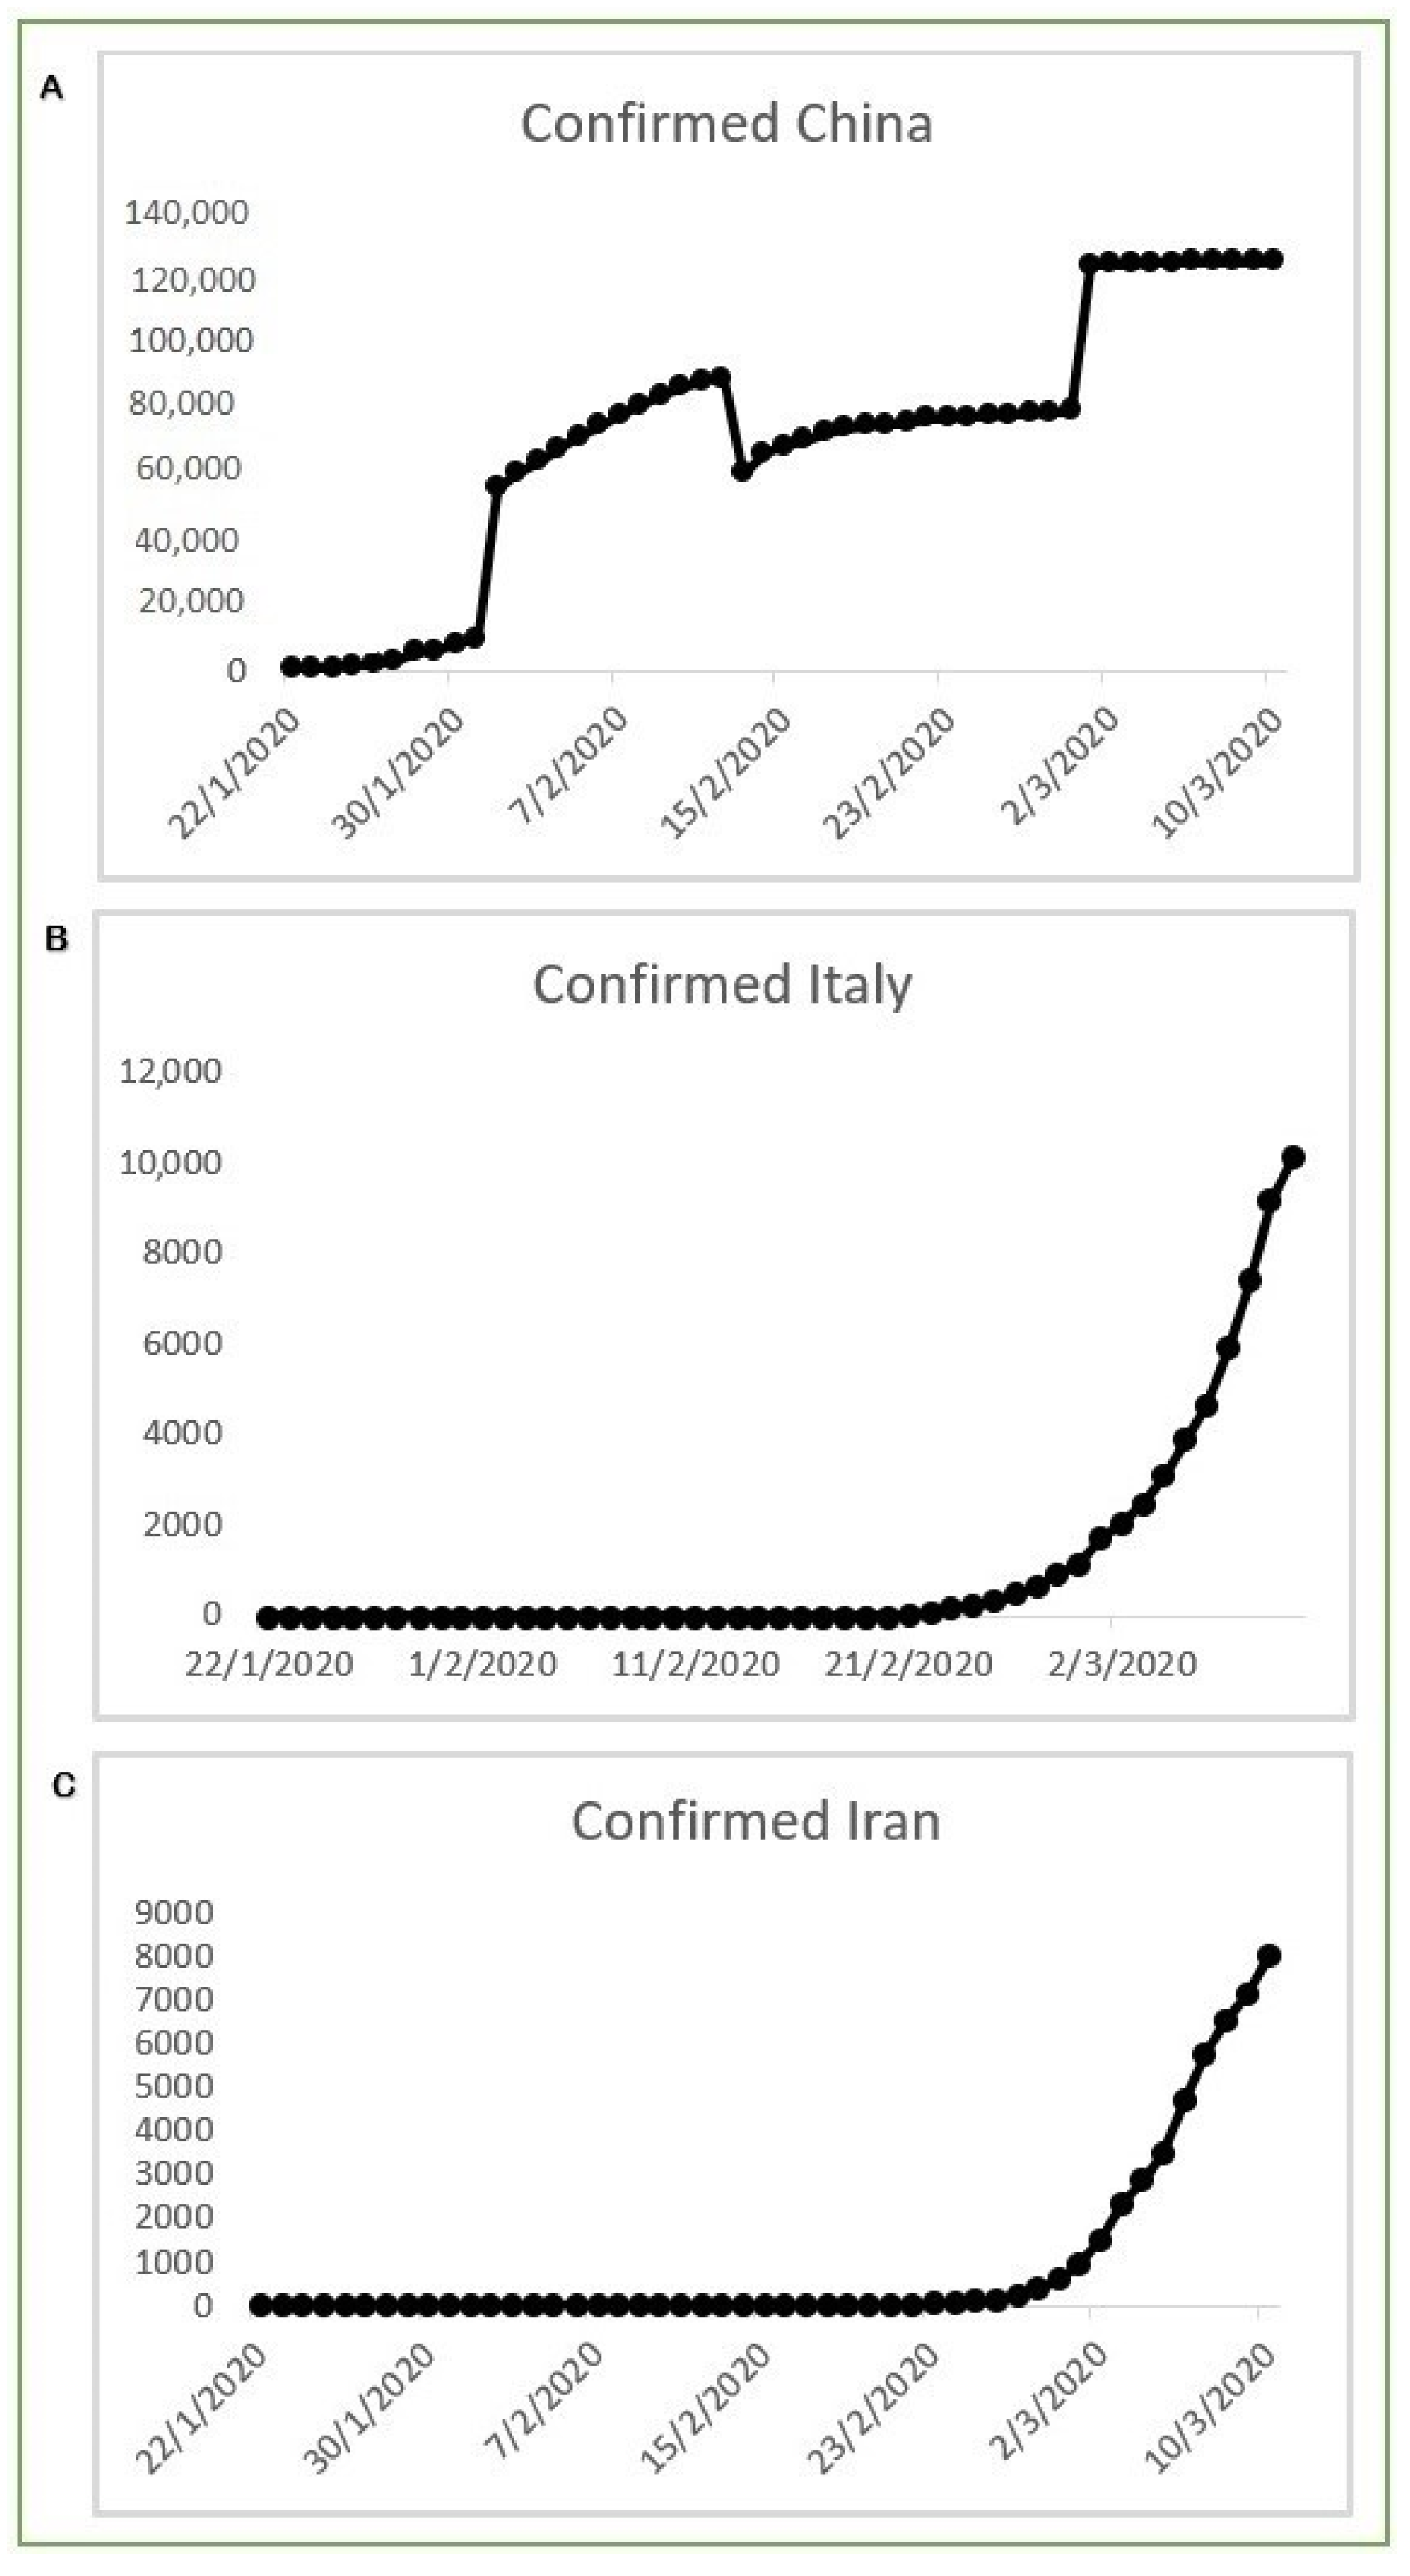
4.3. Comparison of Visual Data from Multiple Reliable Web Sources

We reported our analysis based on data available on reliable web sources such as WHO [16] JHU CCSE [14], and CDC [15]. These web sources reported live updates that shed light on increasing countries hit by the COVID-19. These time-series data supported our findings that the epidemic of novel COVID-19 was turning towards a pandemic. When stakeholders do not adopt suitable precautions on time, the situation can get out of control.
Figure 8 is adapted from WHO [16], (JHU CCSE) [14], and CDC [15], respectively. All these sources showed an increase in confirmed cases and their geographical distribution. These sources’ overviews showed 113,702 confirmed (4125 new) and 4012 deaths (203 unique) cases reported until 10 March 2020. However, the recovery rates were much higher than the death rates, which indicates that although the COVID-19 had a higher transmission rate, the associated mortality was quite low. This research showed that China and the rest of the world’s leadership used quarantine measures at the beginning of this epidemic to confine the virus, and this acted to control the epidemic in the early stages. Nevertheless, when the quarantine measures were relaxed due to extreme scrutiny, a sharp upsurge was seen in COVID-19 transmission to new locations worldwide.
All these sources showed an increase in confirmed cases and their geographical distribution.

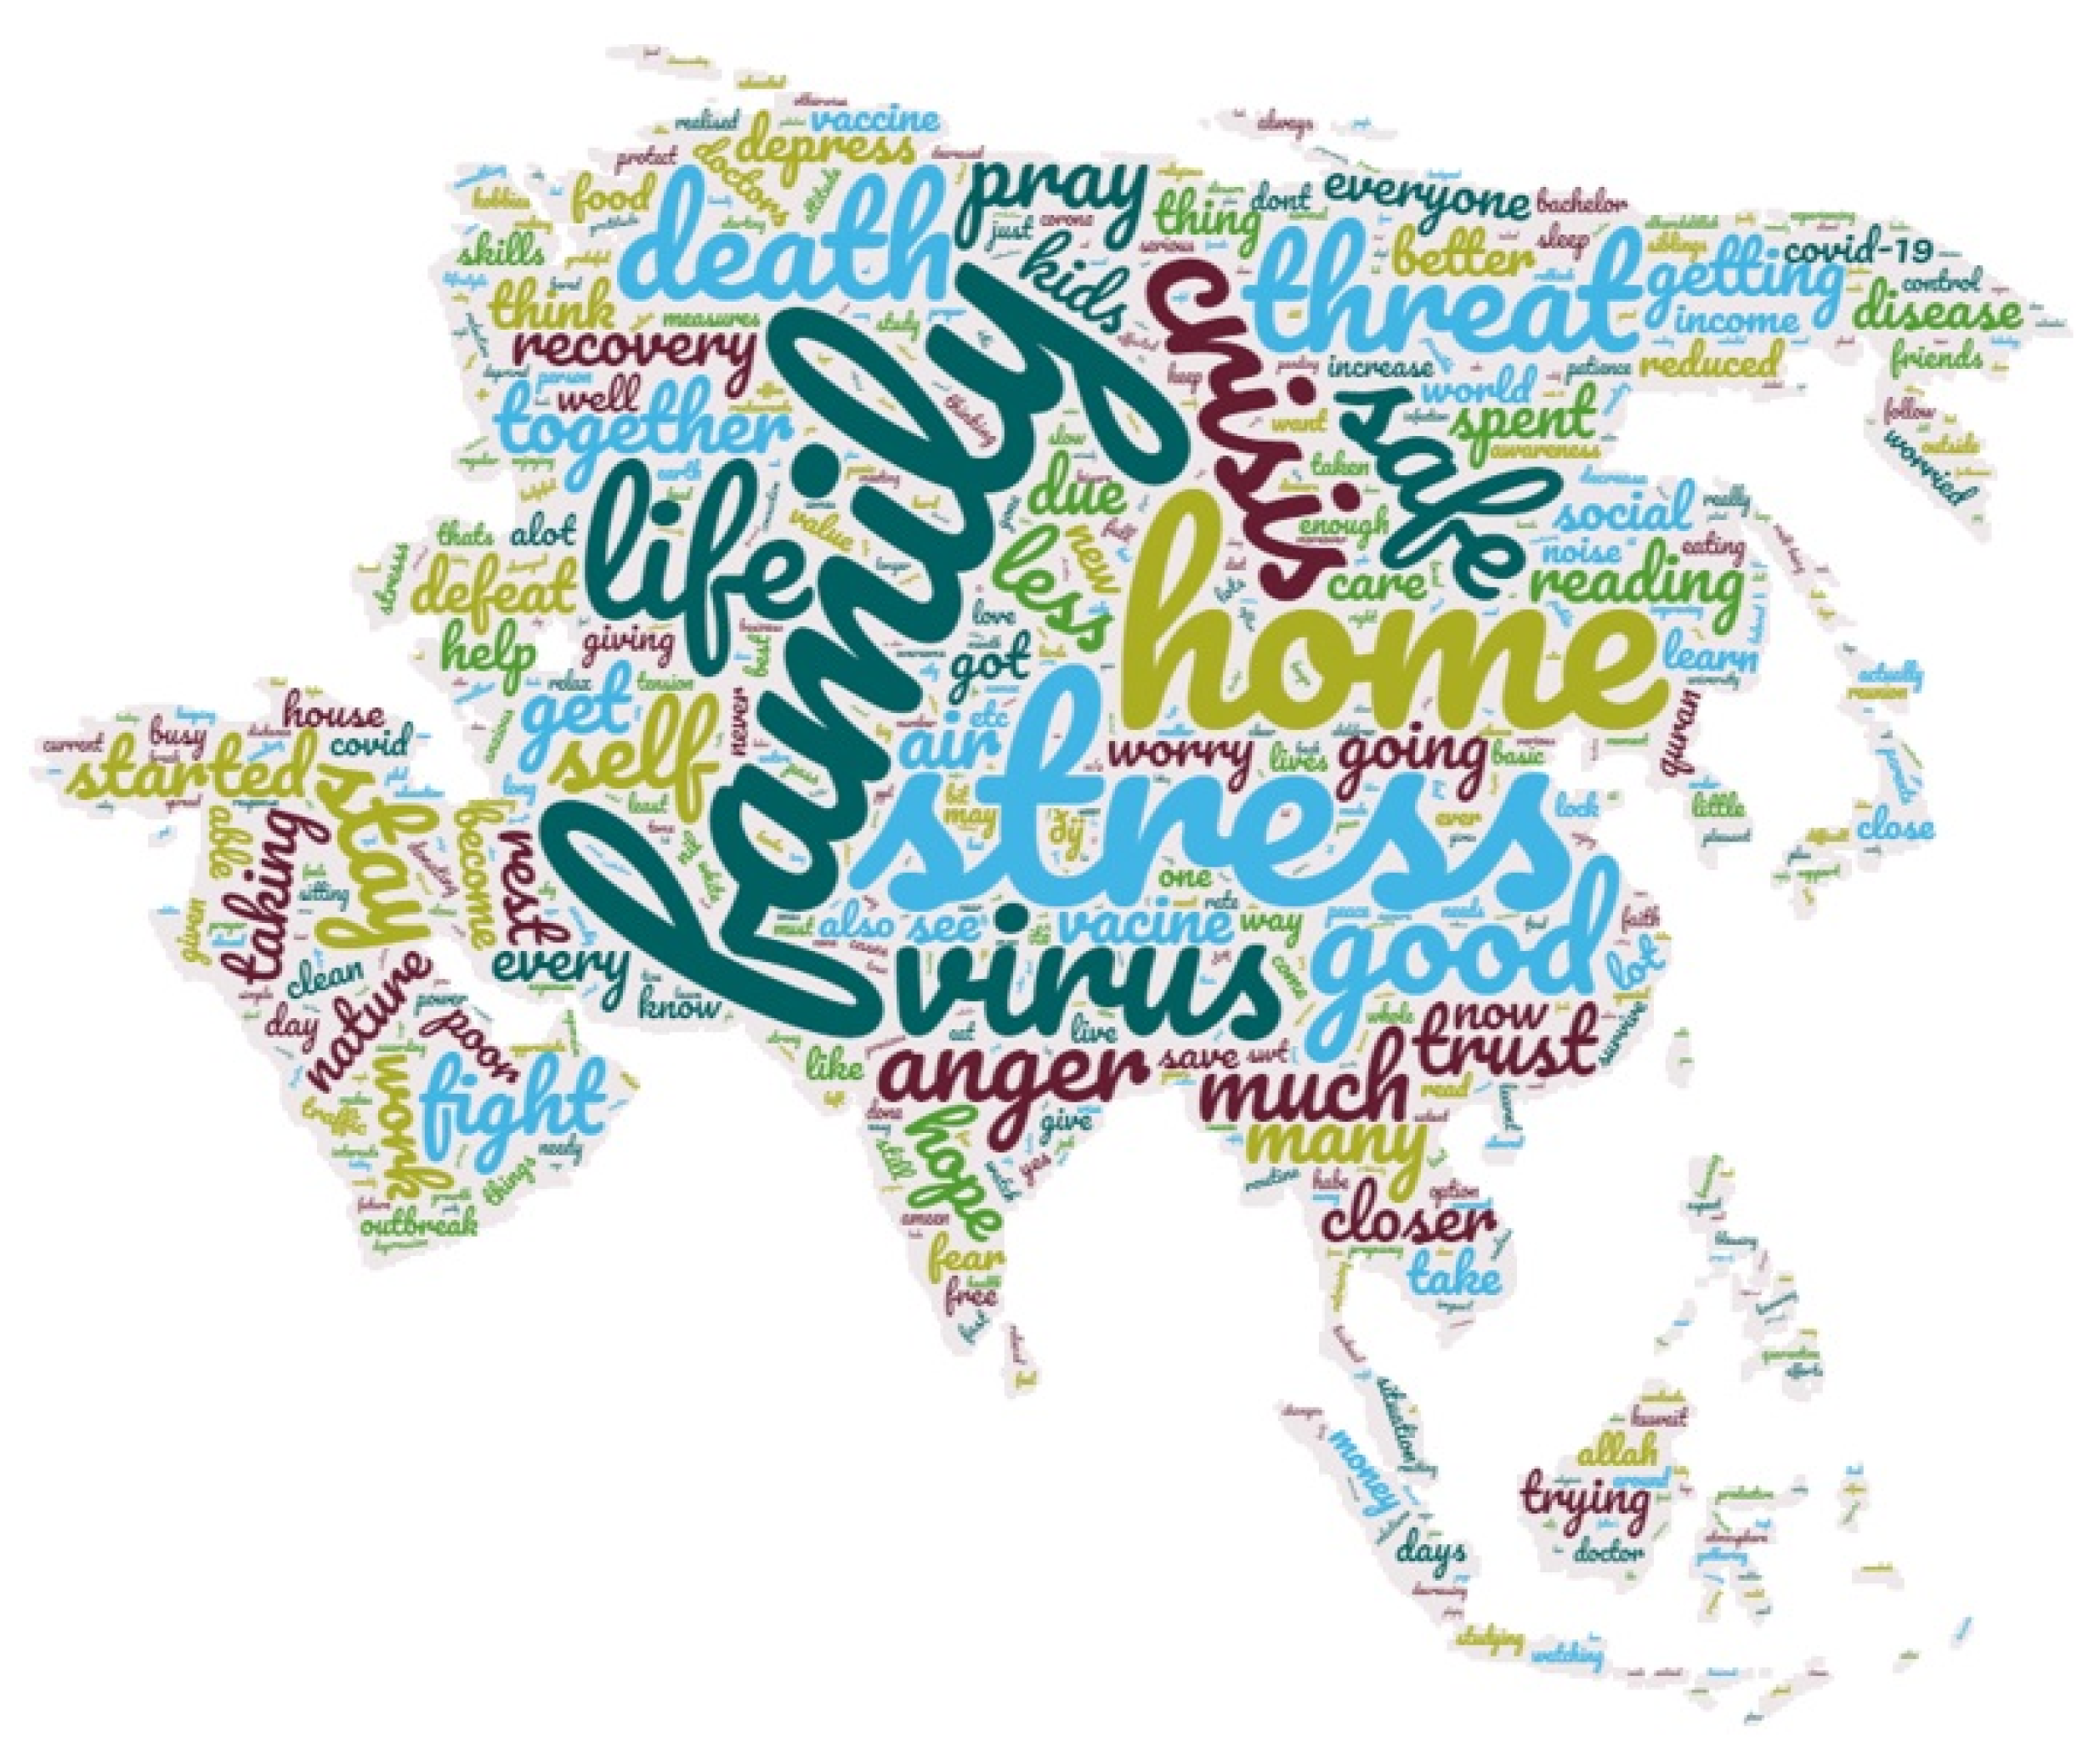
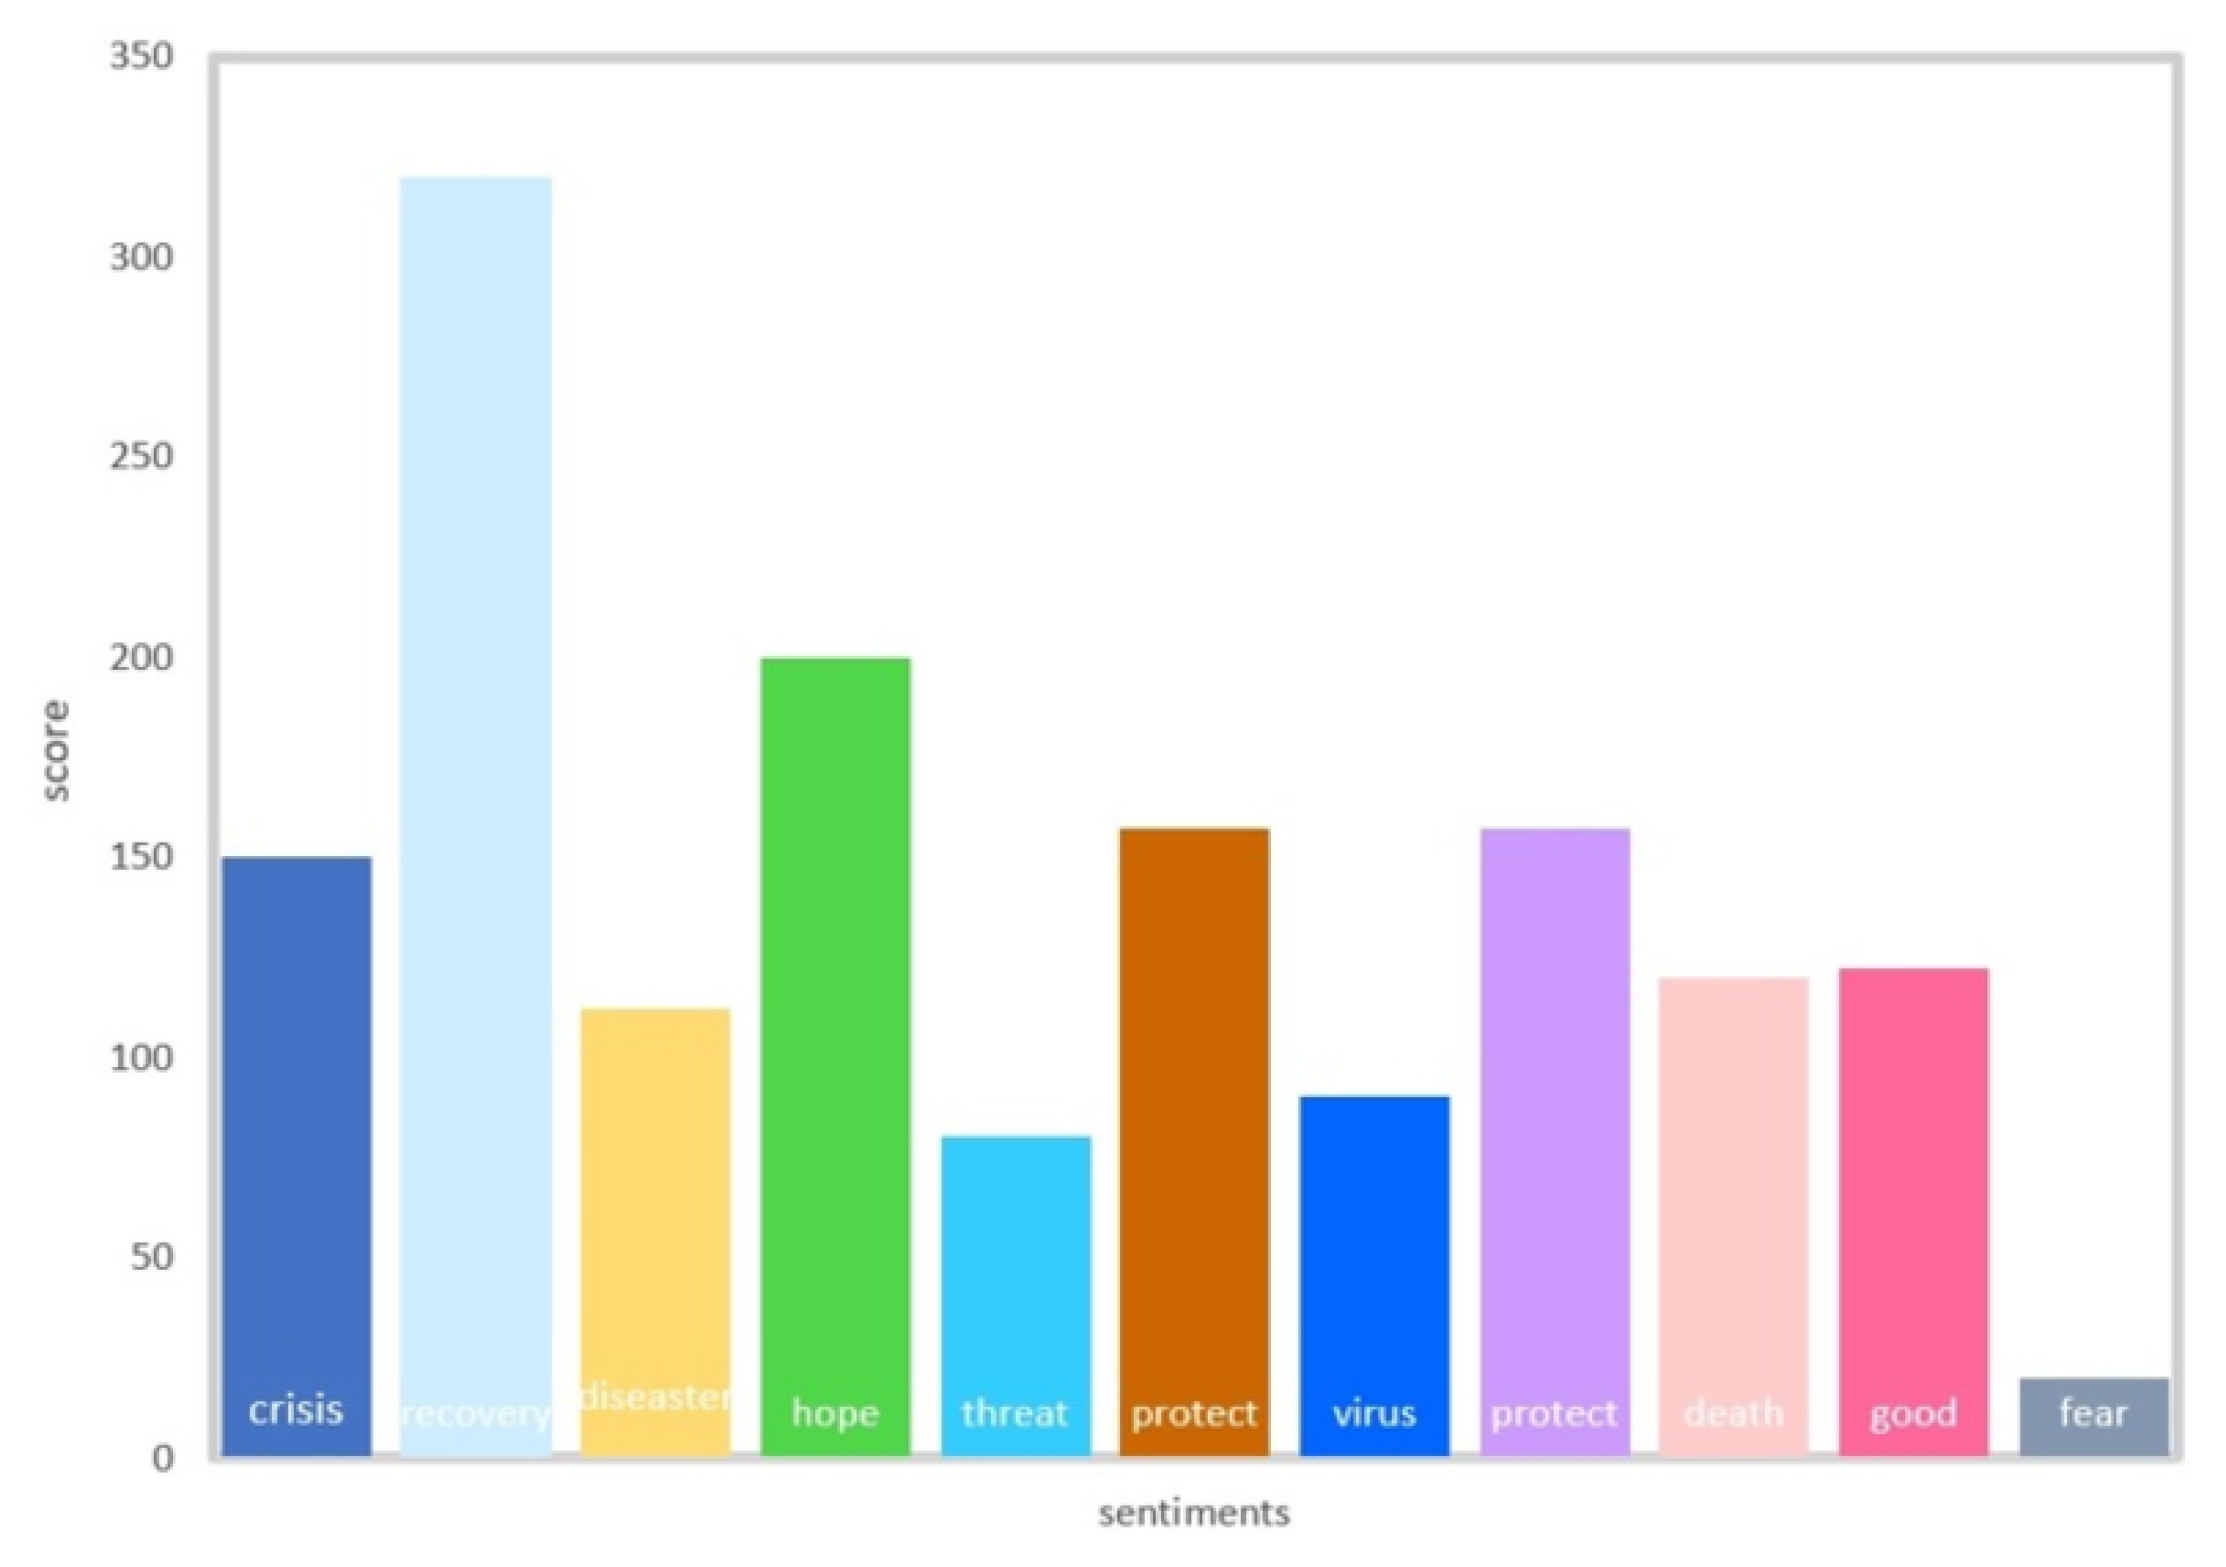
4.4. Results of Tweets to Predict Emotions (Anxiety and Stress)

To have a better understanding, we used the “bing” lexicon to analyze tweets to discern which terms were associated with positivity and negativity. We counted the words in each set and came up with the top 10 most frequent positive and negative words in those datasets. The word cloud and graphs represent the sentiments of people associated with tweets as positive and negative words.
Figure 9, Figure 10 and Figure 11 show the word cloud from overall tweets and bar charts from positive and negative tweets used in this study. The words “family”, “time”, and “home” were the most frequently occurring words in the overall tweets. On the other hand, words such as “pandemic”, “death”, “stress”, and “virus” were the most frequently occurring words in the negative sentiments.

5. Discussion

The current study estimates the risk of the COVID-19 epidemic turning into a pandemic using EDA and predictive analysis algorithms on the time-series data available at the John Hopkins university web link. Based on this data, it can be seen that the estimated number of confirmed cases was supposed to increase, and the death and recovery rates may have varied in the coming days after 10 March 2020. This cutoff time, i.e., 10 March 2020, was chosen specifically as we observed a sudden spike in the number of COVID-19 cases being reported outside China after February 26. The day-to-day data reflected the fact that this epidemic was worsening, and a global pandemic was a reality.
As seen by the predictive analysis, death rate was relatively low, i.e., 2% which indicated that COVID-19 was not as severe as other coronavirus epidemics reported in the past, including SARS, and MERS, the reported case fatality rates (CFRs) of which were 17% [64,65,66] and 20% [67], respectively. However, transmission rates of COVID-19 were much higher than their counterparts, indicating the greater potential of this epidemic turning into a pandemic.
Further, it is noted that viral transmission was slow initially, and only 27 countries were affected. This was because as soon as the news of an emerging viral infection spread, the international community came up with strict measures, which included the shutting off of air transportation to and from China. Initially, it was thought that quarantining an entire nation was unprecedented, as both Chinese officials and the international community took aggressive measures [68]. The main aim of this quarantine was to restrict viral hosts and starve the virus. However, the health officials criticized the situation and said that such measures could only deprive any state or region of the medical facilities and not contain the viral spread [68]. However, as soon as the strict international protocols were relaxed, Iran emerged as the second endemic zone, and carriers from Iran spread the virus to many countries across the globe, and the lag phase of 1 February to 26 February was followed by a heightened increase in the COVID-19 transmission, when from the end of February to 10 March 2020, 72 countries were hit in a short span of 14 days. This analysis is crucial in helping to understand how important it is to quarantine an individual, a city, or a country during times of an endemic/epidemic crisis such as this one in order to prevent it from turning into a pandemic.
Another important aspect of this study is sentiment analysis, and visualization of tweets is significant for finding the true picture of public emotions against some event and or incident such as healthcare emergency [22,69]. Outcomes show that stressful negative words were being more frequently used in tweets as compared to positive words. These included “stress”, “anxiety”, “worry”, pandemic”, “crisis”, “threat”, and “fear”. However, some of the positive words “family”, “time”, “home”, “good”, “safe” are seen. It appears that the people in both countries, Iran and Pakistan, do understand the significance of lockdown. People are aware that this aggressive measure is for their good, and the virus can be contained only by social distancing and self-isolation [22,70]. A murky sadness does dwell among the masses as seen by the words “pandemic”, “disease”, “crisis”, “fear”, “lockdown”, and “phase”. The masses seem to be worried about the fate of daily wage earners [71,72]. As shown in Figure 3, we selected the sentiment-laden terms and top 10 most popular positive and negative terms from our tweets and observed their use patterns to gain a better idea of how they were employed in general. Understanding people’s feelings about a topic is an important aspect of classifying the words into emotions. Here, we classified the words based on the recent coronavirus epidemic.

6. Implications and Limitations

In times of public health emergencies, there is a need for a proactive public health campaign on social media. The healthcare authorities should monitor tweets by the masses that relate to public health emergencies; these can help devise policies and maintain the supply chains [73]. Methods should be devised to help the public health and scientific community access the core quantity of posts on social networking sites while respecting privacy at the same time. Moreover, sentiment analysis researchers should focus on multilingual sentiment analysis, as most research workers can easily understand English [74]. Furthermore, factors affecting mental health amid pandemic lockdowns should also be studied. The tracking of false information circulated online should also be studied, as it is the most common source affecting mental health.
Limitations include that the results illustrate death only among the COVID-19 confirmed cases. Once factual infection data become available, a true CFR can be estimated. Therefore, future research based on larger sample size and improved specificity can be conducted. However, we still believe that our analysis can help in gaining an improvised situational assessment. Looking at the current study from a technical perspective, it is emphasized that the proposed prediction based on SVM can be critically important, as it hints towards the start of a pandemic. It will help all the stakeholders and regulatory authorities to take necessary steps such as grounding air traffic; suspending classes, public gatherings, and events to contain the viral spread; and managing the epidemic before the situation worsens and turns into a pandemic. In conclusion, the present study reveals that the death rate, confirmed cases, and recovered cases all endorse the notion that this COVID-19 epidemic could turn into a pandemic situation. Moreover, heterogeneous causes of death, such as risk and age groups, also need to be considered when estimating the CFR in future studies.

7. Conclusions

Furthermore, as the last two decades have encountered the SARS and MERS epidemics, and the current situation developed into a COVID pandemic, we strongly believe that predictive analytics will help improve the situational assessment in the present or any future health crisis. To the best of our knowledge, this is the very first study on COVID-19 that has incorporated exploratory data analysis and predictive analysis and provided comparison based on different data sources successively. This study also offers a strong baseline to take serious preventive measures to counter any new viral outbreak. Our study provides a roadmap for future researchers to further explore the data, since this COVID-19 epidemic has now officially entered into a pandemic mode, and to analyze the key parameters that can help influence timely intervention.

Author Contributions

Data curation, A.Q.; Methodology, K.N. (Khulla Naseer); Formal analysis, M.E.M.A.; Resources, D.A. and A.Q.; Software, N.H. and S.Q.; Supervision, J.Q.; M.Z.; and S.Y.; Validation, S.K.D.; Visualization, M.E.M.A. and A.Q.; Writing—original draft, K.N. (Kiran Naz); Writing—review & editing, K.N. (Kiran Naz). All authors have read and agreed to the published version of the manuscript.

Funding

This project was funded by the Deanship of Scientific Research (DSR) at King Abdulaziz University, Jeddah, under Grant No. (RG-95-611-42). The authors, therefore, acknowledge with thanks to DSR technical and financial support. We are also thankful for the in part support by Universiti Brunei Darussalam under research grant UBD/RSCH/URC/RG(b)/2020/023.

Institutional Review Board Statement

Not applicable.

Informed Consent Statement

Not applicable.

Data Availability Statement

Not applicable.

Acknowledgments

We would like to acknowledge John Hopkins and WHO for making their databases publicly accessible. No ethical approval was required for this work as it was done on the freely accessible data from John Hopkins.

Conflicts of Interest

The authors declare no conflict of interest.

References

  1. Li, Q.; Guan, X.; Wu, P.; Wang, X.; Zhou, L.; Tong, Y.; Ren, R.; Leung, K.S.M.; Lau, E.H.Y.; Wong, J.Y.; et al. Early Transmission Dynamics in Wuhan, China, of Novel Coronavirus–Infected Pneumonia. N. Engl. J. Med. 2020, 382, 1199–1207. [Google Scholar] [CrossRef]
  2. Jung, S.-M.; Akhmetzhanov, A.R.; Hayashi, K.; Linton, N.M.; Yang, Y.; Yuan, B.; Kobayashi, T.; Kinoshita, R.; Nishiura, H. Real-Time Estimation of the Risk of Death from Novel Coronavirus (COVID-19) Infection: Inference Using Exported Cases. J. Clin. Med. 2020, 9, 523. [Google Scholar] [CrossRef] [Green Version]
  3. Novel, C.P.E.R.E. The Epidemiological Characteristics of an Outbreak of 2019 Novel Coronavirus Diseases (COVID-19) in China. Zhonghua Liuxingbingxue Zazhi 2020, 41, 145. [Google Scholar]
  4. Liu, Y.; Gayle, A.A.; Wilder-Smith, A.; Rocklöv, J. The Reproductive Number of COVID-19 Is Higher Compared to SARS Coronavirus. J. Travel Med. 2020, 27, 1–4. [Google Scholar] [CrossRef] [PubMed] [Green Version]
  5. Heymann, D.L.; Shindo, N. COVID-19: What Is Next for Public Health? Lancet 2020, 395, 542–545. [Google Scholar] [CrossRef] [Green Version]
  6. Xu, Z.; Shi, L.; Wang, Y.; Zhang, J.; Huang, L.; Zhang, C.; Liu, S.; Zhao, P.; Liu, H.; Zhu, L.; et al. Pathological Findings of COVID-19 Associated With Acute Respiratory Distress Syndrome. Lancet Respir. Med. 2020, 8, 420–422. [Google Scholar] [CrossRef]
  7. Giwa, A.; Desai, A. Novel Coronavirus COVID-19: An Overview for Emergency Clinicians. Emerg. Med. Pract. 2020, 22, 1–21. [Google Scholar] [PubMed]
  8. Hasan, N. A Methodological Approach for Predicting COVID-19 Epidemic Using EEMD-ANN Hybrid Model. Internet Things 2020, 11, 100228. [Google Scholar] [CrossRef]
  9. Hasan, N.; Bao, Y.; Shawon, A.; Huang, Y. DenseNet Convolutional Neural Networks Application for Predicting COVID-19 Using CT Image. SN Comput. Sci. 2021, 2, 1–11. [Google Scholar] [CrossRef]
  10. Dhama, K.; Sharun, K.; Tiwari, R.; Sircar, S.; Bhat, S.; Malik, Y.S.; Singh, K.P.; Chaicumpa, W.; Bonilla-Aldana, D.K.; Rodriguez-Morales, A.J. Coronavirus Disease 2019–COVID-19. Clin. Microbiol. Rev. 2020, 33, e00028-20. [Google Scholar] [CrossRef]
  11. Dsouza, J.; Velan, Senthil S. Using Exploratory Data Analysis for Generating Inferences on the Correlation of COVID-19 Cases. In Proceedings of the 2020 11th International Conference on Computing, Communication and Networking Technologies (ICCCNT), Kharagapur, India, 1–3 July 2020; pp. 1–6. [Google Scholar] [CrossRef]
  12. Dey, S.K.; Rahman, M.; Siddiqi, U.R.; Howlader, A. Analyzing the Epidemiological Outbreak of COVID-19: A Visual Exploratory Data Analysis Approach. J. Med. Virol. 2020, 92, 632–638. [Google Scholar] [CrossRef] [PubMed]
  13. Zu, Z.Y.; Di Jiang, M.; Xu, P.P.; Chen, W.; Ni, Q.Q.; Lu, G.M.; Zhang, L.J. Coronavirus Disease 2019 (COVID-19): A Perspective from China. Radiology 2020, 296, E15–E25. [Google Scholar] [CrossRef] [PubMed] [Green Version]
  14. Johns Hopkins University. COVID-19 Dashboard. Available online: https://coronavirus.jhu.edu/map.html (accessed on 25 January 2020).
  15. Centers for Disease Control and Prevention. Coronavirus Disease 2019 (COVID-19). Available online: https://www.cdc.gov/coronavirus/2019-ncov/index.html (accessed on 25 January 2020).
  16. WHO. WHO Coronavirus (COVID-19) Dashboard. 2020. Available online: https://covid19.who.int/ (accessed on 28 January 2020).
  17. Thompson, R.; Gilligan, C.; Cunniffe, N. When Does a Minor Outbreak Become a Major Epidemic? Linking the Risk from Invading Pathogens to Practical Definitions of a Major Epidemic. J. R. Soc. Interface 2019. [Google Scholar] [CrossRef] [Green Version]
  18. Bastos, S.B.; Cajueiro, D.O. Modeling and forecasting the early evolution of the Covid-19 pandemic in Brazil. Sci. Rep. 2020, 10, 19457. [Google Scholar] [CrossRef] [PubMed]
  19. Shahi, G.K.; Dirkson, A.; Majchrzak, T.A. An Exploratory Study of COVID-19 Misinformation on Twitter. Online Soc. Networks Media 2021, 22, 100104. [Google Scholar] [CrossRef] [PubMed]
  20. Latif, A.; Sajid, I. Pakistan Stays under Lockdown Amid Coronavirus Outbreak. 2020. Available online: https://www.aa.com.tr/en/asia-pacific/pakistan-stays-under-lockdown-amid-coronavirus-outbreak/1777394 (accessed on 1 July 2021).
  21. Nation, T. Pakistan Continues to Observe Partial Lockdown Across Country. 2020. Available online: https://nation.com.pk/26-Mar-2020/partial-lockdown-continues-across-pakistan (accessed on 2 March 2020).
  22. Abd-Alrazaq, A.; Alhuwail, D.; Househ, M.; Hamdi, M.; Shah, Z. Top Concerns of Tweeters during the COVID-19 Pandemic: Infoveillance Study. J. Med. Internet Res. 2020, 22, e19016. [Google Scholar] [CrossRef] [Green Version]
  23. Jordan, S.E.; Hovet, S.E.; Fung, I.C.-H.; Liang, H.; Fu, K.-W.; Tse, Z.T.H. Using Twitter for Public Health Surveillance from Monitoring and Prediction to Public Response. Data 2019, 4, 6. [Google Scholar] [CrossRef] [Green Version]
  24. Naseer, J.Q.K.; Qazi, A.; Avuglah, B.K.; Tahir, R.; Rasheed, R.A.; Khan, S.K.; Khan, B.A.; Zeeshan, M.; Humayun, M.A.; Naseem, U. Travel behaviour prediction amid covid-19 underlaying situational awareness theory and health belief model. Behav. Inf. Technol. 2021. [Google Scholar] [CrossRef]
  25. Abo, M.E.M.; Raj, R.G.; Qazi, A. A Review on Arabic Sentiment Analysis: State-of-the-Art, Taxonomy and Open Research Challenges. IEEE Access 2019, 7, 162008–162024. [Google Scholar] [CrossRef]
  26. Qazi, A.; Bhowmik, C.; Hussain, F.; Yang, S.; Naseem, U.; Adebayo, A.-A.; Gumaei, A.; Al-Rakhami, M. Analyzing the Public Opinion As a Guide for Renewable-Energy Status in Malaysia: A Case Study. IEEE Trans. Eng. Manag. 2021, 1–15. [Google Scholar] [CrossRef]
  27. Zhou, Y.; Yang, S.; Li, Y.; Chen, Y.; Yao, J.; Qazi, A. Does the Review Deserve More Helpfulness When Its Title Resembles the Content? Locating Helpful Reviews by Text Mining. Inf. Process. Manag. 2020, 57, 102179. [Google Scholar] [CrossRef]
  28. Abo, M.E.M.; Raj, R.G.; Qazi, A.; Zakari, A. Sentiment Analysis for Arabic in Social Media Network: A Systematic Mapping Study. Comput. Sci. 2019. Available online: https://arxiv.org/abs/1911.05483 (accessed on 1 October 2021).
  29. Qazi, A.; Hussain, F.; Rahim, N.A.; Hardaker, G.; Alghazzawi, D.; Shaban, K.; Haruna, K. Towards Sustainable Energy: A Systematic Review of Renewable Energy Sources, Technologies, and Public Opinions. IEEE Access 2019, 7, 63837–63851. [Google Scholar] [CrossRef]
  30. Abo, M.E.M.; Idris, N.; Mahmud, R.; Qazi, A.; Hashem, I.A.T.; Maitama, J.Z.; Naseem, U.; Khan, S.K.; Yang, S. A Multi-Criteria Approach for Arabic Dialect Sentiment Analysis for Online Reviews: Exploiting Optimal Machine Learning Algorithm Selection. Sustainability 2021, 13, 10018. [Google Scholar] [CrossRef]
  31. Naseem, U.; Khushi, M.; Khan, S.K.; Waheed, N.; Mir, A.; Qazi, A.; Alshammari, B.; Poon, S.K. Diabetic Retinopathy Detection Using Multi-Layer Neural Networks and Split Attention With Focal Loss. In Transactions on Petri Nets and Other Models of Concurrency XV; Springer Science and Business Media LLC: Berlin/Heidelberg, Germany, 2020; pp. 26–37. [Google Scholar] [CrossRef]
  32. Angulo, C.; Ruiz, F.J.; González, L.; Ortega, J.A. Multi-Classification by Using Tri-Class SVM. Neural Process. Lett. 2006, 23, 89–101. [Google Scholar] [CrossRef]
  33. Phillips, T.; Abdulla, W. Developing a New Ensemble Approach With Multi-Class SVMs for Manuka Honey Quality Classification. Appl. Soft Comput. 2021, 111, 107710. [Google Scholar] [CrossRef]
  34. Khan, M.; Reza, Q.; Salhan, A.K.; Sirdeshmukh, S.P. Classification of Oils by ECOC Based Multi-Class SVM Using Spectral Analysis of Acoustic Signals. Appl. Acoust. 2021, 183, 108273. [Google Scholar] [CrossRef]
  35. Adeniyi, M.O.; Ekum, M.I.; Iluno, C.; Ogunsanya, A.S.; Akinyemi, J.A.; Oke, S.I.; Matadi, M.B. Dynamic model of COVID-19 disease with exploratory data analysis. Sci. Afr. 2020, 9, e00477. [Google Scholar] [CrossRef]
  36. Dey, S.K.; Rahman, M.; Siddiqi, U.R.; Howlader, A. Exploring Epidemiological Behavior of Novel Coronavirus (COVID-19) Outbreak in Bangladesh. SN Compr. Clin. Med. 2020, 2, 1724–1732. [Google Scholar] [CrossRef]
  37. Zandifar, A.; Badrfam, R.; Yazdani, S.; Arzaghi, S.M.; Rahimi, F.; Ghasemi, S.; Khamisabadi, S.; Khonsari, N.M.; Qorbani, M. Prevalence and Severity of Depression, Anxiety, Stress and Perceived Stress in Hospitalized Patients With COVID-19. J. Diabetes Metab. Disord. 2020, 19, 1431–1438. [Google Scholar] [CrossRef]
  38. Hasan, N.; Bao, Y. Impact of “e-Learning Crack-up” Perception on Psychological Distress among College Students during COVID-19 Pandemic: A Mediating Role of “fear of Academic Year loss”. Child. Youth Serv. Rev. 2020, 118, 105355. [Google Scholar] [CrossRef] [PubMed]
  39. Munawar, H.; Khan, S.; Qadir, Z.; Kouzani, A.; Mahmud, M. Insight into the Impact of COVID-19 on Australian Transportation Sector: An Economic and Community-Based Perspective. Sustainability 2021, 13, 1276. [Google Scholar] [CrossRef]
  40. Qazi, A.; Qazi, J.; Naseer, K.; Zeeshan, M.; Hardaker, G.; Maitama, J.Z.; Haruna, K. Analyzing Situational Awareness through Public Opinion to Predict Adoption of Social Distancing Amid Pandemic COVID-19. J. Med. Virol. 2020, 92, 849–855. [Google Scholar] [CrossRef]
  41. Qazi, A.; Qazi, J.; Naseer, K.; Zeeshan, M.; Qazi, S.; Abayomi-Alli, O.; Ahmad, I.S.; Darwich, M.; Talpur, B.A.; Hardaker, G.; et al. Adaption of Distance Learning to Continue the Academic Year Amid COVID-19 Lockdown. Child. Youth Serv. Rev. 2021, 126, 106038. [Google Scholar] [CrossRef]
  42. Qazi, A.; Naseer, K.; Qazi, J.; AlSalman, H.; Naseem, U.; Yang, S.; Hardaker, G.; Gumaei, A. Conventional to Online Education During COVID-19 Pandemic: Do Develop and Underdeveloped Nations Cope Alike. Child. Youth Serv. Rev. 2020, 119, 105582. [Google Scholar] [CrossRef]
  43. Sifat, R.I. COVID-19 Pandemic: Mental Stress, Depression, Anxiety among the University Students in Bangladesh. Int. J. Soc. Psychiatry 2020, 1, 2. [Google Scholar] [CrossRef]
  44. Qazi, A.; Hardaker, G.; Ahmad, I.S.; Darwich, M.; Maitama, J.Z.; Dayani, A. The Role of Information & Communication Technology in Elearning Environments: A Systematic Review. IEEE Access 2021, 9, 45539–45551. [Google Scholar] [CrossRef]
  45. Al-Dmour, H.; Masa’Deh, R.; Salman, A.; Abuhashesh, M.; Al-Dmour, R. Influence of Social Media Platforms on Public Health Protection Against the COVID-19 Pandemic via the Mediating Effects of Public Health Awareness and Behavioral Changes: Integrated Model. J. Med. Internet Res. 2020, 22, e19996. [Google Scholar] [CrossRef]
  46. De Rosis, S.; Lopreite, M.; Puliga, M.; Vainieri, M. The Early Weeks of the Italian Covid-19 Outbreak: Sentiment Insights from a Twitter Analysis. Health Policy 2021, 125, 987–994. [Google Scholar] [CrossRef] [PubMed]
  47. Petersen, K.; Gerken, J.M. #Covid-19: An Exploratory Investigation of Hashtag Usage on Twitter. Health Policy 2021, 125, 541–547. [Google Scholar] [CrossRef] [PubMed]
  48. Singh, P.; Singh, S.; Sohal, M.; Dwivedi, Y.K.; Kahlon, K.S.; Sawhney, R.S. Psychological Fear and Anxiety Caused by COVID-19: Insights from Twitter Analytics. Asian J. Psychiatry 2020, 54, 102280. [Google Scholar] [CrossRef] [PubMed]
  49. Bentivegna, S.; Artieri, G.B. Rethinking Public Agenda in a Time of High-Choice Media Environment. Media Commun. 2020, 8, 6–15. [Google Scholar] [CrossRef]
  50. Tukey, J.W. Exploratory Data Analysis; Addison-Wesley Pub. Co.: Reading, MA, USA, 1977; Volume 2, pp. 5–23. Available online: http://theta.edu.pl/wp-content/uploads/2012/10/exploratorydataanalysis_tukey.pdf (accessed on 2 March 2020).
  51. Qazi, A.; Raj, R.G.; Tahir, M.; Waheed, M.; Khan, S.U.R.; Abraham, A. A Preliminary Investigation of User Perception and Behavioral Intention for Different Review Types: Customers and Designers Perspective. Sci. World J. 2014. [Google Scholar] [CrossRef] [PubMed]
  52. Jindal, N.; Liu, B. Mining Comparative Sentences and Relations. In Proceedings of the 21st National Conference on Artificial Intelligence and the 18th Innovative Applications of Artificial Intelligence Conference, Boston, MA, USA, 16–20 July 2006; pp. 1331–1336. [Google Scholar]
  53. Qazi, A.; Fayaz, H.; Wadi, A.; Raj, R.G.; Rahim, N.; Khan, W.A. The Artificial Neural Network for Solar Radiation Prediction and Designing Solar Systems: A Systematic Literature Review. J. Clean. Prod. 2015, 104, 1–12. [Google Scholar] [CrossRef]
  54. Qazi, A.; Raj, R.G.; Hardaker, G.; Standing, C. A Systematic Literature Review on Opinion Types and Sentiment Analysis Techniques. Internet Res. 2017, 27, 608–630. [Google Scholar] [CrossRef]
  55. Salim, N.A.M.; Wah, Y.B.; Reeves, C.; Smith, M.; Yaacob, W.F.W.; Mudin, R.N.; Dapari, R.; Sapri, N.N.F.F.; Haque, U. Prediction of dengue outbreak in Selangor Malaysia using machine learning techniques. Sci. Rep. 2021, 11, 939. [Google Scholar] [CrossRef]
  56. Li, H.; Sun, F. Comparative Studies of Alignment, Alignment-Free and SVM Based Approaches for Predicting the Hosts of Viruses Based on Viral Sequences. Sci. Rep. 2018, 8, 10032. [Google Scholar] [CrossRef] [Green Version]
  57. Bendfeldt, K.; Taschler, B.; Gaetano, L.; Madoerin, P.; Kuster, P.; Mueller-Lenke, N.; Amann, M.; Vrenken, H.; Wottschel, V.; Barkhof, F.; et al. MRI-based prediction of conversion from clinically isolated syndrome to clinically definite multiple sclerosis using SVM and lesion geometry. Brain Imaging Behav. 2019, 13, 1361–1374. [Google Scholar] [CrossRef]
  58. Leong, W.; Kelani, R.; Ahmad, Z. Prediction of Air Pollution Index (API) Using Support Vector Machine (SVM). J. Environ. Chem. Eng. 2020, 8, 103208. [Google Scholar] [CrossRef]
  59. Manavalan, B.; Shin, T.H.; Lee, G. PVP-SVM: Sequence-Based Prediction of Phage Virion Proteins Using a Support Vector Machine. Front. Microbiol. 2018, 9, 476. [Google Scholar] [CrossRef]
  60. Jee, Y. WHO International Health Regulations Emergency Committee for the COVID-19 Outbreak. Epidemiol. Health 2020, 42, e2020013. [Google Scholar] [CrossRef] [Green Version]
  61. Reuters. FACTBOX-Airlines Suspend China Flights over Coronavirus. 2020. Available online: https://www.reuters.com/article/us-china-health-airlines-factbox-idUSKBN1ZT1RZ (accessed on 1 February 2020).
  62. Carlisle, S.M.A.M. Coronavirus Grounds Flights to China From 3 Continents. Here’s What Travelers Should Know. 2020. Available online: https://time.com/5774906/airlines-ground-flights-coronavirus/ (accessed on 28 January 2020).
  63. Reid, D. More Airlines Suspend Flights to and from China Amid Coronavirus Fears. 2020. Available online: https://www.cnbc.com/2020/01/31/coronavirus-more-airlines-suspend-flights-to-and-from-china.html (accessed on 24 February 2020).
  64. Ghani, A.C.; Donnelly, C.; Cox, D.R.; Griffin, J.T.; Fraser, C.; Lam, T.H.; Ho, L.M.; Chan, W.-S.; Anderson, R.; Hedley, A.J.; et al. Methods for Estimating the Case Fatality Ratio for a Novel, Emerging Infectious Disease. Am. J. Epidemiol. 2005, 162, 479–486. [Google Scholar] [CrossRef] [PubMed]
  65. Nishiura, H.; Klinkenberg, D.; Roberts, M.; Heesterbeek, J.A.P. Early Epidemiological Assessment of the Virulence of Emerging Infectious Diseases: A Case Study of an Influenza Pandemic. PLoS ONE 2009, 4, e6852. [Google Scholar] [CrossRef] [PubMed] [Green Version]
  66. A Donnelly, C.; Ghani, A.; Leung, G.; Hedley, A.J.; Fraser, C.; Riley, S.; Abu-Raddad, L.; Ho, L.-M.; Thach, T.Q.; Chau, P.; et al. Epidemiological Determinants of Spread of Causal Agent of Severe Acute Respiratory Syndrome in Hong Kong. Lancet 2003, 361, 1761–1766. [Google Scholar] [CrossRef] [Green Version]
  67. Mizumoto, K.; Saitoh, M.; Chowell, G.; Miyamatsu, Y.; Nishiura, H. Estimating the Risk of Middle East Respiratory Syndrome (MERS) Death During the Course of the Outbreak in the Republic of Korea, 2015. Int. J. Infect. Dis. 2015, 39, 7–9. [Google Scholar] [CrossRef] [PubMed] [Green Version]
  68. Yang, Y.; Peng, F.; Wang, R.; Guan, K.; Jiang, T.; Xu, G.; Sun, J.; Chang, C. The Deadly Coronaviruses: The 2003 SARS Pandemic and the 2020 Novel Coronavirus Epidemic in China. J. Autoimmun. 2020, 109, 102434. [Google Scholar] [CrossRef]
  69. Powers, D.M. Evaluation: From precision, recall and f-measure to roc, informedness, markedness and correlation. J. Mach. Learn. Technol. 2011, 2, 37–63. [Google Scholar]
  70. Mukhtar, S. Preparedness and Proactive Infection Control Measures of Pakistan During COVID-19 Pandemic Outbreak. Res. Soc. Adm. Pharm. 2021, 17, 2052. [Google Scholar] [CrossRef] [PubMed]
  71. Chohan, U.W. Forecasting the Economic Impact of Coronavirus on Developing Countries: Case of Pakistan. SSRN Electron. J. 2020. [Google Scholar] [CrossRef]
  72. Hyder, A. eBook Short Notes on the Economy during the COVID-19 Crisis; Institute of Business Administration: Karachi, Pakistan, 2020; Volume 2. [Google Scholar]
  73. Breland, J.Y.; Quintiliani, L.M.; Schneider, K.L.; May, C.N.; Pagoto, S. Social Media As a Tool to Increase the Impact of Public Health Research. Am. J. Public Health 2017, 107, 1890–1891. [Google Scholar] [CrossRef] [PubMed]
  74. Dashtipour, K.; Poria, S.; Hussain, A.; Cambria, E.; Hawalah, A.Y.A.; Gelbukh, A.; Zhou, Q. Multilingual Sentiment Analysis: State of the Art and Independent Comparison of Techniques. Cogn. Comput. 2016, 8, 757–771. [Google Scholar] [CrossRef] [PubMed] [Green Version]
Figure 1. Monthly view of confirmed, death, and recovered cases.
Sustainability 13 11339 g001
Figure 2. Overall view of confirmed, death, and recovered cases.
Sustainability 13 11339 g002
Figure 3. Geographical distribution of COVID-19 cases.
Sustainability 13 11339 g003
Figure 4. The overall trend of reported cases in China, Italy, and Iran.
Sustainability 13 11339 g004
Figure 5. The trend of confirmed cases in China, Iran, and Italy.
Sustainability 13 11339 g005
Figure 6. The predictive analysis across three (confirmed, death, recovered) variables.
Sustainability 13 11339 g006
Figure 7. The classification of COVID-19 confirmed cases worldwide.
Sustainability 13 11339 g007
Figure 8. Time-series data: (A) WHO [16], (B) (JHU CCSE) [14], and (C) CDC [15].
Sustainability 13 11339 g008
Figure 9. The word cloud of COVID-19-related tweets.
Sustainability 13 11339 g009
Figure 10. Sentiment word frequency for COVID-19 lockdown.
Sustainability 13 11339 g010
Figure 11. Most common positive and negative words.
Sustainability 13 11339 g011
Publisher’s Note: MDPI stays neutral with regard to jurisdictional claims in published maps and institutional affiliations.

