Article

Analysis of the Impact of Land-Use/Land-Cover Change on Land-Surface Temperature in the Villages within the Luki Biosphere Reserve

1
School of Forestry, Northeast Forestry University, Harbin 150040, China
2
Key Laboratory of Sustainable Forest Ecosystem Management-Ministry of Education, School of Forestry, Northeast Forestry University, Harbin 150040, China
3
Department of Natural Resources Management, Faculty of Agricultural Sciences, University of Kinshasa, Kinshasa 01302, Democratic Republic of the Congo
4
Institut National pour l’Étude et la Recherche Agronomiques (INERA), Antenne de Gestion et Conservation des Ressources Naturelles de Luki, Luki 03106, Democratic Republic of the Congo
5
Département de Phytotechnie, Faculté des Sciences Agronomiques, Université de Kikwit, Kikwit 02201, Democratic Republic of the Congo
*
Author to whom correspondence should be addressed.
Sustainability 2021, 13(20), 11242; https://doi.org/10.3390/su132011242
Submission received: 6 September 2021 / Revised: 2 October 2021 / Accepted: 9 October 2021 / Published: 12 October 2021

Abstract

:
Major land-use/land-cover change due to rapid urbanization has been known to increase the land-surface temperature around the world. Consequently, examining the variation of land-surface temperatures and mitigating the related impacts remain a challenge. The present study employed remote-sensing and geoinformational techniques to examine land-use/land-cover change and its effects on land-surface temperature variations in the villages within the Luki Biosphere Reserve, Democratic Republic of Congo. Land-use/land-cover change for the year 2038 was predicted by using the CA–Markov chain. Additionally, focus-group discussions (FGDs) with local communities from different villages were applied to better understand the impact of climate change, considering the increase of land-surface temperature. The results revealed major changes in land-use/land-cover in the four villages from 2002 to 2020, principally the expansion of fallow land and built-up areas, as well as the decline in forest land, and the complex of young secondary and degraded forest. There was an increase in mean LST values over all villages between 2002 and 2020. The highest value was observed in Tsumba kituti (25.12 °C), followed by Kisavu (24.87 °C), Kibuya (23.31 °C) and Kiobo (21.82 °C). Between 2002 and 2020, the mean LST of built-up areas increased from 23.18 to 25.12 °C, 21.55 to 23.38 °C, 21.4 to 25.78 °C and 22.31 to 25.62 °C in Tsumba kituti, Kiobo, Kisavu and Kibuya, respectively. Moreover, the mean LST of fallow land increased from 20.8 to 23.2 °C, 21.13 to 22.12 °C, 21.89 to 23.12 °C and 20.31 to 23.47 °C in Tsumba, Kiobo, Kibuya and Kisavu, respectively. This indicates that built-up and fallow land experienced the highest land-surface temperature compared to other land-use/land-cover categories. Meanwhile, the conversion of all land-use/land-cover categories into built-up areas in all the villages resulted in the increase of the land-surface temperature. FGDs results recognize the recurrent land-use/land-cover change as the major driver of the increase in LST (86%). However, it was predicted that farmland and built-up area will still increase within all the villages, while the forest land will decline. As for the complex of secondary and degraded forest, it will decrease in Tsumba kituti, while, in Kiobo and Kisavu, it is expected to increase. Through a combination of remote-sensing and primary data, this study provides accurate information that will benefit decision-makers to implement appropriate landscape-planning techniques to mitigate the effect of the increased land-surface temperature in the villages.

1. Introduction

In recent years, most regions across the world are experiencing major land-use/land-cover changes [1,2,3]. Numerous studies have reported that the observed changes in land-use/land-cover are mainly driven by human activities including agriculture [1], and rapid urbanization [2,4]. Urbanization plays a pivotal role in the transition of land use/land cover all over the globe [5,6,7]. The increase in population demands in order to sustain their livelihoods leads to land-use/land-cover change [8,9]. Recently, numerous natural and anthropogenic factors have extensively transformed natural forest land into built-up and farm land [10,11,12]. These transformations of natural lands to man-made land use have been negatively impacting the eco-environment [13], as well as the sustainable development of local communities [14,15]. Previous studies have reported the relationship between land-use/land-cover change caused by urbanization, and the rise in land-surface temperature [10,16,17]. It is worth noting that each land-use/land-cover category has its own properties that are related to the absorption and radiation of solar energy [12]. Other studies have pointed out that changes in land use/land cover due to urbanization, deforestation, and land degradation significantly affected the urban ecosystem [10,11,18]. These artificial changes in land use/land cover can lead to the increase in LST, due to the expansion of impervious surface [19,20,21]. Globally, change in land-surface temperature is one of the major issues that affect human populations, and often results from natural disasters and human induced land-use/land-cover changes. The extreme change in land use/land cover increases the related effects of land-surface temperature. Therefore, for a convenient life in the proximate environment, the implementation of alternative and mitigation solutions is necessary. Between 2010 and 2050, it is estimated that the number of people living in cities will increase by around ~80% [22]. Democratic Republic of Congo is among African countries experiencing high rate of anarchic urbanization due to a lack of land planning and policies, and major changes in land use/land cover. Furthermore, in urban areas, the increased human population results in the increase of the demand of various infrastructures to support their livelihoods, such as the construction of commercial and residential areas, public utilities, and road infrastructures which ultimately leave footprints on the environment. Recently, villages within and around the Luki Biosphere Reserve are facing an expansion due to the increase in local populations. This region is particularly faced with the migration of people from different parts of the province due to the high forest dependency and high rate of poverty. This rapid increase of population in the villages within and around the reserve has negatively impacted the natural environment due to the conversion of forest land into farmland and built-up areas, leading to the increase of impervious surfaces and warming of the villages. Therefore, accurate and updated information on the trend of the expansion of villages is necessary to allow proper implementation of strategies related to sustainable management of the natural environment. Over years, mapping land-use/land-cover change represents an essential tool for land use planning [16,23] that can benefit decision-makers to reinforce their understanding on the factors that drive land-use/land-cover change, and to predict the future trends of the environmental changes [13,24]. Geoinformational and remote-sensing technologies present the most suitable tools for monitoring and planning land use [25,26], as well as examining land-use/land-cover change from a local to a global scale [16,17,20]. There are numerous methods for monitoring land-use/land-cover change. However, for several decades, remote sensing has been the most successfully used technique. This technology has been proved to be an indispensable tool, because it covers a wide area, provides spatial information and repeated coverage of large areas and reduces the cost and time for data acquisition. Thus, remotely sensed data, especially Landsat images, have been successfully used to model land-use/land-cover change [27,28,29,30,31,32] and assess its impact on the variation of LST [17,33]. Although numerous studies have been conducted across the world, the impact of land-use/land-cover change on the land-surface-temperature variation in the villages within the Luki Biosphere Reserve is yet to be investigated. As such, the present study was motivated by the need to provide the decision-makers with valuable, up-to-date and accurate information regarding land-use/land-cover change and its impact on land-surface temperature. This study is the first of its kind in Democratic Republic of Congo’s rural zone. It is aimed at examining the past trend of land-use/land-cover change on the variation of the land-surface temperature over the last two decades (2000–2020), and evaluating the variation of land-surface temperature across different land-use/land-cover categories, using novel approaches such as Random Forest and CA–Markov chain. The local communities were also engaged through focus-group discussions (FGDs) to find the impact of land-use/land-cover change, land-surface temperature, and climate change in the study area. This is important in developing and implementing strategies of sustainable management of land use, temperature increase and climate-change-mitigating strategies. The specific objectives of the present research were to: examine land-use/land-cover change over villages within the Luki Biosphere Reserve between the years 2000 and 2020; assess the impact of land-use/land-cover change on the variation of land-surface temperature; predict the future trends of land-use/land-cover change. The findings from this study will enable the decision-makers and policy-makers to better understand the past and future trends of land-use/land-cover change, and its impact on land-surface temperature. As such, this will aid the implementation of appropriate strategies that could minimize problems related to the increased land-surface temperature.

2. Materials and Methods
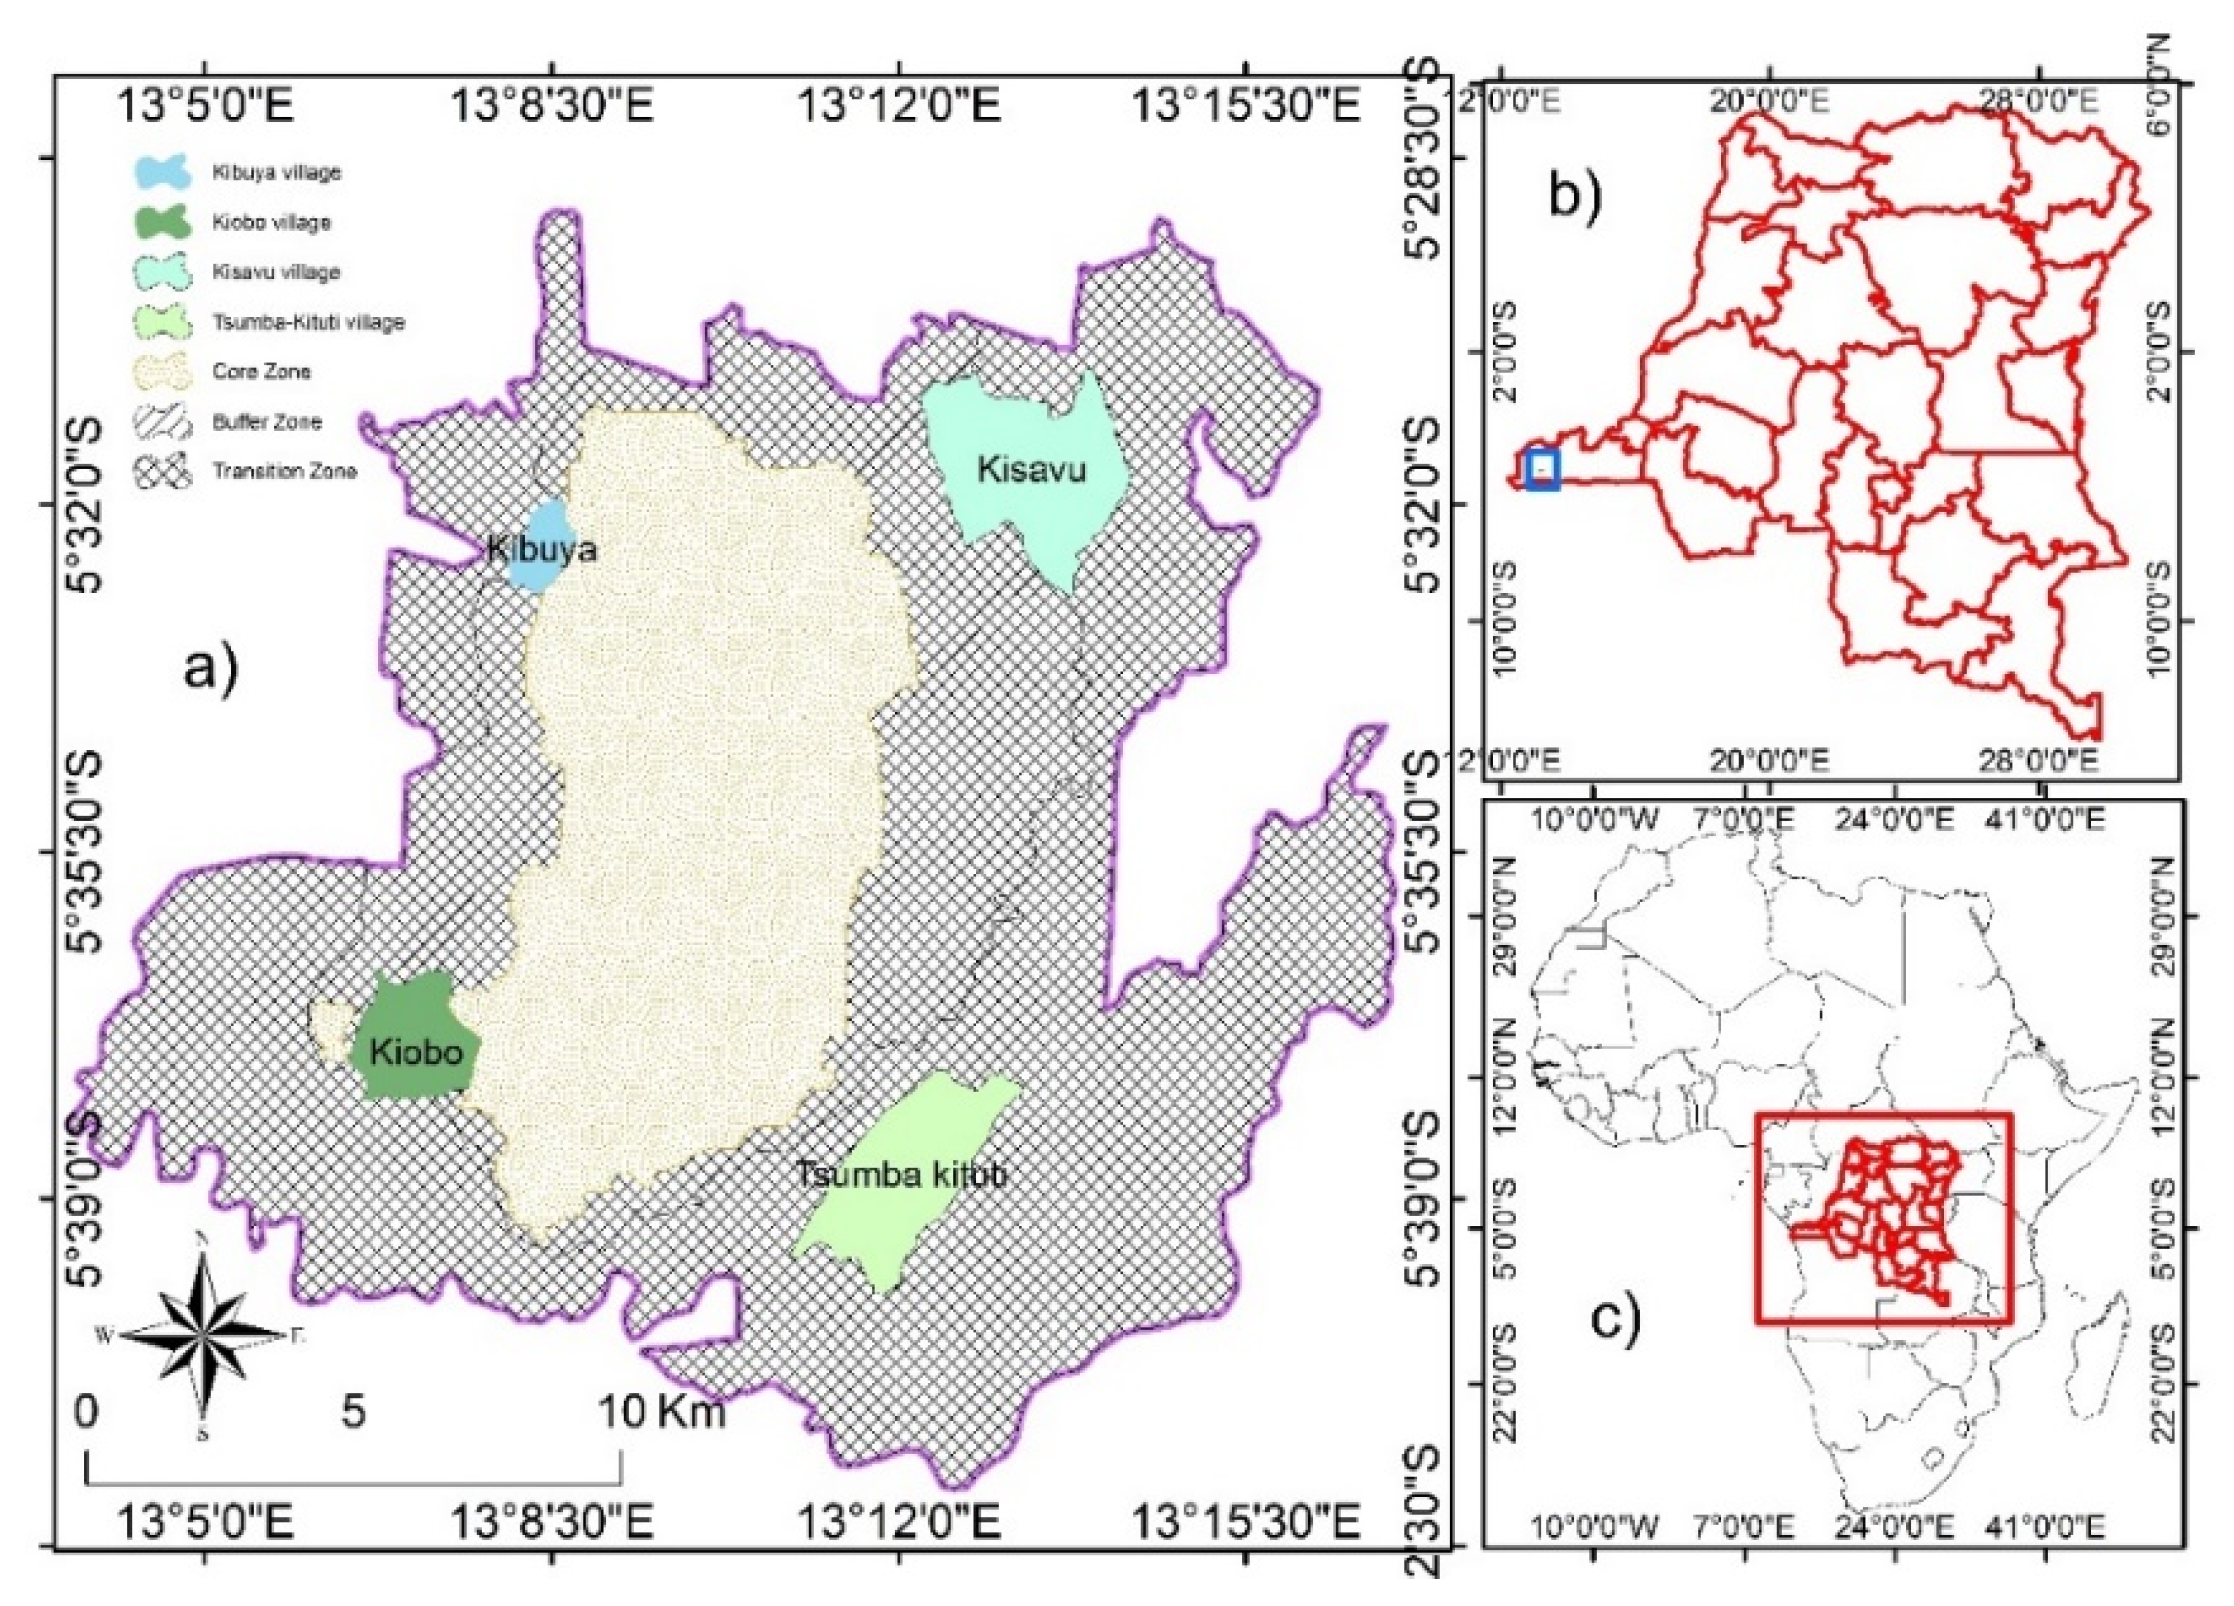
2.1. Study Area

The present study was carried out in the Luki Biosphere Reserve, in the Democratic Republic of Congo (DRC) (Figure 1). The Luki Biosphere Reserve extends over an area of about 33,000 hectares [34]. It was created in 1937 and was recognized as a biosphere reserve by the UNESCO in 1979. The reserve is located at the eastern boundary of the Mayombe forest, and remains a sample relic of the Mayombe vegetation [35]. The annual average rainfall ranges between 1150 and 1500 mm. The annual average temperature ranges between 25 and 30 °C [36]. The region is located within a humid tropical climate Aw5 according to the Köppen classification [37]. The soils in the reserve are generally ferrallitic and acidic [38]. Additionally, these soils are characterized by a low content of cations. Although Luki Reserve is conserved with the support of the DRC government institutions and the WWF, natural resources are nevertheless prone to tremendous anthropogenic pressures, mainly due to local population activities, such as slash-and-burn agriculture, wood energy, bush fires, fuelwood, illegal logging, etc. This compromises the sustainability of natural resources in the Reserve.

2.2. Data Collection and Preprocessing

The present research examines the effect of the land-use/land-cover change on LST in the Luki Biosphere Reserve from 1987 to 2020. Satellite images were freely downloaded from the United States Geological Survey (USGS) earth explorer website (http://earthexplorer.usgs.gov/ (accessed on 10 July 2021)) and the Google Earth Engine website (https://code.earthengine.google.com (accessed on 10 July 2021)). Landsat images (Landsat 4, 7 and 8) were collected for the year 1987, 2002 and 2020 (Table 1). Upon performing the radiometric and atmospheric corrections [12,17], the LST [39,40] was derived from spectral bands. To derive the LST values, the digital numbers of spectral bands were first converted into radiance. The radiance values were then converted into brightness temperature values. In addition, other spectral bands were used to provide land-use/land-cover maps by means of the maximum likelihood classifier. The ENVI 5.3 (L3Harris Geospatial, Boulder, CO, USA), ArcGIS 10.1 (ESRI, New York, NY, USA), QGIS 2.18 (Open Source Geospatial, Beaverton, OR, USA) and R 3.61 (R Foundation for Statistical Computing, Vienna, Austria) softwares were used for all image processing operations.

2.3. Land-Use/Land-Cover Classification

After the conversion of radiance into reflectance, the extraction of land-use/land-cover categories was carried out for the years 2002 and 2020. The supervised classification was performed by using the maximum-likelihood algorithm to categorize the pixels into different land-use/land-cover types [41]. The landscape of the study area was classified into five categories: forest land, built-up area, savannah, fallow land and fields, complex of young secondary and degraded forest.

2.4. Estimation of Land Surface Temperature

The land surface temperature was estimated using the Landsat thermal bands. The following process was used to convert Landsat thermal bands as Digital Number (DN) to land surface temperature:
(a) Conversion of digital number into radiance [12]
L λ = ( L M A X λ L M I N λ Q c a l m a x Q c a l m i n ) ( Q c a l Q c a l m i n ) + L M I N λ
where Lλ is the spectral radiance; LMAXλ is the maximum spectral radiance; LMINλ is the minimum spectral radiance; QCalmin is the minimum quantized calibrated pixel value in DN; QCalmax is the maximum quantized calibrated pixel value in DN; and QCal is the quantized calibrated pixel value in DN.
(b) Conversion of radiance values into brightness temperature (TB)
T B = K 2 [ l n ( K 1 L λ + 1 ) ]
where K1 and K2 are the conversions constants of thermal bands, Lλ represent a spectral radiance and T B is brightness temperature. Then, the following formula was used to obtain the temperature value in Celsius:
T B ( ) = T B ( K ) 273.15
(c) Retrieval Land Surface Temperature (LST) [16,17,40,42,43]
LST = T B 1 + ( λ T B P ) ln ( ε )
where λ (≈11.5 μm) is the effective wavelength of thermal bands; P = h c σ = 1.438 × 10⁻² mK, where σ is the Boltzmann constant (1.38 × 10⁻²³ JK−1), h is Planck constant (6.626 × 10⁻³⁴ Js) and c is the speed of light (3.0 × 10⁸ ms−1); and is the land surface emissivity
= 0.004PV + 0.986
where PV is the proportion of vegetation.
P V = ( N D V I N D V I m i n N D V I m a x N D V I m i n ) 2  

2.5. Prediction of Land Use/Land Cover

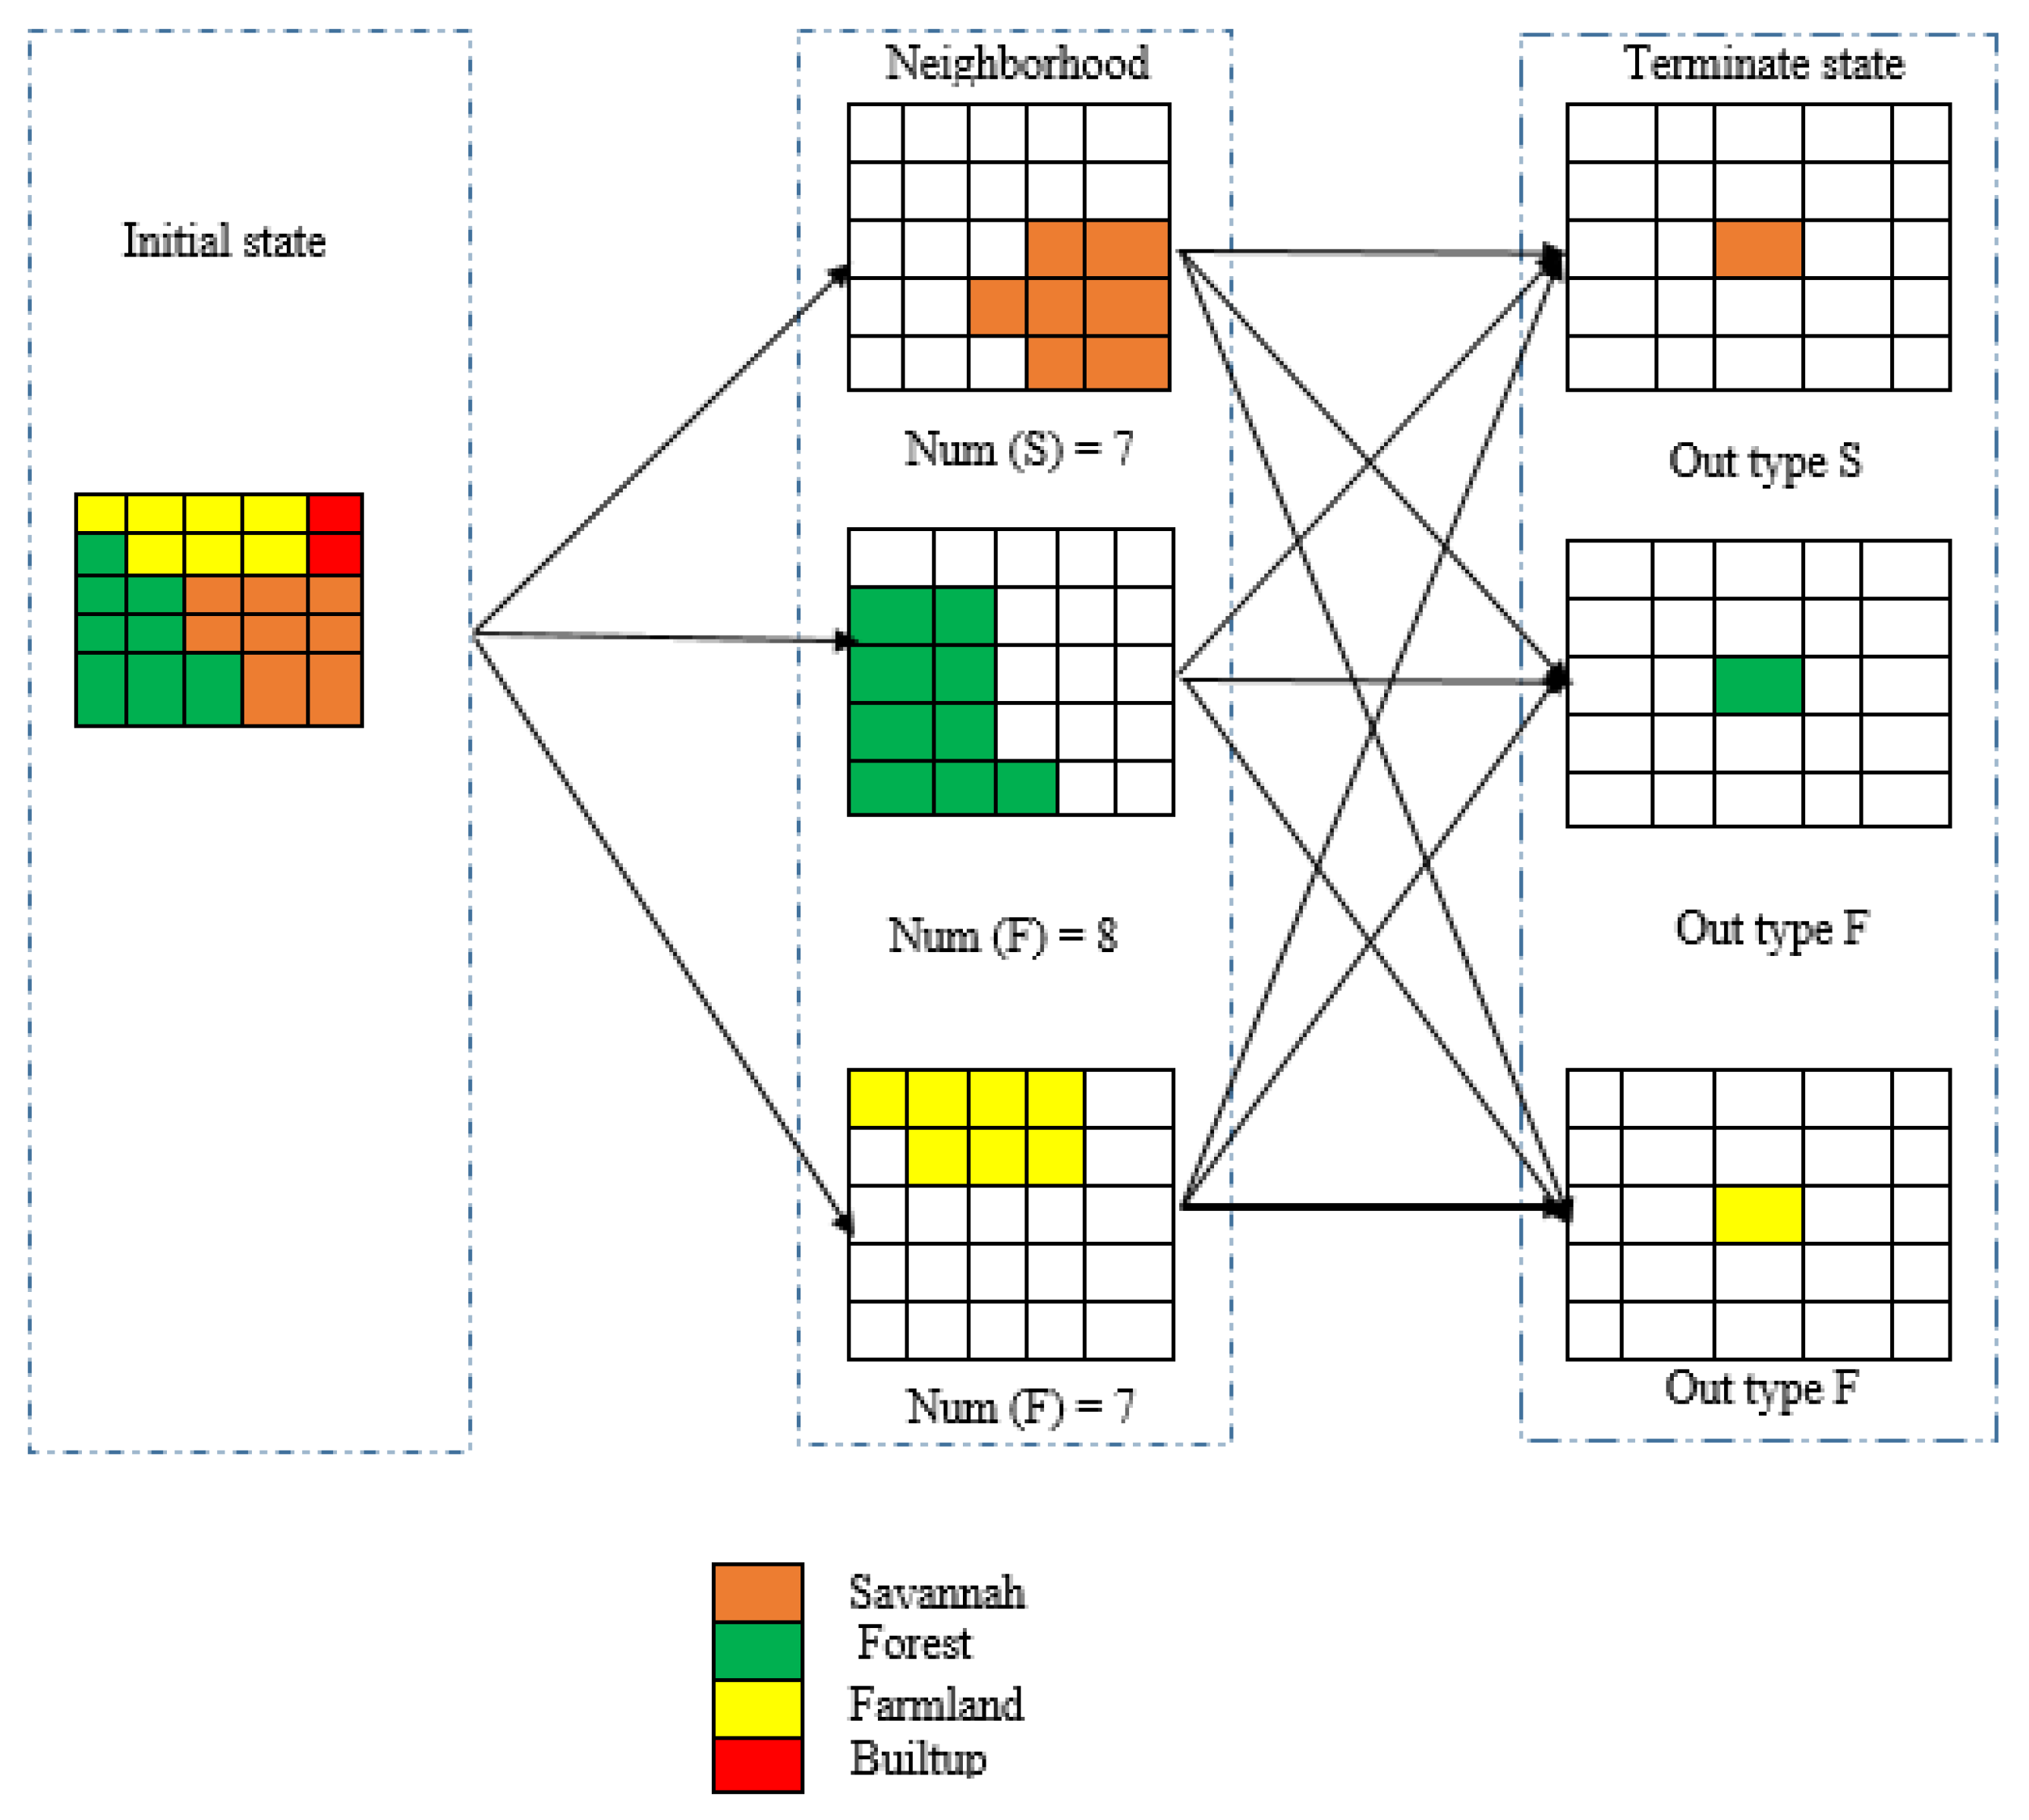
2.5.1. Cellular Automata

In general, the Cellular Automata models predict the real nature regulations. Numerous studies have reported that predicting land-use/land-cover change based CA technique is the frequently used method, which is capable of providing explicit spatial modelling results based on defined transition rule [44,45,46]. Additionally, Cellular Automata models are appropriate for representing, analyzing and stimulating geographic processes due to the relationships among raster grids [47,48]. The model incorporates both static and dynamic aspects of LULC transformation, and has been commonly used to simulate LULC change [45,47,49]. Recently, CA models have been widely used in the study of land-use/land-cover change [2,50]. According to Abubakr et al. [51], the CA models consider time and space as discrete units, where the space is considered as a regular two-dimensional grid. The main characteristic of this model is that it is based on local interactions reflecting the dynamics of system evolution [52,53]. Batty et al. [50] noted that, CA models have the ability to simulate stochastic, nonlinear and spatial processes. Numerous studies have illustrated the capability of Cellular Automata models to model complex spatiotemporal processes of land-use change [46,54,55,56,57]. The CA model comprises five components, namely space, state, time step, neighborhood and transitional rule [58]. The space in a CA is represented as a grid, and it comprises cells of equal size and shape. There are transitional rules that guide the mutual interaction between cells in a grid, and they are based on the spatial relationship between cells, including distance and neighborhood. The interactions between the cells take place at each instant and the cell state update takes place as progress is made. With the presence of multiple layers in CA, the interaction of cells in each grid is based on multiple predictors.
The transition rule that defines the state of each cell in the subsequent time step depends on the current state of that cell and its surrounding neighborhood cells. Afterwards, land-use/land-cover change suitability maps are required, and the dynamics should be defined into the system. Filters are used to determine the neighbors in CA model. The magnitude of the weight factor increases with the proximity of the nuclear cell to its neighbor. Therefore, land use/cover is not an entirely random decision, and the simulation of the adjacent cells in a grid should result from the combination of the weight factor and the probabilities of transition. Two types of neighborhood are widely used in CA, namely Von Neumann and Moore [59]. The present research applied a filter with 5-by-5 Moore neighborhood to create transition rules with the aim of simulating the future change in the land-use/cover. The rules represent the suitability maps, which illustrate the probability of each pixel (cell) to change its state during the period under study.
The basic expression of CA model as illustrated in Figure 2 can be expressed as follows:
S (t, t + 1) = ƒ (S (t), N)
where S denotes a set of finite cell states. The instant and future times are represented by t and t + 1, respectively. N illustrates the cell neighborhood, and f represents the transition rule of cellular states in local space.

2.5.2. Markov Chain Analysis

Markov Chain approaches have been effectively used to simulate land use/land cover. The model fundamentally evaluates the transition probability trend of land-use/land-cover categories within a certain area during a certain period. The model is made up of an ensemble of alternative states over time. This assumes that the prediction of system state at time t + 1 is based on its previous state at time t. This study considered the period between 2002 and 2020 to generate the transition probability matrices [60]. The generated matrices offer the transition probabilities for all land-use/land-cover classes over the defined time, and were used to predict the land-use/land-cover change in 2020. The mathematical expression of the Markov chain is illustrated as follows [61,62]:
S   ( t ,   t + 1 ) = P ij   x S t + 1
where S (t) and S (t + 1) are states of the system at time t and t + 1, respectively; P ij represents the transition probability matrix for the land-use/land-cover category, and transition from the state i to the state j, and from the time t to the time t + 1. The mathematical expression of P ij is presented as follows [63,64]:
| | P ij | | = | | P 11 P 12 P 13 P 1 n P 21 P 22 P 23 P 2 n P 31 P 32 P 33 P 3 n P n 1 P n 2 P n 3 P nn | | ( 0     P ij   1 )   and   j = 1 n P ij = 1 ,   i   ,   j = 1 ,   2 , , n
where Pn represents the state probability at any time, n is the LUC type number, S is LUC status and t or t + 1 is the time point. Thus, any class with a low transition value will be expected to have a probability close to (0), while a high transition will have a probability close to (1) [64].

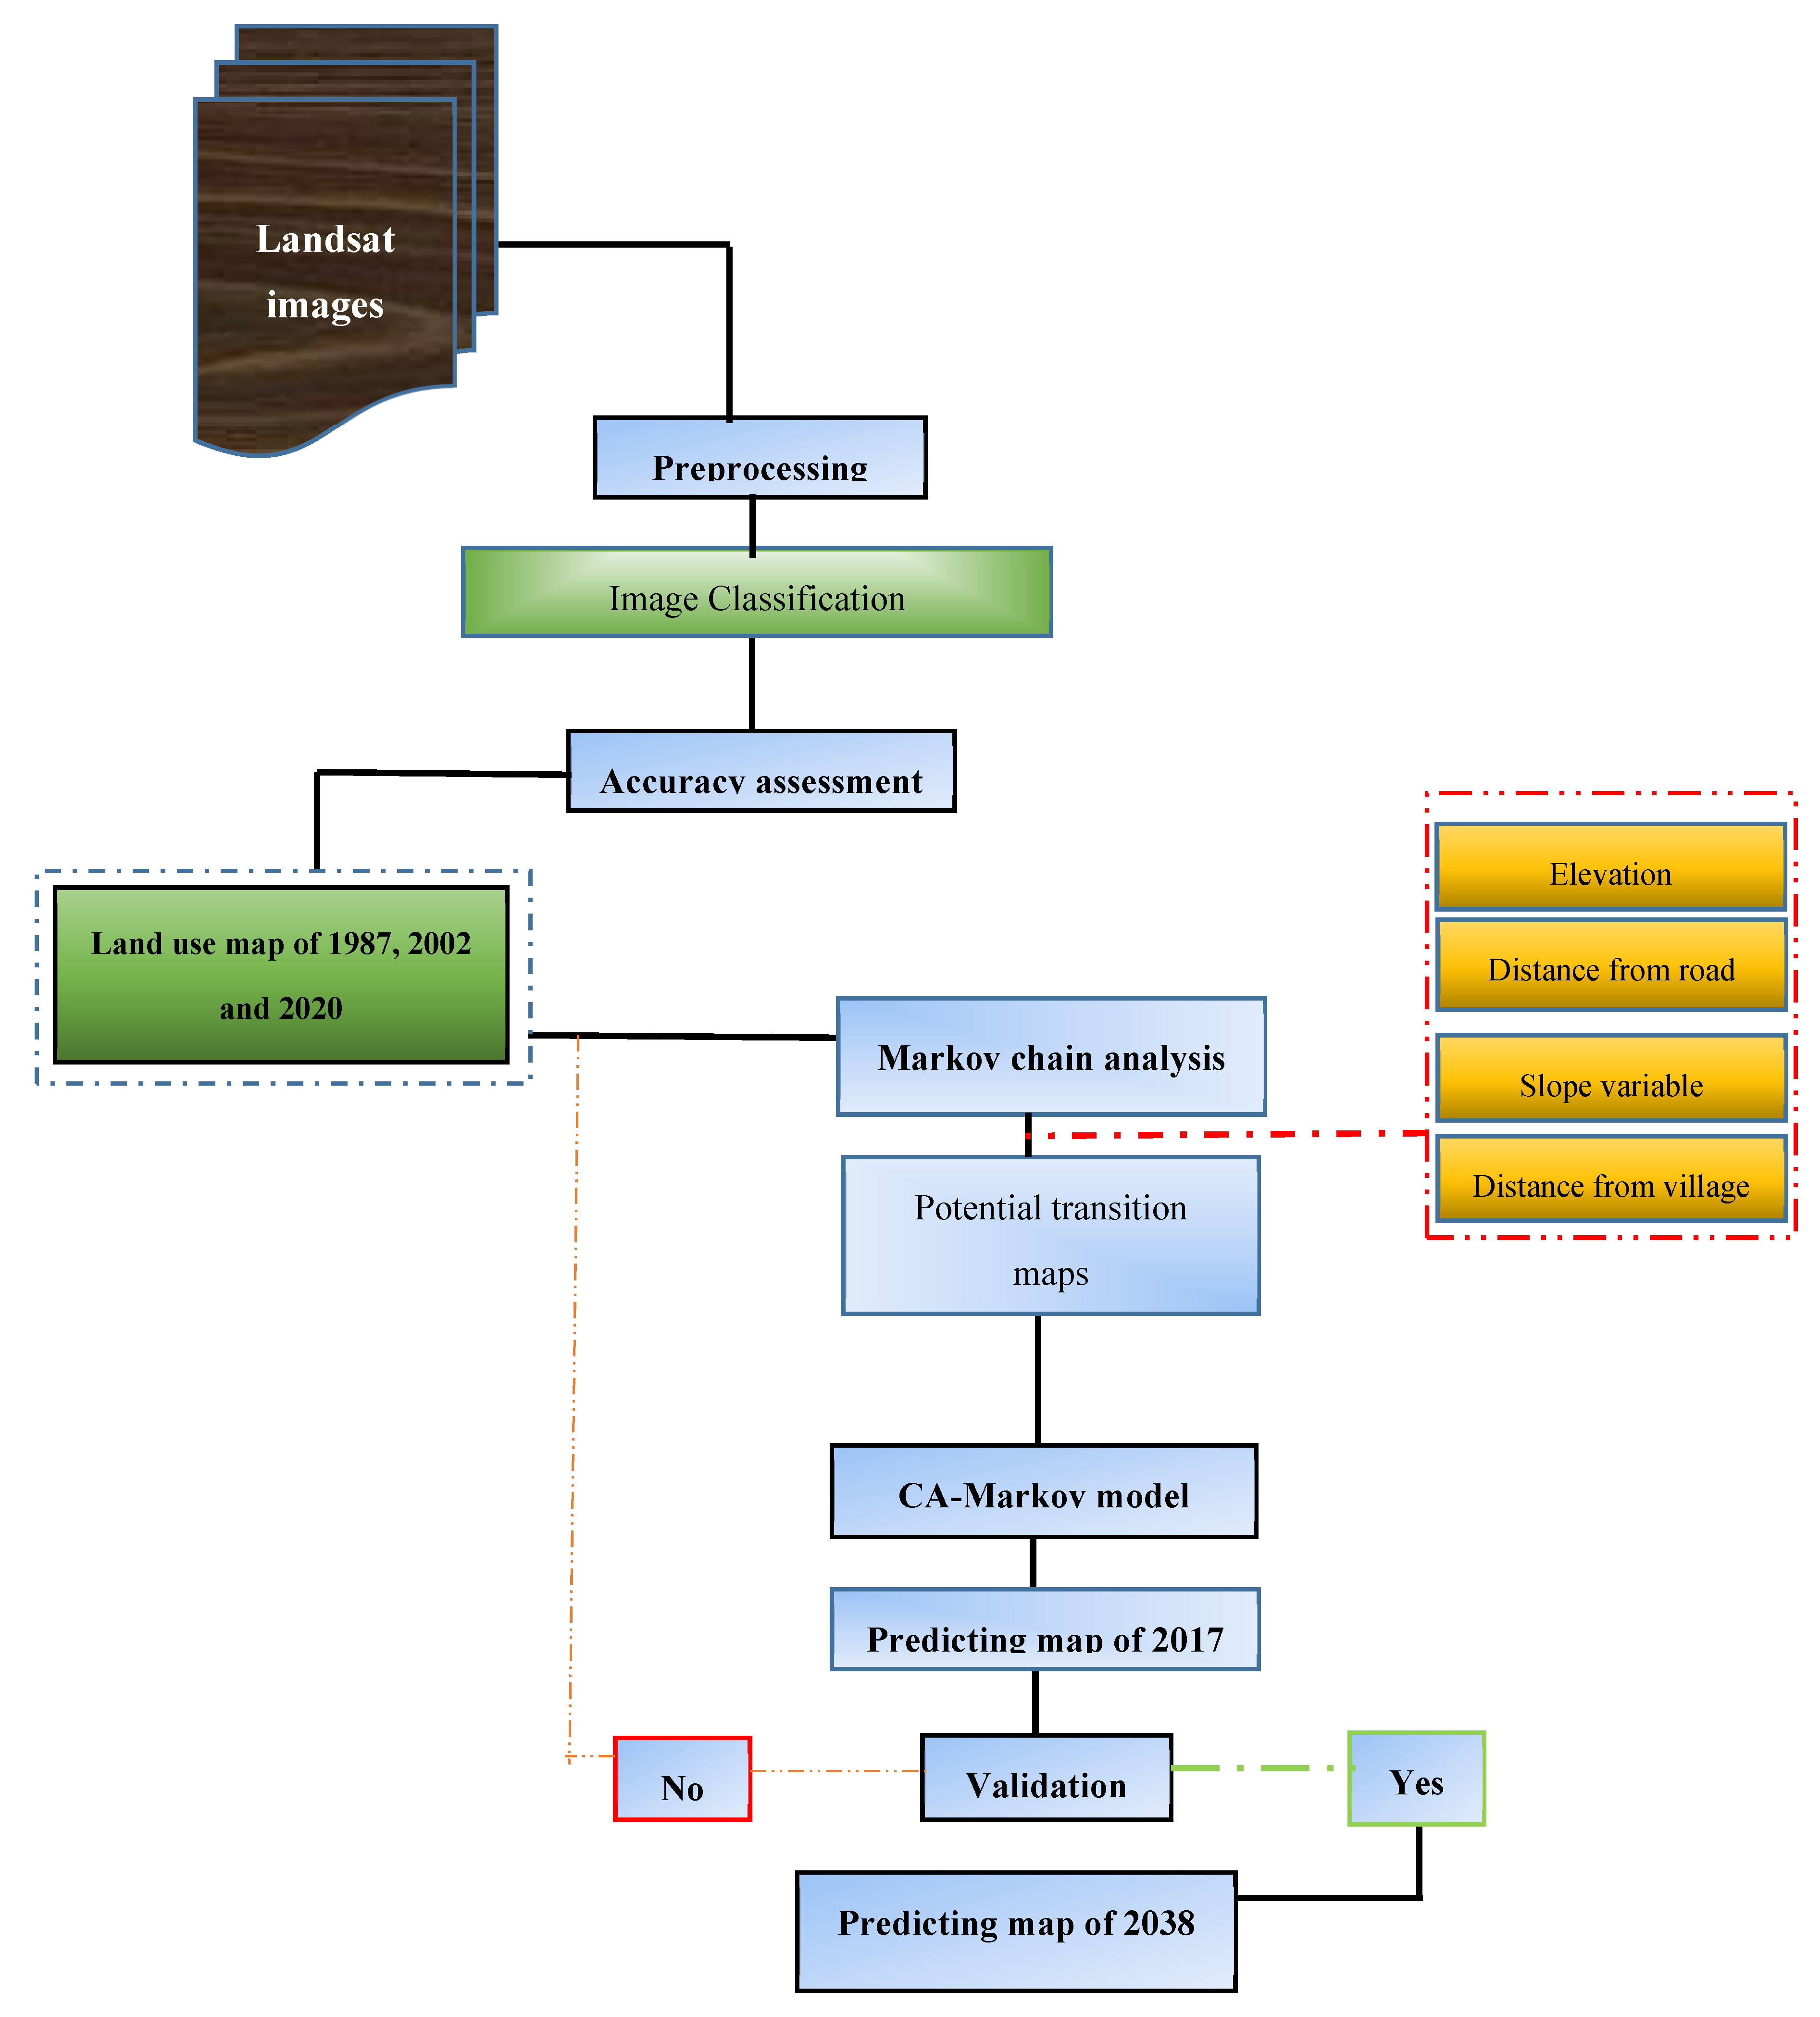
2.5.3. Implementation of CA–Markov Chain Model

The improvement of the precision of land-use/land-cover change prediction techniques can be achieved by integrating two or more techniques, considering that each technique has its advantages [65,66,67]. Several studies have recently used the CA–Markov model to predict dynamic spatial phenomena and forecasting future land-use changes [53]. Indeed, the CA–Markov chain model benefit from the integration of Markov chain and the CA model. As such, CA–Markov models have been found to be suitable for efficient prediction of change in land use/land cover [53,67,68,69]. Additionally, the integration of Cellular Automata and Markov chain approaches offers accurate results in land-use/land-cover change prediction and takes into account the absence of statistical, socioeconomic and historical data [70,71,72]. In the CA–Markov method, the component related to temporal change of land-use/land-cover categories is guided by Markov chain process based on generated transition matrices [73]. On the other hand, the spatial change component is directed by transition potential maps, neighborhood configuration and the rules of local transition throughout the process of CA model [68,74,75,76]. In this study, prediction of land-use/land-cover change was performed by using IDRISI-Selva 17.0 (Clark University, Worcester, MA, USA) software environment. Statistics of change in each land-use/land-cover class was computed by using cross tabulation analysis. The CA–Markov model was then run to predict the future change of each land-use/land-cover category for each village, as illustrated in Figure 3. Thus, the following three major steps were followed:
  • The computation land-use transition probability matrix and transition rules, using Markov chain analysis. The precedent state of each land-use/land-cover category was used to predict its future state. To predict land-use/land-cover change in 2038, we used the transition probabilities map between 2002 and 2020. Moreover, the land-use/land-cover transformation rules were provided by the transition probability matrices. These matrices provide the description of transition probability of each land-use/land-cover category into others. However, quantities of change in each land-use/land-cover categories to other categories were provided by the transition area matrices.
  • Determining the CA filter. Here, several options of standard contiguity kernels were applied as neighborhoods to identify the suitable contiguity filter for the purpose of land-use/land-cover prediction. These are 7 × 7, 5 × 5 and 3 × 3 contiguity kernels. For this study, we selected the contiguity filter 5 × 5. This filter considers that the center of each pixel is surrounded by matrix space of 5 × 5 dimension in order to reflect the change in each pixel significantly.
  • Determining the number of iterations and the time of starting point of CA. To identify the suitable iterations, we applied several iteration numbers, starting from 1 to 300. Ultimately, we selected four iterations to carry out the land-use/land-cover change prediction.

2.5.4. Model Validation

The present study used the three map comparison method (a reference map of time 1, a reference map of time 2 and a predicted map of time 2) to evaluate the model accuracy. This approach was implemented by Pontius et al. [77], and is composed of two components of agreement and three components of disagreement [78]. The components of agreement includes correctly simulated persistence (correct rejection) and correctly simulated change (hits), while the components of disagreement comprise change predicted as persistence (misses), persistence predicted as change (false alarm) and change predicted as change to wrong category (wrong hits). We then used the reference map of 2002, the reference map of 2017 and the predicted map of 2017. The validation results showed a low percentage of disagreement components of 3.60%, 3.39%, 2.49% and 1.98% for Tsumba kituti, Kisavu, Kibuya and Kiobo, respectively; meanwhile, the percentages of agreement components were high for all villages (Table 2).

3. Results and Discussion

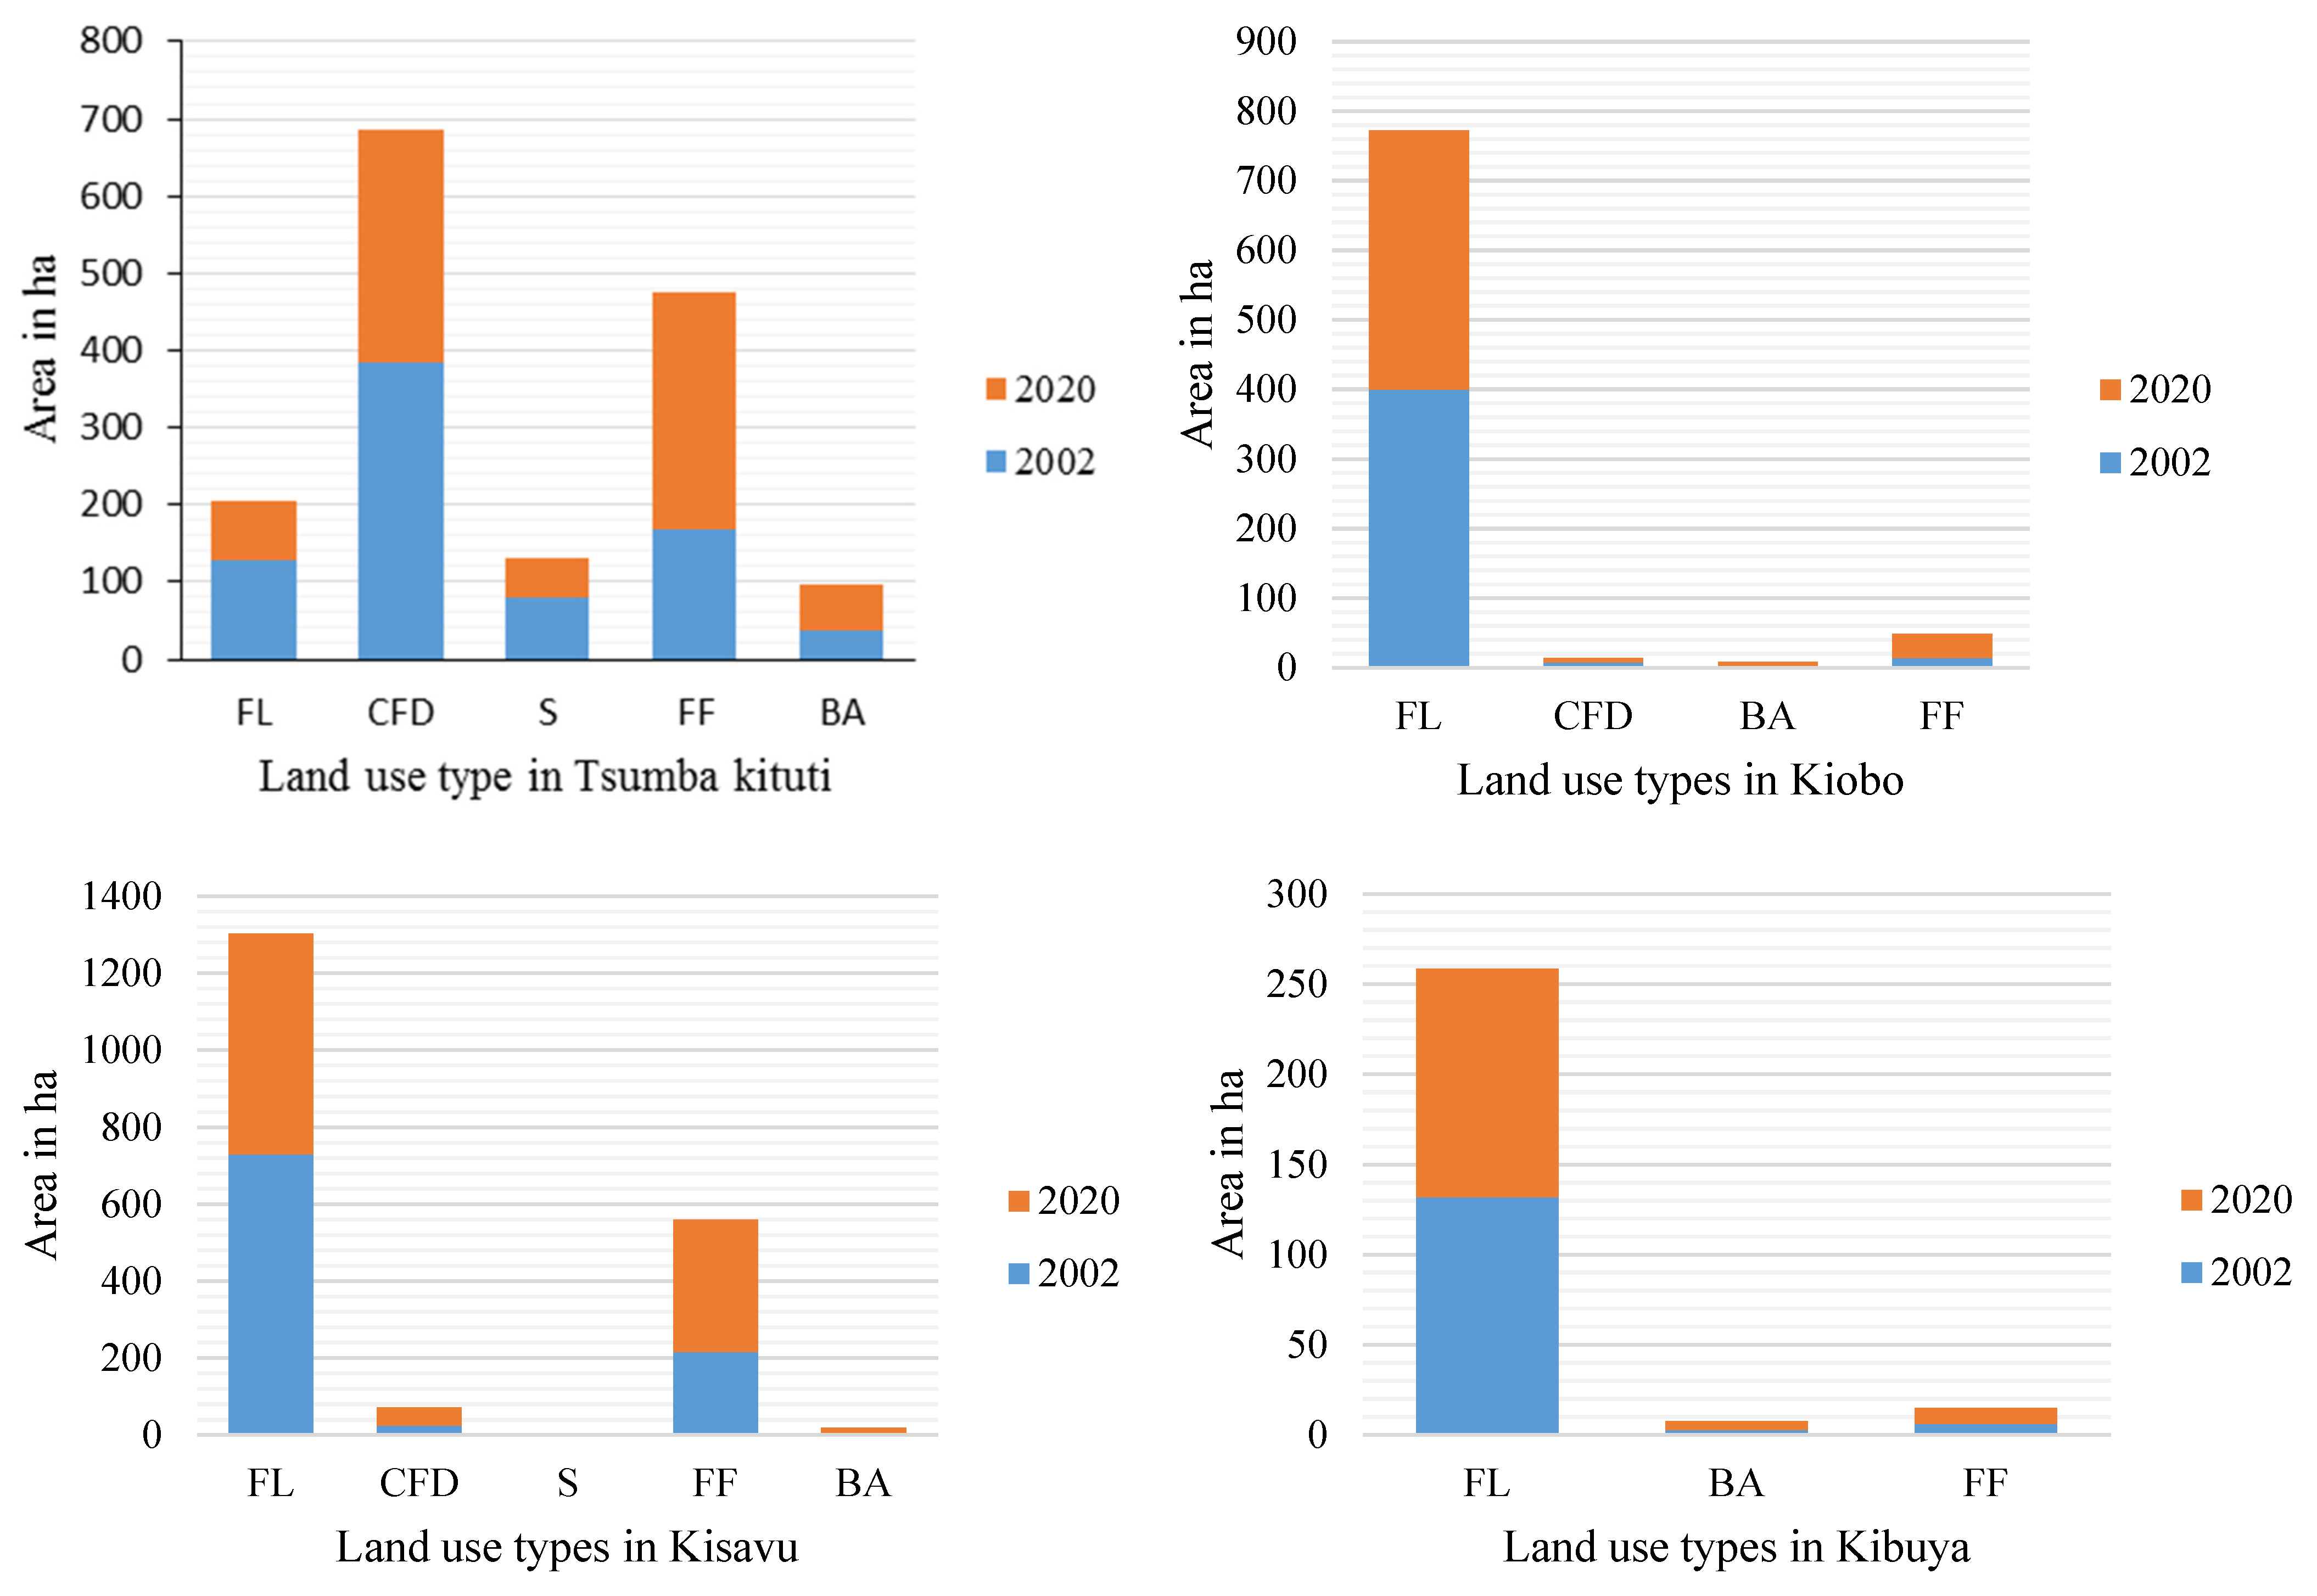
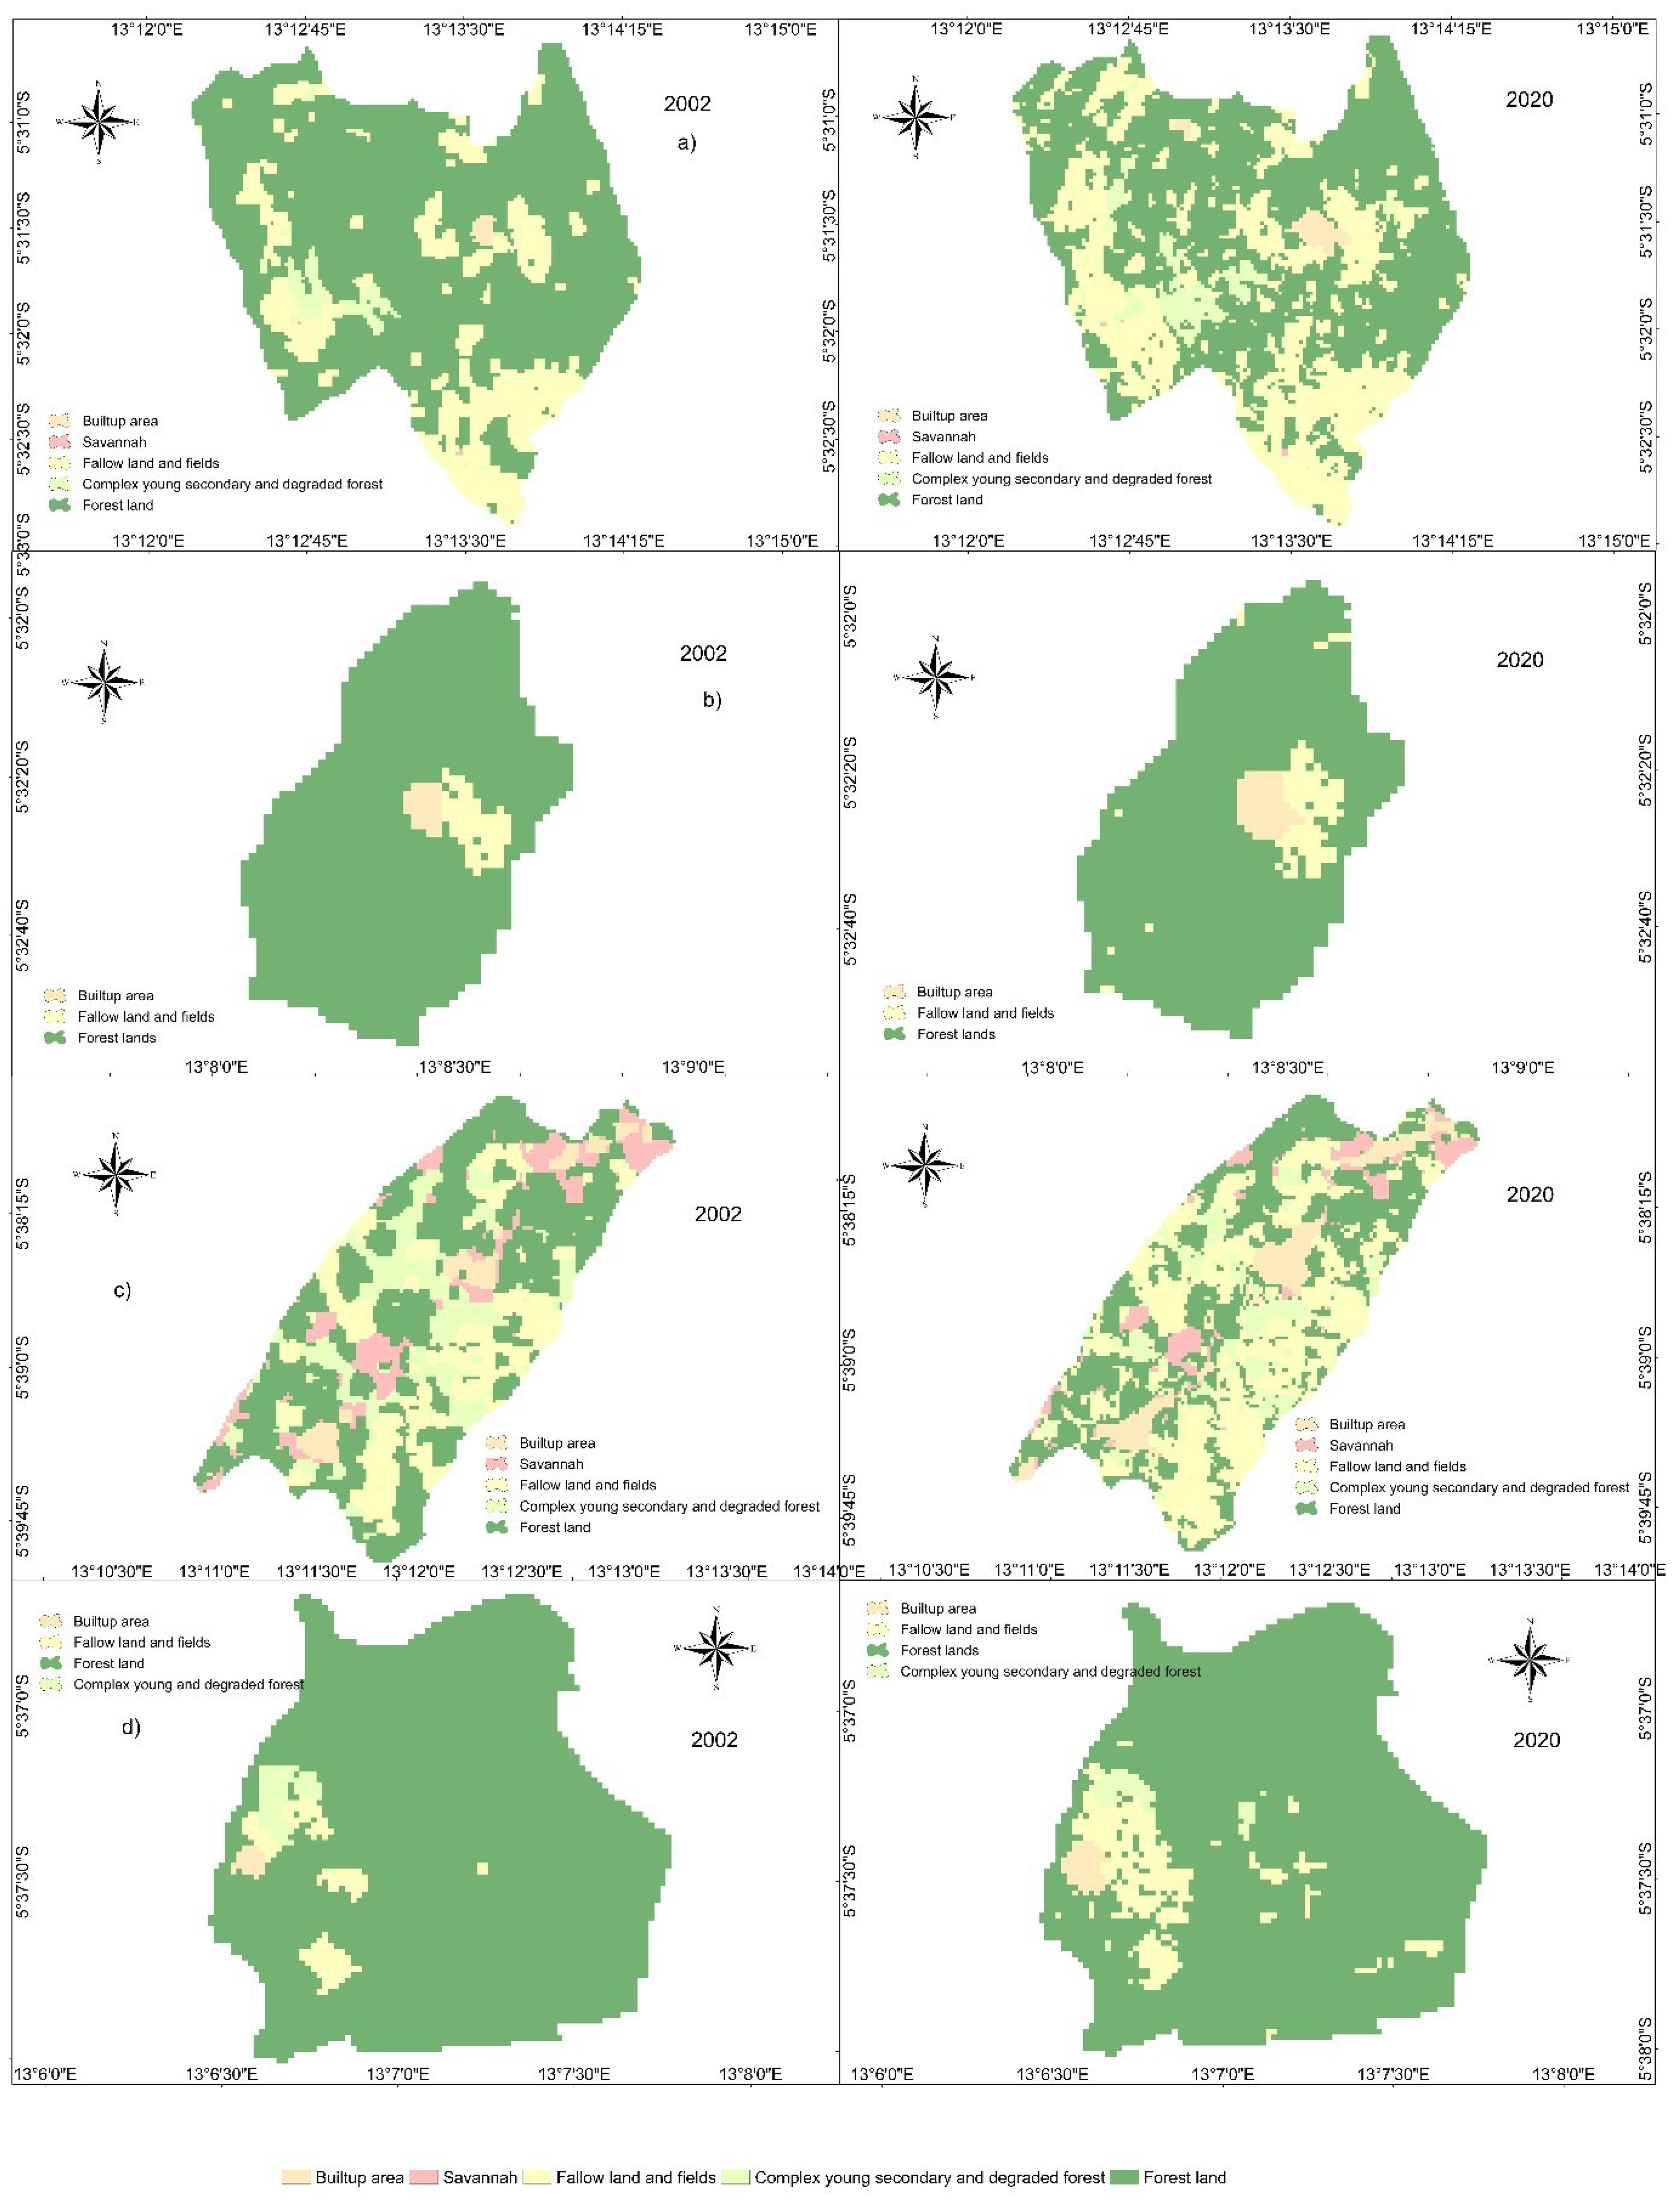
3.1. Land-Use/Land-Cover Change from 2002 to 2020

Our results revealed five main land-use/land-cover classes in the four villages. These include forest land, complex of degraded and young secondary forest, savannah, built-up area, and fallow land and fields. Figure 4 and Figure 5 depicts the spatiotemporal and statistical distribution of different land-use/land-cover classes for 2002 and 2020, in the four villages. In 2002, the complex of degraded and young secondary forest was the largest land-use/land-cover class in the landscape of Tsumba kituti village, with 384.9 hectares, followed by fallow land and fields (169.1 ha), forest land (127.4 ha), savannah (79.7 ha) and built-up area (35.8 ha). From 2002 to 2020, the increase in area was estimated at 136.5 and 25.3 hectares for fallow land and fields, and built-up area, respectively. The decrease in area was estimated at 49.9, 82.6 and 29.6 hectares for forest land, complex of degraded and young secondary forest and savannah, respectively. In 2002, the forest land was the largest land-use/land-cover class (399.6 ha) in the Kiobo village’s landscape, followed by fallow land and fields (13.9 ha), complex of degraded and young secondary forest (7.8 ha), and built-up area (2.1 ha). From 2002 to 2020, the increase in area was estimated at 20.7 and 3.7 hectares for fallow land and fields, and built-up area, respectively. The decrease in area was estimated at 27 and 1.9 hectares for forest land and complex of degraded and young secondary forest, respectively. In 2002, the forest land was the largest land-use/land-cover class (729.9 ha) in the Kisavu village landscape, followed by fallow land and fields (215.1 ha), complex of degraded and young secondary forest (25 ha), savannah (0.4 ha) and built-up area (5.4 ha). From 2002 to 2020, the increase in area was estimated at 129.2, 21.2, 7.4 and 0.3 hectares for fallow land and fields, built-up area, complex of degraded and young secondary forest and savannah, respectively. On the other hand, the decrease in forest area was estimated at 157.7 hectares. In 2002, the forest land was the largest land-use/land-cover class in the Kibuya village landscape (131.9 ha), followed by fallow land and fields (6 ha) and built-up area (2.6 ha). From 2002 to 2020, the increase in area was estimated at 2.5 and 3 hectares for built-up area, and fallow land and fields, respectively. The decrease in forest area was estimated at 5.4 hectares. Consequently, this research revealed tremendous land-use/land-cover transformation that varied with space and time in the four villages. These land-use/land-cover transformations were mainly driven by rapid urbanization. Our results are consistent with previous findings [16,17,21,33,79,80]. Major land-use/land-cover transformations were the main causes various environmental issues, including the increase in land-surface temperature.

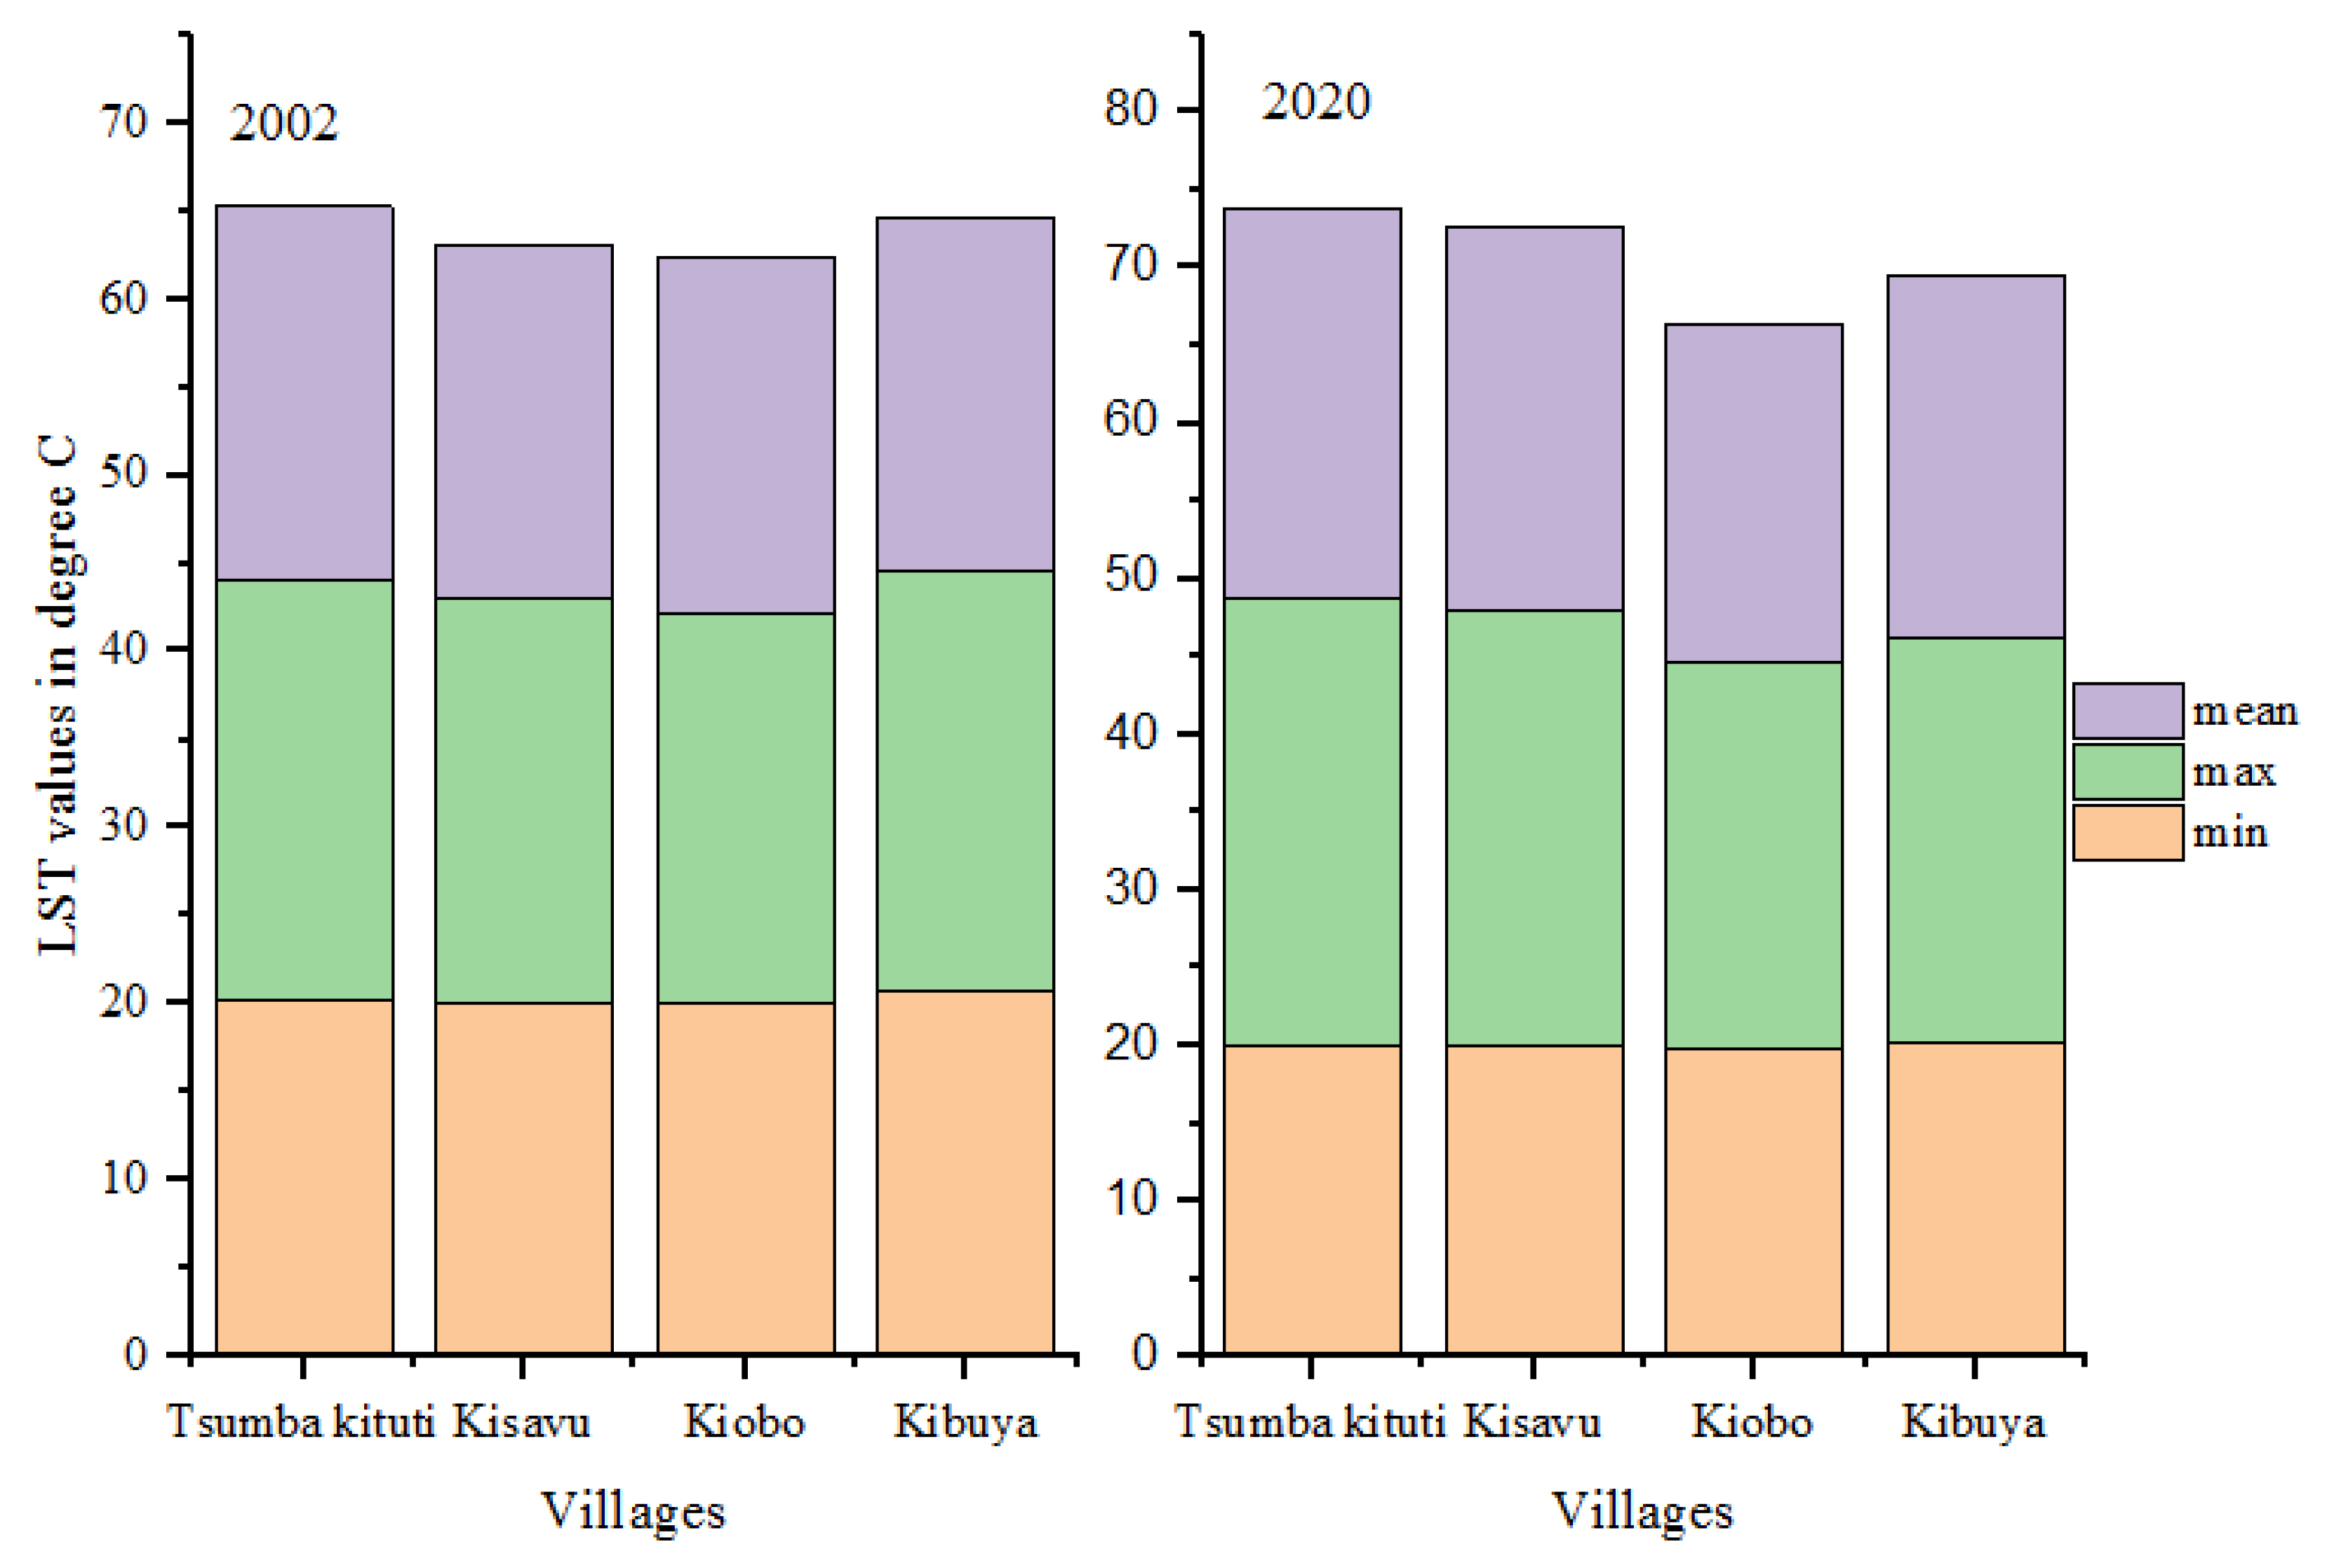
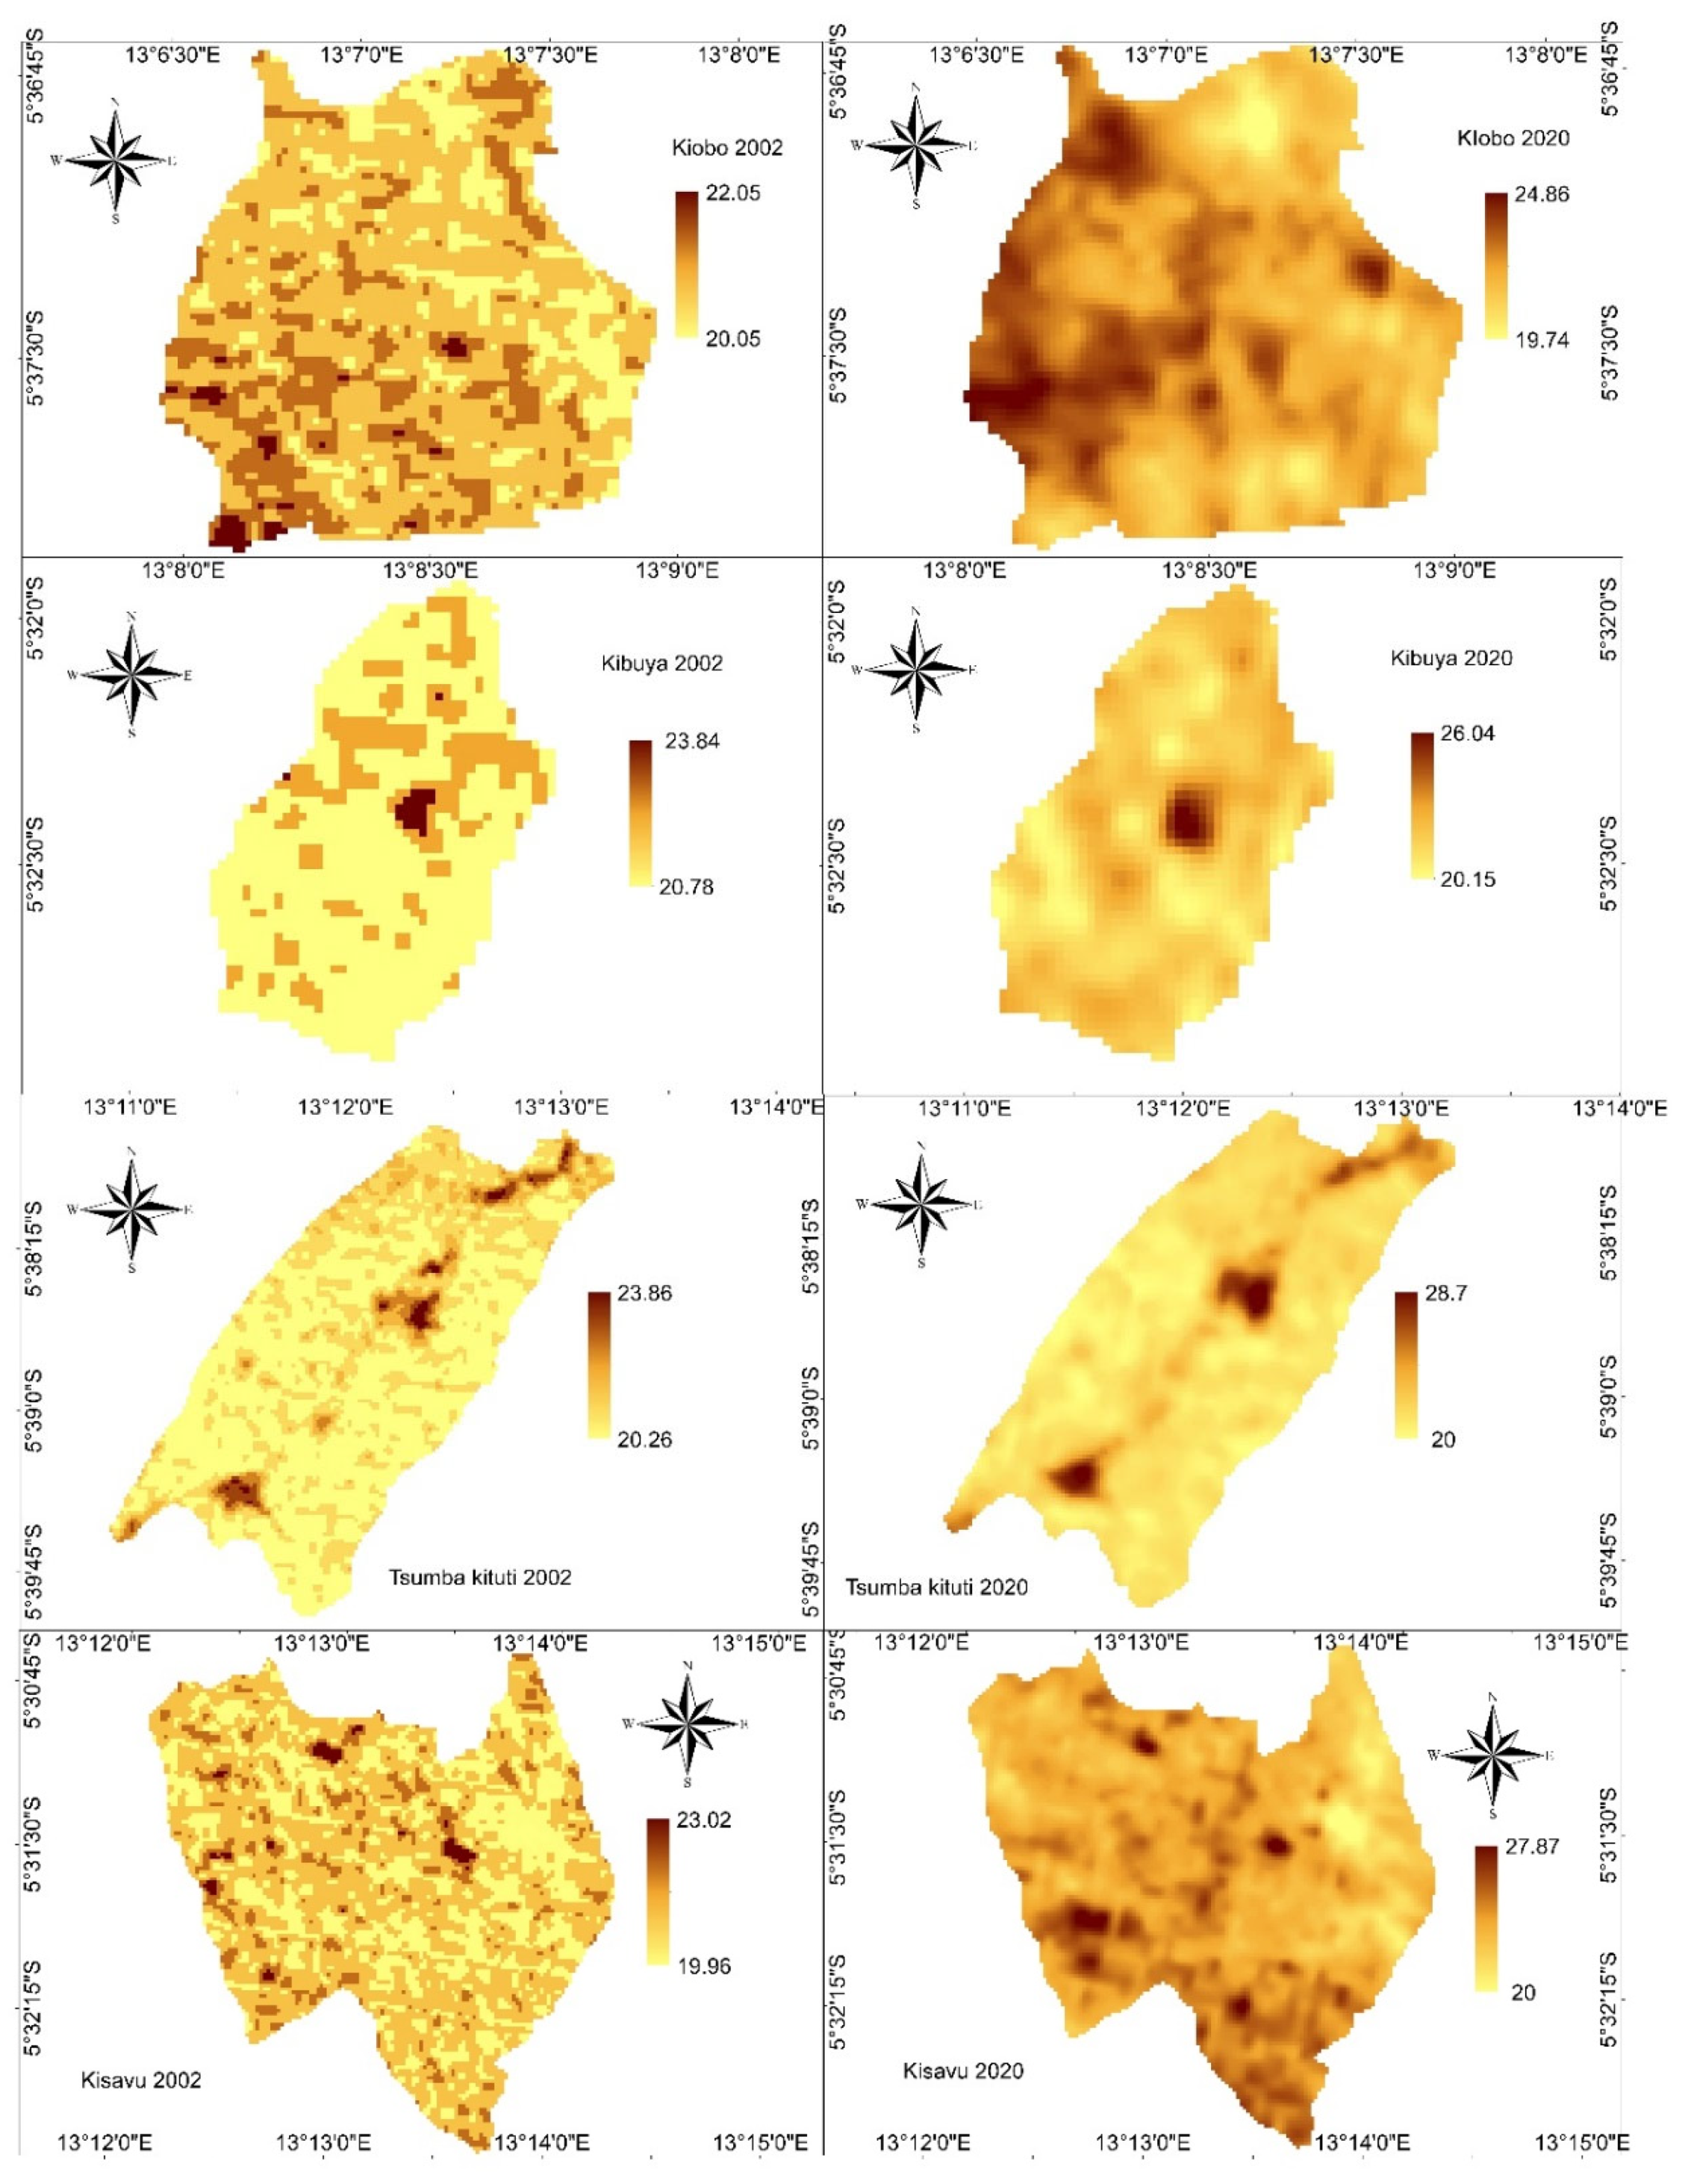
3.2. Spatiotemporal Distribution of LST and Its Variations with LULC Types

Figure 6 and Figure 7 illustrates the spatiotemporal variation distributions of LST for 2002 and 2020 in the four villages. In 2002, the minimum and maximum LST of Tsumba kituti, Kisavu, Kibuya and Kiobo were estimated at 20.26 and 23.86 °C, 19.96 and 23.02 °C, 20.78 and 23.84 °C, and 20.05 and 22.05 °C, respectively (Figure 6). On the other hand, in 2020, the minimum and maximum LST of Tsumba kituti, Kisavu, Kibuya and Kiobo were estimated at 20 and 28.7 °C, 20 and 27.87 °C, 20.15 and 26.04 °C, and 19.74 and 24.86 °C, respectively. From 2002 to 2020, there was an increase in the mean LST values of all villages. The highest value was observed in Kisavu (4.74 °C), followed by Tsumba kituti (4.03 °C), Kibuya (3.3 °C) and Kiobo (1.49 °C). The present research has revealed highest LST values in the center of built-up zones of all villages, and it decreased with the distance from the center. This increase was due to the presence of settlements and other impervious surface with high reflectance rate. These findings were consistent with previous research [16,19,20,21,80]. Additionally, our findings for the four villages denote that highest LST values for 2002 and 2020 were related to dry objects such as buildings, rocks, and bare lands. According to previous studies, the aforementioned objects have the capability of raising the efficacy of the surface to absorb solar energy and convert it into heat energy [39,81]. This results in the increase of the land-surface temperature. Meanwhile, the overpopulated residential zones in the center of built-up areas showed high LST values compared to surrounding zones in 2002 and 2020. In 2002 and 2020, the mean LST values of built-up areas were estimated at 21.09 and 25.12 °C, 20.13 and 24.87 °C, 20.33 and 21.82 °C, and 20.01 and 23.31 °C for Tsumba kituti, Kisavu, Kiobo and Kibuya, respectively. Indeed, built-up areas experienced high LST values compared to other land-use/land-cover classes. On another hand, areas with high vegetation coverage such as forest land experienced lowest LST values within the four villages under study.

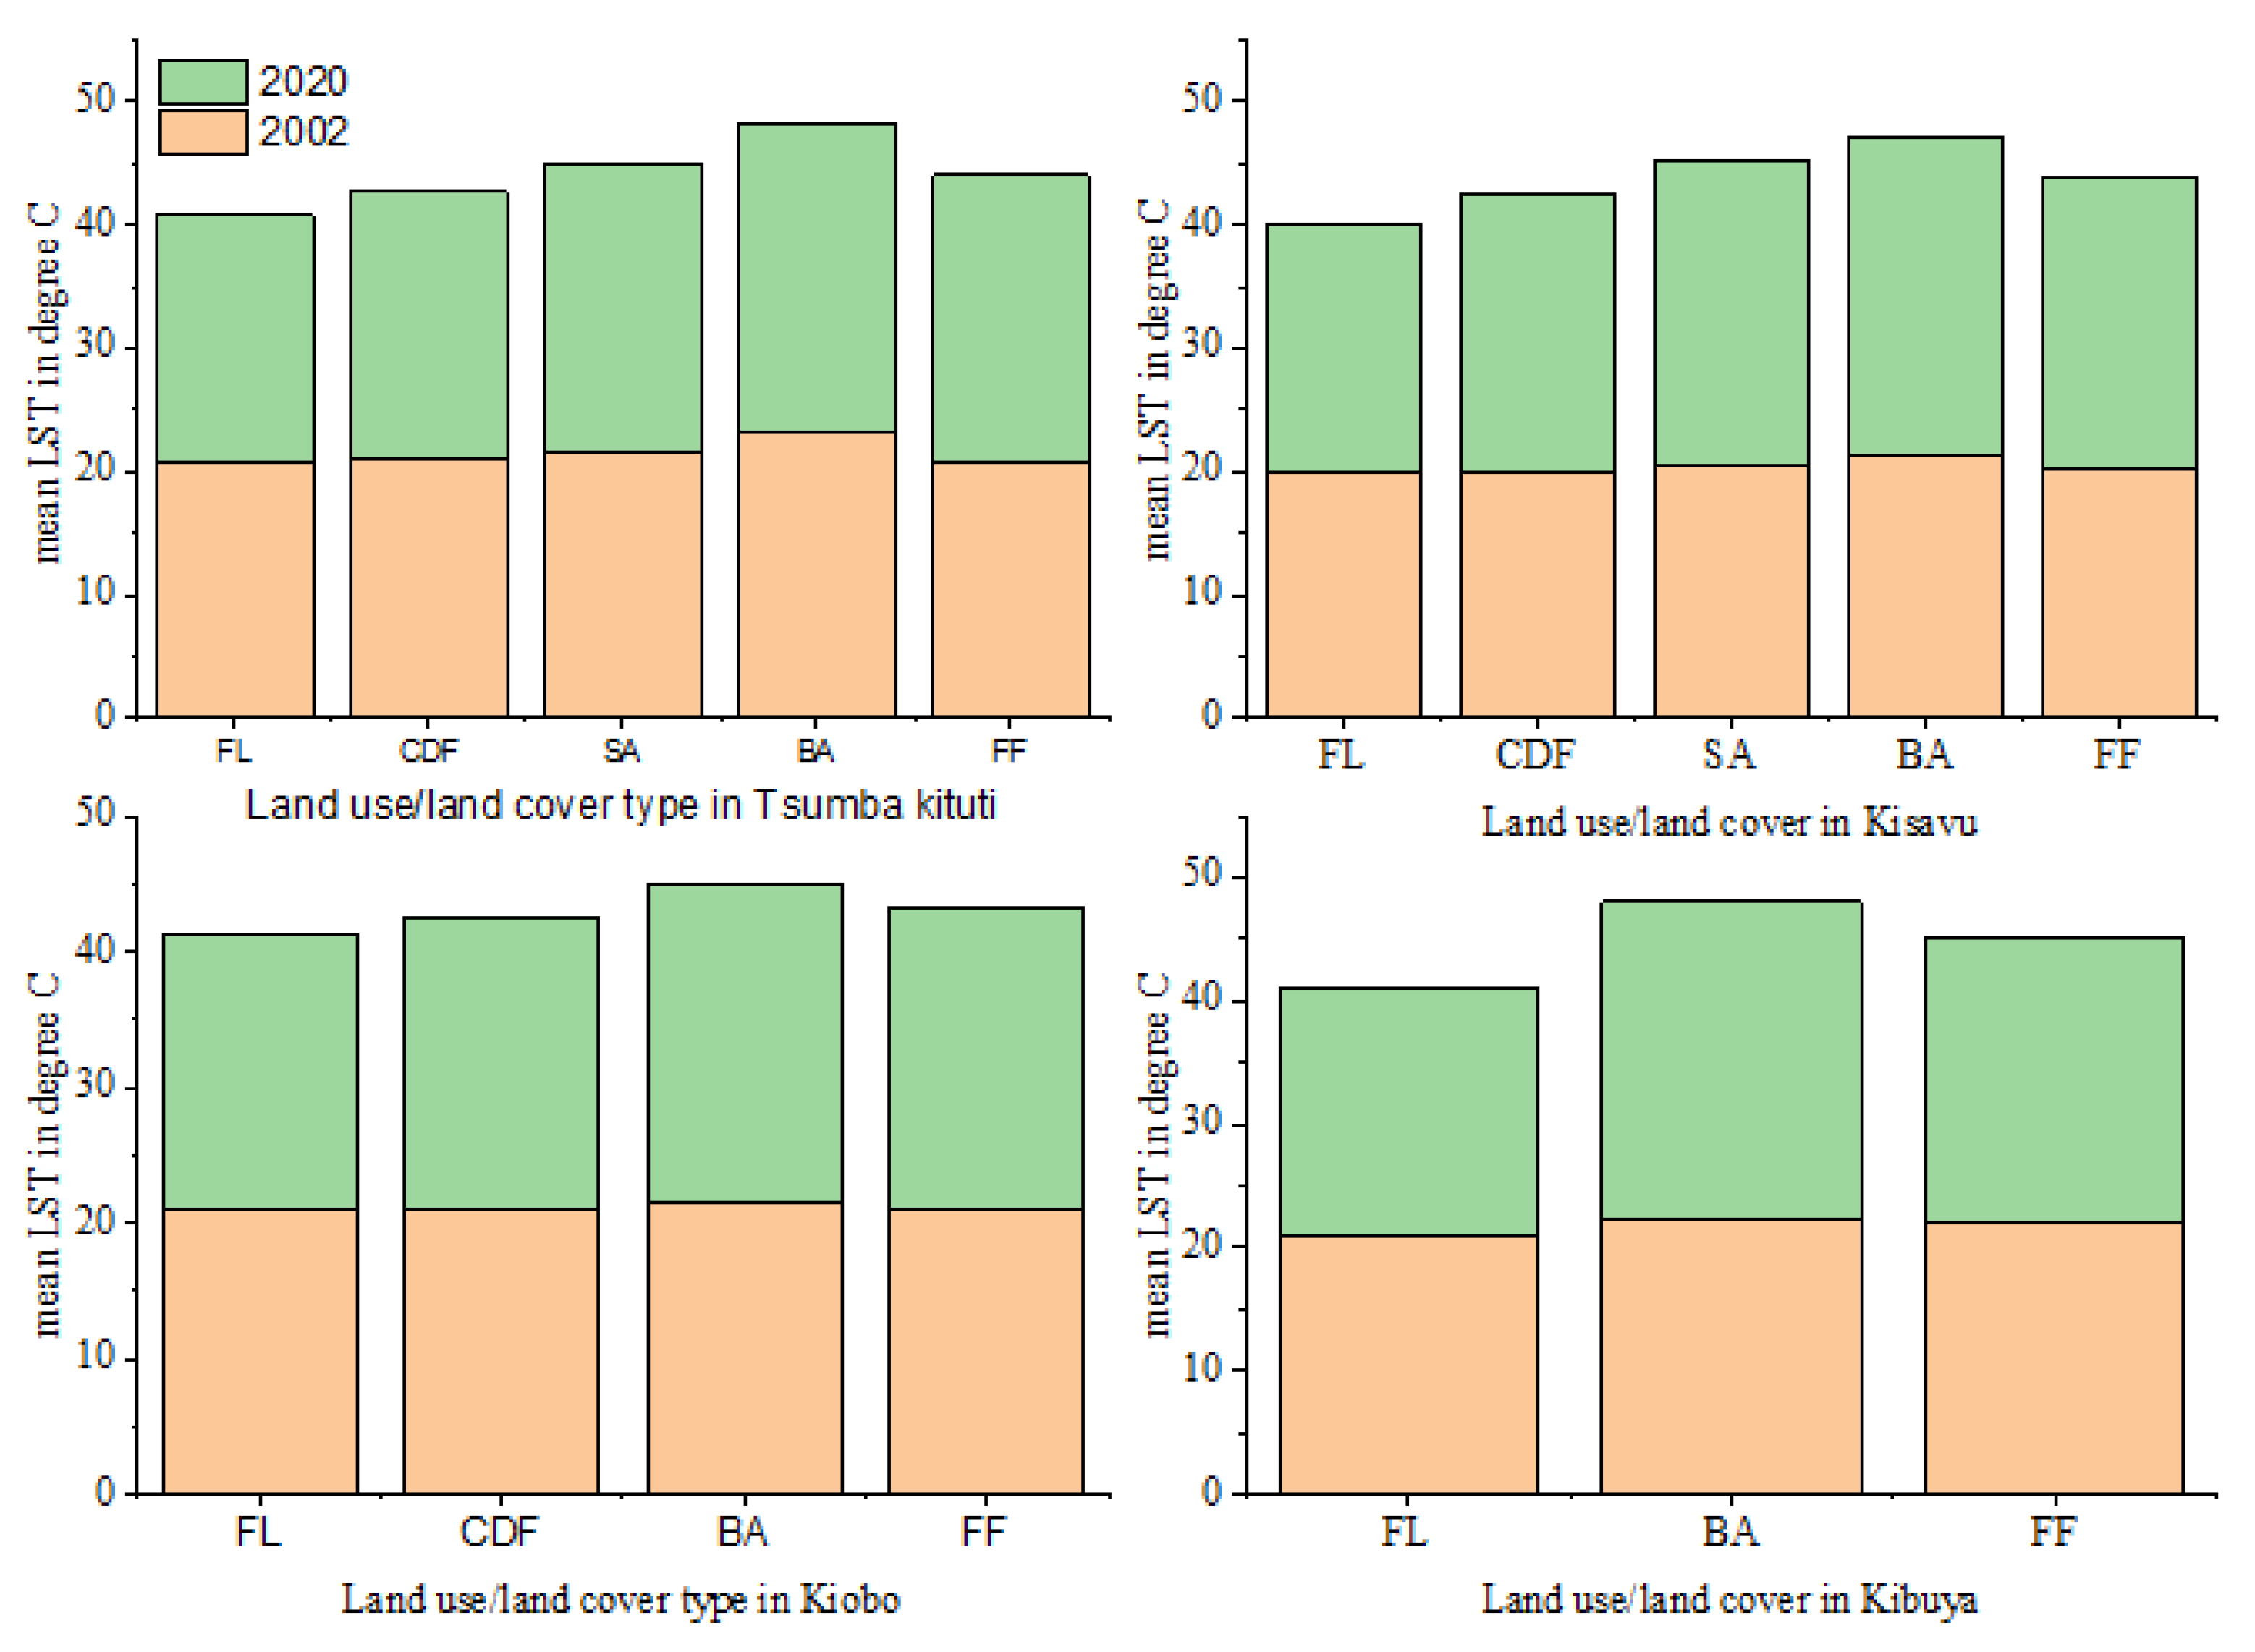
3.3. Variations of LSTs for Different Land Covers

Figure 8 illustrates the mean LST for different land-use/land-cover types for 2002 and 2020. Given the variation in reflectance properties related to each land-use/land-cover type, there was observed variation in the mean LST value for different land cover types. The spatial structure of each land-use/land-cover type was also not homogeneous. Thus, it was expected that different LST values represented different parts of each land-use/land-cover type. In 2002, the highest mean LST value (23.18 °C) was observed in built-up area, while the lowest mean LST was observed in forest land (20.01 °C). In 2020, the highest mean LST value (25.78 °C) was observed in built-up area while the lowest one (20.1 °C) was observed in forest land. From 2002 to 2020, Tsumba kituti, the built-up area exhibited the highest mean LST value (23.18 °C), followed by savannah (21.7 °C), complex of degraded and young secondary forest (20.89 °C), and fallow land and fields (20.8 °C). In 2020, similar trends were observed. However, the fallow land and fields was warmer than the complex of degraded and young secondary forest, and forest land. The increase of mean LST values were estimated at 2.4, 1.94, 1.51 and 0.92 °C for fallow land and fields, built-up area, savannah and complex of degraded and young secondary forest, respectively. Forest land decreased with 0.6 °C. From 2002 to 2020, the increase in mean LST values in Kisavu were estimated at 4.38, 4.15, 3.16 and 2.31 °C for built-up area, savannah, fallow land and fields, and complex of degraded and young secondary, respectively. During the same period in Kiobo, the increase in mean LST values were estimated at 1.83, 0.99 and 0.47 °C for built-up area, fallow land and fields, and complex of degraded and young secondary forest, respectively. Forest land decreased with 0.66 °C. In Kibuya, from 2002 to 2020, the increase in mean LST values were estimated at 3.31 and 1.23 °C, for built-up area and fallow land and field, respectively. Forest land decreased with 0.58 °C. The highest mean LST values in 2002 and 2020 were observed in built-up area (Figure 8). Our findings are consistent with previous studies [45,82,83,84].
Traore [85] and Ahmed [86], observed the highest mean LST values in built-up area, in Bangui and Dhaka cities, respectively. In addition, the low increase in vegetation coverage (forest land) can be related to the absorption of solar radiation by leaves and canopy, leading to the temperature regulation of the proximate environment. Our results were in line with previous findings [87,88]. It is worth noting that, the conversion of natural landscape to artificial land-use as result of rapid urbanization increases the LST [16,19,20,21,80].

3.4. Variation of LST Changes in Converted Land-Use/Land-Cover Areas

Table 3 illustrates LST values in different land-use/land-cover classes newly converted during the period under study (2002–2020). It was revealed that LST values increased in all newly converted areas. In all the villages, areas newly converted into built-up and farmland exhibited high increase in LST values compared to other land-use/land-cover classes. In Tsumba kituti, the increase in mean LST values was estimated at 3.13, 3.62 and 3.12 °C, from the conversion into built-up areas from forest lands, complex of degraded and young secondary forest, and farmland, respectively. The conversion of forest lands and complex of degraded and young secondary forest into farmland resulted in an increase in LST values by 2.43 °C and 2.2 °C, respectively. In Kisavu, transformation of forest land into built-up area resulted to an increase in mean LST by 3.25 °C, while the transformation of complex of degraded and young secondary forest into the built-up area increase in mean LST by 2.91°C. Transformation of complex of degraded and young secondary forest into farmland, forest land into built-up areas, and forest land into farmland increased the mean LST by 2.17, 3.86 and 3.07 °C, respectively. In Kiobo, mean LST increased by 2.23 °C by transforming forest land into built-up area, 1.99 °C by transforming farmland into the built-up area, 1.1 °C by transforming forest land into farmland, and 1.18 °C by transforming complex of degraded and young secondary forest into farmland. In Kibuya, transforming farmland into built-up areas, and forest land into built-up areas increased the mean LST by 2.74 and 3.6 °C, respectively. The increase in the mean LST values in areas newly converted to built-up and farmland confirms that the increase of LST in the villages of Luki results from the increase in bare land and imperviousness of soils.

4. Discussions

4.1. Spatiotemporal Distribution of LST and its Variations with LULC Types

The present study was aimed at examining the land-use/land-cover change and its effects on the variation of the land-surface temperature in the villages within the Luki Biosphere Reserve for the years 2002 and 2020. The increasing trend of built-up areas and decreasing trend of forest land were revealed, and this was in line with previous findings from the region [1]. Indeed, built-up area increased by 25.3, 3.7, 2.5 and 7.5 hectares for Tsumba kituti, Kiobo, Kibuya and Kisavu, respectively. On the other hand, forest land decreased by 49.9, 27, 5.4 and 157.7 hectares for Tsumba kituti, Kiobo, Kibuya and Kisavu, respectively. Fallow land and fields increased in all the villages during the period under study, while the complex degraded and young secondary forest decreased in Tsumba kituti and Kiobo, increasing in Kisavu. These dramatic changes experienced in the four villages were induced by anthropogenic pressures, especially urbanization, agriculture and forest resources utilization [1]. In each village, large amount of forest lands were converted into built-up areas or fallow land and fields to establish settlement, houses and farmland. Additionally, the expansion of built-up and farmland was attributed to population growth in the villages within and around the Luki Biosphere Reserve [1]. In order to meet the demand of housing for the growing population, extensive built-up expansion has happened with dramatic impacts on natural resources as a result of over-exploitation. This expansion of built-up area did not occur equally in the four villages, and the high expansion rate was observed in villages located near the national road (i.e., Tsumba kituti and Kisavu). The expansion of built-up area, converted from other land-use/land-cover classes, has led to the increase of the land-surface temperature in the four villages. This could be due to the increase of impervious areas, which are known for their capacity to store solar heat during the day, resulting in the overall increase of the land-surface temperature. A previous study conducted by Pal and Ziaul [84] reported similar trend in the change of land use/land cover on the shifting of heat zone from lower to a higher rate in English Bazar urban center, west Bengal, India. Indeed, the built-up expansion has been found to play a key role in the increase of the land-surface temperature in the four villages. Based on the spatial distribution of LST, it was found that high temperature corresponded to built-up areas. The increase of LST in newly grown built-up was higher than the other land use categories.
The effect of land-use/land-cover change on land-surface temperature has been addressed on the previous sections. However, the impact of climate change was also taken into account. The present research revealed that that the minimum, mean and maximum land-surface temperature progressively increased in the four villages, from 2002 to 2020 (Figure 6). In Tsumba kituti, the minimum LST value decreased with 0.26 °C from 2002 to 2020, while the mean and maximum LST values increased by 4.84 and 4.03 °C, respectively. In Kisavu, the minimum, mean and maximum temperatures increased by 0.04, 4.85 and 4.74 °C, respectively, from 2002 to 2020. In Kiobo, the minimum LST value decreased by 0.31 °C from 2002 to 2020, while the mean and maximum temperatures increased by 2.81 and 1.49 °C, respectively. In Kibuya, the minimum LST value decreased by 0.63 °C from 2002 to 2020, while the mean and maximum temperatures increased by 2.2 and 3.3 °C, respectively. However, the increasing trend of the land-surface temperature revealed in the present research cannot only be linked to land-use/land-cover change, but could also be linked to climate change; this was, however, beyond the scope of this study. These findings show that the increase of land-surface temperature in these villages was mainly caused by the changes in land cover and possibly climate change.

4.2. Impact of Land-Use/Land-Cover Change, Climate Change and Land-Surface Temperature in the Villages

In the present section, the results of focus discussion groups are briefly presented in order to highlight the perception of local communities on the impacts of land-use/land-cover change and temperature changes in the villages over the last 20 years.

Perception of Local Communities on the Impact of Land-Use/Land-Cover Change and Climate Change in the Region

In the present research, focus-group discussions were conducted to collect the perception of local communities regarding the impact of land-use/land-cover change on temperature, soil erosion, biodiversity, forest lands, and water resources (Figure 9). The 200 respondents made their choices from a wide range of possibilities, from very low to very high, for each question related to the potential impact of land-use/land-cover change as aforementioned. The results from the discussion groups reveal that land-use/land-cover change significantly increases temperature (86% very high), transforms forest lands into settlements and agriculture land (96% very high), reduces water-body surface (85% very high) and leads to the increase in surface runoff and soil erosion (71% very high). Additionally, land-use/land-cover change causes biodiversity loss (97% very high) due to the destruction or fragmentation of habitats. Based on these results, it is possible to validate observations acquired from satellite images that revealed dramatic land-use/land-cover change in the region. The conversion of forest lands to built-up and farmland leads to the increase of land-surface temperature due to the appearance of impervious surfaces.
On the other hand, a series of questions were asked to the local communities, regarding the impact of climate change on seasonal variations, agricultural production, frequency and intensity of precipitation, biodiversity loss and human health (Figure 10). The respondents chose among the different options offered to them, ranging from very less to very high, for each question related to the impact of climate change as abovementioned. There was significant seasonal variation (91% very high) and the change in the frequency and intensity of precipitation (92%), leading to the reduction of crop production (91% very high). This situation compromises food security and causes an increase in malnutrition and outbreaks of epidemic diseases in the region. Moreover, climate change increases the risk of some infectious diseases (89% very high) in the Luki region, including diseases that occur in hot areas and are transmitted by mosquitoes and other insects. This includes malaria, a disease that is very common in the region. Finally, the majority of respondents reported a significant reduction of biodiversity (93% very high). These results were consistent with those obtained from satellite image processing, which revealed a significant increase in temperature and the reduction in forest land and biodiversity due to climate change, and the conversion of forest lands into built-up area and farmland.
In conclusion, the summary of the findings from the present study is outlined as follows:
  • The present study revealed a major growth of built-up area in all the four villages, which was transformed from forest land, complex degraded and young secondary forest, fallow land and fields, and savannah.
  • The highest and lowest land-surface temperature in built-up area and forest land, respectively, were determined for all the years under study. The spatial mean LST significantly increased by 2.28, 1.67, 1.49 and 0.93 °C for the Tsumba kituti, Kisavu, Kiobo and Kibuya villages, respectively.
  • Continuous increase in the land-surface temperature was observed in all the land-use/land-cover categories over the years, except for the forest land class. This indicates the effect of the microclimate warming in the four villages. On the other hand, correlation analysis illustrates the gradual increase of land-surface temperature with the increase of built-up area.
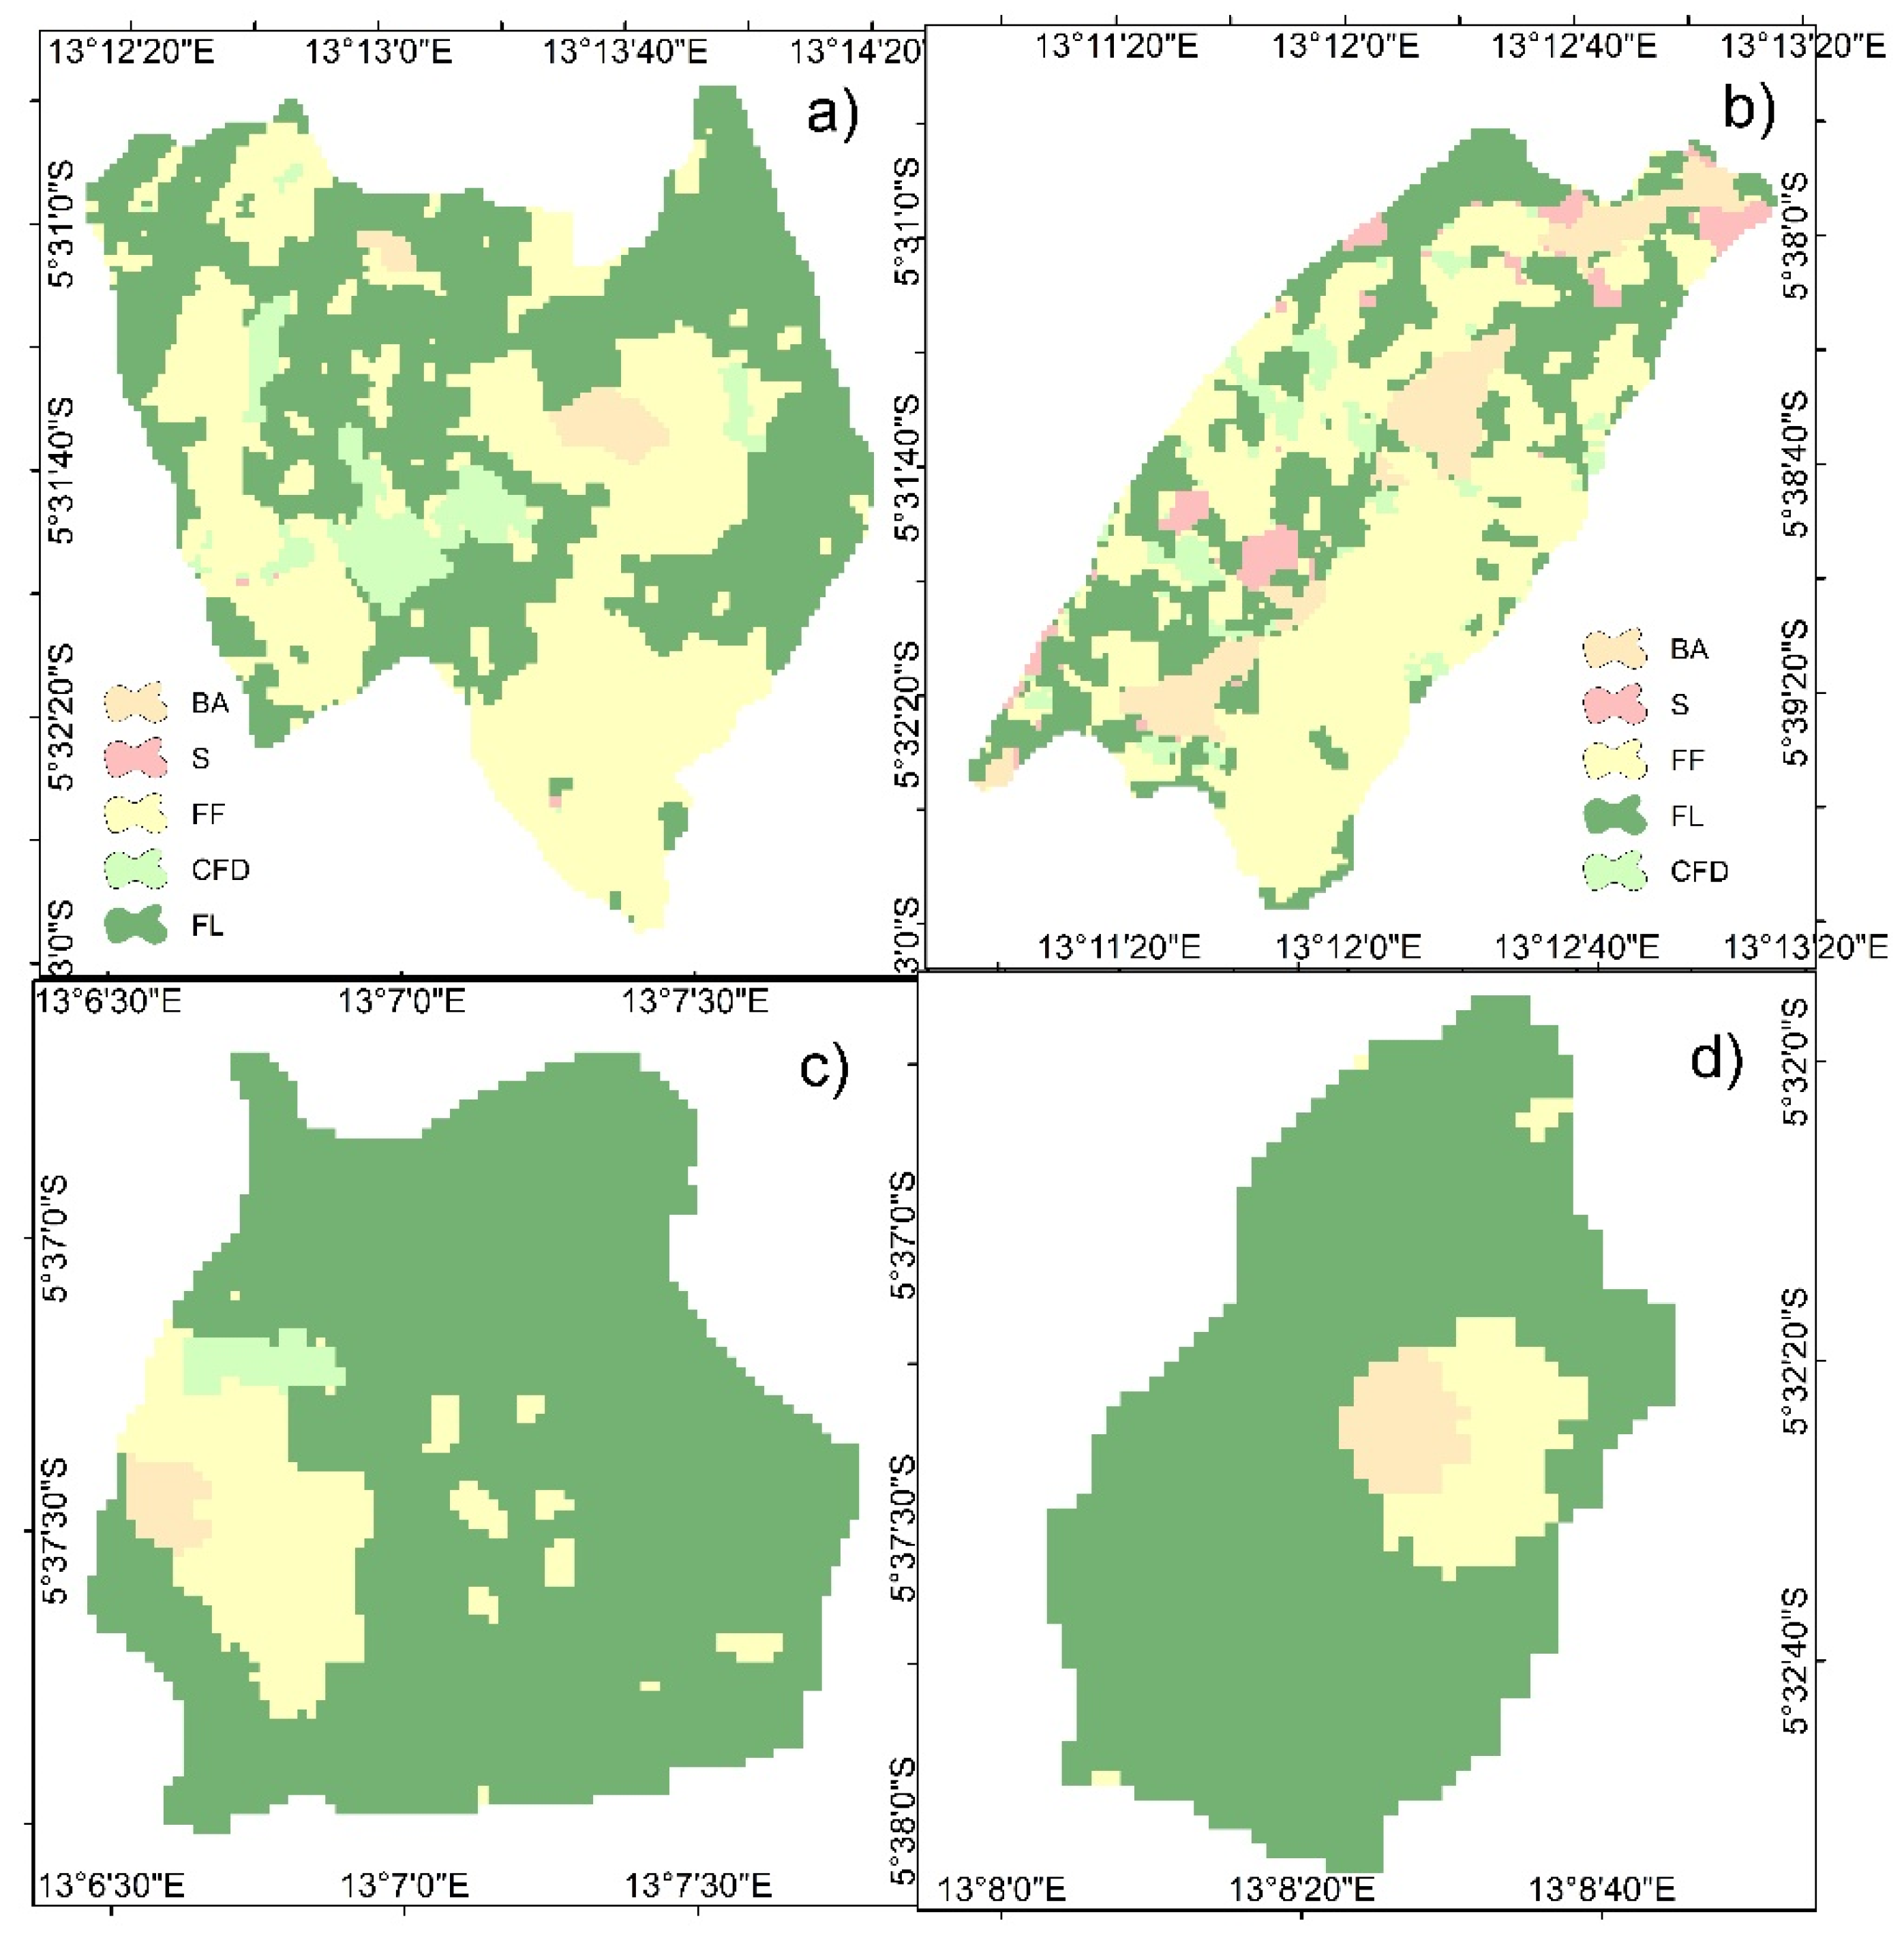
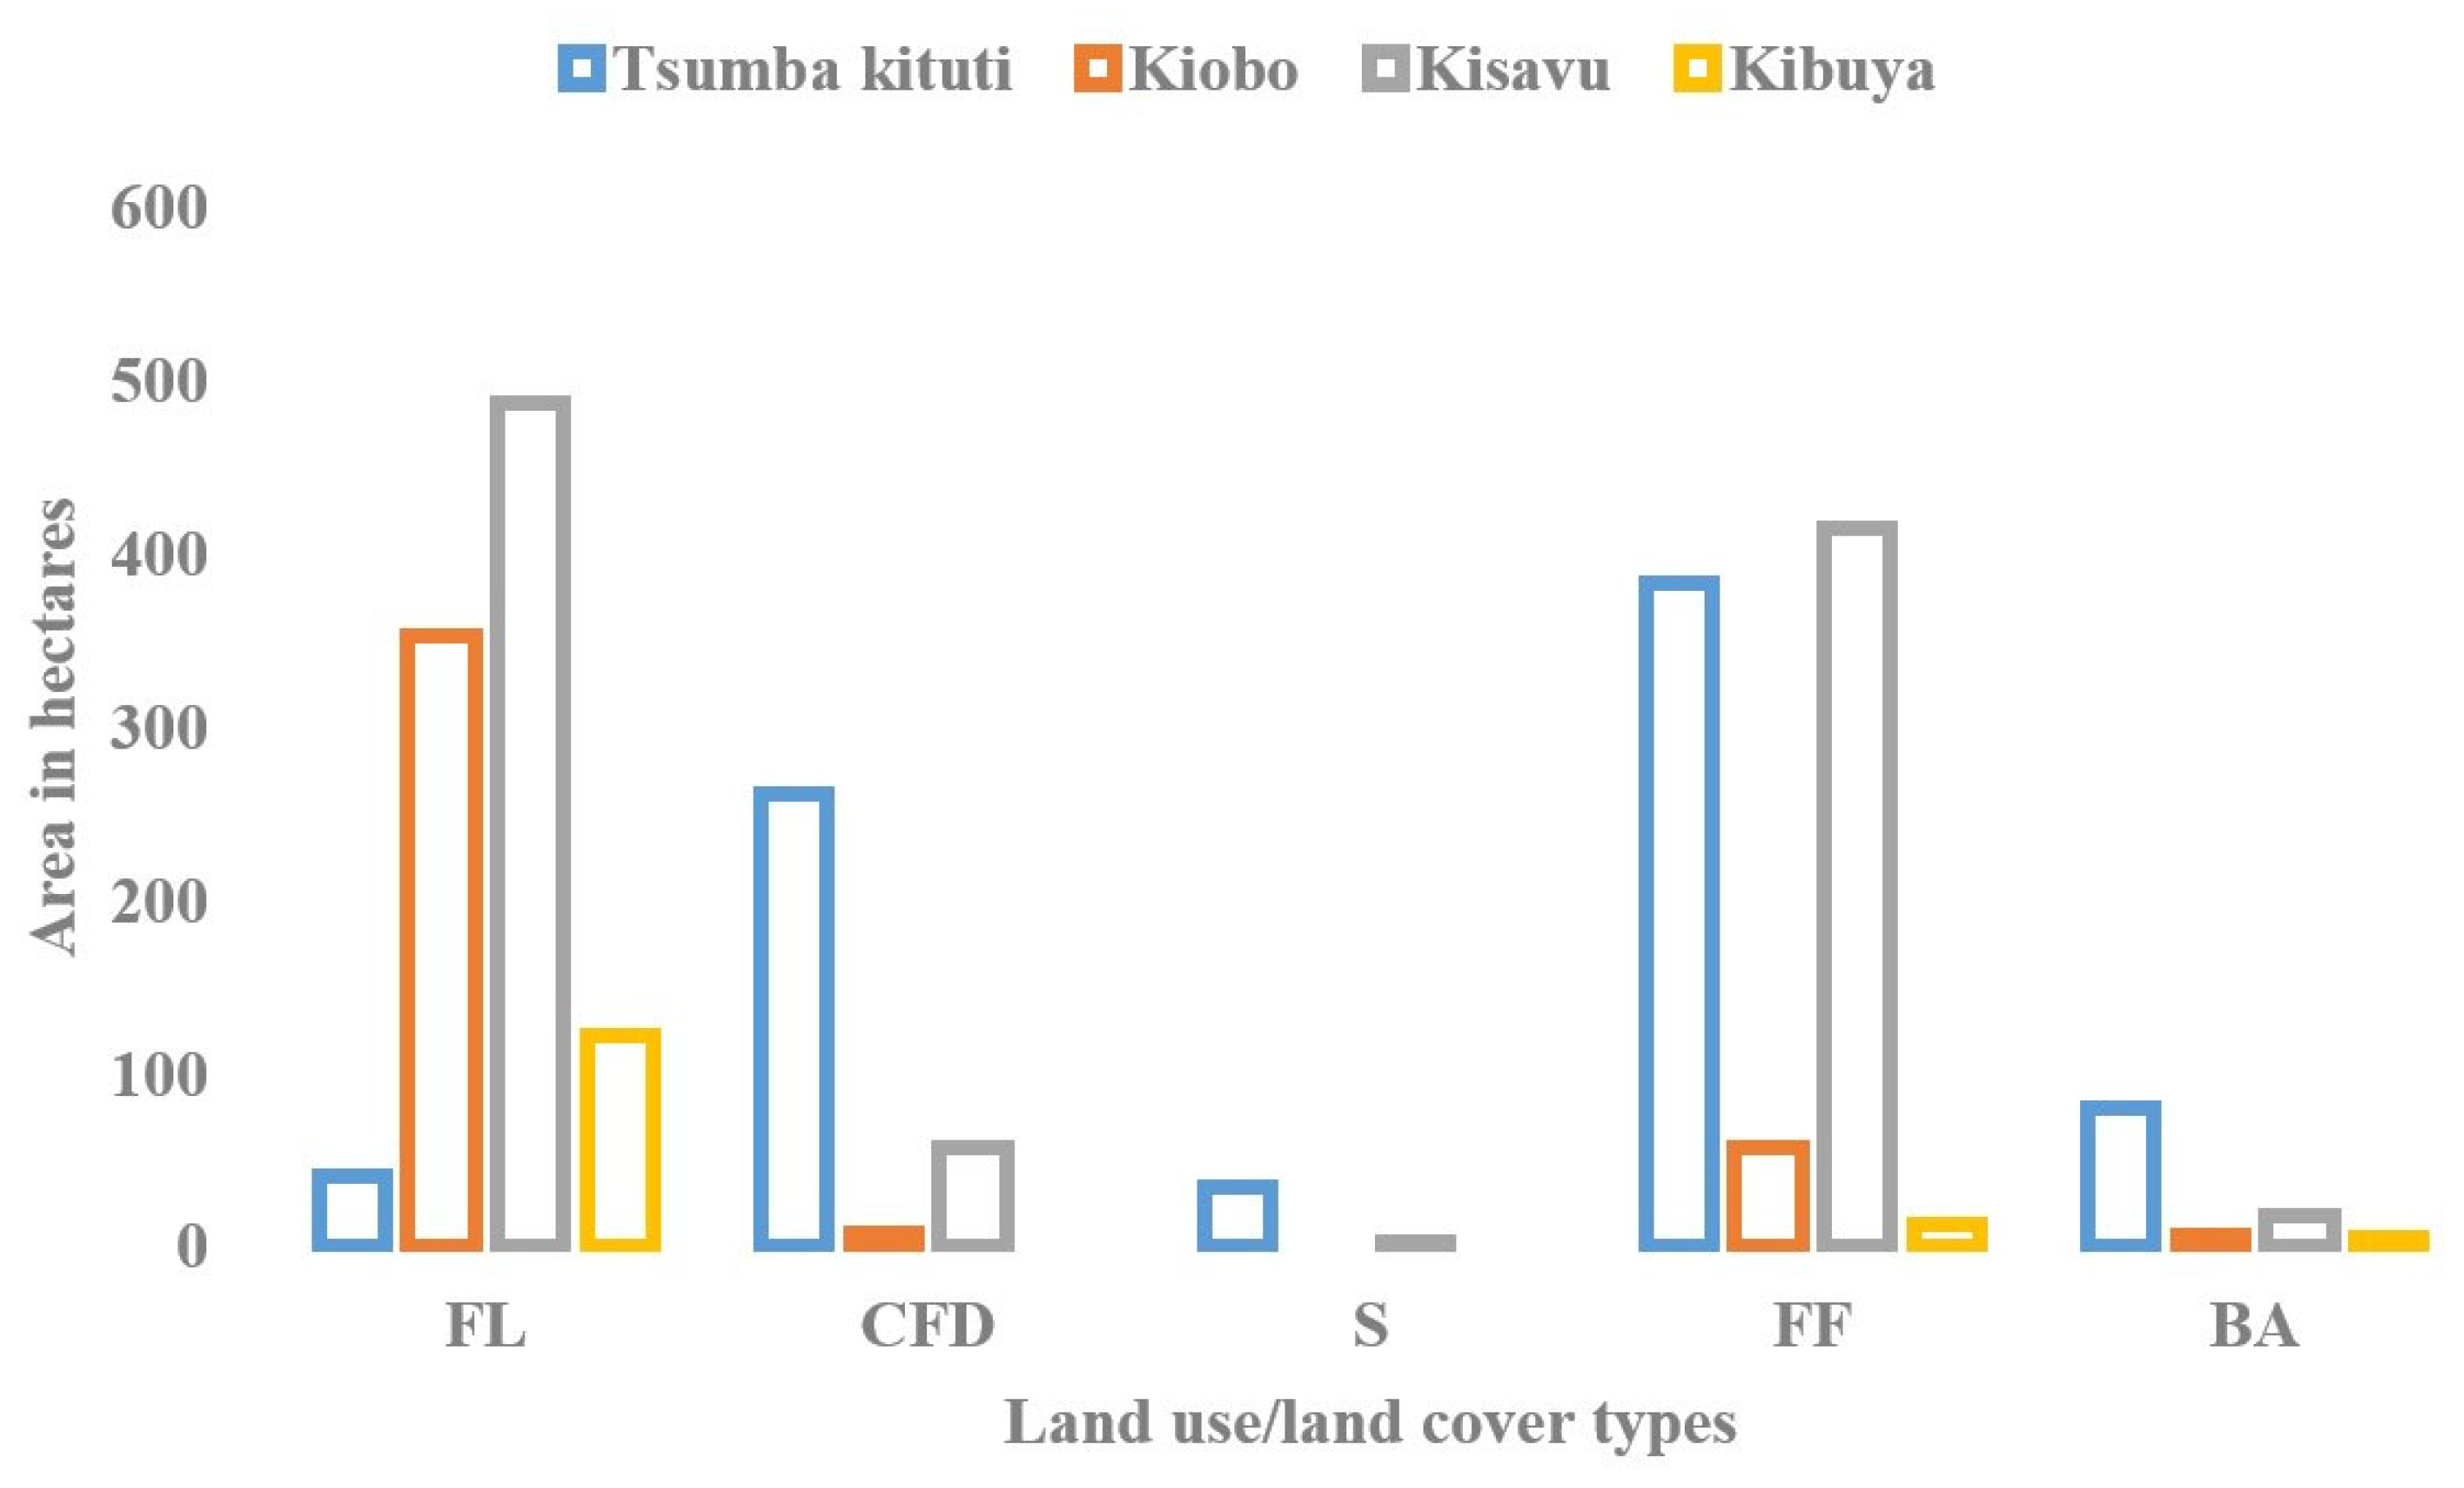
  • Changes in land use/land cover will continue to be experienced in all the villages (Figure 11 and Figure 12). In Tsumba kituti, the complex of degraded and young secondary forest, forest land and savannah will continue to decrease with 40.8, 36.94 and 16.3 hectares, respectively. Fallow land and field, built-up area will increase with 77.3 and 19.2 hectares, respectively. In Kiobo, forest land will continue to decrease with 19.74 hectares. Additionally, there will be an increase of 23.04, 1.65 and 0.49 hectares for fallow land and fields, complex of degraded and young secondary forest, and built-up area, respectively. In Kisavu, fallow land and fields, built-up area, complex of degraded and young secondary forest will experience an increase of 70.61, 5.54 and 10.63 hectares, respectively. The forest land will decrease by 85.28 hectares. Finally, in Kibuya, built-up and fallow land and fields will experience an increase of 0.75 and 4.04 hectares, respectively; while the forest land will decrease by 4.2 hectares. Consequently, this will impact the variation of land-surface temperature in the future.
  • Land-use/land-cover change and climate-change-impacted land-surface temperature in the four villages. According to the perception of local communities, these changes can cause different environmental issues such as biodiversity loss, soil erosion, change in frequency and intensity of precipitation, seasonal variation and increase in temperature. Additionally, this change negatively impacts human health and crop production in the region.

5. Conclusions

The degradation of natural land-cover types has been found to influence climate change in many cities and counties. Major changes in land-use/land-cover type impacts the land-surface temperature all over the world. Thus, monitoring land-use/land-cover change is important to better understand the land-surface temperature variation. Remote-sensing and geoinformational techniques were used to examine the change in land-use/land-cover and its impact in the variation of land-surface temperature. Moreover, focus-group discussions with local communities were applied to understand the perception of local communities towards the drivers of climate change in the villages. The study results revealed tremendous changes in land-use/land-cover in the four villages from 2002 to 2020, principally the expansion of fallow land and fields and built-up areas, and the decline in forest land and complex of degraded and young secondary forest. The present study found an increase in the mean LST values for all villages from 2002 to 2020. Tsumba kituti presented the highest mean LST (25.12 °C), followed by Kisavu (24.87 °C), Kibuya (23.31 °C) and Kiobo (21.82 °C). From 2002 to 2020, the mean LST of built-up areas increased from 23.18 to 25.12 °C, 21.55 to 23.38 °C, 21.4 to 25.78 °C and 22.31 to 25.62 °C in Tsumba kituti, Kiobo, Kisavu and Kibuya, respectively. Besides this, the mean LST of fallow land increased from 20.8 to 23.2 °C, 21.13 to 22.12 °C, 21.89 to 23.12 °C and 20.31 to 23.47 °C in Tsumba, Kiobo, Kibuya and Kisavu, respectively. These findings revealed that the highest mean LST values were observed in the built-up area and fallow land. In addition, the transformation of all land-use/land-cover types into built-up areas in all the villages led to the highest values of LST. Results provided by focus-group discussions with local communities showed that land-use/land-cover change is the main cause of the increase in LST. The majority of respondents (86%) revealed that heat waves are among the most important drivers of adverse climate change in the villages. However, the prediction results found that the farmland and built-up area will still increase within all the villages, while the forest land will decline. As for the complex of secondary and degraded forest, it will decrease in Tsumba kituti, while, in Kiobo and Kisavu, it is expected to increase. Therefore, to mitigate the effects of land-use/land-cover change on land-surface temperature, decision-makers should implement sustainable management strategies.

Author Contributions

Conceptualization, method development and writing: M.O.O., W.F., Y.Y. and C.K.S.K.; visualization and data processing: M.O.O. and C.C.; investigation, resources and writing: T.L. and M.O.O. All authors have read and agreed to the published version of the manuscript.

Funding

This study was supported by The Fundamental Research Funds for the Central Universities (2572019CP12).

Institutional Review Board Statement

Not applicable.

Informed Consent Statement

Not applicable.

Data Availability Statement

Not applicable.

Conflicts of Interest

The authors declare no conflict of interest.

References

  1. Opelele, O.M.; Ying, Y.; Wenyi, F.; Chen, C.; Kachaka, S.K. Examining Land Use/Land Cover Change and Its Prediction Based on a Multilayer Perceptron Markov Approach in the Luki Biosphere Reserve, Democratic Republic of Congo. Sustainability 2021, 13, 6898. [Google Scholar] [CrossRef]
  2. Opelele, O.M.; Fan, W.; Yu, Y.; Kachaka, S.K. Analysis of Land Use/Land Cover Change and its Prediction in the Mambasa Sector, Democratic Republic of Congo. Appl. Ecol. Environ. Res. 2020, 18, 5627–5644. [Google Scholar] [CrossRef]
  3. Al Kafy, A.; Abdullah-Al, F.; Al Rakib, A.; Abdullah Al, R.; Shaleha, K.A.; Zullyadini, A.R.; Dewan, A.J.; Gangaraju, S.; Opelele, O.M.; Abhishek, B. The operational role of remote sensing in assessing and predicting land use/land cover and seasonal land surface temperature using machine learning algorithms in Rajshahi, Bangladesh. Appl. Geomat 2021. [Google Scholar] [CrossRef]
  4. Chen, X.L.; Zhao, H.; Li, P.; Yin, Z. Remote sensing image-based analysis of the relationship between urban heat island and land use/cover changes. Remote Sens. Environ. 2006, 104, 133–146. [Google Scholar] [CrossRef]
  5. Lu, Q.; Chang, N.-B.; Joyce, J.; Chen, A.S.; Savic, D.A.; Djordjevic, S.; Fu, G. Exploring the potential climate change impact on urban growth in London by a cellular automata-based Markov chain model, Comput. Environ. Urban Syst. 2018, 68, 121–132. [Google Scholar] [CrossRef]
  6. Sun, C.; Wu, Z.; Lv, Z.; Yao, N.; Wei, J. Quantifying different types of urban growth and the change dynamic in Guangzhou using multi-temporal remote sensing data. Int. J. Appl. Earth Obs. Geoinf. 2013, 21, 409–417. [Google Scholar] [CrossRef]
  7. Seto, K.C.; Fragkias, M.; Guneralp, B.; Reilly, M.K. A meta-analysis of global urban land expansion. PLoS ONE 2011, 6, e23777. [Google Scholar] [CrossRef]
  8. Rajeshwari, A.; Mani, N.D. Estimation of land surface temperature of dindigul district using landsat 8 data. Int. J. Res. Eng. Technol. 2014, 3, 122–126. [Google Scholar]
  9. Zhang, R.; Matsushima, K.; Kobayashi, K. Can land use planning help mitigate transport-related carbon emissions? A case of Changzhou. Land Use Policy 2018, 74, 32–40. [Google Scholar] [CrossRef]
  10. Bounoua, L.; Nigro, J.; Zhang, P.; Thome, K.; Lachir, A. Mapping urbanization in the United States from 2001 to 2011. Appl. Geogr. 2018, 90, 123–133. [Google Scholar] [CrossRef]
  11. Lu, Y.; Wu, P.; Ma, X.; Li, X. Detection and prediction of land use/land cover change using spatiotemporal data fusion and the Cellular Automata–Markov model. Environ. Monit. Assess. 2019, 191, 68. [Google Scholar] [CrossRef]
  12. Mumtaz, F.; Tao, Y.; de Leeuw, G.; Zhao, L.; Fan, C.; Elnashar, A.; Bashir, B.; Wang, G.; Li, L.; Naeem, S.; et al. Modeling spatio-temporal land transformation and its associated impacts on land surface temperature (LST). Remote Sens. 2020, 12, 2987. [Google Scholar] [CrossRef]
  13. Wu, K.Y.; Zhang, H. Land use dynamics, built-up land expansion patterns, and driving forces analysis of the fast-growing Hangzhou metropolitan area, eastern China (1978–2008). Appl. Geogr. 2012, 34, 137–145. [Google Scholar] [CrossRef]
  14. Poelmans, L.; Van Rompaey, A. Detecting and modelling spatial patterns of urban sprawl in highly fragmented areas: A case study in the Flanders–Brussels region. Landsc. Urban Plan. 2009, 93, 10–19. [Google Scholar] [CrossRef]
  15. Dubovyk, O.; Sliuzas, R.; Flacke, J. Spatio-temporal modelling of informal settlement development in Sancaktepe district, Istanbul, Turkey. ISPRS J. Photogramm. Remote Sens. 2011, 66, 235–246. [Google Scholar] [CrossRef]
  16. Sisay, D.C.; Oda, T.K. Understanding land surface temperature on rift areas to examine the spatial variation of urban heat island: The case of Hawassa, southern Ethiopia. GeoJournal 2021, 86, 993–1014. [Google Scholar]
  17. Balew, A.; Korme, T. Monitoring land surface temperature in Bahir Dar City and its surrounding using Landsat images. Egypt J. Remote Sens. Space Sci. 2020, 23, 371–386. [Google Scholar] [CrossRef]
  18. Abdullahi, S.; Pradhan, B. Land use change modeling and the effect of compact city paradigms: Integration of GIS-based cellular automata and weights-of-evidence techniques. Environ. Earth Sci. 2018, 77, 251. [Google Scholar] [CrossRef]
  19. Dissanayake, D.; Morimoto, T.; Murayama, Y.; Ranagalage, M. Impact of landscape structure on the variation of land surface temperature in subsaharan region: A case study of Addis Ababa using Landsat data (1986–2016). Sustainability 2019, 11, 2257. [Google Scholar] [CrossRef] [Green Version]
  20. Ranagalage, M.; Murayama, Y.; Dissanayake, D.; Simwanda, M. The impacts of landscape changes on annual mean land surface temperature in the tropical mountain city of Sri Lanka: A case study of Nuwara Eliya (1996–2017). Sustainability 2019, 11, 5517. [Google Scholar] [CrossRef] [Green Version]
  21. Simwanda, M.; Ranagalage, M.; Estoque, R.C.; Murayama, Y. Spatial analysis of surface urban heat islands in four rapidly growing African cities. Remote Sens. 2019, 11, 1645. [Google Scholar] [CrossRef] [Green Version]
  22. Mitchell, L.; Moss, H.O.N. Urban Mobility in the 1st Century. 2012. Available online: https://wagner.nyu.edu/files/rudincenter/NYU-BMWi-Project_Urban_Mobility_Report_November_2012.pdf (accessed on 10 September 2021).
  23. Moghadam, H.S.; Helbich, M. Spatiotemporal urbanization processes in the megacity of Mumbai, India: A Markov chains-cellular automata urban growth model. Appl. Geogr. 2013, 40, 140–149. [Google Scholar] [CrossRef]
  24. Alemu, B.; Garedew, E.; Eshetu, Z.; Kassa, H. Land use and land cover changes and associated driving forces in north western lowlands of Ethiopia. Int. Res. J. Agric. Sci. Soil Sci. 2015, 5, 28–44. [Google Scholar]
  25. Dewan, A.M.; Yamaguchi, Y. Using remote sensing and GIS to detect and monitor land use and land cover change in Dhaka Metropolitan of Bangladesh during 1960–2005. Environ. Monit. Assess. 2009, 150, 237. [Google Scholar] [CrossRef] [PubMed]
  26. Thapa, R.B.; Murayama, Y. Scenario based urban growth allocation in Kathmandu Valley, Nepal. Landsc. Urban Plan. 2012, 105, 140–148. [Google Scholar] [CrossRef]
  27. Song, X.P.; Hansen, M.C.; Stehman, S.V.; Potapov, P.V.; Tyukavina, A.; Vermote, E.F.; Townshend, J.R. Global land change from 1982 to 2016. Nature 2018, 560, 639–643. [Google Scholar] [CrossRef]
  28. Han, H.; Yang, C.; Song, J. Scenario simulation and the prediction of land use and land cover change in Beijing, China. Sustainability 2015, 7, 4260–4279. [Google Scholar] [CrossRef] [Green Version]
  29. Wu, Q.; Hong-qing, L.; Ru-song, W.; Juergen, P.; Yang, H.; Min, W.; Bi-hui, W.; Zhen, W. Monitoring and predicting land use change in Beijing using remote sensing and GIS. Landsc. Urban Plan. 2006, 78, 322–333. [Google Scholar] [CrossRef]
  30. Zhuravleva, I.; Turubanova, S.; Potapov, P.; Hansen, M.; Tyukavina, A.; Minnemeyer, S.; Lapotre, N.; Goetz, S.; Verbelen, F.; Thies, C. Satellite-based primary forest degradation assessment in the Democratic Republic of the Congo, 2000-2010. Environ. Res. Lett. 2013, 8, 024034. [Google Scholar] [CrossRef] [Green Version]
  31. Potapov, P.; Turubanova, S.; Hansen, M.; Adusei, B.; Broich, M.; Altstatt, A.; Mane, L.; Justice, C. Quantifying forest cover loss in Democratic Republic of the Congo 2000-2010, with Landsat ETM+ data. Remote Sens. Environ. 2012, 122, 106–116. [Google Scholar] [CrossRef]
  32. Chen, J.; Du, P.; Wu, C.; Xia, J.; Chanussot, J. Mapping urban land cover of a large area using multiple sensors multiple features. Remote Sens. 2018, 10, 872. [Google Scholar] [CrossRef] [Green Version]
  33. Priyankara, P.; Ranagalage, M.; Dissanayake, D.; Morimoto, T.; Murayama, Y. Spatial process of surface urban heat island in rapidly growing seoul metropolitan area for sustainable urban planning using landsat data (1996–2017). Climate 2019, 7, 110. [Google Scholar] [CrossRef] [Green Version]
  34. Angoboy Ilondea, B.; Beeckman, H.; Ouédraogo, D.Y.; Bourland, N.; De Mil, T.; Van Den Bulcke, J.; Van Acker, J.; Couralet, C.; Ewango, C.; Hubau, W.; et al. Une forte saisonnalité du climat et de la phénologie reproductive dans la forêt du Mayombe: L’apport des données historiques de la Réserve de Luki en République démocratique du Congo. Bois Des. Trop. 2019, 341, 39–53. [Google Scholar] [CrossRef] [Green Version]
  35. Lubini, A. La végétation de la Réserve de Biosphère de Luki au Mayombe (RD Congo). Opera Botanica Belgica 1997, 10, 155. [Google Scholar]
  36. Lubalega, T.K.; Mananga, P.M. Évaluation de la biodiversité spécifique ligneuse des cultures agricoles sous couvert arboré à Patu, dans le Mayombe, en République Démocratique du Congo (RDC). CongoSciences 2018, 6, 1–8. [Google Scholar]
  37. Peel, M.C.; Finlayson, B.L.; Mcmahon, T.A. Updated world map of the Köppen–Geiger climate classification. Hydrol. Earth Syst. Sci. 2007, 11, 1633–1644. [Google Scholar] [CrossRef] [Green Version]
  38. Sénéchal, J.; Kabala, M.; Fournier, F. Revue des Connaissances sur le Mayombe; Unesco: Paris, France, 1989. [Google Scholar]
  39. Qin, Z.; Karnieli, A.; Berliner, P. A mono-window algorithm for retrieving land surface temperature from Landsat TM data and its application to the Israel-Egypt border region. Int. J. Remote Sens. 2001, 21, 3719–3746. [Google Scholar] [CrossRef]
  40. Jiménez-Muñoz, J.C.; Sobrino, J.A. A generalized single-channel method for retrieving land surface temperature from remote sensing data. J. Geophys. Res. 2003, 108. [Google Scholar] [CrossRef] [Green Version]
  41. Asmala, A. Analysis of maximum likelihood classification on multispectral data. Appl. Math. Sci. 2012, 6, 6425–6436. [Google Scholar]
  42. Sekertekin, A.; Kutoglu, S.H.; Kaya, S. Evaluation of spatio-temporal variability in land surface temperature: A case study of Zonguldak, Turkey. Environ. Monit. Assess. 2016, 188, 30. [Google Scholar] [CrossRef]
  43. Bhalli, M.N.; Ghaffar, A.; Shirazi, S.A.; Parveen, N.; Anwar, M.M. Change detection analysis of land use by using geospatial techniques: A case study of Faisalabad-Pakistan. Sci. Int. 2012, 24, 539–546. [Google Scholar]
  44. White, R.; Engelen, G. High-resolution integrated modelling of the spatial dynamics of urban and regional systems. Comput. Environ. Urban Syst 2000, 24, 383–400. [Google Scholar] [CrossRef] [Green Version]
  45. Ward, D.P.; Murray, A.T.; Phinn, S.R. A stochastically constrained cellular model of urban growth, Comput. Environ. Urban Syst 2000, 24, 539–558. [Google Scholar] [CrossRef]
  46. Yuan, F. Urban growth monitoring and projection using remote sensing and geographic information systems: A case study in the twin cities metropolitan area, Minnesota. Geocarto Int. 2009, 25, 213–230. [Google Scholar] [CrossRef]
  47. Clarke, K.C.; Gaydos, L.J. Loose-coupling a cellular automaton model and GIS: Long-term urban growth prediction for San Francisco and Washington/Baltimore. Int. J. Geogr. Inf. Sci. 1998, 12, 699–714. [Google Scholar] [CrossRef] [PubMed] [Green Version]
  48. Mitsova, D.; Shuster, W.; Wang, X. A cellular automata model of land cover change to integrate urban growth with open space conservation. Landsc. Urban Plan. 2011, 99, 141–153. [Google Scholar] [CrossRef]
  49. Yang, J.; Su, J.; Chen, F.; Xie, P.; Ge, Q. A local land-use competition cellular automata model and its application. ISPRS Int. J. Geo-Inf. 2016, 5, 106. [Google Scholar] [CrossRef] [Green Version]
  50. Batty, M.; Couclelis, H.; Eichen, M. Urban systems as cellular automata. Environ. Plan. B 1997, 24, 159–164. [Google Scholar] [CrossRef]
  51. Abubakr, A.A.; Biswajeet, P. Monitoring and predicting land use change in Tripoli Metropolitan City using an integrated Markov chain and cellular automata models in GIS. Arab J. Geosci. 2013. [Google Scholar] [CrossRef]
  52. White, R.; Engelen, G. Cellular automata as the basis of integrated dynamic regional modelling. Environ. Plan. B 1997, 24, 235–246. [Google Scholar] [CrossRef]
  53. Wang, S.Q.; Zheng, X.Q.; Zang, X.B. Accuracy assessments of land use change simulation based on Markov-cellular automata model. Procedia Environ. Sci. 2012, 13, 1238–1245. [Google Scholar] [CrossRef] [Green Version]
  54. Sui, D.Z.; Zeng, H. Modeling the dynamics of landscape structure in Asia’s emerging desakota regions: A case study in Shenzhen. Landsc. Urban Plan. 2001, 53, 37–52. [Google Scholar] [CrossRef]
  55. Xian, G.; Crane, M. Assessments of urban growth in the Tampa Bay watershed using remote sensing data. Remote Sens. Environ. 2005, 97, 203–215. [Google Scholar] [CrossRef]
  56. Barredo, J.I.; Kasanko, M.; McCormick, N.; Lavalle, C. Modelling dynamic spatial processes: Simulation of urban future scenarios through cellular automata. Landsc. Urban Plan. 2003, 64, 145–160. [Google Scholar] [CrossRef]
  57. He, C.; Okada, N.; Zhang, Q.; Shi, P.; Zhang, J. Modeling urban expansion scenarios by coupling cellular automata model and system dynamic model in Beijing, China. Appl. Geogr. 2006, 26, 323–345. [Google Scholar] [CrossRef]
  58. Wang, F. Land-Cover and Land-Use Study Using Genetic Algorithms, Petri Nets, and Cellular Automata. Ph.D. Thesis, Louisiana State University, Baton Rouge, LA, USA, 2007. [Google Scholar]
  59. Memarian, H.; Kumar Balasundram, S.; Bin Talib, J.; Teh Boon Sung, C.; Mohd Sood, A.; Abbaspour, K. Validation of CA-Markov for simulation of land-use and cover change in the langat basin, Malaysia. J. Geogr. Inf. Syst. 2012, 4, 542–554. [Google Scholar] [CrossRef] [Green Version]
  60. Mishra, V.N.; Rai, P.K.; Mohan, K. Prediction of land use changes based on land change modeler (LCM) using remote sensing: A case study of Muzaffarpur (Bihar), India. J. Geogr. Inst. Jovan Cvijic SASA 2014, 64, 111–127. [Google Scholar] [CrossRef]
  61. Yousheng, W.; Xinxiao, Y.; Kangning, H.; Qingyun, L.; Yousong, Z.; Siming, S. Dynamic simulation of land use change in Jihe watershed based on CA-Markov model. Trans. Chin. Soc. Agric. Eng. 2011, 27, 330–336. [Google Scholar] [CrossRef]
  62. Ma, C.; Zhang, G.Y.; Zhang, X.C.; Zhao, Y.J.; Li, H.Y. Application of Markov model in wetland change dynamics in Tianjin Coastal Area, China. Procedia Environ. Sci. 2012, 13, 252–262. [Google Scholar] [CrossRef] [Green Version]
  63. Sang, L.; Zhang, C.; Yang, J.; Zhu, D.; Yun, W. Simulation of land use spatial pattern of towns and villages based on CA–Markov model. Math. Comput. Model. 2011, 54, 938–943. [Google Scholar] [CrossRef]
  64. Kumar, S.; Radhakrishnan, N.; Mathew, S. Land use change modelling using a Markov model and remote sensing. Geomat. Nat. Hazards Risk 2014, 5, 145–156. [Google Scholar] [CrossRef]
  65. Liu, X.; Li, X.; Yeh, A.G.-O.; He, J.; Tao, J. Discovery of transition rules for geographical cellular automata by using ant colony optimization. Sci. China Ser. D Earth Sci. 2007, 50, 1578–1588. [Google Scholar] [CrossRef]
  66. Qiu, B.; Chen, C. Land use change simulation model based on MCDM and CA and its application. ACTA Geogr. Sin. 2008, 63, 165–174. [Google Scholar]
  67. Yang, X.; Zheng, X.-Q.; Lv, L.-N. A spatiotemporal model of land use change based on ant colony optimization, Markov chain and cellular automata. Ecol. Model. 2012, 233, 11–19. [Google Scholar] [CrossRef]
  68. Guan, D.; Li, H.; Inohae, T.; Su, W.; Nagaie, T.; Hokao, K. Modeling urban land use change by the integration of cellular automaton and Markov model. Ecol. Model. 2011, 222, 3761–3772. [Google Scholar] [CrossRef]
  69. Myint, S.W.; Wang, L. Multicriteria decision approach for land use land cover change using Markov chain analysis and a cellular automata approach. Can. J. Remote Sens 2006, 32, 390–404. [Google Scholar] [CrossRef]
  70. Fan, F.; Wang, Y.; Wang, Z. Temporal and spatial change detecting (1998–2003) and predicting of land use and land cover in Core corridor of Pearl River Delta (China) by using TM and ETM+images. Environ. Monit Assess. 2008, 137, 127–147. [Google Scholar] [CrossRef] [PubMed]
  71. Sun, H.; Forsythe, W.; Waters, N. Modeling urban land use change and urban sprawl: Calgary, Alberta, Canada. Netw. Spat. Econ. 2007, 7, 353–376. [Google Scholar] [CrossRef]
  72. Zhang, Q.; Ban, Y.; Liu, J.; Hu, Y. Simulation and analysis of urban growth scenarios for the Greater Shanghai Area, China. Comput Environ. Urban Syst 2011, 35, 126–139. [Google Scholar] [CrossRef]
  73. López, E.; Bocco, G.; Mendoza, M.; Duhau, E. Predicting land-cover and land-use change in the urban fringe: A case in Morelia city, Mexico. Landsc. Urban Plan. 2001, 55, 271–285. [Google Scholar] [CrossRef]
  74. White, R.; Engelen, G. Cellular automata and fractal urban form: A cellular modelling approach to the evolution of urban land-use patterns. Environ. Plan. A 1993, 25, 1175–1199. [Google Scholar] [CrossRef] [Green Version]
  75. Wu, F. Calibration of stochastic cellular automata: The application to rural–urban land conversions. Int. J. Geogr. Inf. Sci. 2000, 16, 795–818. [Google Scholar] [CrossRef]
  76. Li, X.; Gar-On Yeh, A. Data mining of cellular automata’s transition rules. Int. J. Geogr. Inf. Sci. 2004, 18, 723–744. [Google Scholar] [CrossRef]
  77. Pontius, R.G.; Millones, M. Death to Kappa: Birth of quantity disagreement and allocation disagreement for accuracy assessment. Int. J. Remote Sens. 2011, 32, 4407–4429. [Google Scholar] [CrossRef]
  78. Bayes, A.; Raquib, A. Modeling urban land cover growth dynamics using multioral satellite images: A case study of Dhaka, Bangladesh. ISPRS Int. J. Geo-Inf. 2012, 1, 3–31. [Google Scholar] [CrossRef] [Green Version]
  79. Arsiso, B.K.; Tsidu, G.M.; Gerrit, H.S.; Tadesse, T. Influence of urbanization-driven land use/cover change on climate: The case of Addis Ababa, Ethiopia. Phys. Chem. Earth 2018, 105, 212–223. [Google Scholar] [CrossRef]
  80. Vani, M.; Prasad, P.R.C. Assessment of spatio-temporal changes in land use and land cover, urban sprawl, and land surface temperature in and around Vijayawada city. India. Environ. Dev. Sustain. 2020, 22, 3079–3095. [Google Scholar] [CrossRef]
  81. Qijiao, X.; Zhixiang, Z. Impact of urbanization on urban heat island effect based on TM imagery in Wuhan, China. Environ. Eng. Manag. J. 2015, 14, 647–655. [Google Scholar]
  82. Hu, W.; Zhou, W.; He, H. The effect of land-use intensity on surface temperature in the Dongting lake area, China. Adv. Meteorol. 2015, 2015, 1–11. [Google Scholar] [CrossRef] [Green Version]
  83. Karakuş, C.B. the impact of land use/land cover (LULC) changes on land surface temperature in Sivas city center and its surroundings and assessment of urban heat island. Asia-Pac. J. Atmos. Sci. 2019, 55, 1–16. [Google Scholar] [CrossRef]
  84. Pal, S.; Ziaul, S. Detection of land use and land cover change and land surface temperature in English Bazar urban centre. Egypt. J. Remote Sens. Space Sci. 2017, 20, 125–145. [Google Scholar] [CrossRef] [Green Version]
  85. Traore, M.; Lee, M.S.; Rasul, A.; Balew, A. Assessment of land use/land cover changes and their impacts on land surface temperature in Bangui (the capital of Central African Republic). Environ. Chall. 2021, 4, 100114. [Google Scholar] [CrossRef]
  86. Ahmed, B.; Kamruzzaman, M.D.; Zhu, X.; Shahinoor Rahman, M.D.; Choi, K. Simulating land cover changes and their impacts on land surface temperature in Dhaka, Bangladesh. Remote Sens. 2013, 5, 5969–5998. [Google Scholar] [CrossRef] [Green Version]
  87. Elmes, A.; Rogan, J.; Williams, C.; Ratick, S.; Nowak, D.; Martin, D. Effects of urban tree canopy loss on land surface temperature magnitude and timing. ISPRS J. Photogramm. Remote Sens. 2017, 128, 338–353. [Google Scholar] [CrossRef]
  88. Peng, S.S.; Piao, S.; Zeng, Z.; Ciais, P.; Zhou, L.; Li, L.Z.; Myneni, R.B.; Yin, Y.; Zeng, H. Afforestation in China cools local land surface temperature. Proc. Natl. Acad. Sci. USA 2014, 111, 2915–2919. [Google Scholar] [CrossRef] [PubMed] [Green Version]
Figure 1. Location of the Luki Biosphere Reserve with respective villages: (a) Luki Biosphere Reserve, (b) Luki Biosphere Reserve in the DRC and (c) DRC in Africa.
Sustainability 13 11242 g001
Figure 2. Illustration of the CA model for land-use-change analysis [49].
Sustainability 13 11242 g002
Figure 3. Flowchart of land-use/land-cover prediction based CA–Markov model.
Sustainability 13 11242 g003
Figure 4. Land-use/land-cover area (FL, forest land; CFD, complex of secondary and degraded forest; S, savannah; FF, fallow land and fields; BA, built-up area).
Sustainability 13 11242 g004
Figure 5. Spatiotemporal variation of land use/land cover within the villages ((a) Kisavu, (b) Kibuya, (c) Tsumba kituti and (d) Kiobo).
Sustainability 13 11242 g005
Figure 6. Temporal variation of LST values.
Sustainability 13 11242 g006
Figure 7. Spatiotemporal distribution of LST.
Sustainability 13 11242 g007
Figure 8. Variations of mean LST values with different land-use/land-cover types.
Sustainability 13 11242 g008
Figure 9. Possible impacts of land-use/land-cover change in the four villages: (a) conversion of forest lands into settlement and agricultural land, (b) biodiversity loss, (c) increase in temperature, (d) reduction of water-body surface and (e) increase of surface runoff and soil erosion.
Sustainability 13 11242 g009
Figure 10. Possible impacts of climate change in the four villages: (a) biodiversity loss or reduction, (b) decrease in crop production, (c) effect on human health, (d) change in frequency and intensity of precipitation and (e) seasonal variation and increase in temperature.
Sustainability 13 11242 g010
Figure 11. Predicted map of 2038 ((a) Kisavu, (b) Tsumba kituti, (c) Kiobo and (d) Kibuya) (FL, forest land; CFD, complex of secondary and degraded forest; S, savannah; FF: fallow land and fields; BA, built-up area).
Sustainability 13 11242 g011
Figure 12. Prediction statistics for 2038 (FL, forest land; CFD, complex of secondary and degraded forest; S, savannah; FF, fallow land and fields; BA, built-up area).
Sustainability 13 11242 g012
Table 1. Landsat data description.
Data TypeNamePixel SizeWavelengthDescriptionYear
Landsat 7 ETM+B130 meters0.45–0.52 µmBlue2002
B230 meters0.52–0.60 µmGreen
B330 meters0.63–0.69 µmRed
B430 meters0.77–0.90 µmNear infrared
B530 meters1.55–1.75 µmShortwave infrared 1
B630 meters10.40–12.50 µmLow-gain Thermal Infrared 1
B630 meters10.40–12.50 µmHigh-gain Thermal Infrared 1
B730 meters2.08–2.35 µmShortwave infrared 2
B815 meters0.52–0.90 µmPanchromatic
Landsat 8 OLI/TIRSB130 meters0.43–0.45 µmCoastal aerosol2020 and 2017
B230 meters0.45–0.51 µmBlue
B330 meters0.53–0.59 µmGreen
B430 meters0.64–0.67 µmRed
B530 meters0.85–0.88 µmNear infrared
B630 meters1.57–1.65 µmShortwave infrared 1
B730 meters2.11–2.29 µmShortwave infrared 2
B815 meters0.52–0.90 µmBand 8 Panchromatic
B915 meters1.36–1.38 µmCirrus
B1030 meters10.60–11.19 µmThermal infrared 1
B1130 meters11.50–12.51 µmThermal infrared 2
Table 2. Components of agreement and disagreement.
Name of ComponentCA–Markov Model
Tsumba kitutiKisavuKibuyaKiobo
Persistence simulated correctly96.11%95.8296.6296.91
Change simulated correctly0.81%0.790.891.11
Total agreement96.92%96.6197.51%98.02%
Change simulated as persistence1.72%1.811.411.34
Persistence simulated as change1.33%1.421.060.61
Change simulated as change to incorrect category0.03%0.160.020.03
Total disagreement3.60%3.392.491.98
Table 3. Mean LST change due to the land-use/land-cover change.
Land-Use/Land-Cover TypesMean LST in 2002Mean LST in 2020Change in °C
Tsumba KitutiForest land to built-up area20.924.033.13
Complex secondary and degraded forest to built-up area20.3423.963.62
Complex secondary and degraded forest to fallow land and fields20.9023.12.2
Fallow land to built-up area20.8723.993.12
Forest land to fallow land and fields20.7123.142.43
KisavuForest land to built-up area20.523.753.25
Complex secondary and degraded forest to built-up area20.6123.522.91
Complex secondary and degraded forest to fallow land and fields20.7222.892.17
Fallow land to built-up area20.2324.123.89
Forest land to fallow land and fields20.2123.283.07
KioboFallow land and fields to built-up area21.0423.031.99
Forest land to built-up area20.7522.982.23
Forest land to fallow land and fields20.8421.941.1
Complex secondary and degraded forest to fallow land and fields20.9222.11.18
KibuyaFallow land and fields to built-up area21.9424.682.74
Fallow land and fields to Forest lands21.2921.390.1
Forest land to built-up area20.9724.613.64
Forest land to fallow land and fields21.1121.360.25
Publisher’s Note: MDPI stays neutral with regard to jurisdictional claims in published maps and institutional affiliations.

