Article

Memristive Equivalent Circuit Model for Battery

by
Mazin Mohammed Mogadem
and
Yan Li
*,†,‡
School of Control Science and Engineering, Shandong University, Jinan 250061, China
*
Author to whom correspondence should be addressed.
These authors contributed equally to this work.
Current address: Qianfoshan Campus, School of Control Science and Engineering, 73 Jingshi Road, Jinan 250061, China.
Sustainability 2021, 13(20), 11204; https://doi.org/10.3390/su132011204
Submission received: 31 July 2021 / Revised: 24 September 2021 / Accepted: 27 September 2021 / Published: 11 October 2021

Abstract

:
The design of mathematical models is based on conservation laws and also on the fundamental principles of modeling: structure, parameters, and physical meaning. Those kinds of modeling should have specific capabilities to deal with different working conditions and environments coping with challenges that include but are not limited to battery capacity, life-cycle, or the attempts to manipulate the current profiles during operation. Introducing memristive elements in batteries will be ideal to satisfy these fundamentals and goals of modeling, whereas addressing the recycling and sustainability concerns on the environmental impact by the placement of TiO2 memristor into this model can promote a recovery hierarchy via recycling and dispatching a slight amount to disposal as the previous focus was mainly concentrated on availability. As for battery materials, modeling, performing, and manufacturing all have proliferated to grasp the possible sustainability challenges inherited in these systems. This paper investigated electrochemical impedance spectroscopy to study this model and the dynamic behavior inside the battery. We found a solution to address the existing battery limitations that elucidate the battery degradation without affecting the performance, correspondingly by employing the dampest least-squares combination with nonlinear autoregressive exogenous for identifying such model and its associated parameters because of its embedded memory and fast convergence to diminish the influence of the vanishing gradient. Lastly, we found that this model is proven to be efficient and accurate compared to actual experimented data to validate our theory and show the value of the proposed model in real life while assuming Normal Gaussian distribution of data error with outstanding results; the auto-correlations were within the 95% confidence limit, the best validation was 2.7877, and an overall regression of 0.99993 was achieved.

Graphical Abstract

1. Introduction

The physicochemical understanding is incomplete to comprehend the entire battery structure as it has its limitations in achieving high robustness and overcoming high computational cost. As well, the field of modeling broadly contains many zones. However, in the literature related to our work, we noticed that most of them used multiple differential-algebraic equations (DAEs) to simulate with unidentified initial conditions. Limiting the confidence in models predictive abilities and long-term performance has some applications such as electric vehicles and power controller requiring more precise modeling. In the current paper, we limited ourselves to physics-based modeling, meaning using the voltage, current, and working conditions as quantities of interest to satisfy the conservation laws (conservation of mass, energy, and electric charge) from electrochemical impedance spectroscopy (EIS). R c t , known as the charge transfer resistance, is the most sensitive element to working conditions, making many models require frequent calibrations under specific working conditions or overcoming the battery aging effects.
Memristor was discovered when HP laboratories were working on crossbar array [1] because they needed an element with a high switching ratio for on/off switching; this element had to be 1000 as resistive to the current during the on state, therefore trying two plates of TiO2 & TiO2−x deficient [2]. The oxygen was pushed down and removed from the vacancies in TiO2, and this allowed us to consider it as two resistances in series with an applied voltage, but they have a slider connecting them and we can control the resistance by how much TiO2 moved (depends on current density). The best way to describe this characteristic is the constitutive equations that link the flux with the charge, as an outcome that the memristor seems as a resistor reliant on the charge q passing through the flux ϕ
ϕ = f ( q ) ,
with a property of
v = M ( q ) i ,
whereas M is a function of charge q reflecting the rate of change of flux with charge, the coupling constant could be equally represented as d q d ϕ if divided by a permeability μ of free space [3]. The memristor adds a new promising technological aspect that permits the continuous enhancement of performance and the cost of integrated circuits (ICs) using those considerations. Ohm law will be applicable.
v = R m ( q ) i ,
v = d ϕ d q i ,
From all of this, we can make a rigorous definition using Ohms law and state equation [4]
v ( t ) = R m [ w , i ( t ) ] i ( t ) ,
d w d t = f [ w , i ( t ) ] .

2. Related Work

From the literature, most existing battery models fall into the following groups: stochastic, electrochemical, and electrical. Stochastic models concentrate on modeling the battery’s retrieval alongside the behavior as stochastic processes by means such as the Markov chain process to model the whole battery-powered systems with likelihoods function relating to reflect the physical features of the electrochemical cell. It is excelling in modeling the recovery effects alongside the bursty aging manners. However, for it to be efficient, factors such as consumption patterns, aging, and interactions must be integrated, and aside from Markov chains, other approaches such as the Poisson and Wiener processes have limited expansion to various applications [5]. In quantitative descriptions, only the gain results are apparent, and the life cycles number are unapparent.
Electrochemical models utilize nonlinear differential equations to express the chemical and thermodynamic interactions inside the battery, describing it in excessive detail, which gives it the reputation of being the most accurate. Moreover, it stands out in displaying nonlinear effects to predict the limitations of physical cells. The complex structure causes the configuration to be a tedious process that takes hours to simulate one cycle. One alternative is using lumped parameters by a minor set of DAEs with some assumptions, but the modest set will still be insufficient to describe the complex electrochemical interactions in the majority of modern batteries. However, it still comes in handy when simulating dangerous experiments [6].
Electrical models symbolize the battery in ways like equivalent circuits and impedance models. Its popularity is because of its excellence in code designing or co-simulation integration into other systems to perform more complex simulations, which yields more design freedom. The impedance model is a circuit model that relies on EIS by injecting low AC frequency and interpreting the response, but its drawbacks are assuming the battery is a linear model. On the other hand, ECM compromises between performing the simulation and accuracy demands by simplifying the model and causing a weak physical basis. They need to be dynamic to characterize the operation of a battery accurately. This conversion to dynamic modeling uses experimental data to construct either by lookup tables or nonlinear equations a representation of such behavior and parameters [7]. In the memristive model’s context, this model incorporated both methods mentioned above by including the dynamically generated output from equations with the three phases of working battery operation (charging/discharging and rest) in table form to be an outstanding alternative for the electrochemical interactions within the model that permitted real-time applications and monitoring. See Table 1.
The aging effect and lifetime are the cornerstone to achieve sustainable batteries as the usage leads to degradation. Several different methodologies exist to identify parameters that fall under three main types: online, offline, and numerical methods. The first two types are built on analyzing experimental outcomes without broad knowledge because online identification investigates the estimation during operation and offline and is done by testing the battery [8]. The latter is by analytical calculations driven from physical principle, but an uncertainty emerges because the results may not perform precisely like the model [9]. Many methods are a mixture of different methods to compensate for each method’s drawbacks or show the information to a certain extent. On the other hand, NARX offers a flexible framework and accurate prediction by its leading-edge against the analytical model and iteration approximation because it possesses high-quality generalization properties [10].
Boujoudar et al. [11]. Conducted a battery test on Lithium-Ion batteries to store the data in a learning database from the driving cycles simulation and collected through a profile of dynamical stress testing (DST) and it will also be used for validation.
The authors used NARX to investigate the SOH on 21 nickel-manganese-cobalt oxide cells over two and a half years to construct the dataset. After an exact sampling procedure, the documented data for voltage was treated as the health pointers for NARX input in which, after training, they were used to validate different batteries and their health trajectory. They also found that NARX was capable of capturing the SOC and health indicators dependency, which yielded the following: NARX high performance with unseen data and different aging, outperforming other methods in accuracy evaluation and better computational cost, and most of the estimated errors in the data error histogram exist around the zero-line which indicates the sophisticated precision [12]. It achieved better than machine learning (ML) and semi-empirical modeling (SeM) methods in the validation and accuracy while requiring the least computational cost due to its learning and adaptability features. Colossal datasets will further help in improving the performance [13].
The remainder of this paper is arranged as follows. The research gap is in Section 3, alongside motivation and innovation. Section 4 contains the battery modeling and state estimation with the proposed battery model. Section 5 includes system analysis. In Section 6, the battery simulation and results are presented. Finally, conclusions are drawn in Section 7.

3. Research Gap

The entire energy scheme is going through a complete transformation as batteries should be made with the lowest ecological impact and ensure their longevity and safety. They should be repurposed to be remanufactured or recycled, creating an additional revival in economies. Typical recycling methods separate and smelt the wiring and materials located within a battery to extract materials such as copper and cobalt, which releases carbon dioxide in this process even though many compounds will not be restored, such as aluminum and lithium.
Memristive characteristics of TiO2 films are deeply reliant on their processing procedures alongside the synthesis, construction, and post-fabrication. An I-V curve typically represents the operative attributes of memristive devices—the occurrence of the change in memristance is related to the alterations in the magnitude alongside pulse duration in the case of externally applied excitations. The memristor’s resistance initially declines with positive pulse excitations and then increases due to negative polarization pulses [14]. The term titanium batteries (by adding minor amounts of titanium) to conventional alkaline batteries enhanced the performance by reducing the resistance and increasing battery efficiency by creating a reversible reaction when it interacts with lithium instead of the common lithium-graphite electrolytes. This manipulation allowed longer cycling to boost the recycling efforts by placing nanotubes gel to accelerate the chemical reaction within the electrolyte. Therefore, the battery can be quickly charged in about 2 min up until 70% and possesses a longer life period [15]. As batteries are in operation, their materials start to disassemble, which causes a reduction in performance. However, it was found that adding a porous version of titanium dioxide (titania) to lithium-ion batteries can preserve the battery materials to remain intact even after charging/discharging above 5000 times. This rearrangement of nanoparticles in the rutile phase is known as an inverse opal by filling an active battery with artificial opals [16]. Lithium titanate (LTO) emerged from adding T i O 2 to lithium seems to add more robustness and stability to batteries. The authors experimented with various metals labeled as multivalent metals. They found that electrons are transported for every ion, and substituting the negative electrodes with titanate permits multivalent batteries to work by intentionally introducing flaws that open spaces for a large range of materials such as magnesium and aluminium to transfer multiple electrons each time. This unlocks the batteries’ potentials to store more energy than the regular lithium equivalent-sized battery [17].
To further reduce the emissions, TiO2 seems groundbreaking, but to our knowledge, we did not find a battery model based on TiO2 memristors. For this reason, we proposed a model that deals with process state estimation through filtering smoothing method applied in experimental data (without outliers) using a proposed electrical circuit model as restriction and assuming Normal Gaussian distribution of data error (implicit in Kalman Filter theory).
The Motivations and Innovations: Chua [4] interpretation shows that the hysteresis loop is equivalent to passivity for a memristor regarding the physical property of energy dissipation [18]. Likewise, any defilement in the open voltage circuit (OCV) will cause an imprecise state of charge (SOC) estimation with the desired effect in the incremental capacity analysis (ICA) for the state of health (SOH) [19] because it provides information about the internal cell state. We were motivated by that to investigate the nonlinear relationship for both the SOC and memristive circuits when replaced in R c t place, considering those equivalent circuit models are used to predict the battery performance and provide SOC estimation—keeping in mind that sometimes it is tough to fit the simulation model to the experimental data. We summarize the contributions as follows:
  • Introducing memristive batteries modeling using a memristor will improve the performance, paving the way to understand the solid electrolyte interface (SEI), making the manufacturing process deal more efficiently with the existing battery problems, which include: under-utilization, material damage, and capacity fading [20].
  • Battery recycling has raised many alarms concerning polluting and the overall sustainability of batteries. Since TiO 2 builds it, the memristive batteries models will address next-generation batteries’ recycling concerns because they are affected by constituent attributes. For example, the recovery of a dead cell after disassembling it can be made by restaining the TiO2 in berry juice and wiping the cell with a tissue moistened by isopropyl or ethyl alcohol [21].
  • Nonlinear circuit elements such as memristor will change our traditional circuits to be memristive ones. Exploiting the memristor characteristic in modeling aims to handle the time-varying load profiles that describe the battery performance better and surpass the common trend of charging a battery until it reaches the cutoff voltage, which in many cases results in thermal runaway leading to a calamity such as explosions [22].
  • Presenting an open model that can be used for various state estimations and the memristor itself represents a dynamic output and the memristance parameters are dynamic as we know that there are time-variant and time-invariant systems. Because of such properties, this parameter itself represents new states of the battery.
  • Real data usage for memristive batteries models is more suited to the concept of sustainability and recycling, and our work validates that outliers can cause deviations from the state estimates with satisfactory results.

4. Battery Modeling and State Estimation

We use this section to look into the essential elements in this work as the battery management system is used to describe the actual energy levels by estimation technique to give us the known energy or remaining availability in the battery and the battery life period. This estimation should consider that homogenous materials have a hysteresis behavior [23] under variable amplitude, so for every state of charge, we can find a range for OCV and consider the polarization effect.

4.1. Open Voltage Circuit

The OCV has a mapping relationship with SOC varying with battery degradation and has significant importance to produce more robust battery models that can increase the SOC and SOH estimation by explaining well this relationship [24]. Consequently, we know that the OCV can reflect the battery state after the depolarization effect. Therefore, this relationship shows steadiness under various charge and discharge cycles. When a battery is fully charged, the open-circuit voltage OCV has a nonlinear and monotonic relationship. It will be higher than discharged status [25].

4.2. SOC Calculation

It is expressed as the available capacity percentage representing the battery’s capability for storing and delivering electrical energy. We can view this parameter as a thermodynamic quantity that enables us to assess the battery’s potential energy. From the SOC, we can estimate the state of health (SOH) [26] because SOC is the main task of a battery management system. The existing SOC can be categorized as direct and indirect: the direct point to the remaining capacity, using the online integration. However, it holds a limitation in the possibility of a significant error caused by inaccurate initial prediction of SOC and AH calculation. On the other hand, the indirect SOC applies or utilizes the intrinsic relationship with another electric parameter, for instance, the OCV. The SOC main approaches are as follows:

Coulomb Counting Method

It is also known as Ampere hour “Ah” by measuring the charge/discharge current integration over time and the obtained readings where they both undergo mathematical integration over-usage period—leaving the battery to keep track of SOC over time. This method’s accuracy depends on the precise measurement of current and SOC. Its advantage is in simplicity and low computational cost. The drawbacks come from the struggle to recover from the bad initial condition since the absence of feedback [27].

Filtering Method

It can be implemented by an algorithm to estimate the inner state as SOC is a state description. Using typical methods such as unscented Kalman filter (UKF) and Extended Kalman filter (EKF), both rely on the cell unit to predict the voltage [28]. This results in voltage stimulus estimating the internal battery state (SOC) to compare this forecast against the terminal voltage measurement [29]. Another approach is to convert the readings of the battery voltages to equivalent SOC using a known discharge curve by the indication of voltage versus SOC. However, it is time-consuming because of the necessity of a stable range for a battery during the discharging process to make it in consecutive recharging. However, we used this method since the data obtained from CALCE [30] and our center data both have been conducted in controlled conditions. The less frequent non random errors (outliers, gross errors, spike, maverick, etc.) are inherent in real systems since the measurement devices are physical. Compared to the current calculation, the current sensor has a drift and integration error in the coulomb counting method, which will not get perfect alignment for the sensing with the actual current outliers (spikes). On the other hand, the simple voltage method, which efficiently predicts the capacity fade and internal resistance increment, has a more accurate SOC estimation.

4.3. Electrochemical Impedance Spectroscopy

Electrochemical impedance spectroscopy (EIS) is mainly used to diagnose electrochemical systems to interpret the electrochemical process inside a system by determining impedance changes with sinusoidal frequency, allowing the model to be characterized for reasons such as studying the limitations or for performance enhancement. It requires accurate modeling to explain the impedance change and the associated dynamics; the most used method to do that is equivalent circuit models (ECM). In this technique, the EIS data is converted to meaningful physical quantities and qualities that represent the electrochemical process in terms of capacitance (C), resistance (R), and phase element (CPE), which can be connected in serial or parallel in the model. EIS advantages are: quickness and accurate readings can be obtained from exposure to actual conditions, e.g., open-circuit voltage, demonstrate and validate the model reaction, and low cost. However, understanding the whole system demands a meaningful analysis of the whole electrochemical environment to interpret the obtained spectrum from EIS, which can be complex sometimes as electrons pass through numerous impedance elements. Depending on the components’ nature and characteristics, they will vary to reflect the electrochemical reactions and polarization time constant, causing different frequency variations [31]. On the other hand, equivalent circuit modeling (ECM), see Figure 1, is used for describing the battery-electric behavior effectively by electrical elements representation for battery modeling. It is sensitive to a battery’s external conditions to show impedance response because we deal with an entire system that does not ideally behave throughout time. They can precisely describe the complete system, and it is much easier to interpret the whole system by it because in real-world applications about EIS spectra, there are no perfect half-circuits that need our modeling technique.

4.4. Proposed Battery Model

Mathematical modeling plays a significant part in modern physical and chemical systems and process engineering because it can be used for the evaluation process states, including predicting unmeasured variables (soft sensors) and parameters [32]. Different battery models with various degrees of complexity have been used to describe its dynamic behavior [32]. In this regard, the electrical circuit models (ECMs) of a battery are engaged to embody the battery’s voltage–current characteristic curve to accomplish this better [22]. Additionally, commercial software adapts the same philosophy of given the same characteristics curve throughout the simulation. The proposed model is based on it in this work since ECM has an incredible advantage in computation time compared to electrochemical models. By utilizing the Thevenin battery diagram [33], our electrical circuit consists of a resistor, capacitor, memristor, and a voltage source to represent the OCV as in Figure 2. As the memristor resembles a resistor that relies on charge q passing through flux, using Kirchhoff voltage law, the model voltage is modeled in the following: V m ( t ) = O C V ( t ) + V t ( t ) . From Equations (3) and (4) we can obtain
v t = R i + d R m d t c d v 0 d t ,
i t = v R + v R m ( q ) + c d v 0 d t ,
i t = v R + v d q d ϕ + c d v 0 d t ,
substituting v = d ϕ d t into Equation (9) yields:
i t = 1 R d ϕ d t + c d 2 ϕ d t 2 + 1 R m ( q ) d ϕ d t ,
A model based on the above equations was developed to give more accurate simulation results, using SIMULINK blocks to reflect the Equation (10). The mathematical and physical models are both combined allowing the SOC estimation. The SOC is calculated by mapping it against the voltage, assuming the temperature is constant and the cycle number of the battery is in a consistent state, and the parameters (e.g., C, R 0 , and R 1 ) are determined from experimental results (describe in Section 5).

5. System Analysis

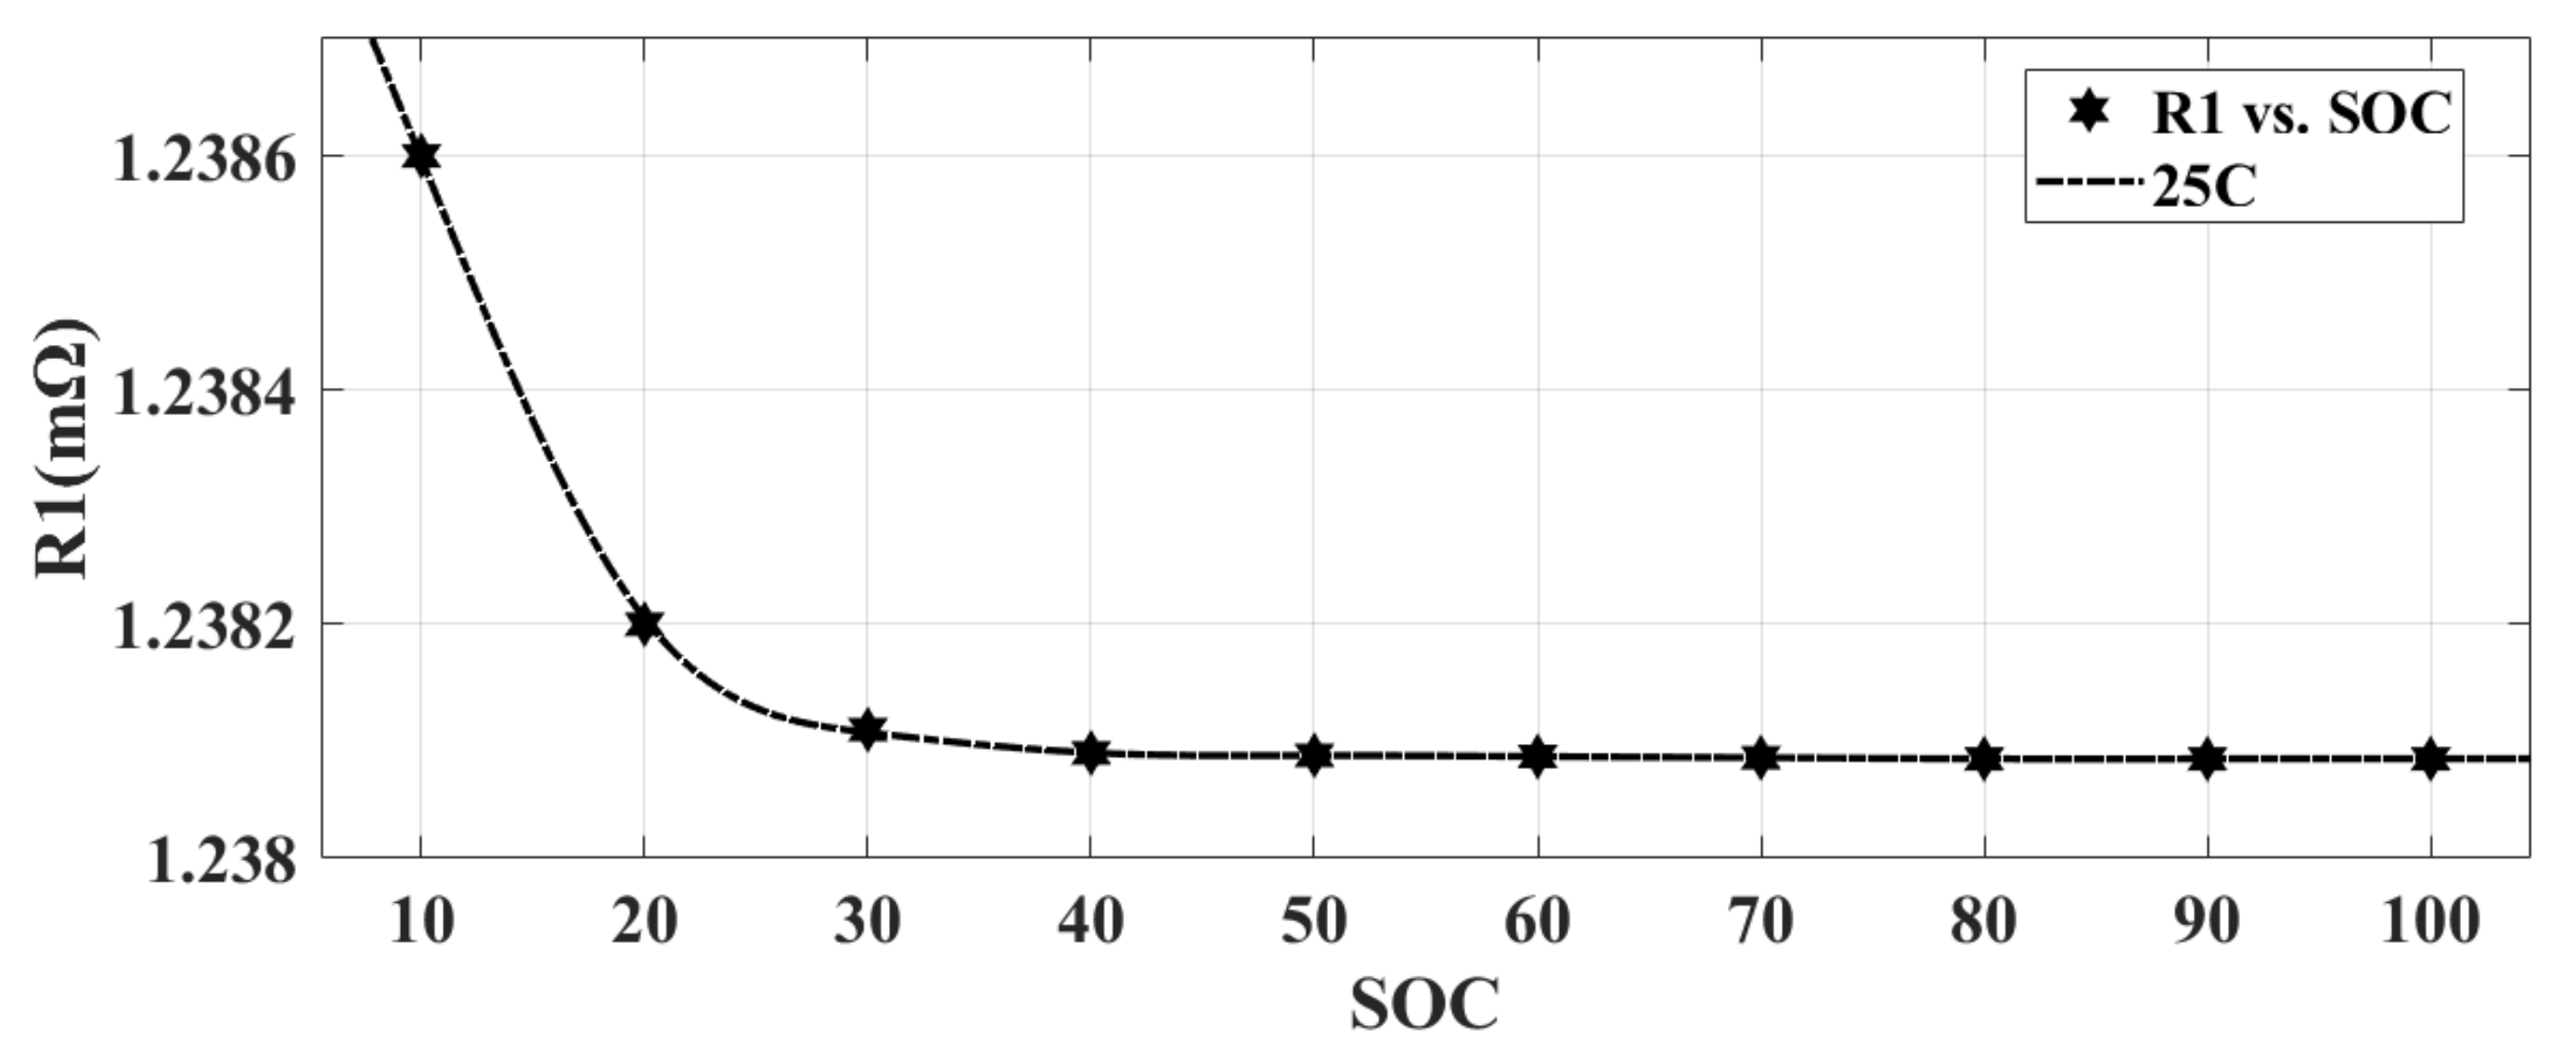
5.1. Internal Resistance
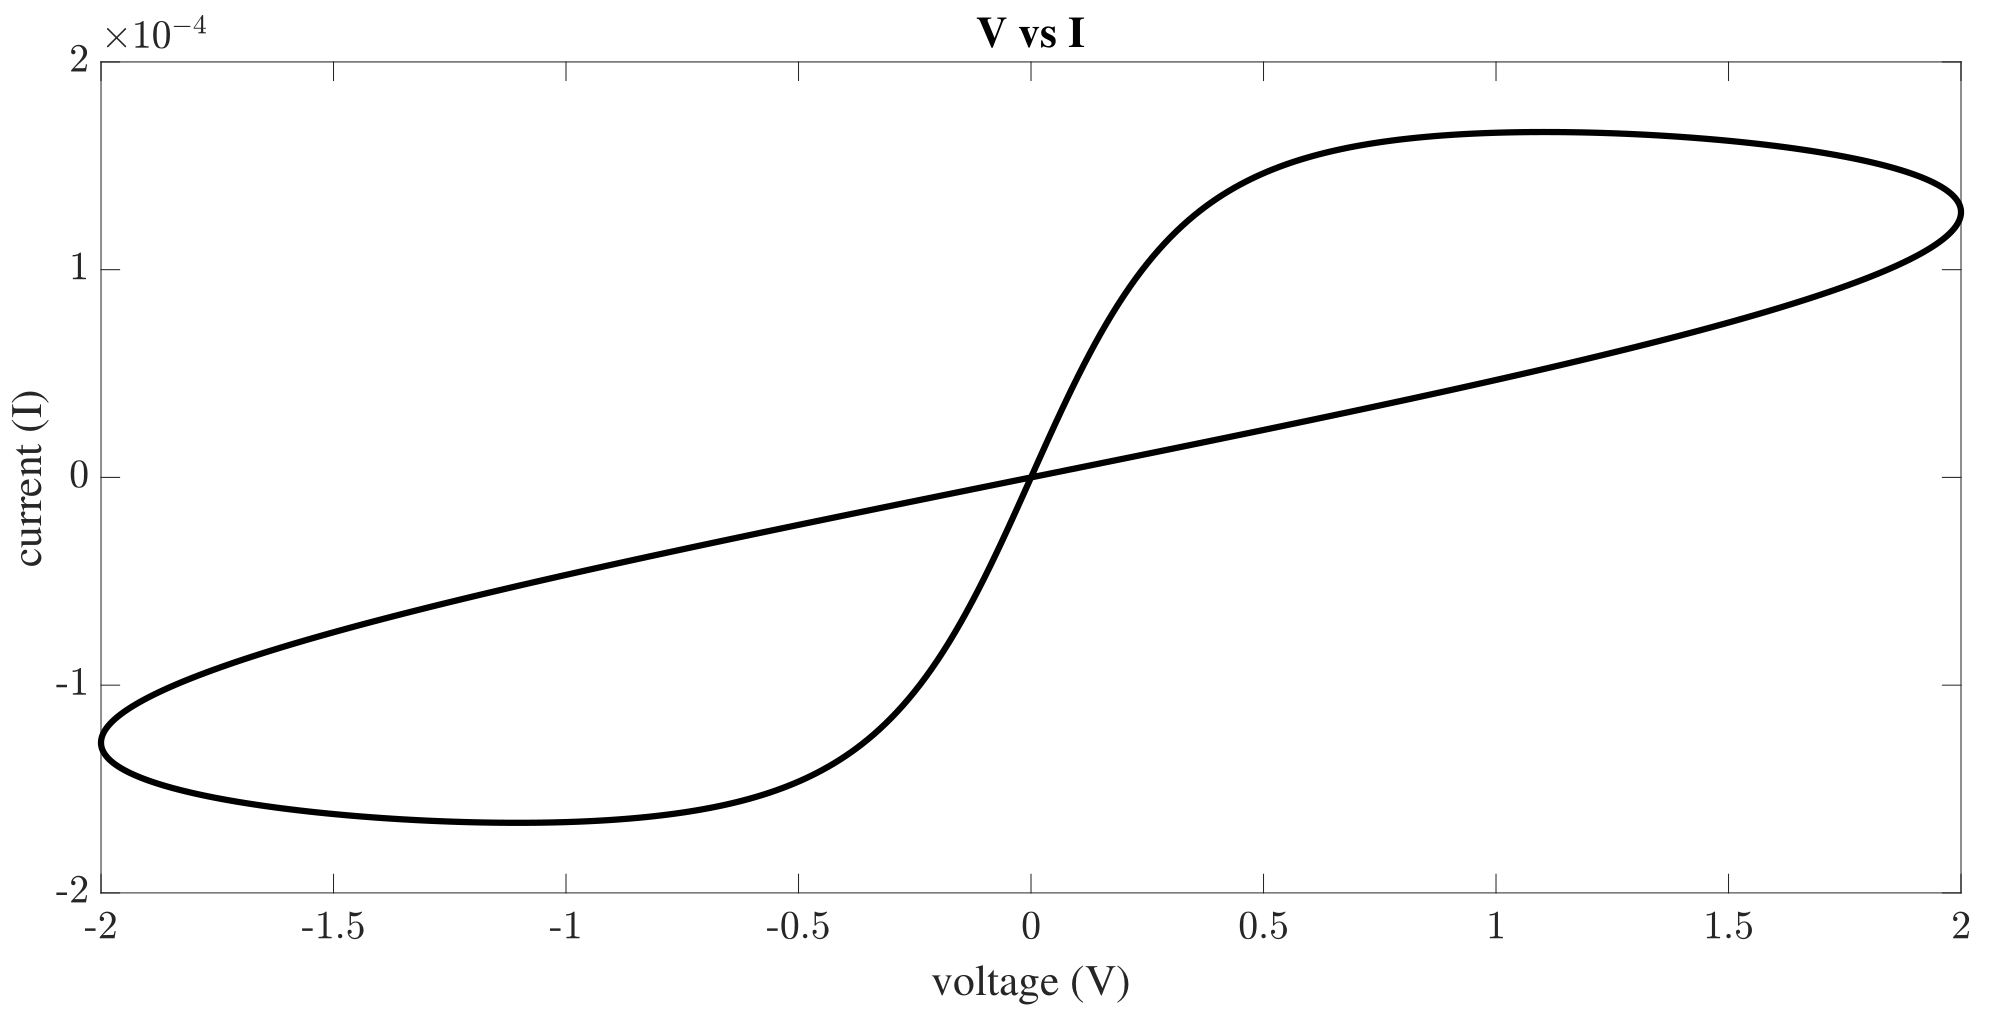
It is the SOC-dependent element, and it is also dependent on the input current; R0 will cause a voltage drop for the battery when it is under a load. Here, an important concept must be introduced: the diffusion voltage since the polarization refers to any departure in the terminal voltage Vt away from the OCV due to a current passing. R0 is one of the best examples for this, showing the reaction to changing input current without a moment’s delay. This phenomenon is caused due to slow diffusion processes in the battery.

5.2. Memristor

A surge of voltage can adjust memristors, but unlike any transistor, the resistor value changes and remains the same and can be undone by a reverse current. Memristance delivers better scalability, lower power consumption, smaller size, and higher utilization than RC network, as an element has been built by two plates (TiO2 and TiO2−x deficient). The two plates are doped by oxygen, which has low resistance and acts as a suitable conductor, and the overall resistance depends on the electric current that cuts through. The summation of both resistances in the two areas gives us an I-V curve that typically characterizes the total resistance [34]. See Figure 3. The memristive properties and functionalities mimic the biological nerve cell accordingly and can be employed in artificial and hybrid neural networks [35]. When increasing the voltage, the current also increases linearly and has a shallow slope that says its conductance is low. The fact that it goes back to the origin and the pinched hysteresis loop says it is not storing energy. Transition metal oxides such as TiO2 have attracted much research interest, especially its resistive switching ability which is considered to be one of its most distinguishing properties [36]. Thin-film memristive materials based on TiO2 add ease when integrating them into electronic circuits [35]. These memristive devices, after fabricating, consist of anatase or rutile and both are very stable polymorphs allowing the oxygen vacancies and concomitant n-type conductivity to be under control even in temperatures exceeding 300 °C [37].
  • Linear Model
In a forward bias scenario, the length of the doped area is increased, resulting in the memristor’s resistance decreased, and reversing the bias will lead to the opposite of this situation.
M ( x ) = R n x + R f ( 1 x ) ,
x ˙ ( i ) = M R n D 2 i ( t ) = k i ( t ) ,
This model does not consider sizeable electric field nonlinearity within the device because the switching time is susceptible to the voltage levels [38].
  • Nonlinear Model
This is a further developed model than the linear by adding a nonlinear window function f ( x ) , which bound x values between zero and unity.
x ˙ ( t ) = k i ( t ) f ( x ) ,
the current–voltage relation of the memristor presented in the equations [39]
v ( t ) = R n w ( t ) D + R f 1 w ( t ) D i ( t ) ,
d w ( t ) d t = μ v R n D i ( t ) ,
M delivers a functional relationship between charge and flux d ϕ = M ( d q ) and to obtain the memristance of such system, in other words, the switching ratio for ( R n ) on and off ( R f ) we can simplify it to:
M ( q ) = R f 1 μ v R n D 2 q ( t ) ,
R n the width of the high doped region, w defines the state variable of a memristor and its resistance value [40].

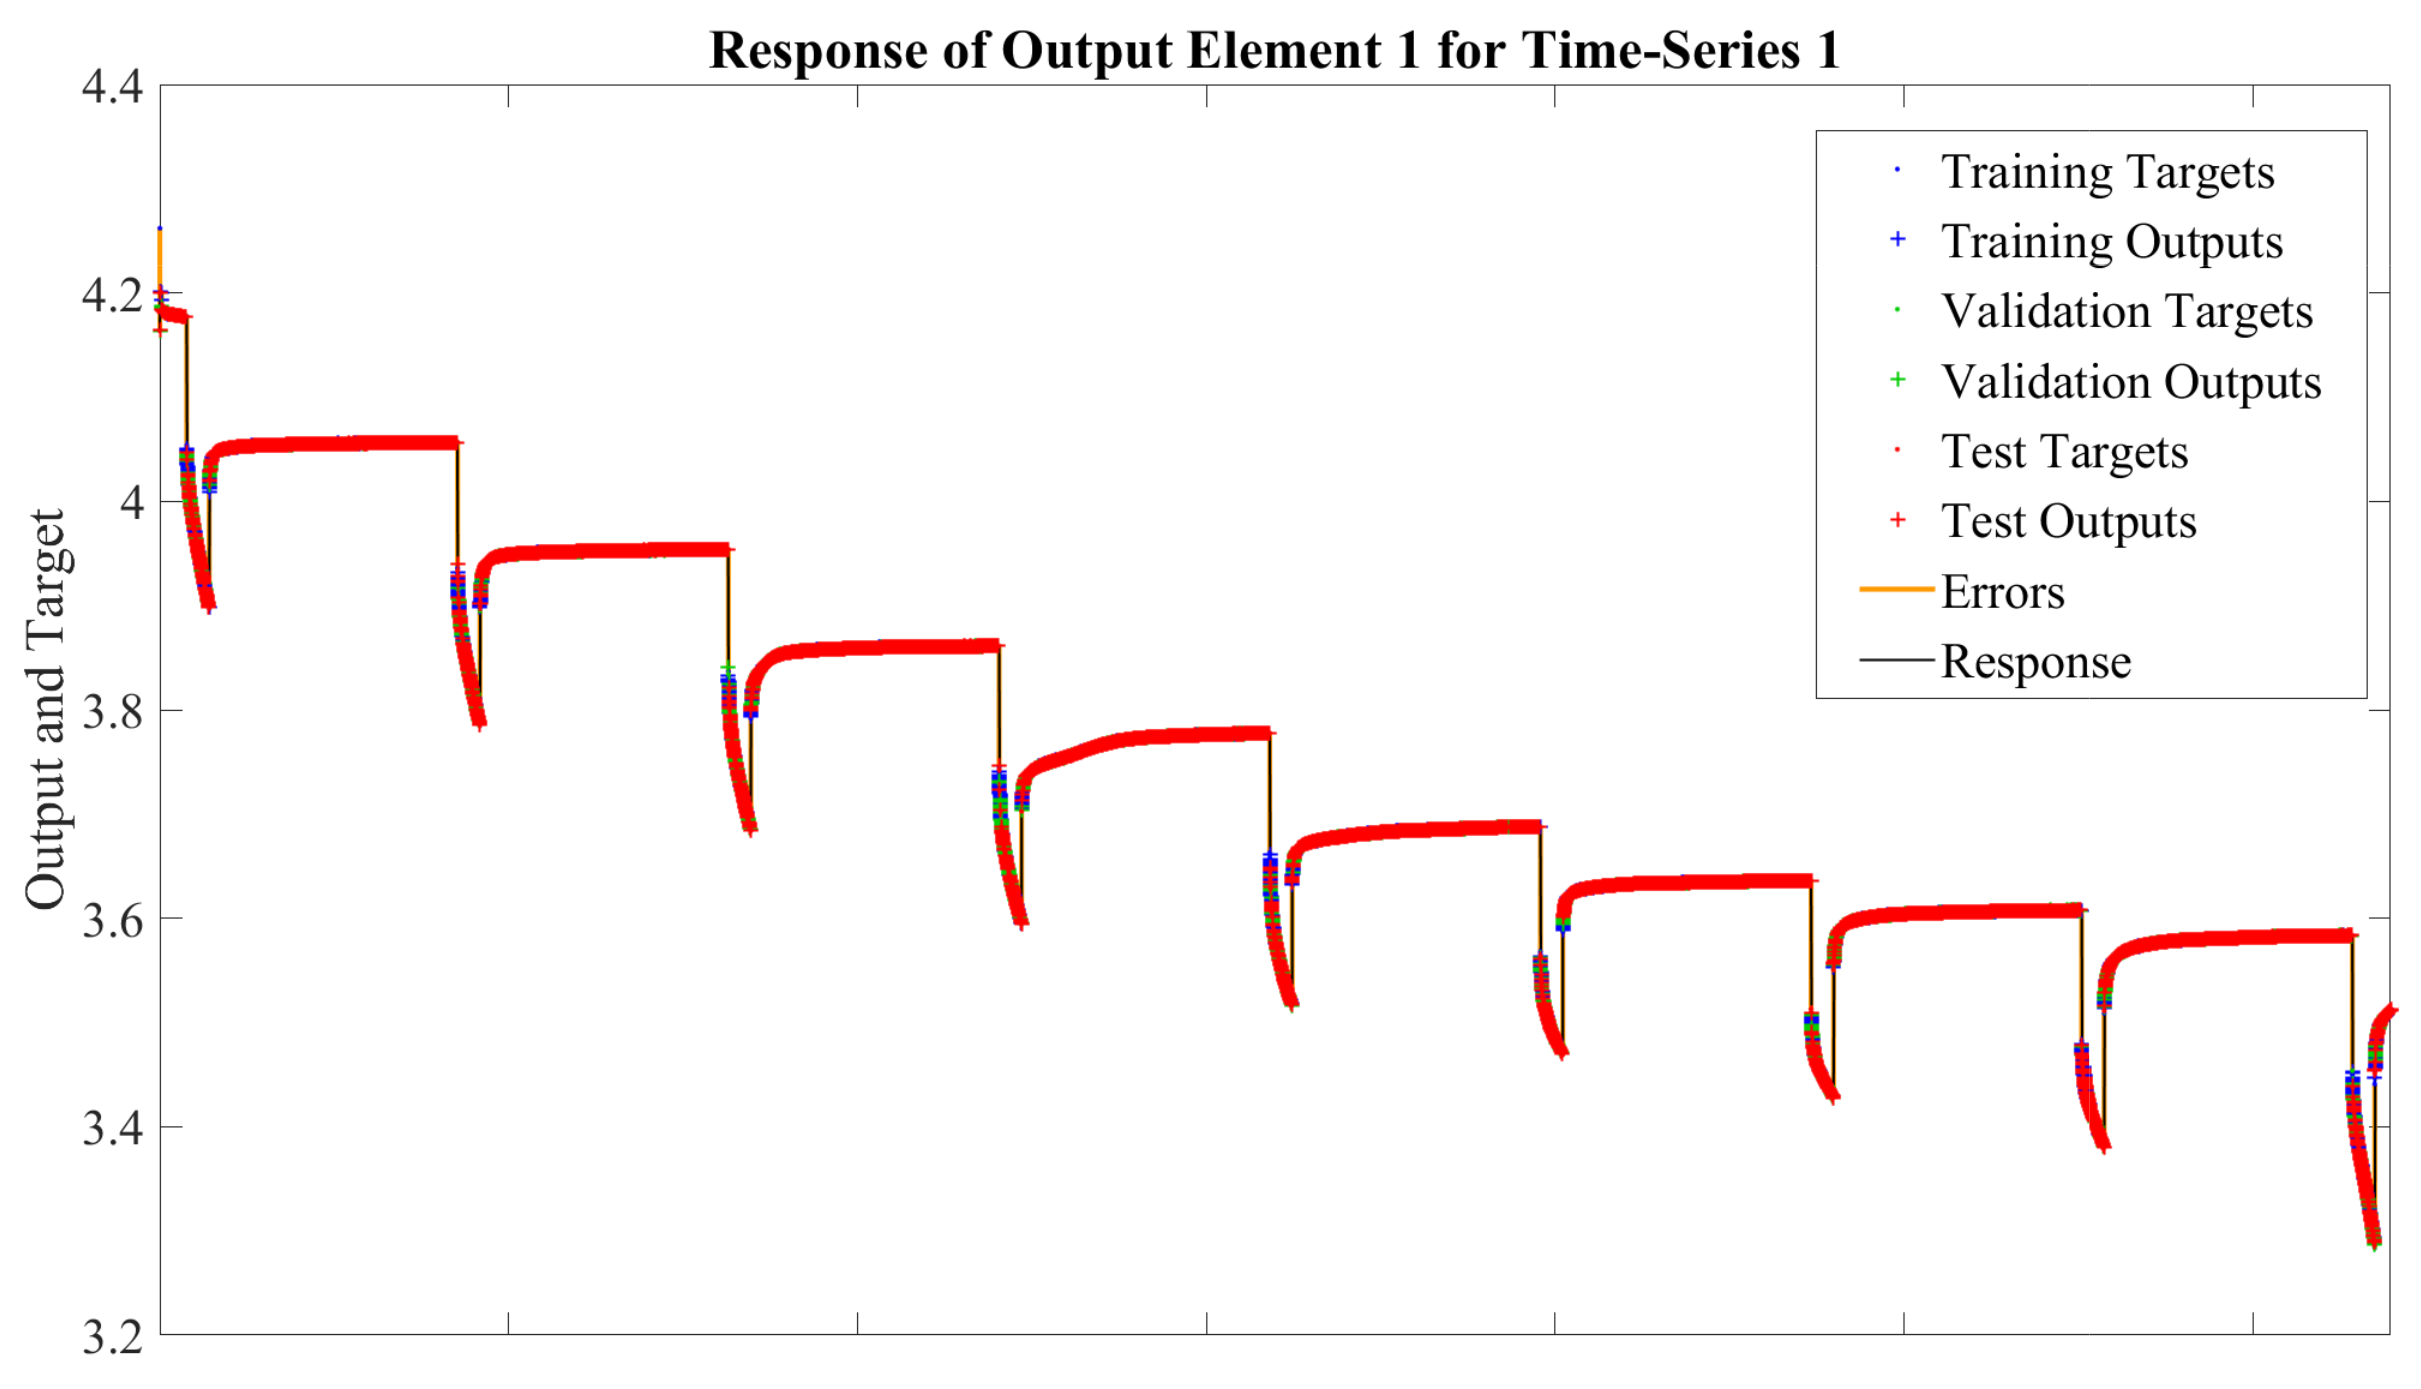
5.3. Training Algorithm

Levenberg–Marquardt algorithm, also known as dampest least squares, is better suited for these nonlinear least-squares problems [41] to fit the data and also extract its parameters. LMA works the fastest with moderate-sized neural networks, and the algorithm is an oscillating attempt amid two optimization methods. If the damping factor λ goes to zero, it will be the Newton method and if λ went to infinity, it would be Gradient descent. We can rephrase by saying if the parameters are far from the optimal point, it is Gradient descent and when they are close to the optimal point, it is Gaussian
F = i = 1 m [ y i y ( x i , β ) ] 2 = i = 1 m r i 2 ,
e r r o r = f ( β ) / m ,
where F is the task objective function treated as the sum of differences between model responses r i and the actual data y i , m is the number of points for data measurement, β = [ β 1 , β 2 , , β n ] is a parameter vector [42]. The cost function F corresponds to the maximum likelihood principle assuming a priori that measurements error follows the Normal (Gaussian) distribution [32]. Although it is the most used estimator in data regression problems, it is not robust against the less frequent outliers to deal with them, avoiding poor estimates over states and parameters for real applications; a robust m-estimator could be used as recently reviewed [43]. Robust m-estimators, which are generalizations of maximum-likelihood estimators and originating from robust statistics [32], have been examined in numerous areas of science (since 1888). Samples are presented and tuning for 90%, 95%, 98%, and 99% relative efficiency levels regarding the Normal distribution for regression analysis is performed [43]. In particular, this regression problem is described by a nonlinear model in the state and parameter space (not expressed by high-nonlinear unbounded functions, e.g., exponentials one from chemical reactions models). It is linked to a strictly convex objective function (Least Squares), and reasonable starting states (measured) and parameters are known to vector b—(the bounds of unknown parameters are reasonably defined). Therefore, in several cases, it can find an interpretation that solves the problem even if it begins very far off from the minimum, and when dealing with multiple minima, the algorithm converges to global minima in aiming to make the summation of squares (for the deviations) be the least. At the beginning of this iterative process, initial guessing must be provided for the parameters vector β . When dealing with multiple minima, its protocol converges to global minima, supposing that the preliminary speculation is near the final solution in each iteration; the parameter β will be replaced by a new estimation β + δ to determine δ , also known as the new estimate so that their linearization approximates the functions. The gradient concerning δ will be zero, taking the derivative concerning δ and setting the results of zero gives the Jacobian matrix [44] (the Jacobian matrix of R element is defined to as an m×n matrix) R i j whose i t row equals a vector m with i t component n respectively. The diagonal matrix consists of diagonal elements that will be given as the increment δ to the estimated coefficient vector in the damped version as the damping coefficient λ is attuned at every iteration to find a smaller value that can be used [45]. If either the computed step δ measurement or the reduction of squares summation from the final coefficient vector β + δ dropped under the presets limits, iteration halts and the final parameter vector β is deemed to be the answer. See Figure 4 for the work mechanism.

6. Simulation and Results

Battery parameter estimation can be considered a time-consuming procedure that requires transient data and overcoming the deficiency and the absence of accurate models. In addition, much commercial software handles the battery discharge only or adapts the assumption of the charge/discharge processes, given them the same characteristics curve throughout simulation [46]. The parameters in most cases are either infeasible or unavailable; using memristive elements embedded into equations, we can better look at the battery capacity and hysteretic effect by simulating the differential equation, which can describe our module and display that effect more clearly. Considering the state-space equation from (10)
C 1 u ˙ + 1 R 1 u = R 0 C 1 i + R 0 + R 1 R 1 i ,
where C 1 is the capacitor, R 1 is the memristor, R 0 is the internal resistance, and i&u donate the input current and voltage output, respectively. Representing these equations in a numerical simulation environment to describe the system dynamics by identifying the mathematical model description as memristive circuits are highly nonlinear we implemented:
a = c 1 , b = 1 R 1 , C = R 0 C 1 , d = R 0 + R 1 R 1
to avoid confusion as nomenclature changes in SIMULINK, we can have
X = R 1 ( S O C ) , Z = 1 R 1 ( S O C ) , Y = 1 + R 0 b
where Z is the monotonic function of the SOC and memristor relationship, the actual data obtained from the Center for Advanced Life Cycle Engineering (CALCE) [30], was based on incremental OCV because it is more recommended to describe and find the essential relationship between the OCV and SOC [47].
After identifying R 1 values from the actual data at the discharge pulses and drawing out its curve facing the SOC in Figure 5 and Figure 6, then taking these values to simulate the actual conditions of the experiments, putting them as lookup tables inside the simulation, the clock rate was set to 0.1 s. The relationship between R 1 and SOC or as we implemented in the simulation from the demonstrated Figure of R 1 vs. SOC at 25 °C, is a decreasing monotonic function reflecting an adverse change for every change in SOC memristance having a portion where the gradient is negative. In Shandong University center using MKL test platform for data Figure 7, during the incremental OCV process, we charged the battery until it fully charged and gradually discharged it with positive pulses of current and given a relaxation time phase. After 2 h of complete rest, we charged again with negative current pulses. Later, there was another relaxation phase, a constant voltage was applied, and there was another relaxation phase of 2 h. We have set the current to 0.5, and this will eradicate the polarization effect. This final step is similar to having an averaging step and a linear interpolation to obtain a curve for OCV-SOC and comparing the two datasets (which was done by the same conditions in a cabinet) with constant temperature and humidity to store batteries; they were indistinguishable.
OCV vs. SOC curve and Model Frequency Response. In any model based on SOC estimation, we can view the battery as composed of a linear dynamic state equation and highly nonlinear OCV-SOC function. It is also known that the SOC cannot be measured directly and that is why we estimate or use an indirect means from the measured signals to be treated as a nonlinear function [48]. Using the discharge pulses and OCV, the fitting function was as the following:
f ( x ) = p 1 x 7 + p 2 x 6 + p 3 x 5 + p 4 x 4 + p 5 x 3 + p 6 x 2 + p 7 x + p 8
The obtained coefficients are shown in Table 2.
Regarding the model frequency response, when the input was a Sine stream to obtain the model frequency, it contained 30 frequencies between 10 and 1000 rad/s and is shown in the below Figure 8 and Figure 9.
Neural Network Nonlinear Auto-regressive Exogenous (NARX) is most suited for nonlinear least-squares identification. NARX concept lies in addressing the behavior of the nonlinear system on the ground of its recurrent architectures and time indexing features. After choosing a proper network structure, knowing that increasing the numbers of hidden layers (neurons) will gain more accuracy, choosing 70% of the network for the training phase, 15 % for the validation phase, and 15 % for the testing stage so the input and target vectors will be indiscriminately separated into three sets and ten hidden layers with one output layer were implemented.
The training algorithm will stop when generalization stops improving. Figure 10 shows the numerical simulation output as a time-series and with the implementation of R 1 values indicating the outputs for training, validating, and testing, also illustrating the response and plotting it versus time to realize the memristor polarization effect inside the battery. The physical meanings of the memristor hysteresis area in our model are proportional to energy dissipations because the increase of area size to be larger reflects more energy dissipation that accelerates the aging of the battery, which is similar to the metal fatigue concept and which is another advantage in our proposal because we demonstrate that it is very small.
Figure 11 is the neural network training state with LMA demonstrating the gradient and validation checks process when operating by actual data from Shandong university center at epoch 199 stops.
Figure 12 shows the error histogram relating the targeted and forecasted values after training NARX, indicating how the predicted values differ from the targeted values. Y-axis denotes the number of samples in a certain range and their corresponding bin. Analyzing this plot, we deal with 0.004601, which shows that the training dataset errors lie underneath 5, the validation and testing lie below 6 and 7, and the Mean Square Error (MSE) was 2.78773 × 10 6 . As discussed earlier, the negative effect of outliers on estimates in regression problems can be realized using robust m-estimators [32,43], including, adaptations (a weight vector for each observation) to the EKF for robust state estimation problems [28] and the robust approach should be addressed in future works.
Figure 13 shows the error auto-correlation function for the NARX, interlinking the time relationship of the forecasted errors. It can be seen from the figure that they were insignificant and very small by analyzing this plot. In this instance, excluding the zero-lag correlation, the remaining correlations fell within 95% confidence limits around zero and stopped at epoch 199.
Figure 14 is for the validation, as the best validation was 2.7877 at epoch 192 and epoch 199 validation stops showing the Mean Square Error (MSE) vs. Epochs.
As mentioned above, the dataset was divided into validation, testing, and training. Training sets are used in the network to find the network bias and weights, while the validation sets minimize the overfitting. Figure 15 for neural network regression expressed the regressions between the targets and outputs in correlation coefficient R, showing that all values are greater than 0.99992 and the entire dataset is close to 1, verifying that the developed model achieved very good results with a total regression number of 0.99993 .
Regarding the use of mean square error for performance, one must think about having a random stationary process (stochastic) [49] so the mean property for such process will not change with time. However, changing the neurons’ weights in response to patterns accordingly will make an unprecedented method to evaluate the performance of the linear error. So, the error computation will be based on the expectation over the ensemble.
ϵ k = 1 2 ( d k x k t w k ) 2 = 1 2 e k 2 ,
w k is the held weight, e is the error, ϵ k is the expectation, d k is the desired output, and x k t is the input vector, and the expectancy of equation sides can find the MSE. To find the optimum weight vector that lessens the MSE, we define vector P as cross-correlation amid the wanted output d k and input vector x k to find out the minimum error using Neural Networks Mean [50,51]. Square Error (MSE):
ϵ = E [ ϵ k ] = 1 2 E [ d k 2 ] p T w k + 1 2 w k T R w k ,
R is the input correlation matrix; P is a vector for cross-correlation.

7. Conclusions

Sustainability extends over all technological advances in energy storage systems, including the raw materials, battery modeling and manufacturing, and actual life applications. Raw materials effects usually stem from the provided resources for the essential electrochemical functionality. In this paper, we investigated the equivalent circuit modeling of a memristive battery using mathematical simulation to describe the dynamic characteristics of the battery, the memristive hysteresis behavior within the battery, and the rate of variation of flux with charge regarding its relationship with SOC as time-series forecasting duplicate system identification. The Levenberg–Marquardt algorithm (LMA) has been used via neural network structure to utilize nonlinear autoregressive exogenous (NARX) by applying that to identify the model given actual experimental data, which demonstrated an efficient SOC estimation that will apply to different conditions and current profiles because NARX is effectual in learning gradient descent. However, their problems lie in learning long time dependences as vanishing gradients issues can occur, which is similar to actual dynamic systems situations when being influenced by instability, the absence of embedded memories, and overfitting due to neurons number as using excessive numbers can produce poor forecasting that reduces the accuracy. Nonetheless, our model could provide a more precise and accurate battery state estimation because our total regression was 0.99993, and error identification seems insignificant when assuming the Normal Gaussian distribution of data error. We hope the obtained results give more insights to guide batteries optimization and design because this is an open model that can be used to interpret different state estimations with such dynamic conjunction as SOH. Investigating these dynamic relations further for finding more meaningful quantitative manners, especially with more outliers, will be the goal of our future work.

Author Contributions

The paper reflects the authors’ own research and analysis truthfully and completely and the results are appropriately placed in the context of prior and existing research. Both authors have been personally and actively involved in substantial work leading to the paper and will take responsibility for its content. Both authors have read and agreed to the published version of the manuscript.

Funding

This work is supported by the National Natural Science Foundation of China (61973193, U1964207, 61527809) and the Innovative Research group of National Nature Science Foundation of China (61821004).

Institutional Review Board Statement

Not applicable.

Informed Consent Statement

The authors give their consent for the publication of the article; all the details within the text are to be published in the international journal of energy research and may be available in both print and on the internet. It will be available to a broader audience through marketing channels and other third parties. Therefore, anyone can read the material published in the journal.

Data Availability Statement

CALCE data are an available dataset which we simulated and provided the link for. Our center data are available for the public upon request, and the paper properly credits the meaningful contributions of co-authors and co-researchers.

Acknowledgments

The authors would like to thank the reviewers for their corrections and helpful suggestions.

Conflicts of Interest

The authors declare that there is no conflict of interest and they have no other financial relationships with any organizations that might interest the submitted work; they have no other relationships or activities that could have influenced the submitted work. The manuscript will not be submitted elsewhere: The manuscript has not been submitted or published anywhere.

Abbreviations

The following abbreviations are used in this manuscript:
AbbreviationsExplanations
DAEsDifferential Algebraic Equations
EISElectrochemical Impedance Spectroscopy
OCVOpen Voltage Circuit
SOCState of Charge
SOHState of Health
TiO2Titanium Dioxide
CALCECenter for Advanced Life Cycle Engineering
NARXNonlinear auto-Regressive Exogenous
LMALevenberg–Marquardt algorithm
MSEMean Square Error

References

  1. Fouda, M.; Eltawil, E.; Kurdahi, F. Modeling and Analysis of Passive Switching Crossbar Arrays. IEEE Trans. Circuits Syst. I Regul. Pap. 2018, 65, 270–282. [Google Scholar] [CrossRef]
  2. Pickett, M.D.; Strukov, D.B.; Borghetti, J.L.; Yang, J.J.; Snider, G.S.; Stewarta, D.R.; Williams, R.S. Switching dynamics in titanium dioxide memristive devices. J. Appl. Phys. 2009, 106, 6. [Google Scholar] [CrossRef]
  3. Mathur, N.D. The fourth circuit element. Nature 2008, 455, E13. [Google Scholar] [CrossRef]
  4. Chua, L. Memristor—The missing circuit element. IEEE Trans. Circuit. Theory 1971, 18, 507–519. [Google Scholar] [CrossRef]
  5. Tao, L.; Ma, J.; Cheng, J.; Noktehdan, A.; Chong, J.; Lu, C. A review of stochastic battery models and health management. Renew. Sustain. Energy Rev. 2017, 80, 716–732. [Google Scholar] [CrossRef]
  6. Seaman, A.; Dao, A.; McPhee, A. A survey of mathematics-based equivalent-circuit and electrochemical battery models for hybrid and electric vehicle simulation. J. Power Sources 2014, 256, 410–423. [Google Scholar] [CrossRef] [Green Version]
  7. Lai, X.; Zheng, Y.; Sun, T. A comparative study of different equivalent circuit models for estimating state-of-charge of lithium-ion batteries. Electrochim. Acta 2018, 259, 566–577. [Google Scholar] [CrossRef]
  8. Barcellona, S.; Piegari, L. Lithium Ion Battery Models and Parameter Identification Techniques. Energies 2017, 10, 2007. [Google Scholar] [CrossRef] [Green Version]
  9. Siczek, K.J. Chapter 16: Modeling of Batteries. In Next-Generation Batteries with Sulfur Cathodes; Academic Press: Cambridge, MA, USA, 2019. [Google Scholar]
  10. Chmielewski, A.; Możaryn, J.; Piórkowski, P.; Bogdziński, K. Battery Voltage Estimation Using NARX Recurrent Neural Network Model. In Advances in Intelligent Systems and Computing; Szewczyk, R., Zieliński, C., Kaliczyńska, M., Eds.; Springer: Cham, Swizterland, 2020; pp. 218–231. [Google Scholar]
  11. Boujoudar, Y.; Elmoussaoui, H.; Lamhamdi, T. Lithium-Ion batteries modeling using NARX Non-linear model. In Proceedings of the International Conference on Wireless Technologies, Embedded and Intelligent Systems (WITS), Fez, Morocco, 3–4 April 2019; pp. 1–6. [Google Scholar]
  12. Khaleghi, S.; Karimi, D.; Beheshti, S.; Hosen, M.D.; Behi, H.; Berecibar, M.; Mierlo, J. Online health diagnosis of lithium-ion batteries based on non-linear autoregressive neural network. Appl. Energy 2021, 282, 116159. [Google Scholar]
  13. Hosen, M.; Jaguemont, J.; Mierlo, J.; Berecibar, M. Battery lifetime prediction and performance assessment of different modeling approaches. iScience 2021, 24, 102060. [Google Scholar] [CrossRef]
  14. Zhang, L.; Chen, Z.; Joshua Yang, J.; Wysocki, B.; McDonald, N.; Chen, Y. A compact modeling of TiO2-TiO2−x memristor. Appl. Phys. Lett. 2013, 102, 153503. [Google Scholar] [CrossRef]
  15. Zhang, Y.; Jiang, Z.; Huang, J.; Lim, L.Y.; Li, W.; Deng, J.; Gong, D.; Tang, Y.; Lai, Y.; Chen, Z. Titanate and titania nanostructured materials for environmental and energy applications: A review. RSC Adv. 2015, 5, 79479–79510. [Google Scholar] [CrossRef]
  16. McNulty, D.; Carroll, E.; O’Dwyer, C. Rutile TiO2 Inverse Opal Anodes for Li-Ion Batteries with Long Cycle Life, High-Rate Capability, and High Structural Stability. Adv. Energy Mater. 2017, 7, 1602291. [Google Scholar] [CrossRef]
  17. Koketsu, T.; Ma, J.; Morgan, B.J.; Body, M.; Legein, C.; Dachraoui, W.; Giannini, M.; Demortiere, A.; Salanne, M.; Dardoize, F.; et al. Reversible magnesium and aluminium ions insertion in cation-deficient anatase TiO2. Nat. Mater. 2017, 16, 1142–1148. [Google Scholar] [CrossRef] [PubMed]
  18. Dreyer, W.; Jamnik, J.; Guhlke, C. The thermodynamic origin of hysteresis in insertion batteries. Nat. Mater 2010, 9, 448–453. [Google Scholar] [CrossRef]
  19. He, Y.J.; Shen, J.N.; Shen, J.F.; Ma, Z.F. Embedding Monotonicity in the Construction of Polynomial Open-Circuit Voltage Model for Lithium-Ion Batteries: A Semi-infinite Programming Formulation Approach. Ind. Eng. Chem. Res. 2015, 54, 3167–3174. [Google Scholar] [CrossRef]
  20. Koike, M.; Ishizaki, T.; Ramdani, N.; Imura, J. Optimal Scheduling of Storage Batteries and Power Generators Based on Interval Prediction of Photovoltaics—Monotonicity Analysis for State of Charge. IEEE Control Syst. Lett. 2020, 4, 49–54. [Google Scholar] [CrossRef]
  21. Smestad, G.P.; Gratzel, M. Demonstrating Electron Transfer and Nanotechnology: A Natural Dye-Sensitized Nanocrystalline Energy Converter. J. Chem. Educ. 1998, 75, 752. [Google Scholar] [CrossRef]
  22. Riaza, R. Homogeneous Models of Nonlinear Circuits. IEEE Trans. Circuits Syst. I Regul. Pap. 2020, 67, 2002–2015. [Google Scholar] [CrossRef] [Green Version]
  23. Kwak, M.; Lkhagvasuren, B.; Park, J.; You, J. Parameter Identification and SOC Estimation of a Battery Under the Hysteresis Effect. IEEE Trans. Ind. Electron. 2020, 67, 9758–9767. [Google Scholar] [CrossRef]
  24. Xiong, R.; He, H.; Zhao, K. Research on an online identification algorithm for a thevenin battery model by an experimental approach. Int. J. Green Energy 2015, 12, 272–278. [Google Scholar] [CrossRef]
  25. Xiong, R.; Tian, J.; Mu, H.; Wang, C. A systematic model-based degradation behavior recognition and health monitoring method for lithium-ion batteries. Appl. Energy 2017, 207, 372–383. [Google Scholar] [CrossRef]
  26. Buchman, A.; Lung, C. State of Charge and State of Health Estimation of Lithium-Ion Batteries 2018. In Proceedings of the IEEE 24th International Symposium for Design and Technology in Electronic Packaging, Iasi, Romania, 25–28 October 2018; pp. 382–385. [Google Scholar]
  27. Dao, V.Q.; Dinh, M.-C.; Kim, C.S.; Park, M.; Doh, C.-H.; Bae, J.H.; Lee, M.-K.; Liu, J.; Bai, Z. Design of an Effective State of Charge Estimation Method for a Lithium-Ion Battery Pack Using Extended Kalman Filter and Artificial Neural Network. Energies 2021, 14, 2634. [Google Scholar] [CrossRef]
  28. Aravkin, A.; Burke, J.; Pillonetto, G. Optimization viewpoint on Kalman smoothing, with applications to robust and sparse estimation. In Compressed Sensing &amp Sparse Filtering; Springer: Berlin/Heidelberg, Germany, 2014; pp. 237–280. [Google Scholar]
  29. Ilieş, A.; Chindriş, G.; Pitică, D. A Comparison between State of Charge Estimation Methods: Extended Kalman Filter and Unscented Kalman Filter. In Proceedings of the 2020 IEEE 26th International Symposium for Design and Technology in Electronic Packaging (SIITME), Pitesti, Romania, 21–24 October 2020; pp. 376–381. [Google Scholar]
  30. Center for Advanced Life Cycle Engineering (CALCE), University of Maryland, College Park, MD, USA. Available online: https://web.calce.umd.edu/batteries/data, (accessed on 9 November 2020).
  31. Choi, W.; Shin, H.C.; Kim, J.M.; Choi, J.; Yoon, W.S. Modeling and Applications of Electrochemical Impedance Spectroscopy (EIS) for Lithium-ion Batteries. J. Electrochem. Sci. Technol. 2020, 11, 1–13. [Google Scholar] [CrossRef] [Green Version]
  32. Prata, D.M.; Lima, E.L.; Pinto, J.C. Nonlinear Dynamic Data Reconciliation in Real Time in Actual Processes. Comput.-Aided Chem. Eng. 2009, 27, 47–54. [Google Scholar]
  33. Shen, M.; Gao, Q. A review on battery management system from the modeling efforts to its multiapplication and integration. Int. J. Energy Res. 2019, 43, 5042–5075. [Google Scholar] [CrossRef]
  34. Mazumder, P.; Kang, S.M.; Waser, R. Memristors: Devices, Models, and Applications. Proc. IEEE 2012, 100, 1911–1919. [Google Scholar] [CrossRef]
  35. Georgii, I.; Morozova, S.M.; Chrishtop, V.V.; Einarsrud, M.A.; Morozov, M.I. Memristive TiO2: Synthesis, Technologies, and Applications. Front. Chem. 2020, 8, 724. [Google Scholar]
  36. Yang, J.Y.; Pickett, M.D.; Li, X.; Ohlberg, D.A.; Stewart, D.R.; Williams, S. Memristive switching mechanism for metal/oxide/metal nanodevices. Nat. Nanotech. 2008, 3, 429–433. [Google Scholar] [CrossRef]
  37. Hu, L.; Han, W.; Wang, H. Resistive switching and synaptic learning performance of a TiO2 thin film based device prepared by sol-gel and spin coating techniques. Nanotechnology 2020, 31, 155202. [Google Scholar] [CrossRef]
  38. Prodromakis, T.; Peh, B.P.; Papavassiliou, C.; Toumazou, C. A versatile memristor model with nonlinear dopant kinetics. IEEE Trans. Electron Devices 2011, 58, 3099–3105. [Google Scholar] [CrossRef]
  39. Strukov, D.B.; Snider, G.S.; Stewart, D.R.; Williams, R.S. The Missing Memristor Found. Nature 2008, 453, 80–83. [Google Scholar] [CrossRef] [PubMed]
  40. Ascoli, A.; Tetzlaff, R.; Biolek, Z.; Kolka, Z.; Biolkovà, V.; Biolek, D. The Art of Finding Accurate Memristor Model Solutions. IEEE J. Emerg. Sel. Top. Power Electron. 2015, 5, 133–142. [Google Scholar] [CrossRef]
  41. Kim, W.; Lee, P.; Kim, J.; Kim, K. State of Charge and Equivalent Internal Resistance Estimation for a Multi-cell Application based on Cell-Difference-Model. In Proceedings of the 2019 IEEE Energy Conversion Congress and Exposition (ECCE), Baltimore, MD, USA, 29 September–3 October 2019; pp. 2664–2668. [Google Scholar]
  42. Xia, B.; Cui, D.; Sun, Z.; Lao, Z.; Zhang, R.; Wang, W.; Sun, W.; Lai, Y.; Wang, M. State of charge estimation of lithium-ion batteries using optimized Levenberg-Marquardt wavelet neural network. Energy 2018, 153, 694–705. [Google Scholar] [CrossRef]
  43. De Menezes, D.Q.F.; Prata, D.M.; Secchi, A.R.; Pinto, J.C. A review on robust M-estimators for regression analysis. Comput. Chem. Eng. 2021, 147, 107254. [Google Scholar] [CrossRef]
  44. Gan, M.; Chen, C.L.; Chen, G.; Chen, L. On Some Separated Algorithms for Separable Nonlinear Least Squares Problems. IEEE Trans. Cybern. 2017, 48, 2866–2874. [Google Scholar] [CrossRef]
  45. Smith, J.S.; Wu, B.; Wilamowski, B.M. Neural Network Training With Levenberg-Marquardt and Adaptable Weight Compression. IEEE Trans. Neural Netw. Learn. Syst. 2019, 30, 580–587. [Google Scholar] [CrossRef] [PubMed]
  46. Shuai, W.; Li, E.; Wang, H. An equivalent circuit model of a deformed Li-ion battery with parameter identification. Int. J. Energy Res. 2020, 44, 8372–8387. [Google Scholar] [CrossRef]
  47. Zhao, B.; Hu, J.; Xu, S.; Wang, J.; Zhu, Y.; Zhang, L.; Gao, C. Estimation of the SOC of energy-storage lithium batteries based on the voltage increment. IEEE Access 2020, 8, 198706–198713. [Google Scholar] [CrossRef]
  48. Bairwa, L.B.; Pareek, K.; Hampannavar, S.K. Investigation on lithium ion battery equivalent circuit models for dynamic load profiles. Energy Store 2021, 3, e231. [Google Scholar]
  49. Jimenez, A.G.; Sequera, J.C.; Valiente, A.C.; Pulido, J.G.; Seco, E.D. Analysis of Artificial Neural Network Architectures for Modeling Smart Lighting Systems for Energy Savings. IEEE Access 2019, 7, 119881–119891. [Google Scholar] [CrossRef]
  50. Tang, X.; Liu, K.; Wang, X.; Gao, F.; Macro, J.; Widanage, W.D. Model migration neural network for predicting battery aging trajectories. IEEE Trans. Transp. Electrif. 2020, 6, 363–374. [Google Scholar] [CrossRef]
  51. Basterrech, S.; Mohammed, S.; Rubino, G.; Soliman, M. Levenberg-Marquardt Training Algorithms for Random Neural Networks. Comput. J. 2011, 54, 125–135. [Google Scholar] [CrossRef]
Figure 1. Relationship between the impedance representation in EIS as imaginary and real part with equivalent circuits model.
Sustainability 13 11204 g001
Figure 2. Proposed Thevenin Battery Model.
Sustainability 13 11204 g002
Figure 3. Memristor pinched hysteresis loop for current vs. voltage.
Sustainability 13 11204 g003
Figure 4. Flow chart process for iterative LMA with neural network.
Sustainability 13 11204 g004
Figure 5. 25 °C temperature.
Sustainability 13 11204 g005
Figure 6. 45 °C temperature.
Sustainability 13 11204 g006
Figure 7. Battery module test platform.
Sustainability 13 11204 g007
Figure 8. Bode diagrams for the model for the frequency response versus frequency (rads/s).
Sustainability 13 11204 g008
Figure 9. Incremental OCV vs. SOC.
Sustainability 13 11204 g009
Figure 10. The model response as time series.
Sustainability 13 11204 g010
Figure 11. Training state.
Sustainability 13 11204 g011
Figure 12. Neural Network Error obtained histogram.
Sustainability 13 11204 g012
Figure 13. Auto-correlation error.
Sustainability 13 11204 g013
Figure 14. Neural Network best validation performance.
Sustainability 13 11204 g014
Figure 15. The network training regression performance.
Sustainability 13 11204 g015
Table 1. Comparative analysis between modeling methods.
Model TypeProsCons
Stochastic
models
1. excellent battery
recovery description.
2. well describing
the behavior.
3. explain bursty
aging well.
1. unclear quantitative descriptions.
2. lacks uniform framework.
3. limited donations to modeling
dynamics from literature review [5]
4. limited variety of applications.
Electrochemical
models
1. express the chemical and
thermodynamic reactions.
2. accuracy.
3. better aging prediction.
4. The groundwork for
numerous laws
(e.g., Ohm’s laws)
1. computational efficiency.
2. long estimation cycles.
3. complexity.
4. availability of many input
coefficients.
Electrical
models
1. design freedom.
2. easy implementation.
3. integration with complex
simulation.
1. integration of nonlinear behavior.
2. the need of a conversion mechanism.
Memristive
models
1. open model.
2. simpler structure.
3. clearer physical meanings
of parameters
(e.g., SOC and SOH).
4. less calibration.
5. address the nonlinear
concerns of ECM.
the lack of implementation in
commercial software for
simulation purposes because
of its previous unfamiliarity.
Table 2. The coefficients for OCV and SOC fitting function.
CoefficientsValues
P 1 −66.02 (−233.6, 101.6)
P 2 251.3 (−394.6, 897.3)
P 3 −379.2 (−1391, 632.4)
P 4 286.1 (−540.4, 1113)
P 5 −111.5 (−487.3, 264.3)
P 6 21.19 (−72.33, 114.7)
P 7 −1.291 (−12.81, 10.23)
P 8 3.535 (3.01, 4.059)
R-square0.9999
RMSE0.003908
Publisher’s Note: MDPI stays neutral with regard to jurisdictional claims in published maps and institutional affiliations.

