Article

Nutrient and Stoichiometric Characteristics of Aggregates in a Sloping Farmland Area under Different Tillage Practices

1
College of Forestry, Jiangxi Agricultural University, Nanchang 330045, China
2
Key Laboratory of Soil Erosion and Prevention, Jiangxi Institute of Soil and Water Conservation, Nanchang 330029, China
3
College of Resources and Environmental Sciences, Hunan Normal University, Changsha 410081, China
*
Author to whom correspondence should be addressed.
These authors contributed equally to this work.
Sustainability 2021, 13(2), 890; https://doi.org/10.3390/su13020890
Submission received: 9 December 2020 / Revised: 12 January 2021 / Accepted: 13 January 2021 / Published: 17 January 2021
(This article belongs to the Special Issue Sustainable Tropical Crop Science and Agriculture Management)

Abstract

:
Sloping farmland is prevalent in hilly red soil areas of South China. Improper tillage patterns induce decreased soil organic matter, soil aggregate breakdown, and nutrient imbalance, thereby restricting crop production. However, the stoichiometric characteristics could reflect the nutrient availability which was mostly studied on bulk soil. The stoichiometric characteristics of soil aggregates with multiple functions in farmlands has rarely been studied. The study was to reveal the impact of tillage patterns on the size distribution, nutrient levels, and stoichiometric ratios of soil aggregates after 20 years’ cultivation. Soil samples of 0–20 cm and 20–40 cm from five tillage patterns, bare-land control (BL), longitudinal-ridge tillage (LR), conventional tillage + straw mulching (CS), cross-ridge tillage (CR), and longitudinal-ridge tillage + hedgerows (LH) were collected. The elemental content (C, N and P) and soil aggregate size distribution were determined, and the stoichiometric ratios were subsequently calculated. Through our analysis and study, it was found that the nutrient content of >2 mm soil aggregates in all plots was the highest. In the hedgerow plots, >2 mm water-stable soil aggregate content was increased. Therefore, LH plots have the highest content of organic matter and nutrients. After 20 years of cultivation, stoichiometric ratio of each plot showed different changes on soil aggregates at different levels. the C:N, C:P, and N:P ratios are lower than the national average of cultivated land. Among of them, the stoichiometric ratio in the LH plot is closer to the mean and showed better water-stable aggregate enhancement. Therefore, longitudinal-ridge tillage + hedgerows can be recommended as a cultivation measure. This study provides a reference for determining appropriate tillage measures, balancing nutrient ratios, and implementing rational fertilization.

1. Introduction

Sloping farmland is the main type of cultivated land in hilly red soil areas in South China. Unreasonable tillage leads to serious soil erosion, nutrient losses [1], and nutrient cycle imbalances in agricultural ecosystems [2,3]. These processes aggravate nutrient deficiencies and fertility attenuation processes in sloping farmland. Therefore, farmers have pursued higher yields by adjusting planting systems and applying excessive fertilizer inputs to achieve the maximum use efficiency from cultivated land [4]. Land use and related management practices, such as crop planting, fertilization and soil improvement, can directly affect soil structure and properties through the destruction and aggregation of aggregates [5]. Aggregates are the basic unit of soil structure [6]. The formation of soil aggregates is the result of bio-physical-chemical processes controlled by environmental factors [7]. Soil particle size distribution and nutrient levels directly affect soil structure and soil quality. Tillage measures lead to differences in soil structure, aggregate particle size, and levels of carbon, nitrogen, phosphorus and other nutrients [8,9]. Therefore, it is of great significance to understand the composition and distribution of cultivated soil aggregates and to clarify the carbon and nutrients contents and distribution in aggregates of each particle size. It could provide a microcosmic explanation for the coupling equilibrium mechanism between nutrient elements at the aggregate level [10].
Ecological stoichiometry is an important indicator to illustrate the regulation of ecosystem functions and the circulation of biogeochemical elements; it can be used to track changes in ecosystem structure and nutrient circulation [11,12]. Therefore, ecological stoichiometric ratios provide the most suitable approach for investigating the contents, proportional relationships and change trends of chemical elements in the ecological processes of sloping farmland soil [13]. As an important part of ecosystems, soil plays a key role in the growth of crops. The study of soil ecological chemometrics can reveal nutrient availability and restriction conditions [14], which are of great significance for understanding the cycling of C, N and P and the role of soil in the biogeochemical cycle of nutrient elements [12,15]. At present, studies have mainly focused on the global or national scales [16,17], different ecosystems [18,19,20], different vegetation types [21,22] and the effects of human interference [23,24], as well as the ecological stoichiometric characteristics of soil C, N and P. And studies on soil carbon, nitrogen and phosphorus dynamics in agricultural ecosystems has become a hot topic. In recent years, land use [25], farming systems [26], fertilization methods [27] and returning plant residues to fields [28] have been studied. Studies on soil stoichiometric characteristics have also achieved some good results [29].
However, there have been few studies on the changes in soil aggregate particle size and the stoichiometry of soil aggregate nutrients under different long-term tillage measures. Therefore, this study selected several typical tillage measures applied in similar site conditions as the research objects, analyzed the distribution trends of soil aggregates, and studied the mass fractions and stoichiometric ratios of soil C, N and P under the different tillage treatments. The study revealed the effects of tillage measures on the distribution of soil aggregates, nutrient changes and stoichiometric characteristics, clarified the effect of nutrient restrictions in sloping farmland soil, and provides a reference for determining appropriate tillage measures, balancing nutrient ratios, and implementing rational fertilization in sloping farmland in hilly red soil areas.

2. Materials and Methods
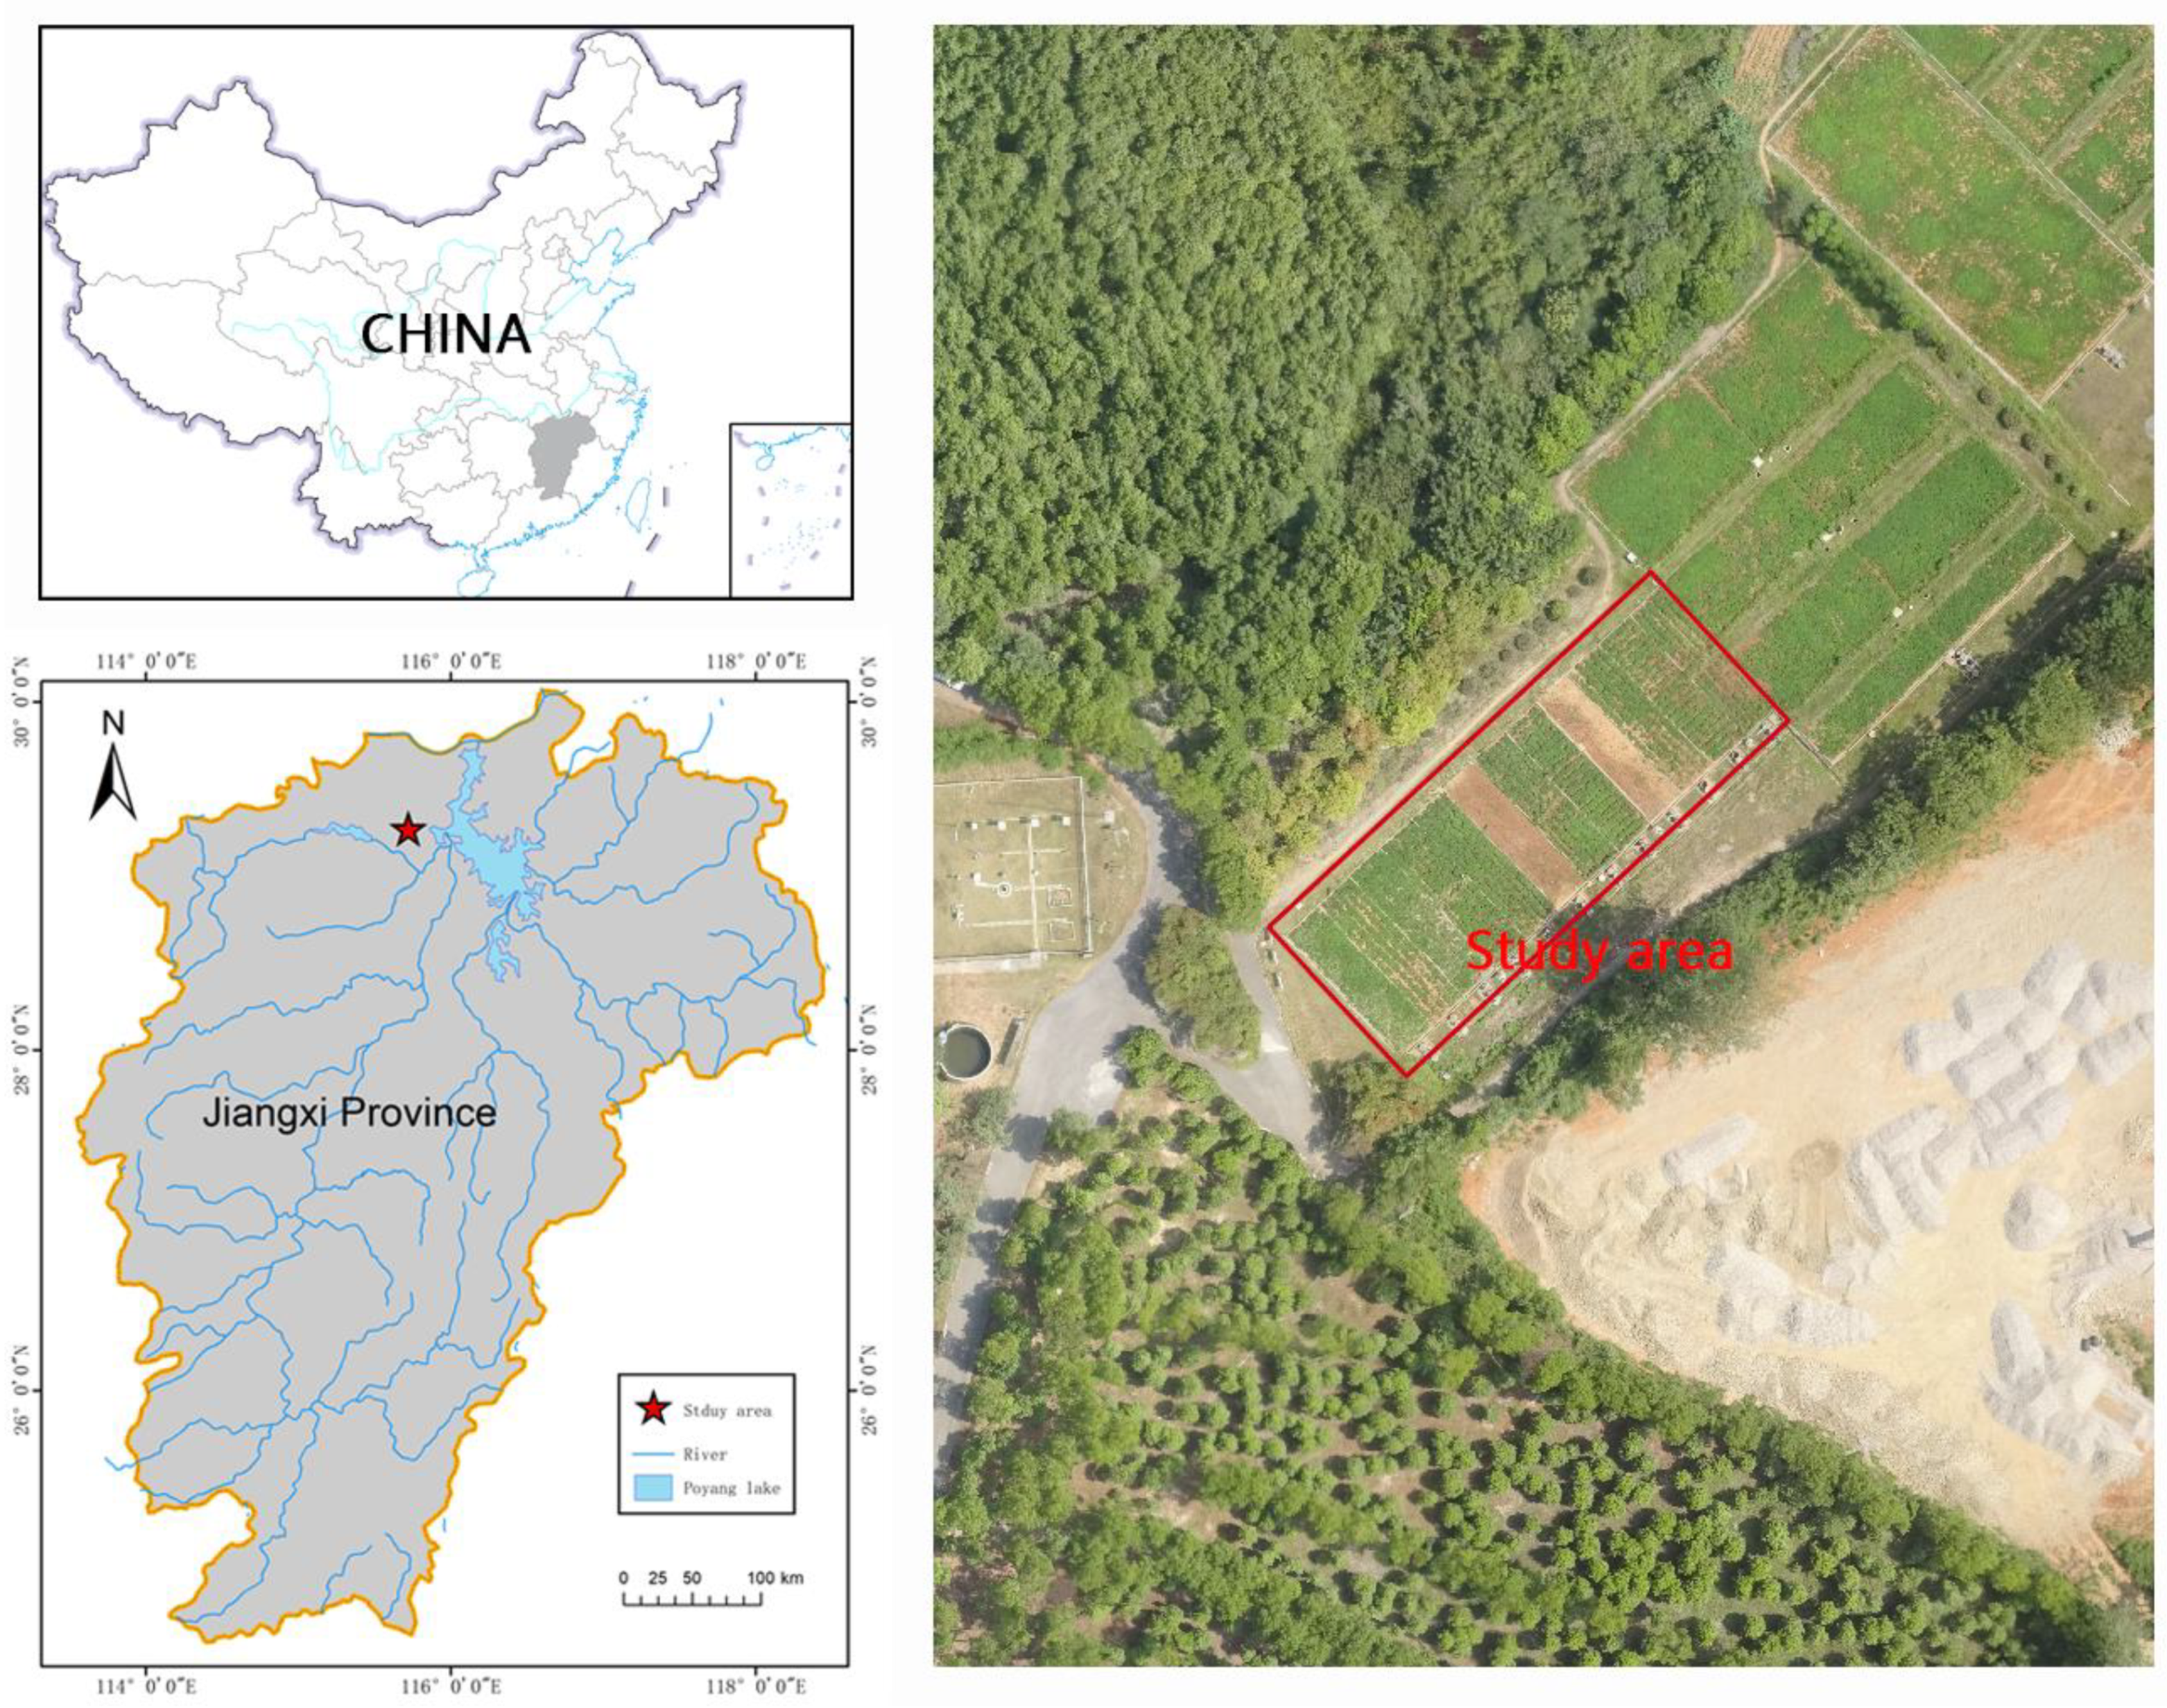
2.1. Study Area

The study area is located in northern Jiangxi Province in the De’an Yan gully watershed, on the west bank of the Poyang Lake ecosystem at 115°42′38″~115°43′06″ E, 29°16′37″~29°17′40″ N, with a total area of approximately 80 hm2 (Figure 1). This region is located in the subtropical monsoon climate zone, which experiences abundant rainfall (annual average rainfall of 1350.9 mm), an annual average temperature of 16.7 °C, an annual sunshine duration of 1650–2100 h, and an annual average frost-free period of 249 days. The geomorphology is shallow, with an elevation of 30–100 m and a slope of 5–25°.
The parent material of the soil is mainly quaternary red clay, and the zonal vegetation is a subtropical evergreen broad-leaved forest. According to WRB soil classification standard, the soil in this study area belongs to Ferralsols. Table 1 shows the soil physical and chemical properties of this study area.

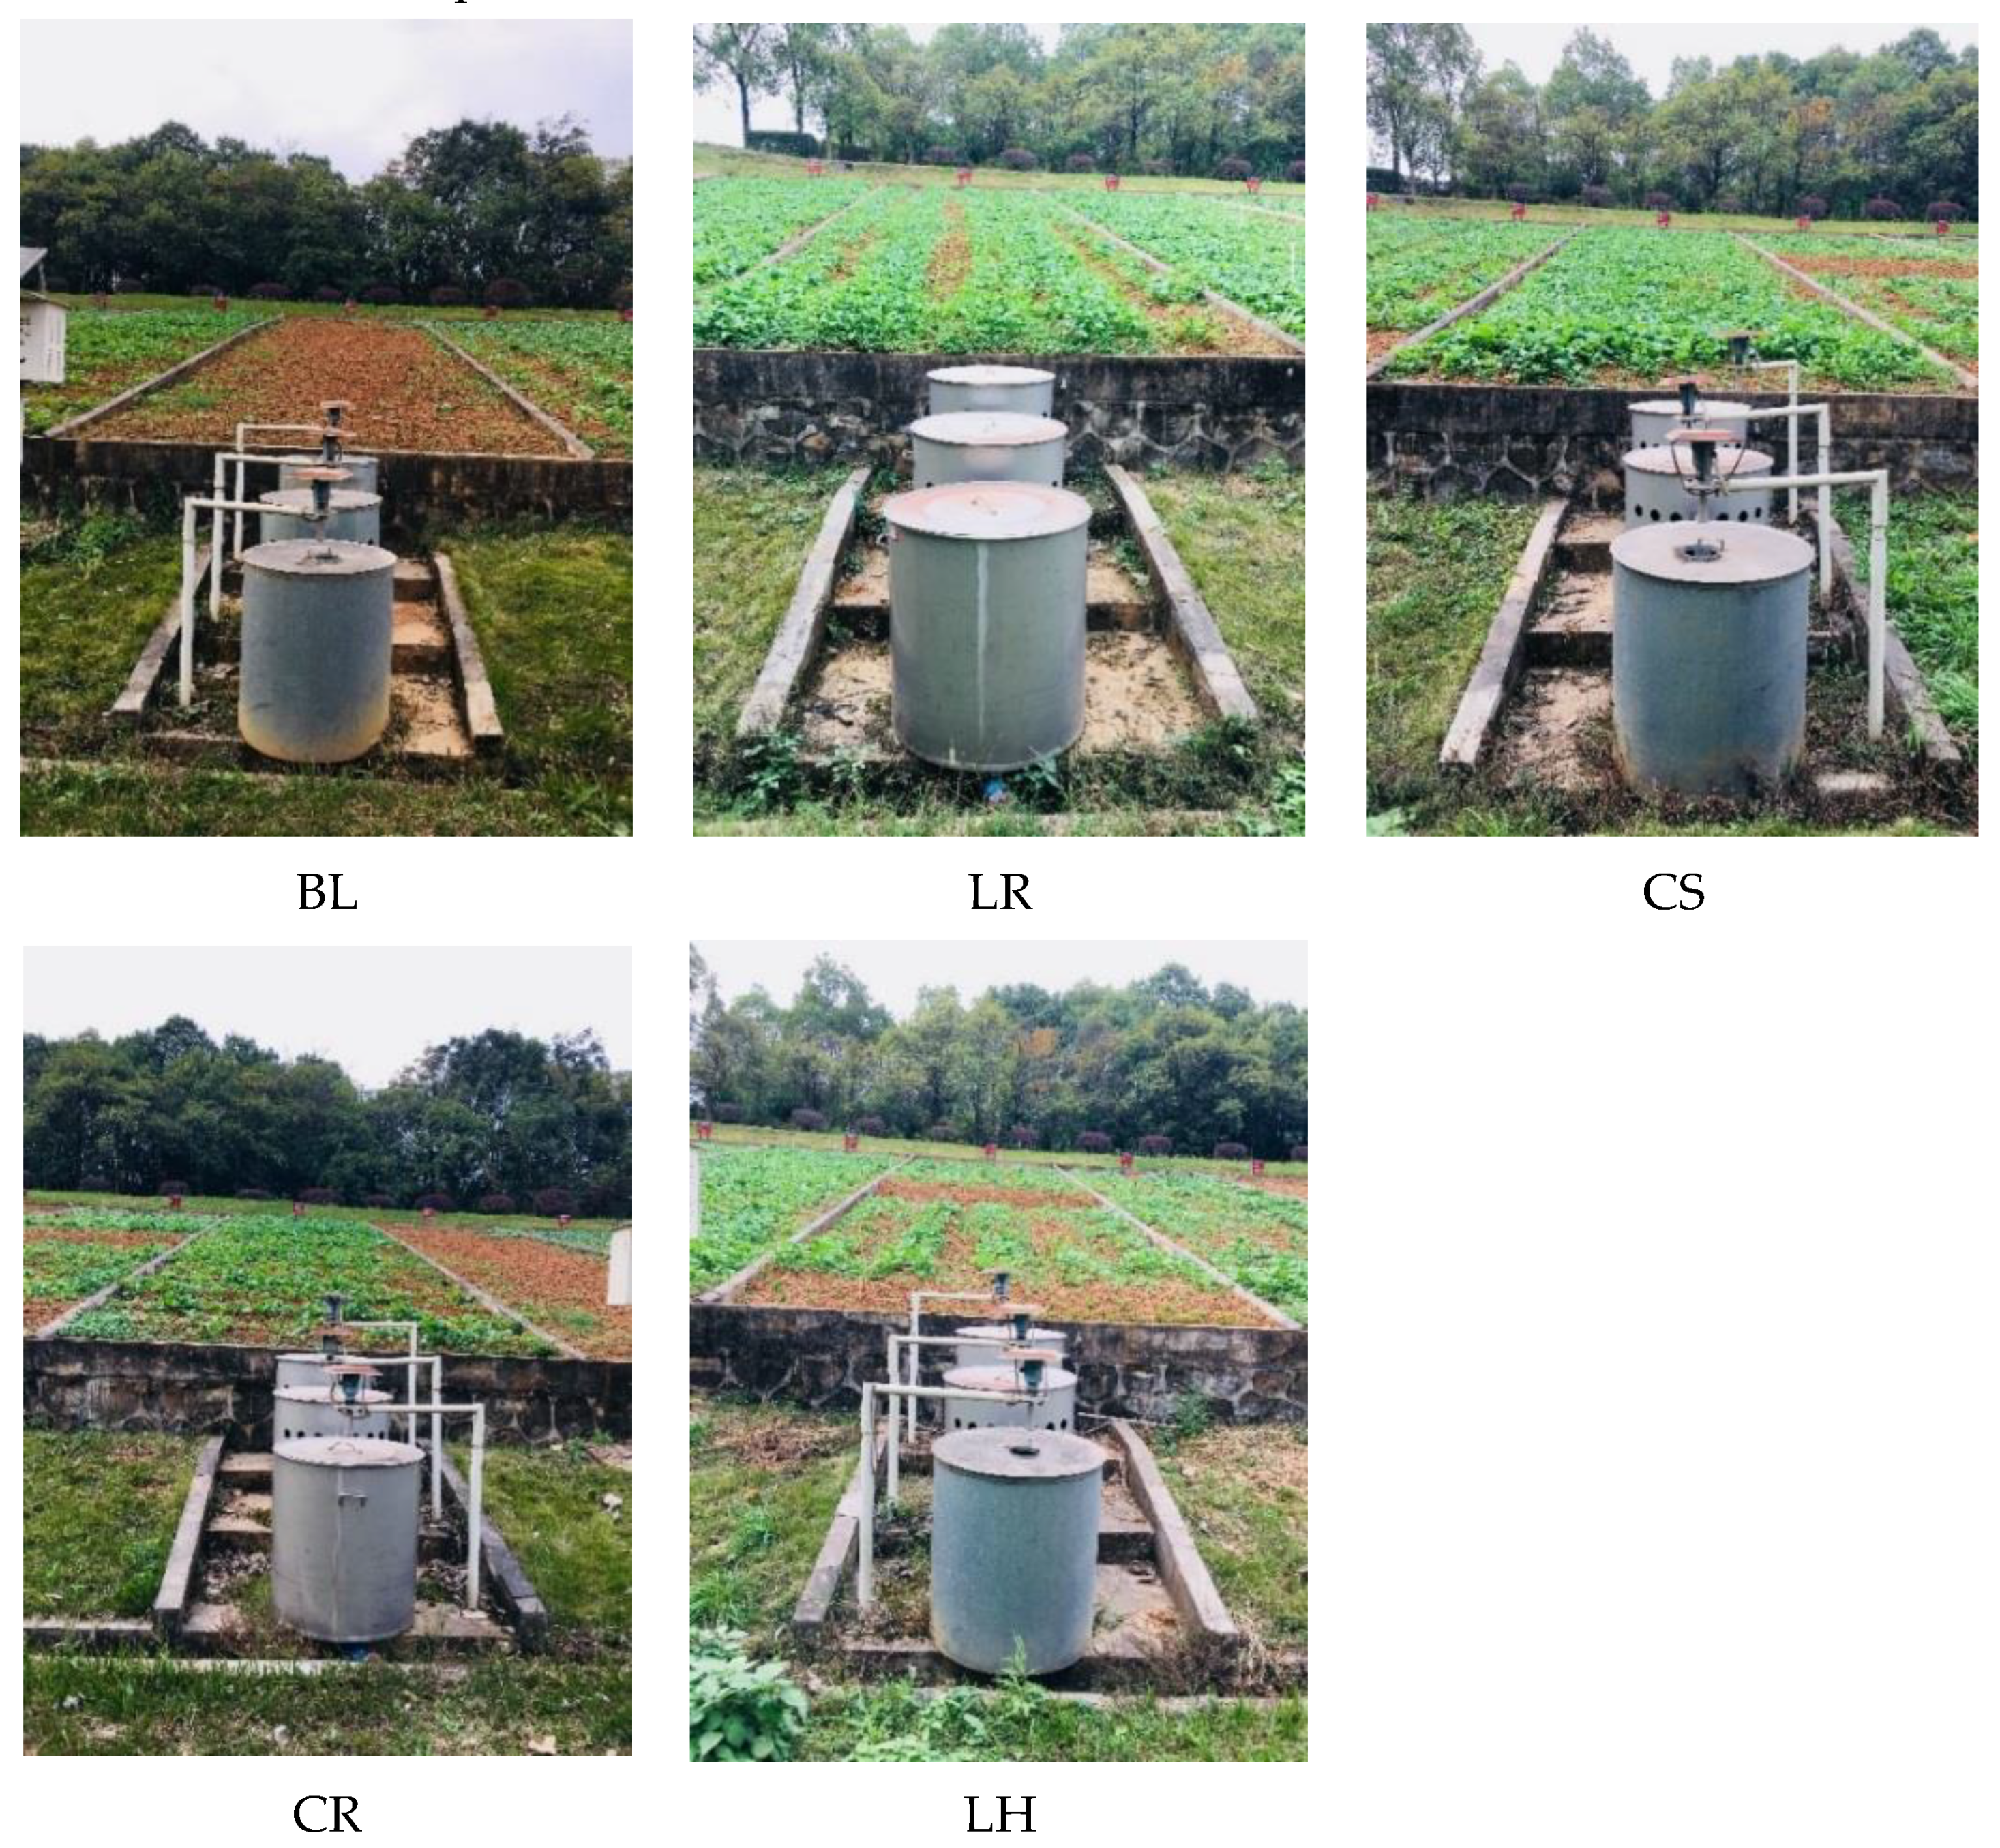
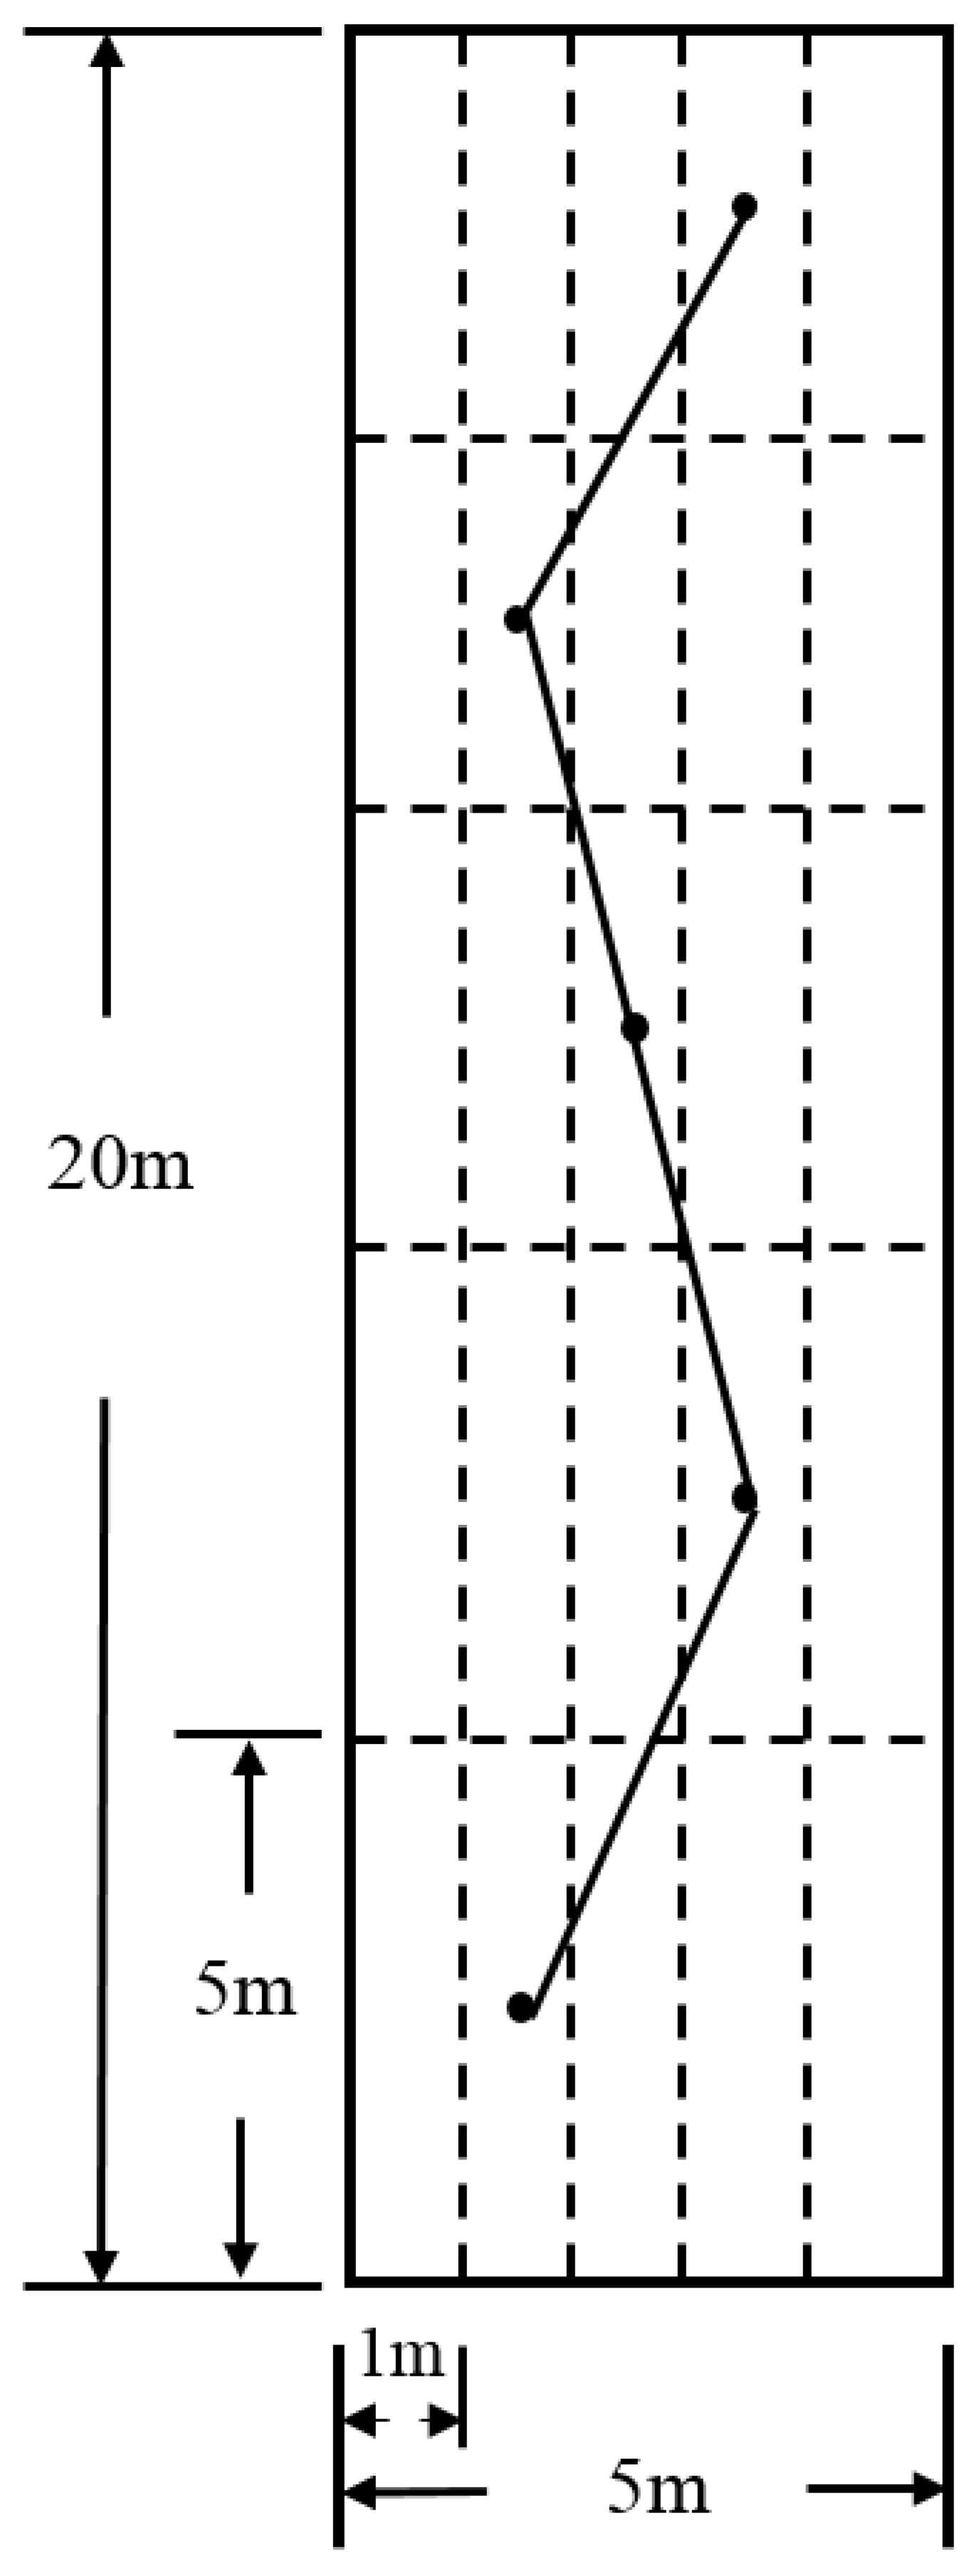
2.2. Experimental Plot Design

In this study, the field plot experiments were conducted in the Jiangxi Soil and Water Conservation Ecological Science and Technology Park. The plots were randomly arranged. Ten standard runoff plots with slopes of 10° and uniform soil thickness and physical and chemical properties were established. The horizontal width of each plot was 5 m, the horizontal length was 20 m, and ridges with a thickness of 12 cm were established all around each plot. The ridges were built with clay red brick to 20 cm above the ground and 30 cm deep. A rectangular water catch tank and a circular collection bucket were set below the plot to intercept the runoff and sediment from the plot. Five treatments were designed, including bare land (BL), longitudinal-ridge tillage (LR), conventional tillage + straw mulching (CS), cross-ridge tillage (CR), and longitudinal-ridge tillage + hedgerow (LH) (Figure 2). Each measure was repeated twice (Table 2). The bare land was plowed and fertilized as in the other sloping farmland plots but did not have ridges. The chemical fertilizer applied in the plot was a combination of urea (3.0 kg/100 m2), superphosphate (6.0 kg/100 m2) and potassium chloride (2.3 kg/100 m2). Table 2 shows the details of the treatments in the experiment.
Planting system: Peanuts were planted in mid-May in every year (after the rape was harvested). All plots except the no-till plots were plowed to a depth of 20 cm. At the end of August, the peanuts were harvested after ripening, and the peanut straw was not returned to the field. Rapeseed planting was completed before October 1 in mid- to late September in every year. Rapeseed harvesting was performed in the first or second half of May according to grain maturity and weather conditions.
Soil sampling method: In this study, the S-type sampling method was used to sample the soil from the upper and lower soil layers (0–20 cm and 20–40 cm). In the ridge plots and plots with hedgerows, soil samples of the same amount were taken from on and off the ridges and mixed evenly. Finally, all soil samples from each plot were mixed, and approximately 1 kg of soil samples was obtained from each plot by the quartering method. Detailed sampling scheme is shown in Figure 3.

2.3. Soil Sample Treatment and Determination Methods

The soil physical and chemical indexes were determined by referring to the soil Agricultural Chemical Analysis Method [30]. The contents of aggregates of different particle sizes were determined by dry and wet sieving. The soil organic carbon (SOC) contents of the soil and the wet-sieved aggregates were determined by the potassium dichromate oxidation method. The total nitrogen (TN) contents in the soil and the wet-sieved aggregates of different particle sizes were determined by the sulfuric acid-perchloric acid-sodium salicylate colorimetric method. The sulfuric acid-perchloric acid digestion-molybdenum-antimony resistance colorimetry method was used to determine the total phosphorus (TP) contents of the soil and the wet-sieved aggregates.
According to the aggregate composition determination method in the agricultural testing standards of the People’s Republic of China [31], after wet sieving, the soil aggregates of various sizes were categorized into >2 mm, 1–2 mm, 0.5–1 mm, 0.25–0.5 mm, 0.106–0.25 mm and <0.106 mm size classes and then dried in an oven at 60 °C for the determination of their nutrient (C, N, and P) contents.

2.4. Data Processing Methods

The regression analysis was conducted with SPSS software (SPSS 11.0 for Windows; SPSS Inc., Chicago, IL, USA), and the graphs were drawn with OriginPro and Excel software. Multiple comparisons were performed, and one sample T-test was adopted for the significance comparison between among different tillage practices.The least significant difference (LSD) method was used for the multiple comparison and binary analysis of variance at the 0.05 level.

3. Results

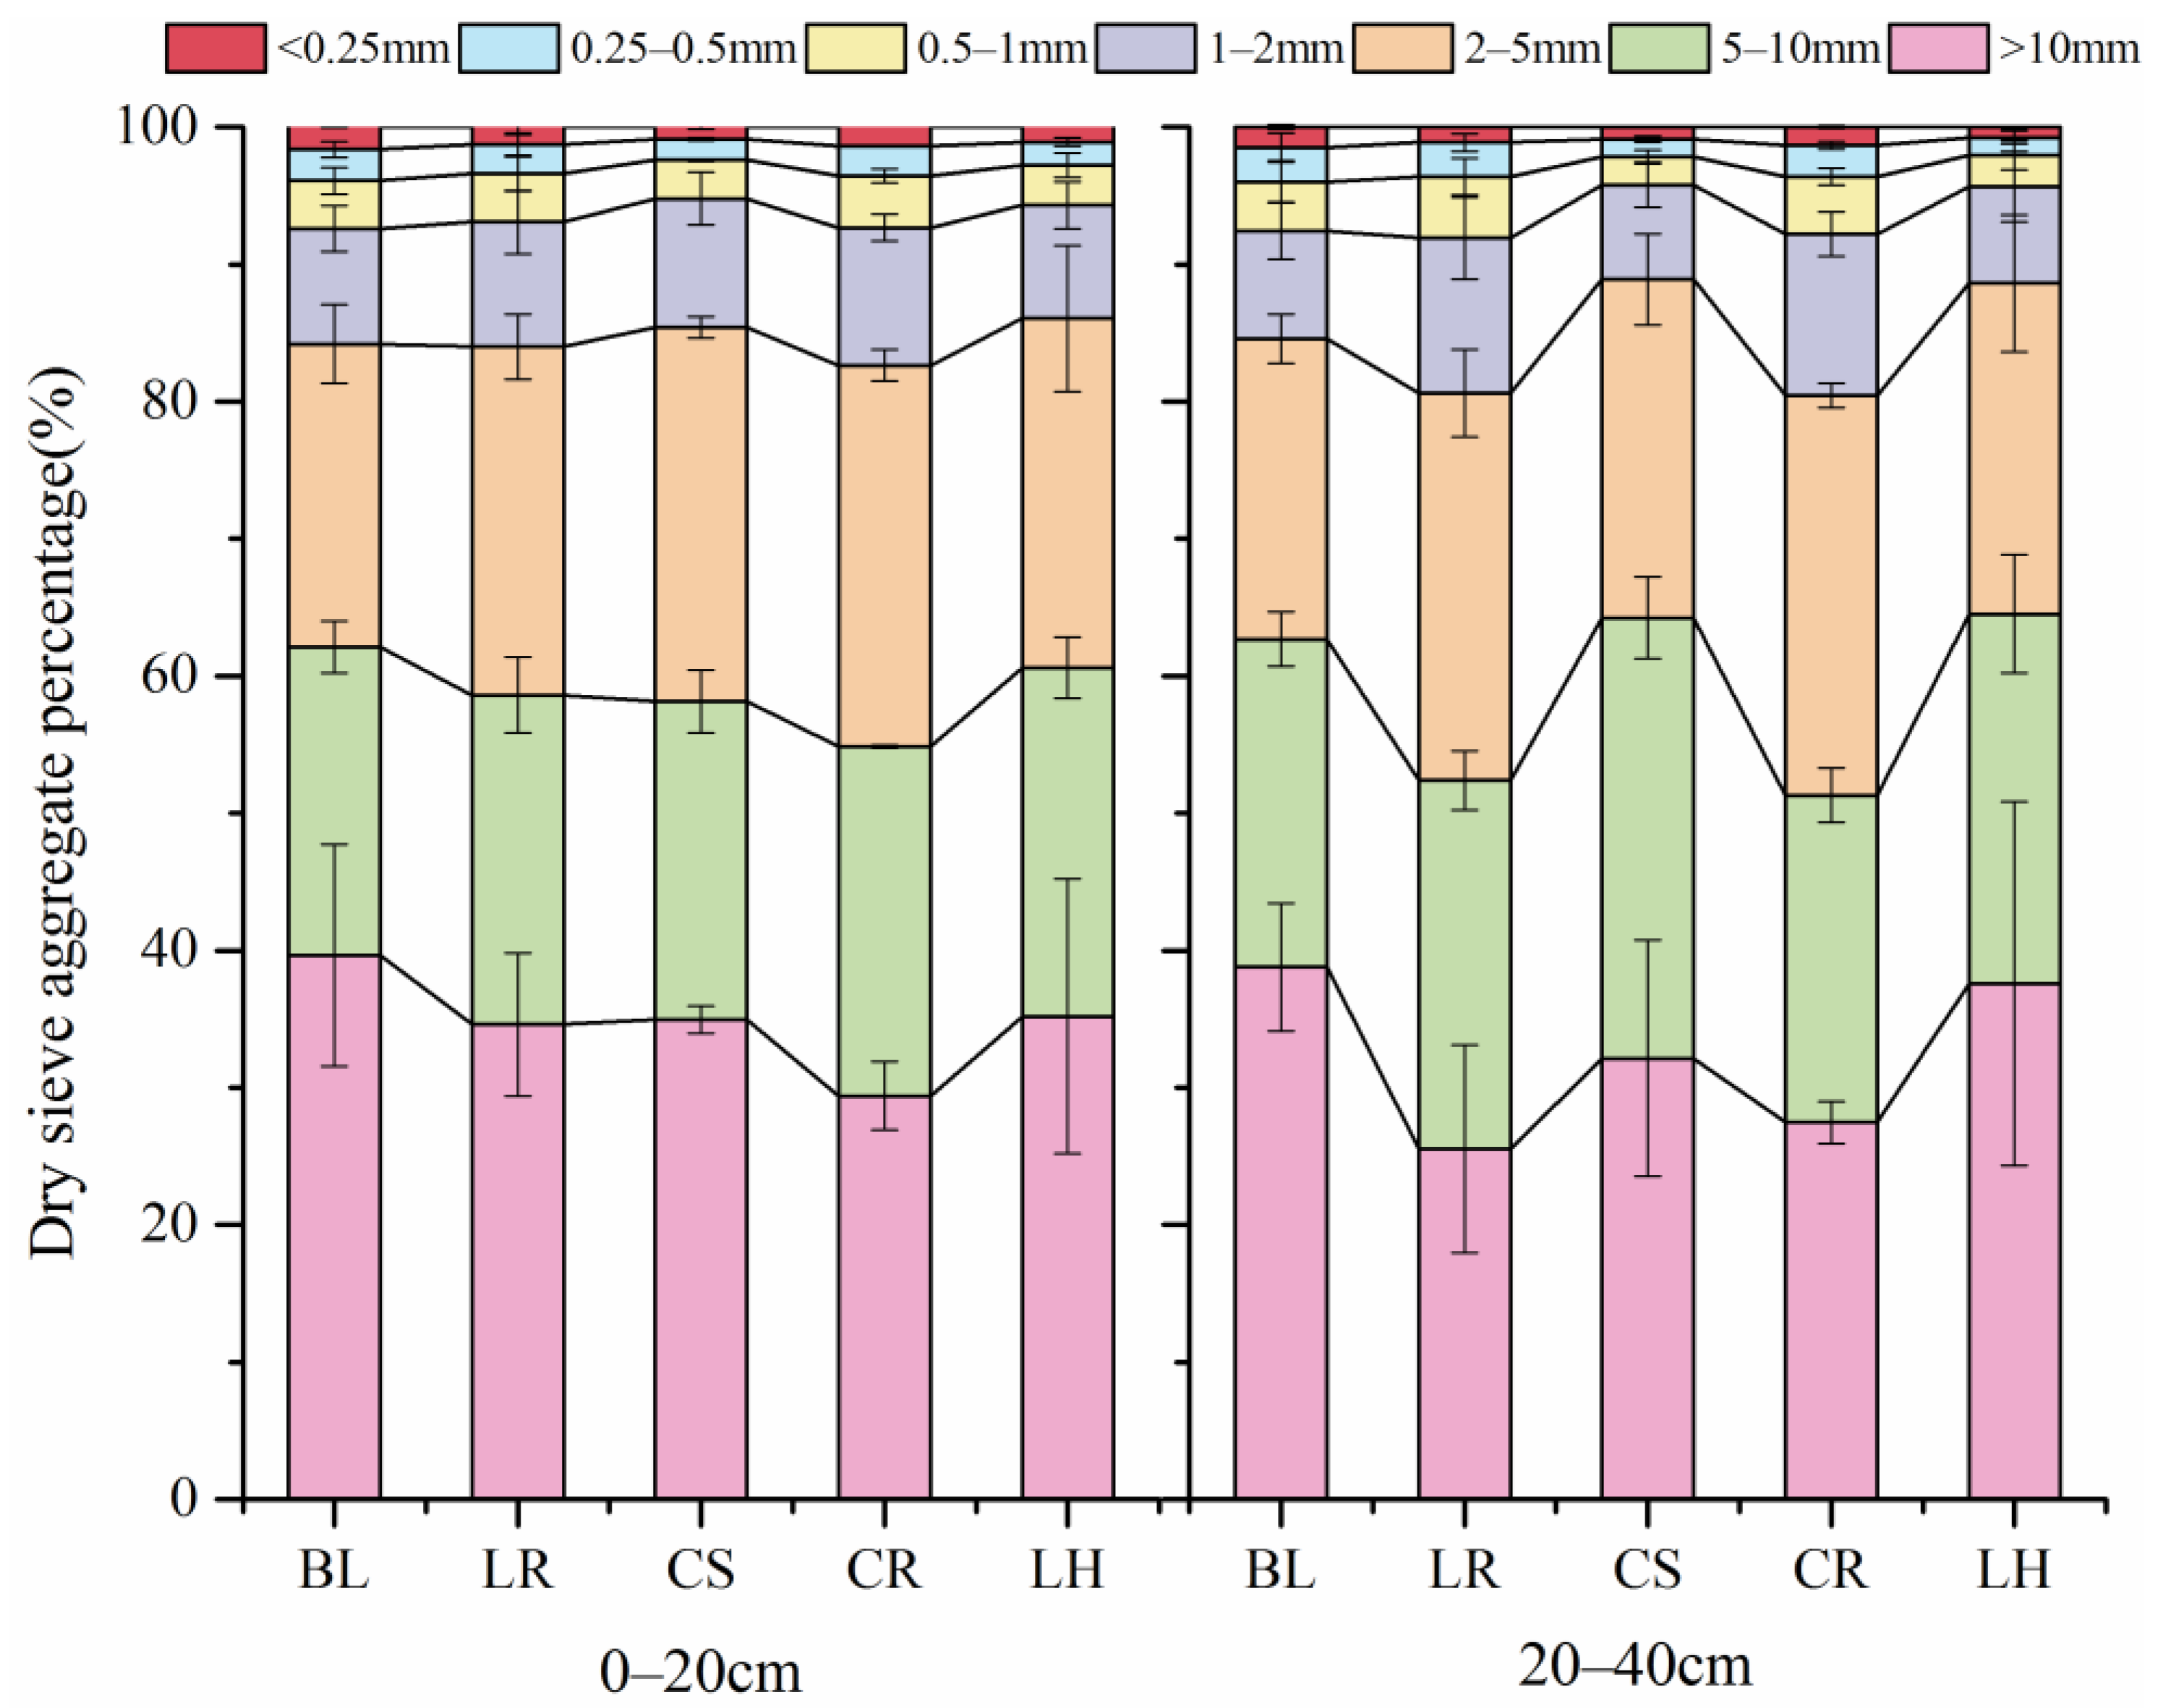
3.1. Aggregate Particle-Size Proportions in the Tillage Plots

3.1.1. Dry-Sieved Aggregates

As shown in Figure 4, large, >0.25 mm aggregates accounted for more than 98% of the total aggregates in the dry-sieved soil from 0–20 cm under the different tillage measures. The large aggregates of >0.25 mm were mainly in the >10 mm, 5–10 mm and 2–5 mm size classes, and the sum of the three aggregate size classes (namely, the >2 mm aggregates) accounted for more than 80% of the total aggregates. The trends of aggregates in the 20–40 cm dry-sieved soil were similar to those in the 0–20 cm dry-sieved soil. In the same tillage treatment, the proportion of aggregates in the >2 mm and >0.25 mm size classes between the dry-sieved 0–20 cm and 20–40 cm soils were not significantly different.
Compared with those in the dry-sieved soil in BL (0–20 cm), the >2 mm aggregates in CS and LH were slightly more abundant, with proportions of 1.5% and 2.2%, respectively. Compared with those in the dry-sieved soil at 20–40 cm in BL, the >2 mm aggregates in CS and LH were slightly more abundant, with proportions of 5.1% and 4.8%, respectively. However, there was no significant increase or decrease in the aggregate ratio of >0.25 mm in the treatments compared with that in BL.

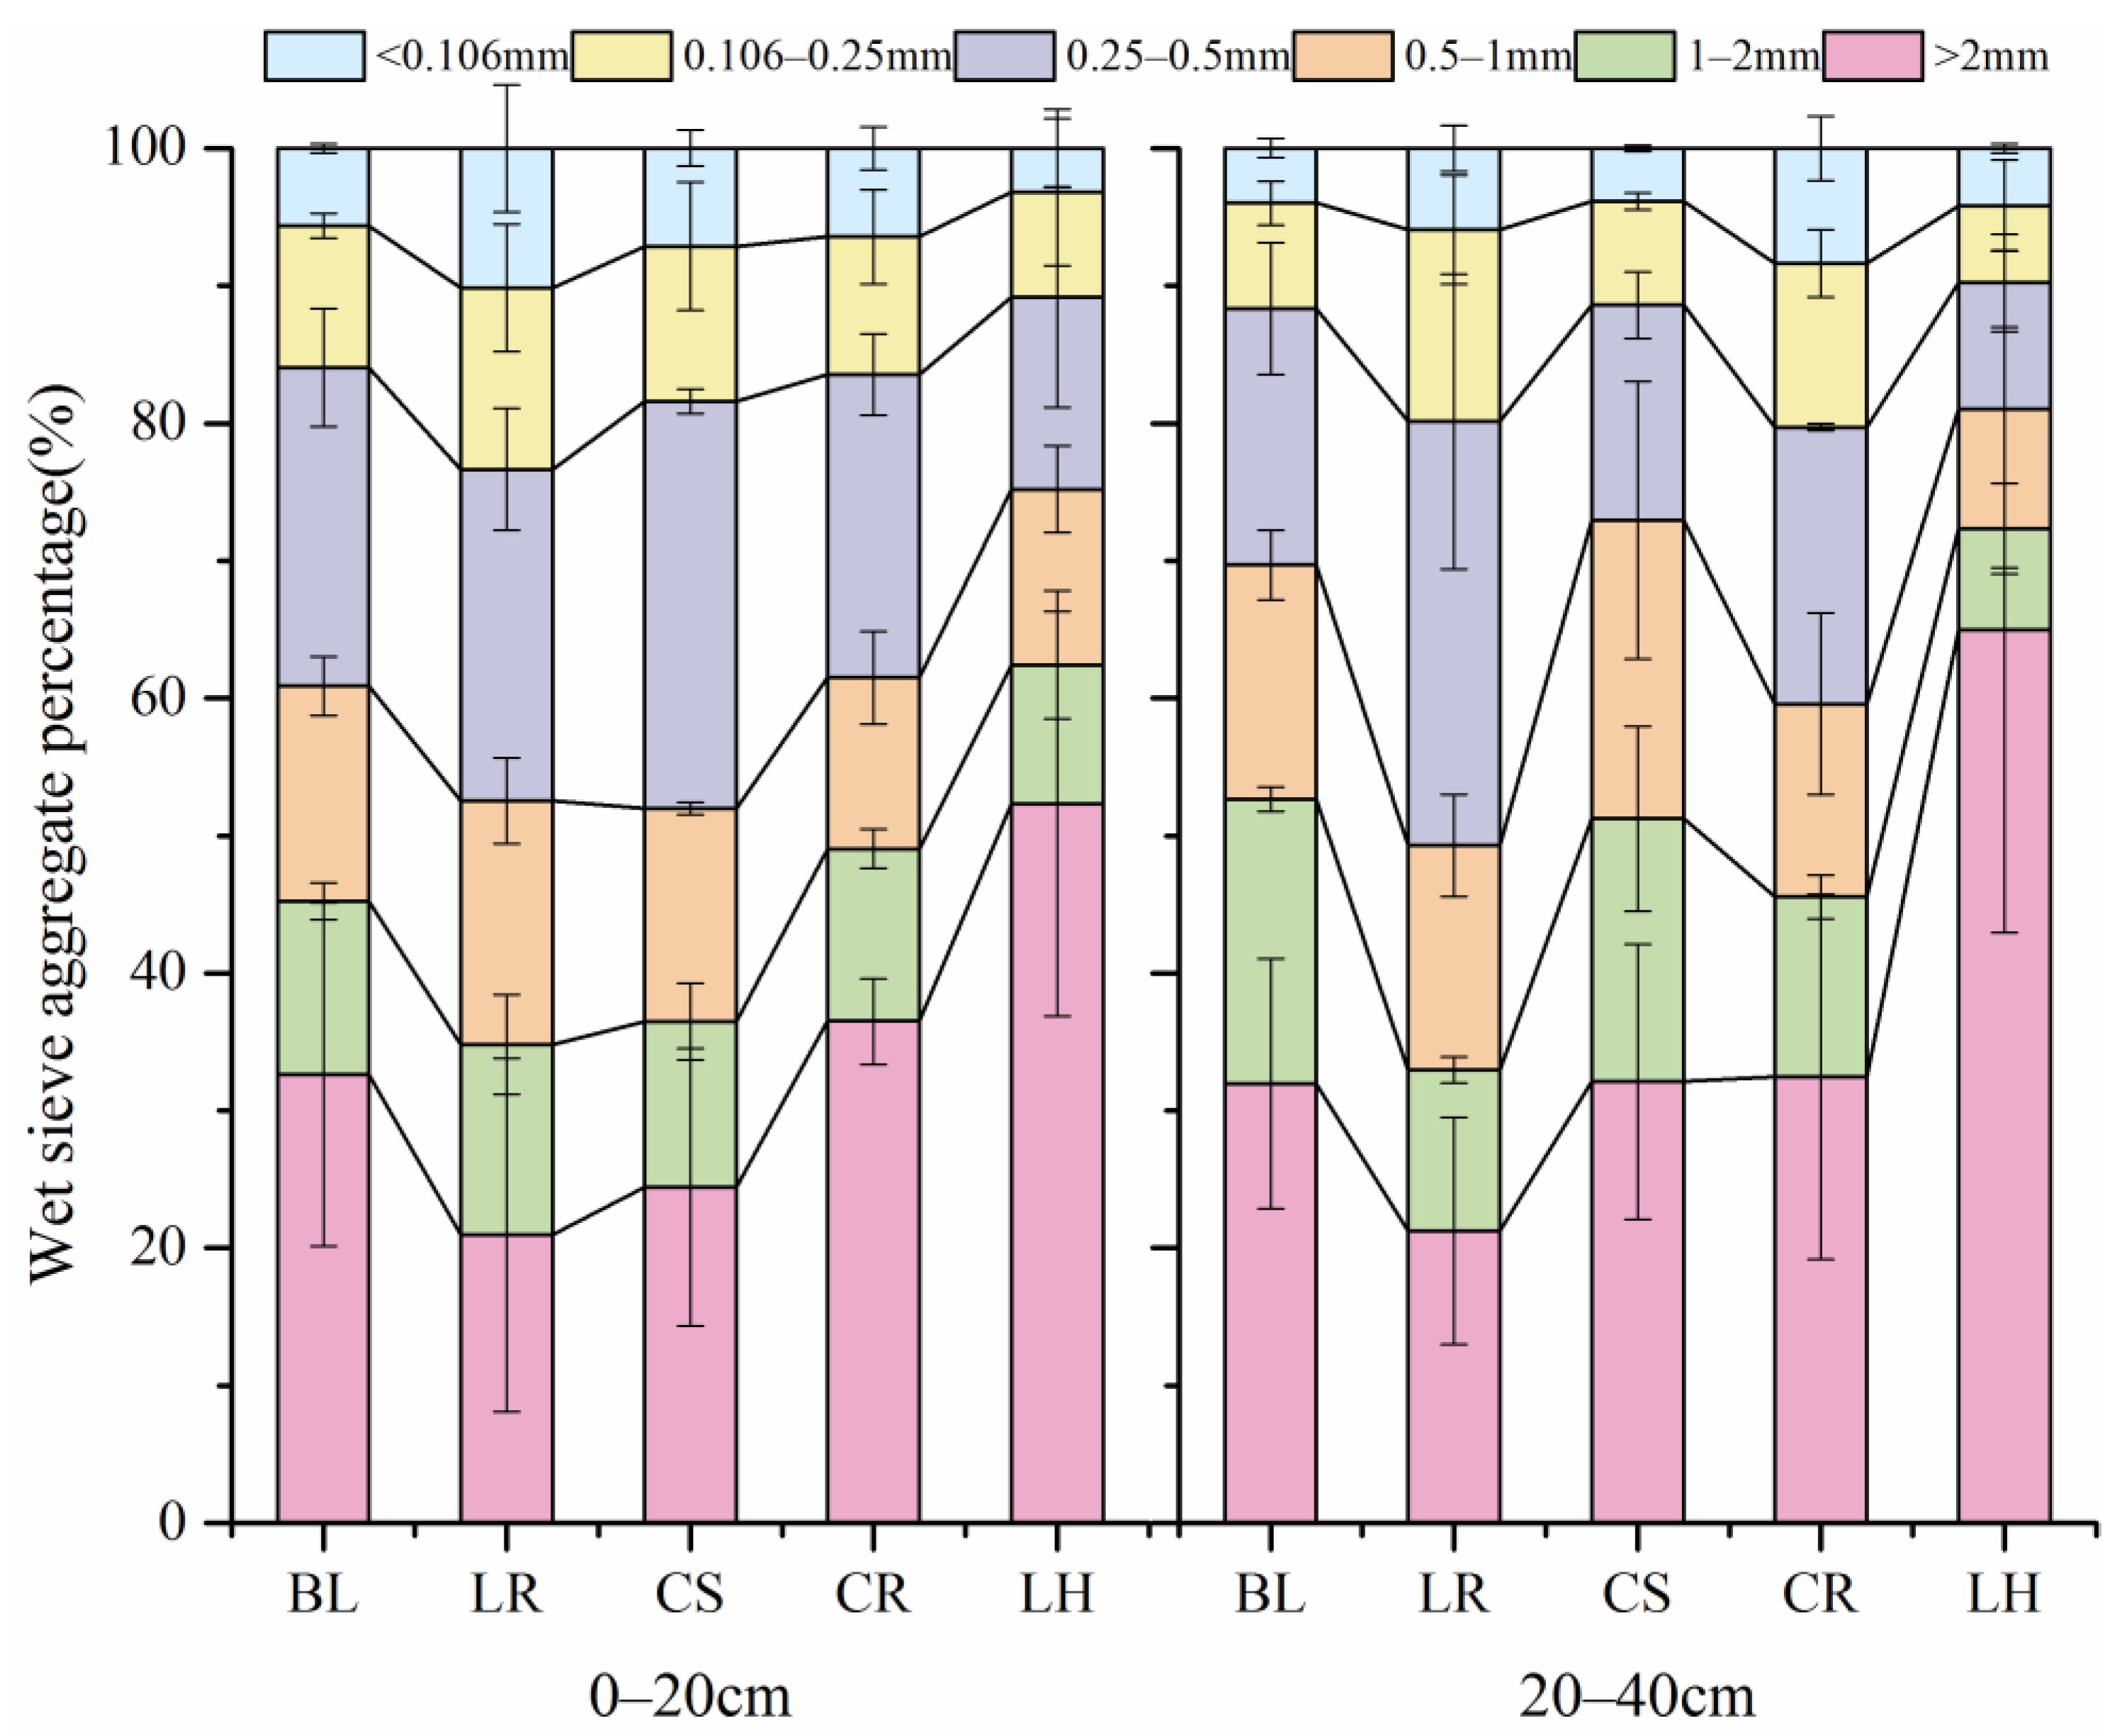
3.1.2. Wet-Sieved Aggregates

As shown in Figure 5, the large aggregates of >0.25 mm dominated in the wet-sieved soils from 0–20 cm under the different tillage measures, accounting for more than 80% of the total aggregates. The >2 mm and 0.25–0.5 mm aggregates made up the main proportion of the large aggregates, accounting for more than 50% of the total aggregates. Compared that in the with 0–20 cm wet-sieved soil, the proportion of >0.25 mm and > 2 mm wet-sieved aggregates in the 20–40 cm soil was slightly higher. The proportion of >0.25 mm wet-sieved aggregates in the soil in the LR plot was 7.0% than that in BL, while the proportion of 2 mm wet-sieved aggregates in the LH plot was 12.6% higher.
Compared with those in the 0–20 cm wet-sieved soil in BL, the proportions of >0.25 mm and >2 mm aggregates in LH were 6.1% and 60.5% higher, respectively; those in the remaining plots were lower than those in BL to different extents. Compared with that in the 20–40 cm wet-sieved soil in BL, the proportions of >0.25 mm aggregates in the other tillage plots were not substantially different. The proportion of >2 mm aggregates in the 20–40 cm soil in the LH plot increased the most, by 103.3%, compared with that in BL. The results showed that CR and LH increased the proportion of large, >2 mm aggregates in the 0–20 cm and 20–40 cm soil layers.

3.2. Soil and Aggregate Nutrient Contents under Tillage Measures

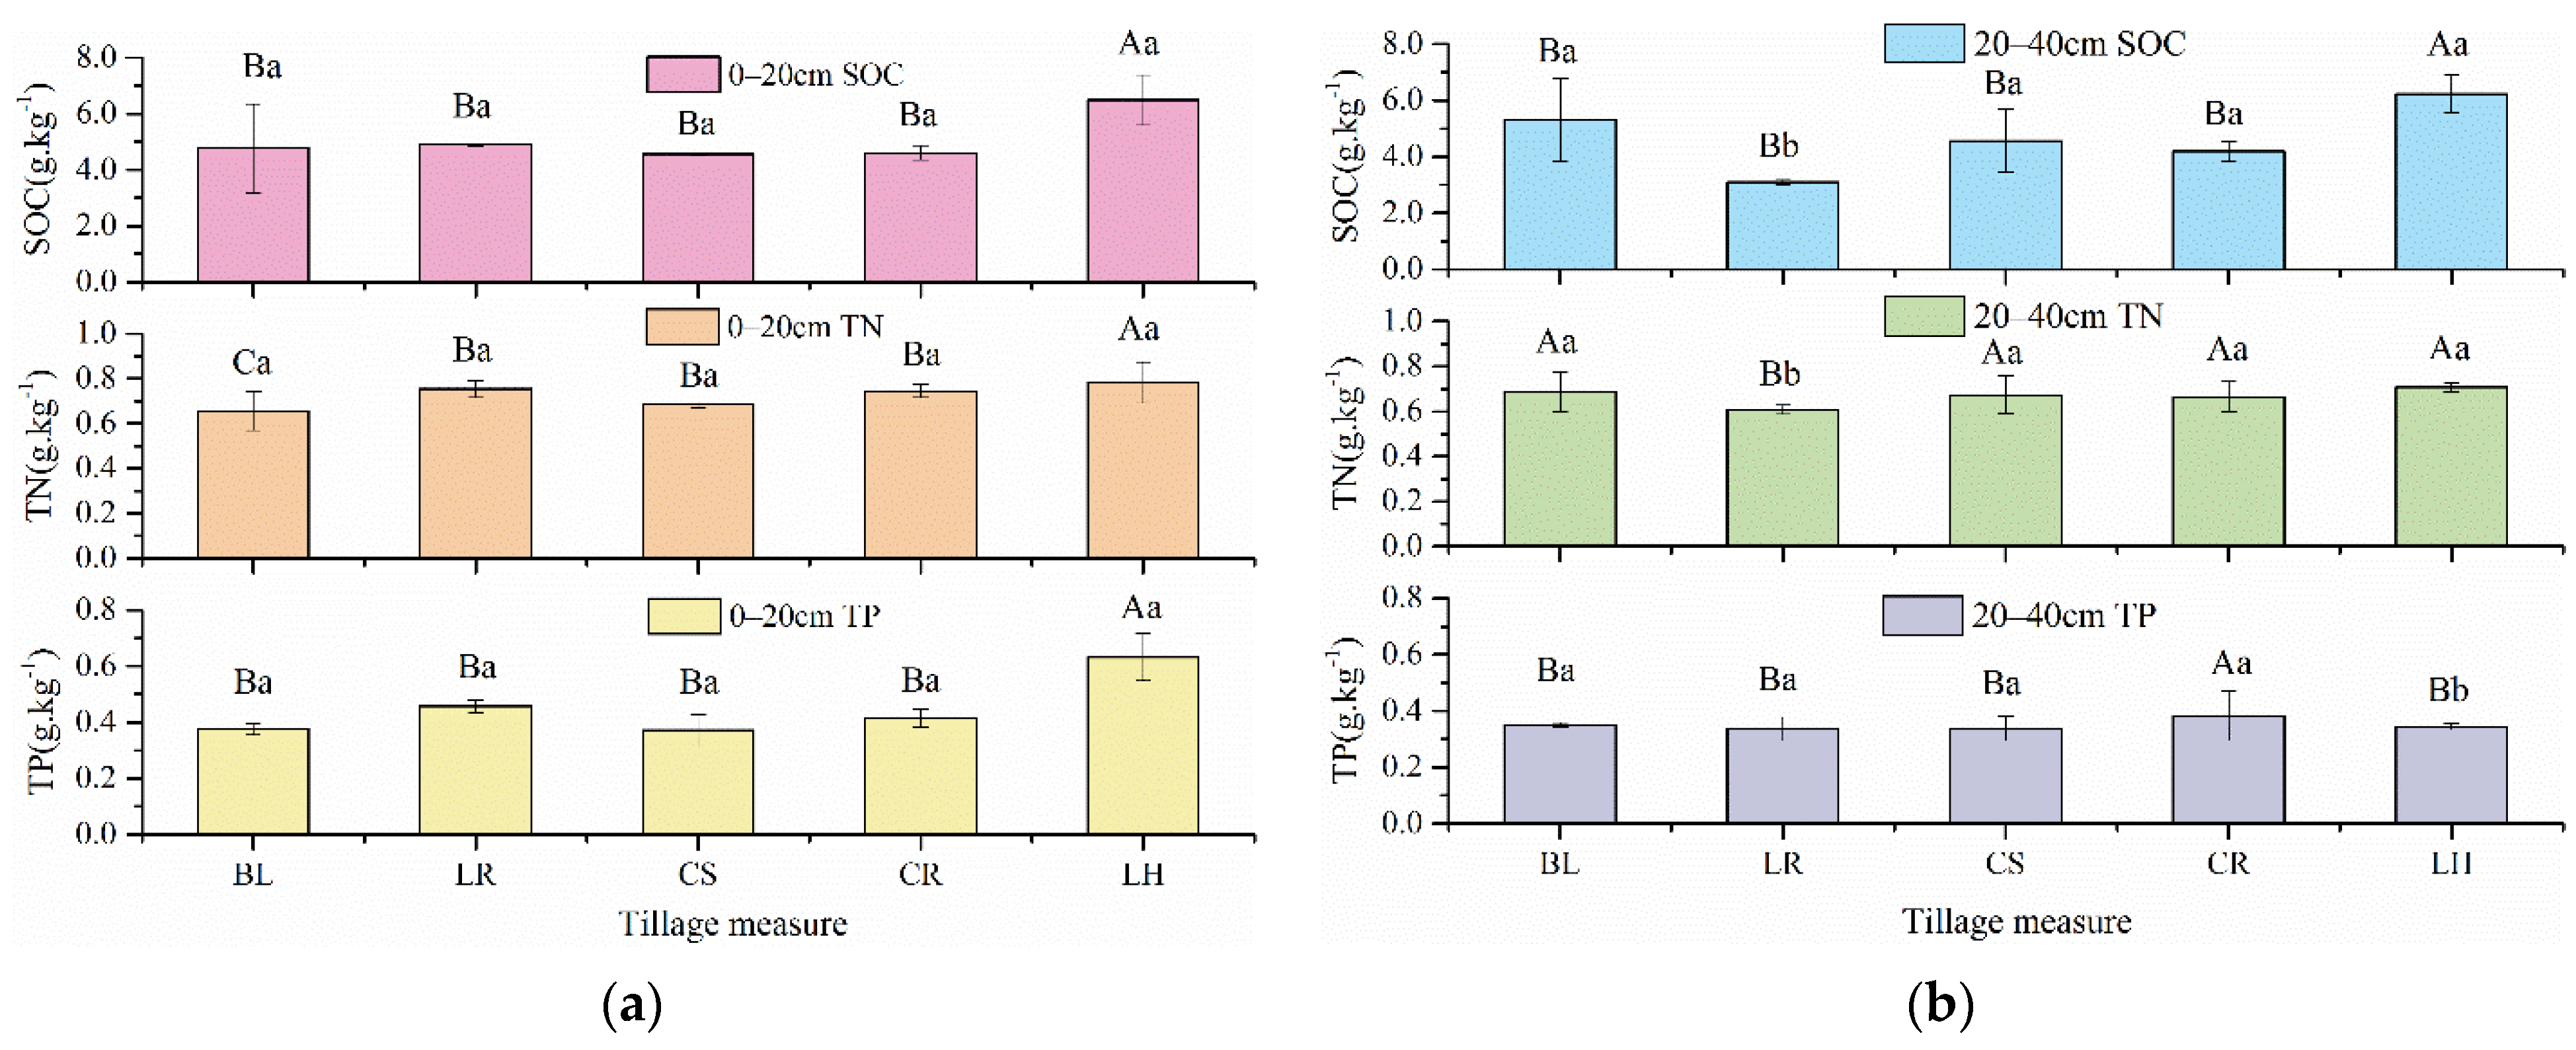
3.2.1. Soil Nutrient Content

Figure 6 shows that the 0–20 cm SOC content increased significantly only in LH (p < 0.01), by 36.2%, compared with that in BL. In the 20–40 cm soil, the SOC content in LH was still significantly higher than that in BL (p < 0.01), by 17.1%, while the SOC content in the other plots was lower than that in BL.
Compared with that in BL, the 0–20 cm soil TN contents in the other tillage measure plots were significantly higher, and the soil TN content in LH was significantly higher than that in the other plots (p < 0.01), by 19.3%. Compared with that in BL, there was no significant difference in the 20–40 cm soil TN contents in the other tillage measure plots. The TN content decreased throughout the experiment in all tillage measure plots except the LH plot.
Compared with that in the 0–20 cm soil in BL, the TP content in LH was significantly higher p < 0.01), by 103.8%. Compared with that in the 20–40 cm soil in BL, the TP content of CR was significantly higher (p < 0.01), by 9.3%.
Except in BL, the contents of SOC and TN in the 0–20 cm soil layer were higher than those in the 20–40 cm soil layer. The SOC content in the BL, LR, CS, CR and LH plots changed by −10.3%, 58.2%, −0.1%, 9.8% and 4.3% between layers, respectively, and the TN content changed by −4.3%, 24.2%, 1.8%, 12.1% and 10.6%. However, there was a significant difference between the two soil layers only in LR (p < 0.01). The TP content in the 0–20 cm soil layer was higher than that in the 20–40 cm soil layer. Compared with the TP content in the 20–40 cm soil, the TP content in the BL, LR, CS, CR and LH plots in the 0–20 cm soil was 7.4%, 35.8%, 10.0%, 7.8% and 122.6% higher, respectively. However, there was a significant difference between the two soil layers only in LH (p < 0.01).

3.2.2. Aggregate Nutrient Content

As shown in Table 3, the >2 mm aggregates had the highest SOC content in the 0–20 cm soil within the same tillage plot, and the SOC content decreased with aggregate size. The trend of organic carbon content in the 20–40 cm soil was the same as that in the 0–20 cm soil. The SOC content of the 0–20 cm soil aggregates was higher than that of the 20–40 cm soil aggregates of the same size under the same tillage measure. However, this trend was more obvious in larger aggregates, especially in the >2 mm soil aggregates. As the size of the aggregates decreased, the gap in aggregate SOC content between the two soil layers gradually decreased, and the values tended to be similar.
As shown in Table 4, the TN content of the >2 mm aggregates was the highest of the 0–20 cm soil aggregates and decreased with aggregate size. The trend of TN content in the 20–40 cm soil was the same as that in the 0–20 cm soil. The trend of TN content for the same aggregate size in different soil layers under the same tillage method was the same as that of SOC.
As shown in Table 5, the TP content of the aggregates in the 0–20 cm and 20–40 cm soil layers showed an inverted “S”-shaped trend. It decreased first, then increased, then decreased again with decreasing aggregate particle size. The TP content of the >2 mm aggregates was still the highest of that in all aggregate sizes. The TP content in the 0–20 cm soil was greater than that in the 20–40 cm soil for the same aggregate size under the same tillage measures.

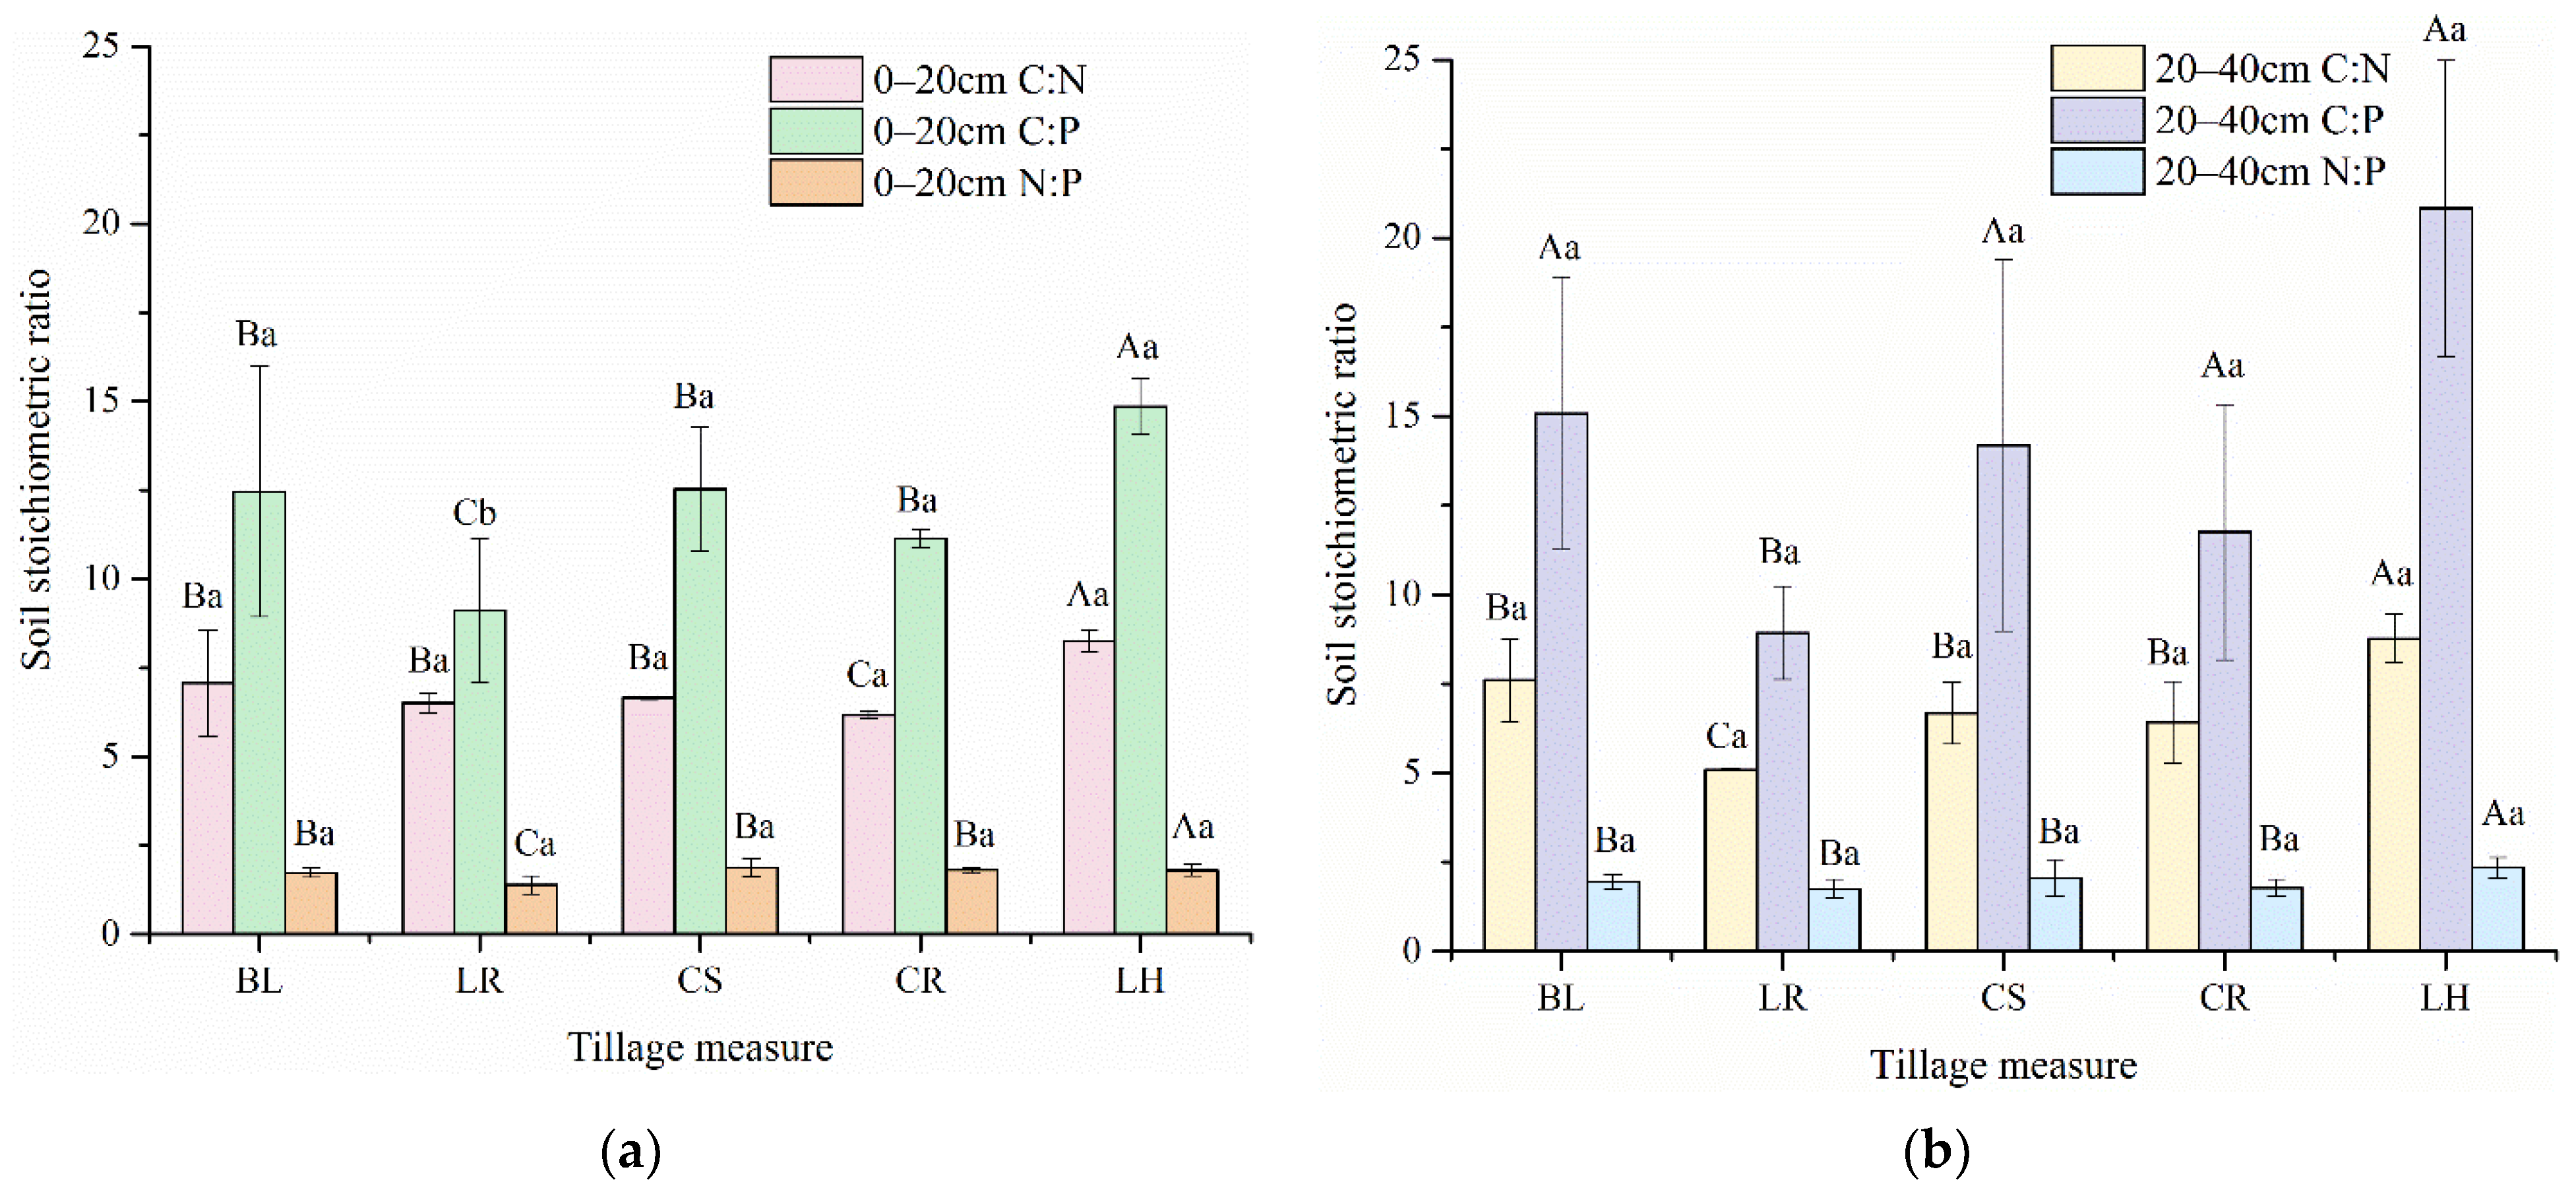
3.3. Soil Stoichiometric Ratios under Different Tillage Measures

3.3.1. Soil Stoichiometric Ratios

As shown in Figure 7, the C:N ratio value range of the 0–20 cm soil was 6.17–8.28. The soil C:N ratio value of LH was significantly higher than that of the other tillage plots (p < 0.01). The soil C:N ratio value of CR was significantly lower than that of the other plots (p < 0.01). The range of C:P ratio value in the 0–20 cm soil was 9.11 to 14.85. The soil C:P ratio value of LH was significantly higher than that of the other tillage plots (p < 0.01). The soil C:P ratio value of LR was significantly lower than that of the other plots (p < 0.01). The N:P ratio value range in the 0–20 cm soil was 1.39–1.88. The soil N:P ratio value of LR was significantly lower than that of the other plots. There were no significant differences among the soil N:P ratios value in the other tillage plots.
The range of C:N ratio value inthe 20–40 cm soil was 5.10–8.78. The soil C:N ratio value of LH was significantly higher than that of the other tillage plots (p < 0.01). The soil C:N ratio value of LR was significantly lower than that of the other plots (p < 0.01). The range of C:P ratio value in the 20–40 cm soil was 8.93–20.83. The soil C:P ratio value of LH was significantly higher than that of the other tillage plots (p < 0.01). The soil C:P ratio value of LR was significantly lower than that of the other plots (p < 0.01). The range of N:P ratio value inthe 20–40 cm soil was 1.75–2.35. The soil N:P ratio value of LH was significantly higher than that of the other tillage plots. There were no significant differences in soil N:P among the other tillage plots.
The soil C:N and C:P ratios value in 0–20 cm were both lower than those in 20–40 cm, except in the LR plot. The N:P ratio value of the 0–20 cm soil layer was lower than that of the 20–40 cm soil layer, except in the CR plot. However, the differences between the two soil layers were not significant.

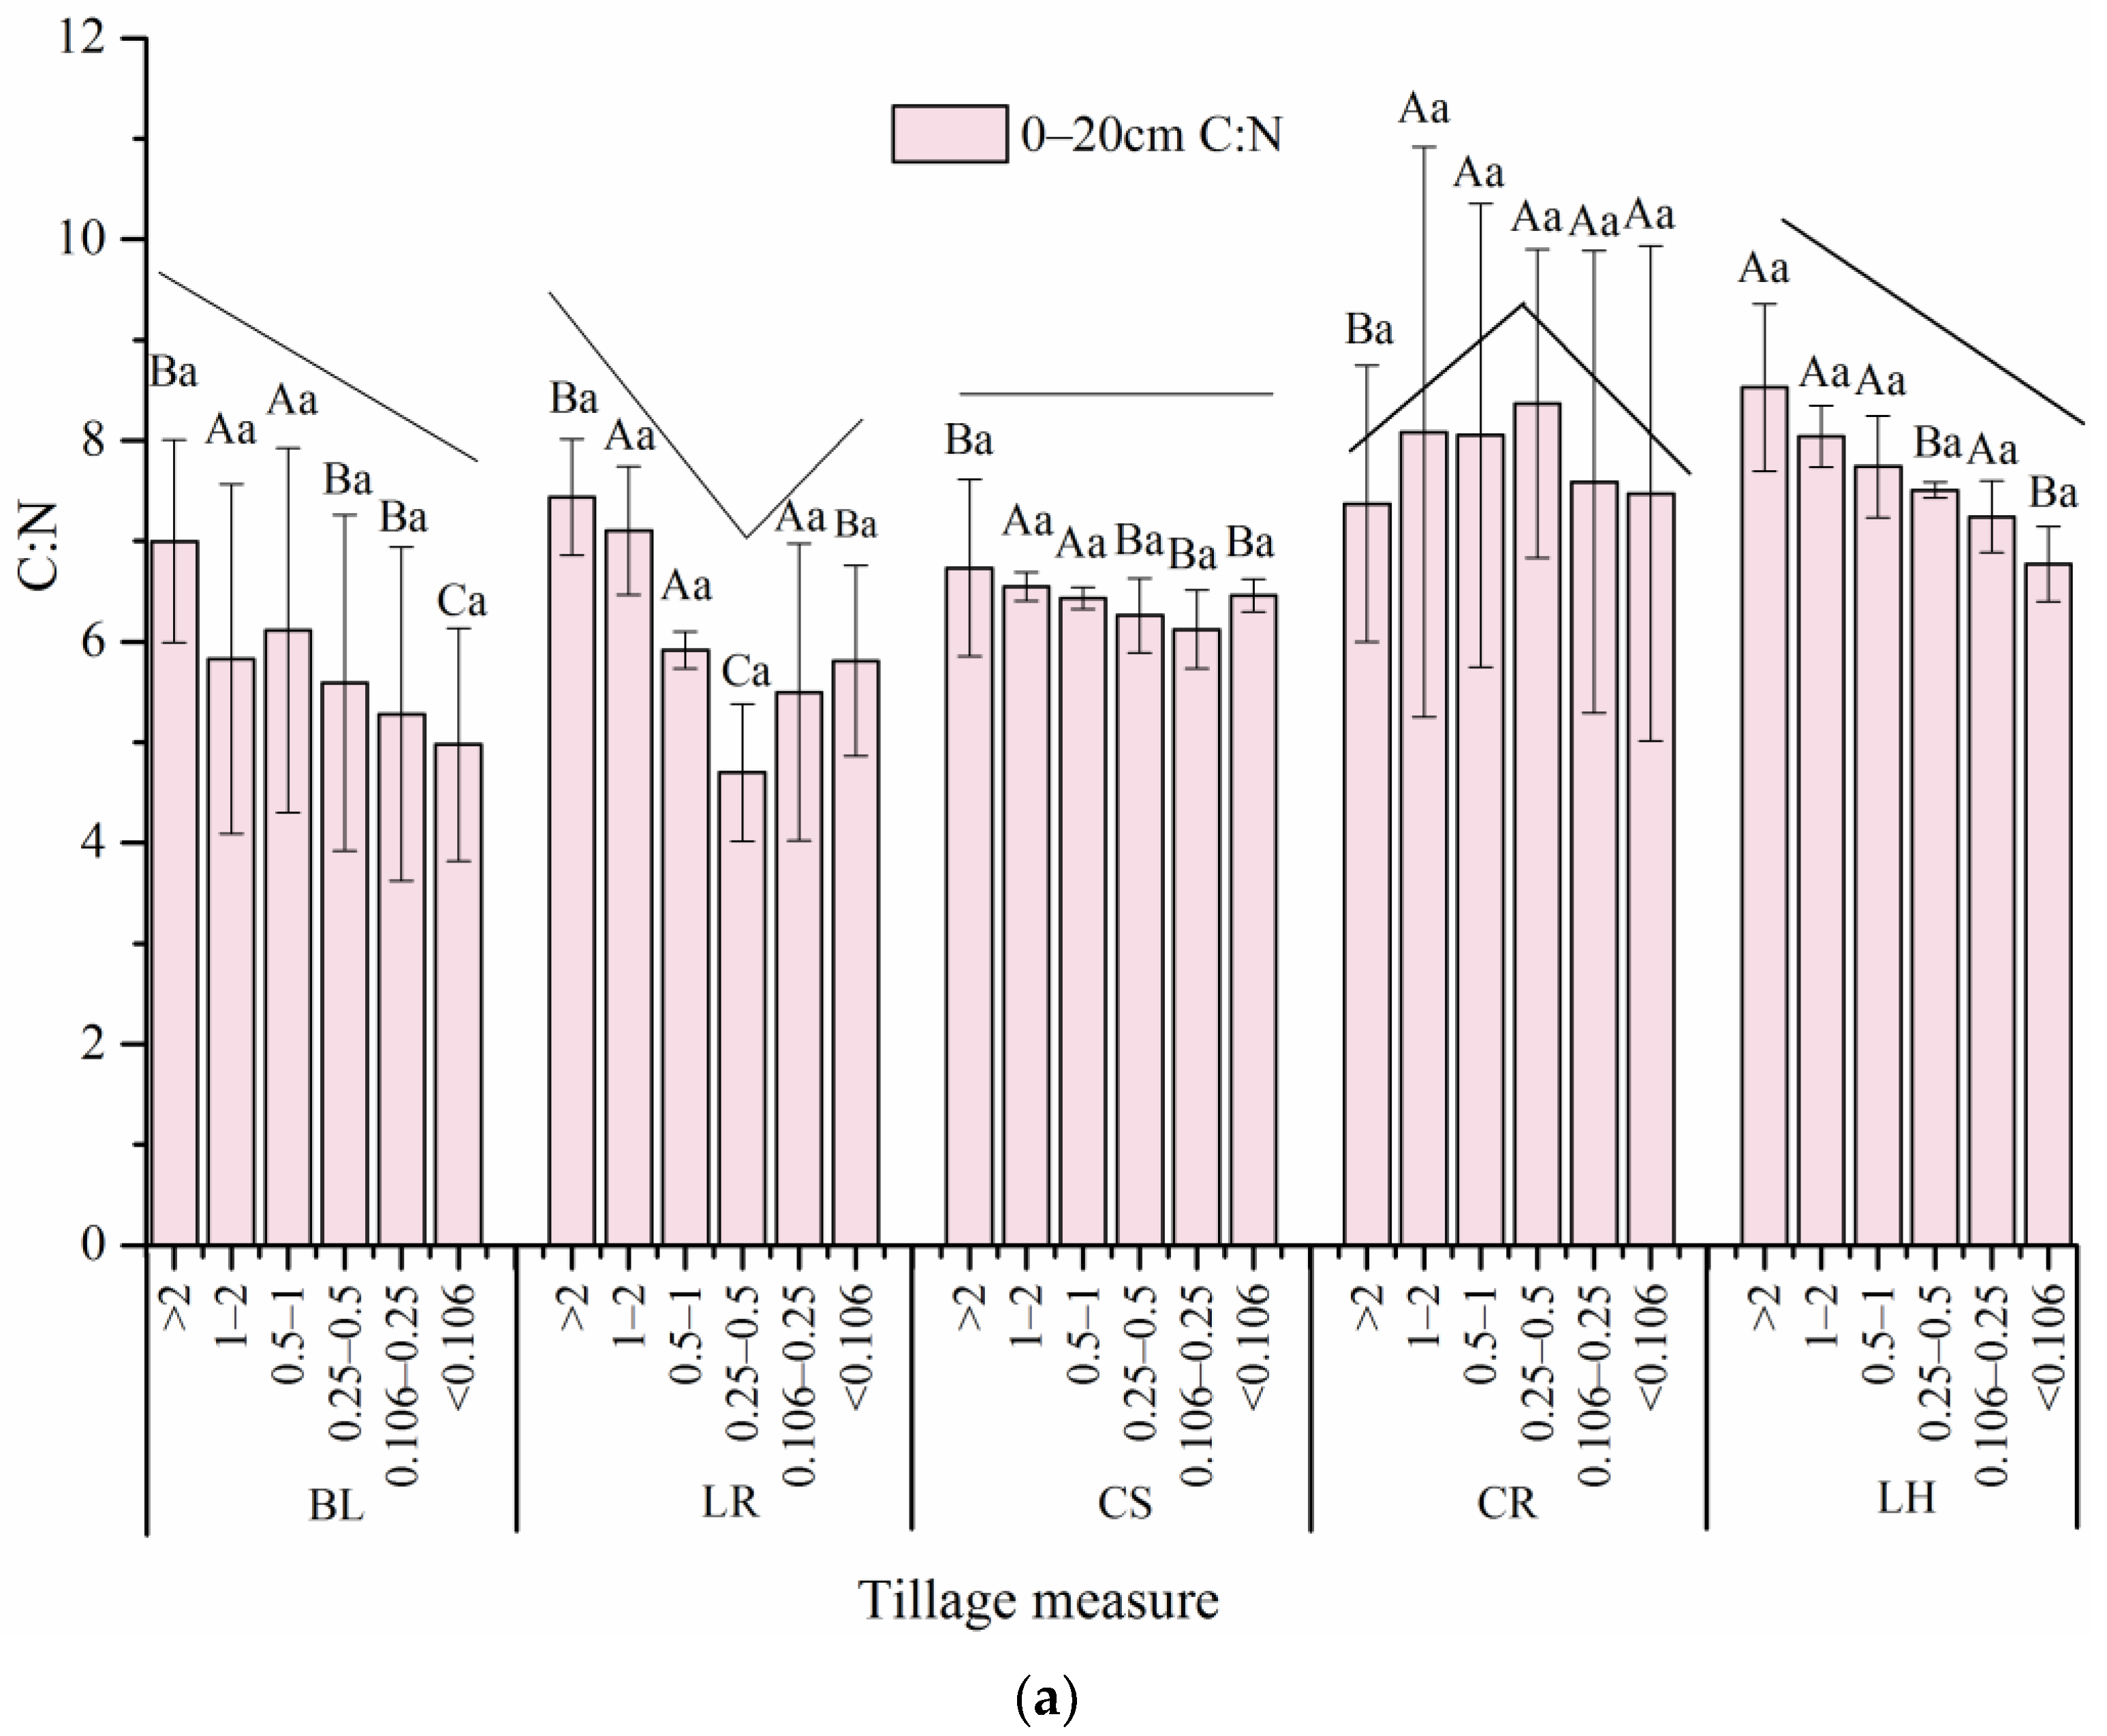
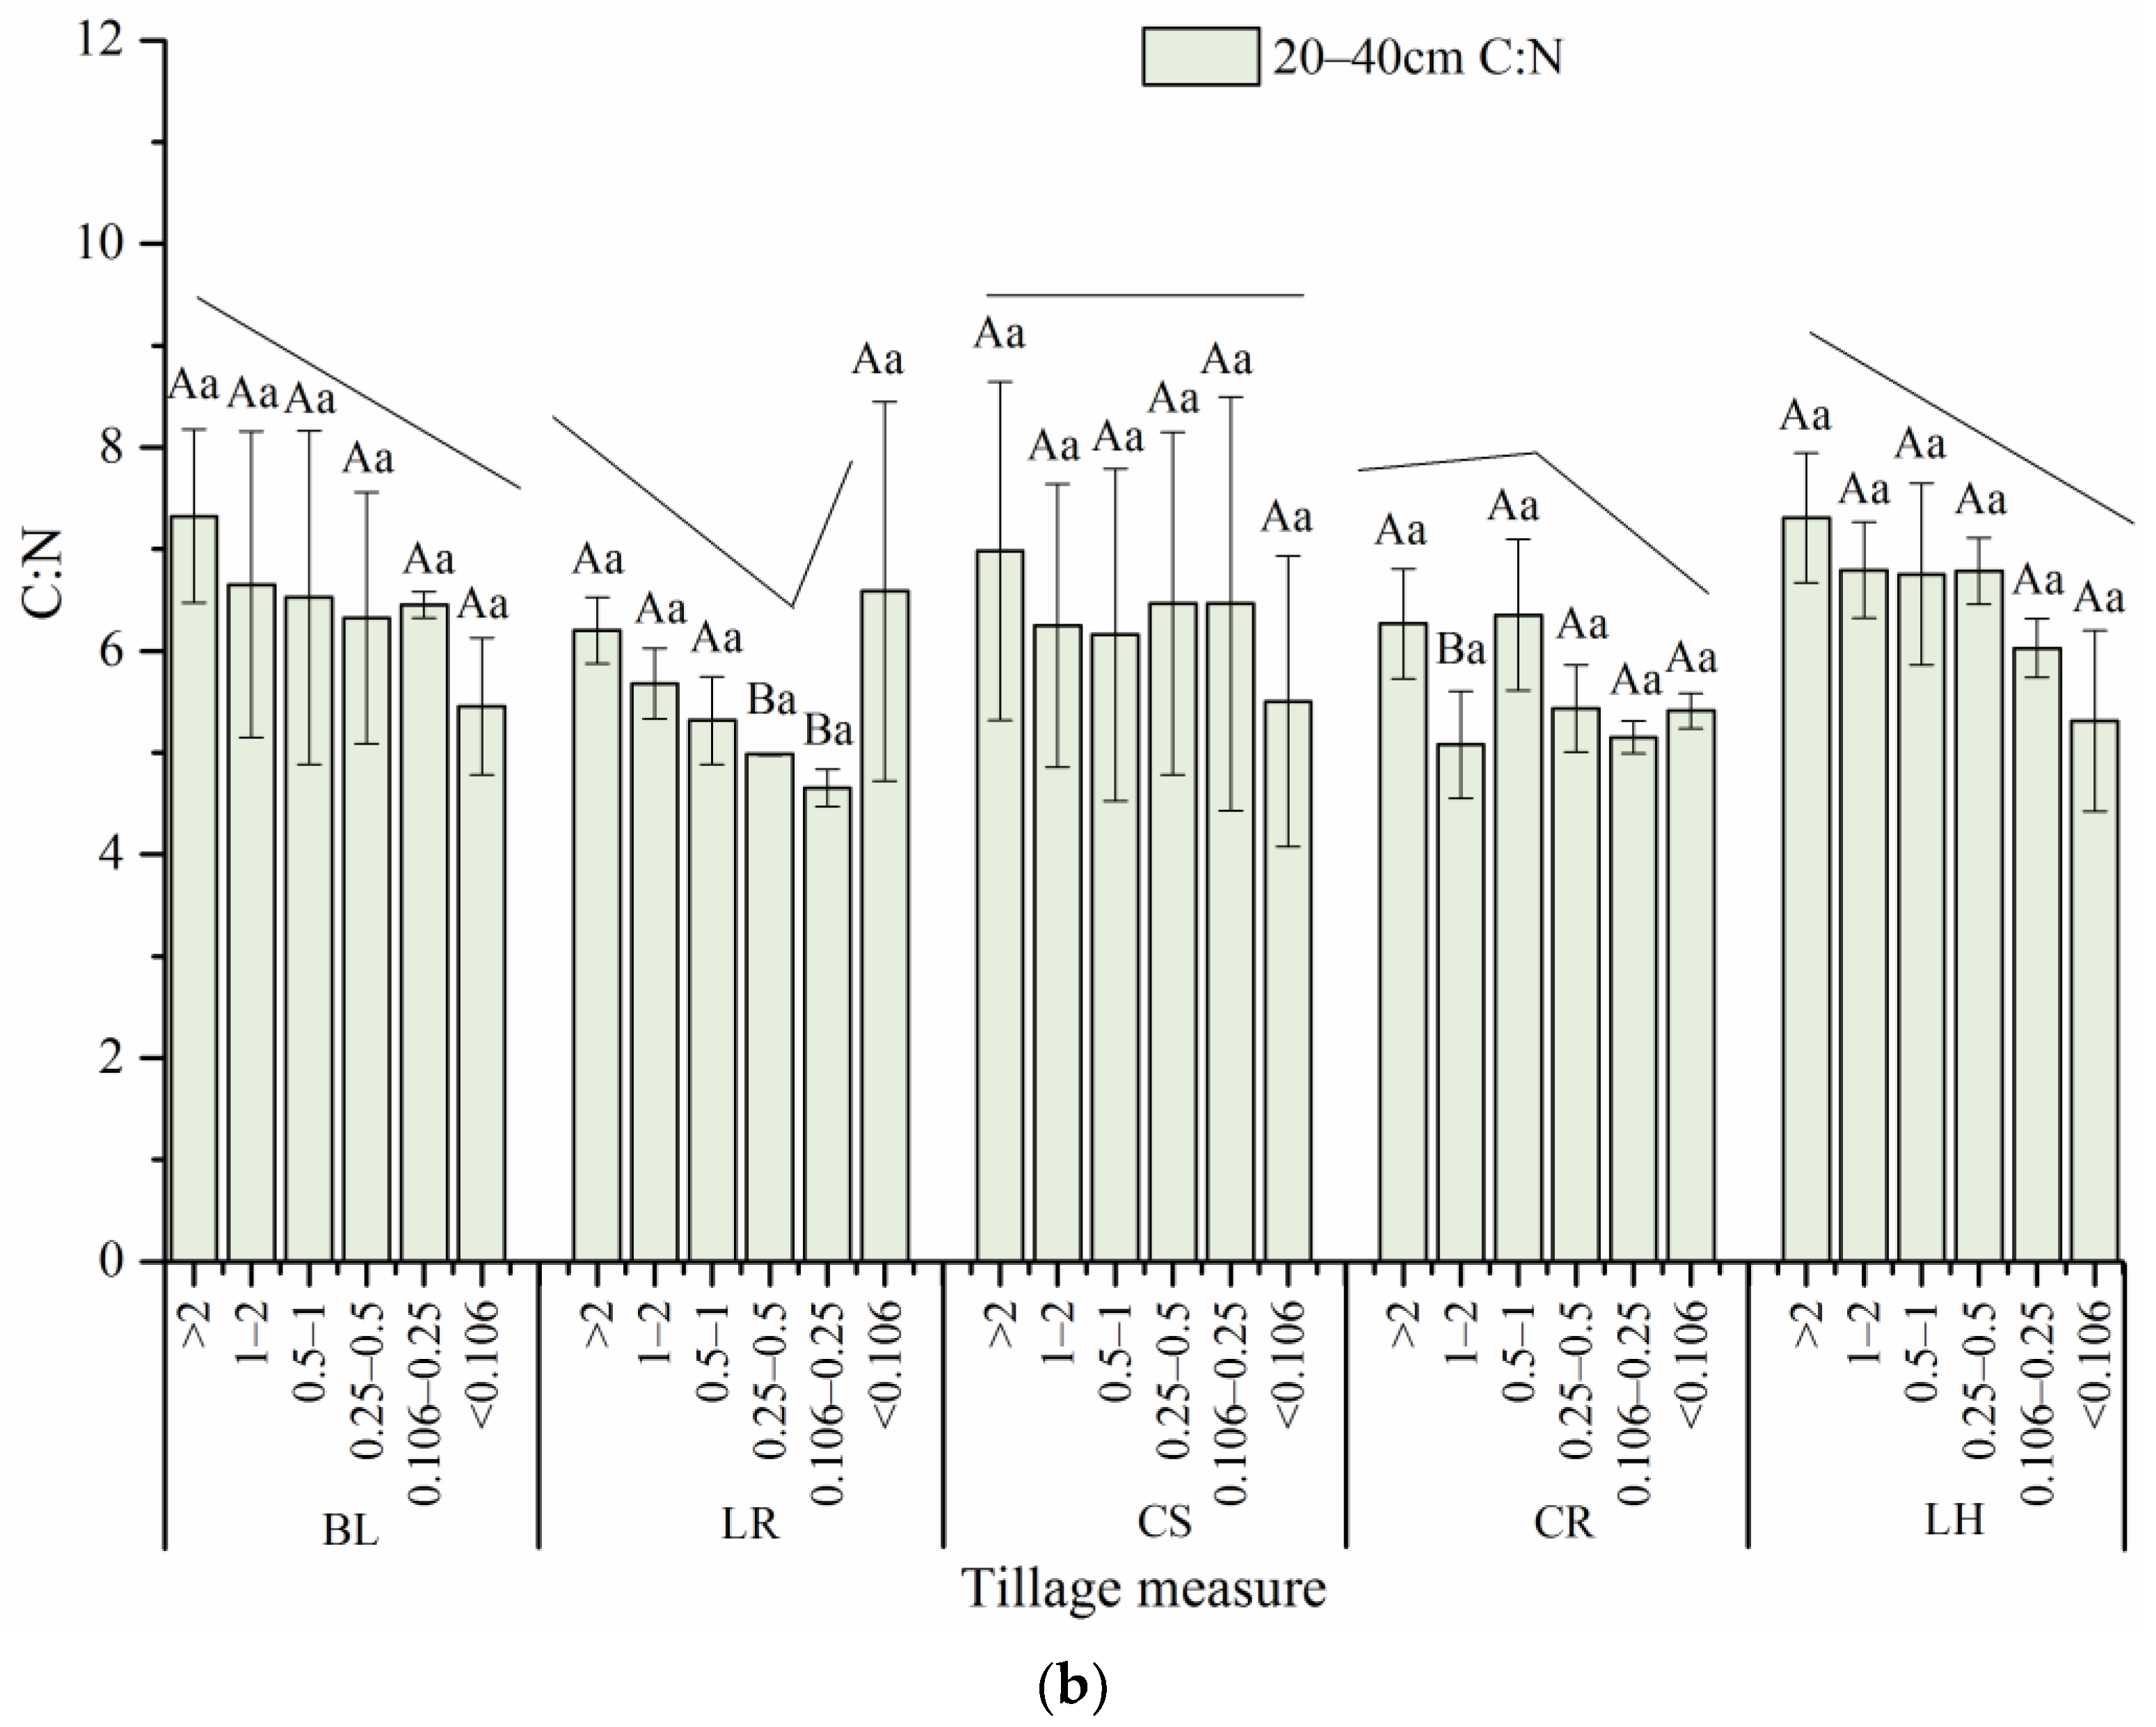
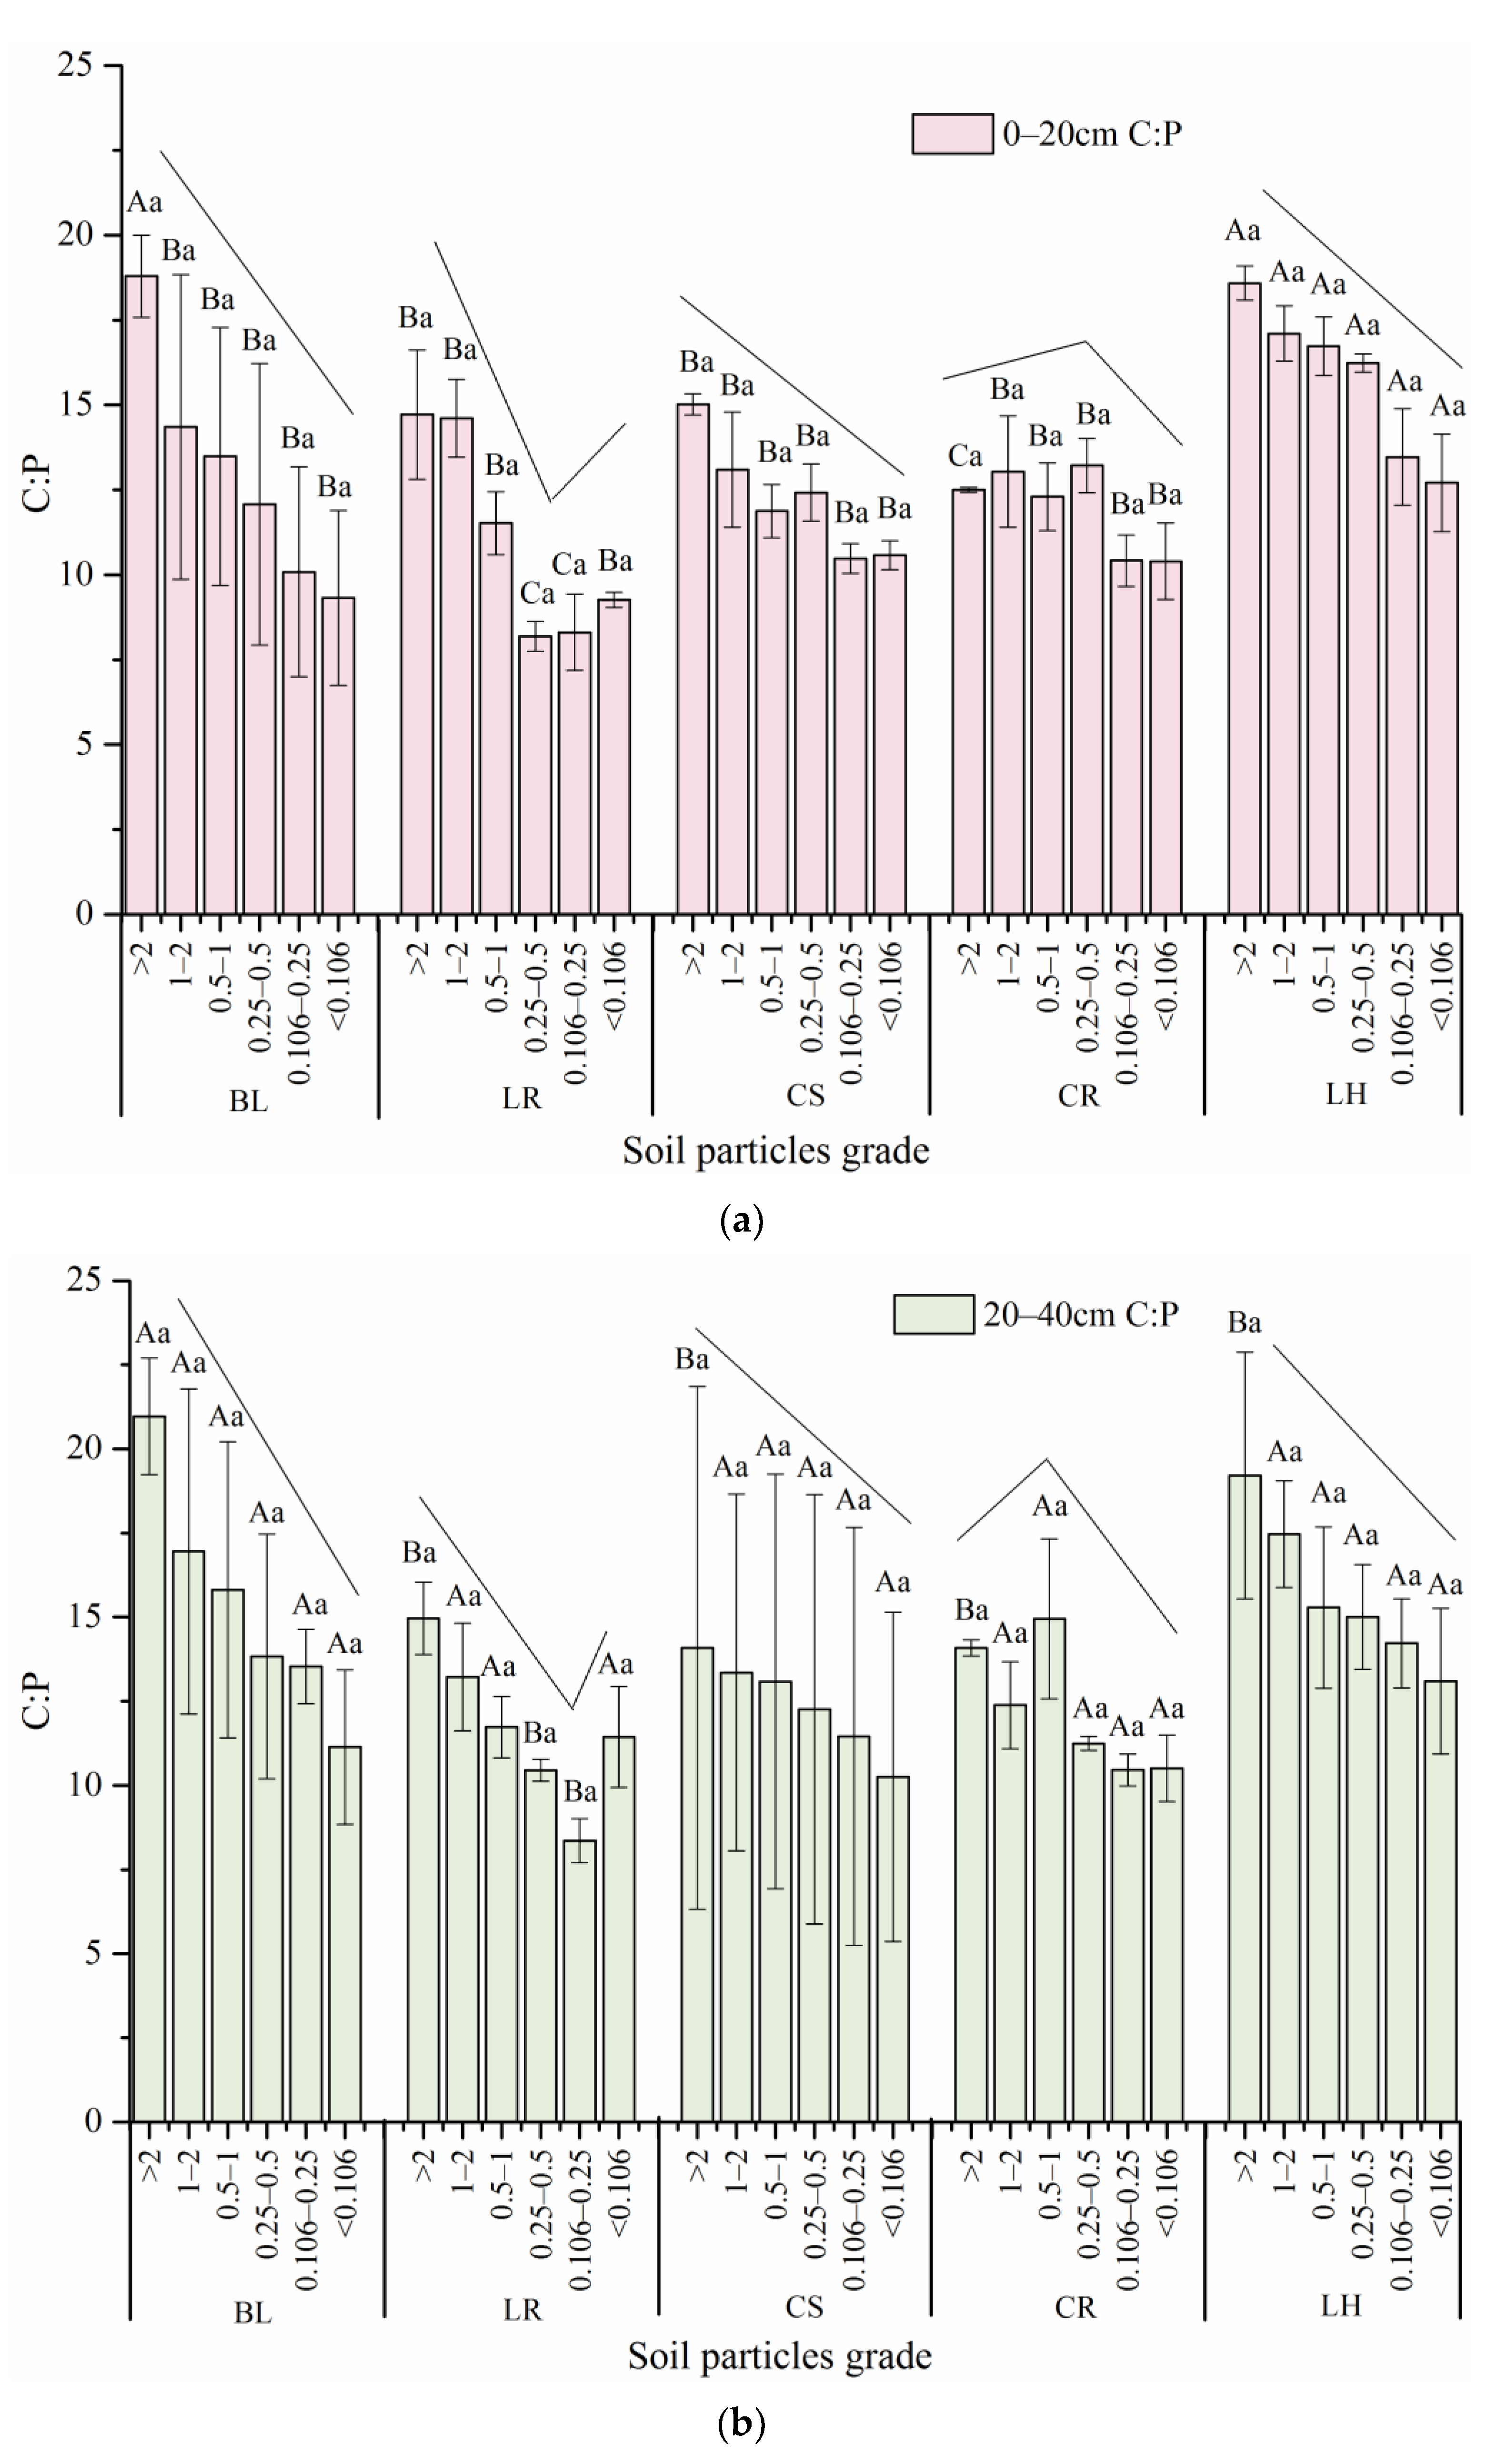
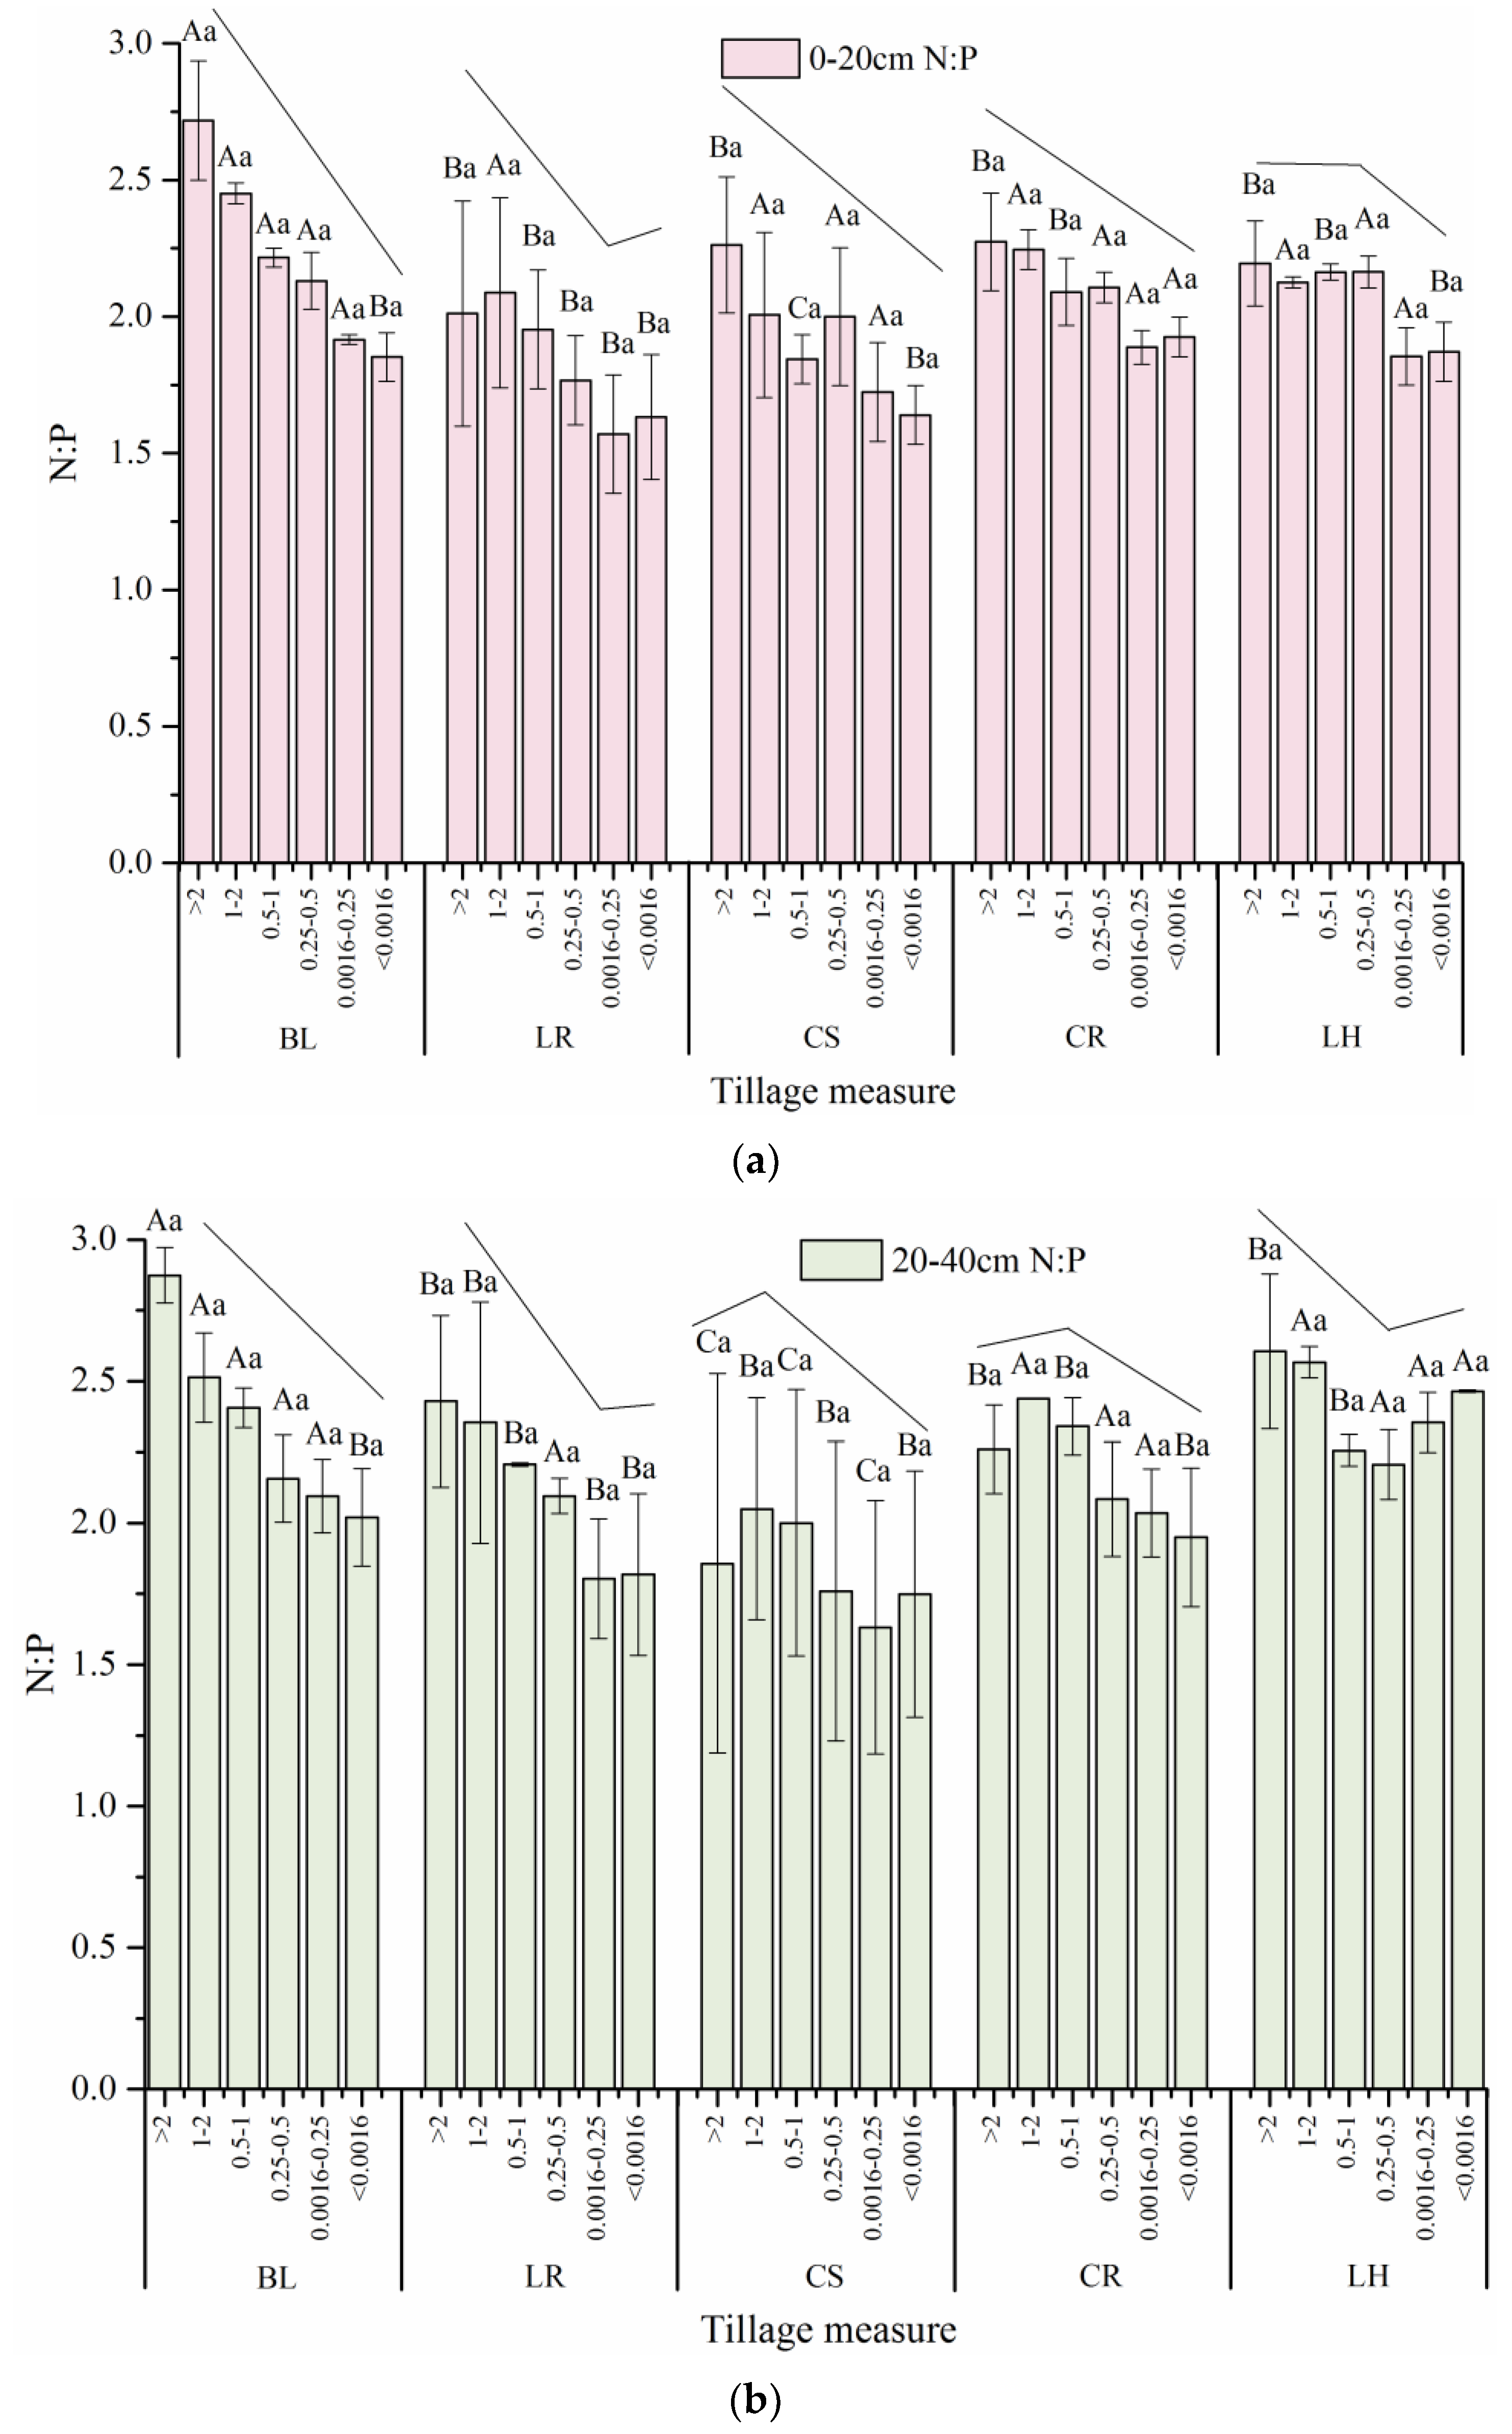
3.3.2. Aggregate Stoichiometric Ratios

Figure 8 shows that the soil C:N ratio decreased with particle size in BL and LH. The soil C:N ratio first decreased and then increased with decreasing grain size in LR. In CS, the differences among aggregates with different grain sizes and between soil layers were not obvious. The soil C:N ratio first increased and then decreased with decreasing grain size in CR. The average C:N ratio for all particle sizes in the 0–20 cm soil was higher than in the 20–40 cm soil, except in BL.
Figure 9 shows that the soil C:P ratios decreased with decreasing particle size in BL and LH. The soil C:P ratio first decreased and then increased with decreasing grain size in LR. The soil C:P ratio decreased with decreasing particle size in CS. The soil C:P ratio first increased and then decreased with decreasing particle size in CR. The 0–20 cm soil C:P ratio was lower than the 20–40 cm soil C:P ratio in BL. The soil C:P ratio in the other plots did not show clear trends.
Figure 10 shows that the soil N:P ratios decreased with decreasing particle size in BL and CS. The soil N:P ratio decreased first and then increased with decreasing grain size in LR. The soil N:P ratio first increased and then decreased with decreasing particle size in CR. The soil N:P ratio showed different trends between the 0–20 cm and 20–40 cm soil layers in LH.
The 0–20 cm soil N:P ratios was lower than that at 20–40 cm in BL, LR, CR and LH. There was no clear difference between the N:P ratios in the two soil layers in CS.

4. Discussion

4.1. Effects of Long-Term Tillage Practices on Soil Aggregates

Soil structure is the basis of sustained soil fertility, and tillage practices have a great impact on the formation of soil aggregates [32]. The particle size of soil aggregates will change in different ways because of the impact of different long-term tillage measures. A >0.25 mm aggregate size is considered to be the best structure for soil and a good basis for maintaining the stability of the soil structure. The higher the proportion of this size class is, the better the soil stability is [33]. In this study, the contents of C, N and P in the >2 mm aggregates were the highest under all tillage measures (Figure 6, Figure 7 and Figure 8). Therefore, the proportions and nutrient contents of >2 mm aggregates were analyzed and compared. However, the conclusion of this study is different from that of studies in the same parent soil [34]. The main reasons for this discrepancy are the different planting patterns and the different grades of the dry-sieved aggregates. In this study, all >2 mm aggregate ratios and nutrient levels were calculated for a peanut-rape rotation system. In the other studies, only peanuts were planted, and the >2 mm aggregates were analyzed within a 2–8 mm aggregate size class.
Tillage was performed in all plots, so there was little difference in the mechanical stability of the dry-sieved soil aggregates between plots or between soil layers under the different tillage measures. The proportion of >0.25 mm aggregates in the 0–20 cm and 20–40 cm soil layers increased only in LH under wet sieving. The main reason for this difference was that the SOC content in LH was significantly higher than that in the other plots (Figure 5). The >2 mm soil aggregate proportion increased only in CS and LH. The <0.25 mm aggregate proportion increased in the 0–20 cm soil layer in LR and in the 20–40 cm soil layer in CR. These findings are similar to those in other relevant studies [35] and indicate that different tillage measures have little influence on soil mechanical stability but have a great influence on soil water stability. Improper tillage practices, such as leaving fields bare, will reduce the stability of soil water and increase the risk of soil erosion.

4.2. Effects of Long-Term Tillage Measures on Soil Nutrients

C, N and P are essential elements for plant growth that directly affect crop growth and soil nutrient cycling [36]. Soil nutrient availability is affected by the positive and negative impacts of crop tillage measures on soil nutrient retention and absorption and on soil particle size [37].
The nutrient content of the upper layer was higher than that of the lower layer (Figure 5), indicating that the tillage measures effectively increased the nutrient content of the surface soil. Nutrients accumulated first in the upper layer of the soil due to the direct effects of fertilization and tillage activities on the surface layer as well as the increasing input of exogenous nutrients to the soil during tillage and the influence of crop plant residues [27]. The SOC contents at 0–20 cm and 20–40 cm in the tillage measure plots (except LH) were lower than those in BL. This occurred because crops take up some soil organic matter and because cultivation accelerates the mineralization of soil organic matter. If there is no exogenous supplementation or a change in tillage methods according to the cultivated soil conditions, soil organic matter will not accumulate over the tillage period [38]. Therefore, in combination with hedgerow practices implemented on the basis of traditional tillage methods, soil organic matter accumulation can be increased [35]. Compared with that in the same soil layer in BL, the 0–20 cm soil TN content increased in the plots under the other tillage measures. This occurred mainly because all plots were fertilized during cultivation; there was no plant protection for the soil in the BL plot, and fertilizer was lost through runoff and sediment loss. However, compared with that in BL at 20–40 cm, the soil TN increased only in the LH plot; the remaining plots had lower soil TN contents than the BL plot. The main reason for this result is that 20–40 cm is the main distribution range of the crop root system. Crop absorption and the deep leaching of nitrogen [39] resulted in a lower TN content in the plots planted with crops than in the bare control plots without crops. The soil phosphorus content is affected mainly by the soil parent material, soil formation process, tillage and fertilization practices [40] and soil and water loss. Compared with that in BL, the TP in the 0–20 cm soil in the other tillage plots was slightly higher [41], and that in the LH plot was much higher. This occurred because TP is lost mainly with sediment loss, but hedgerows can intercept sediment and effectively reduce phosphorus losses [42]. The SOC and TN of the soil aggregates the in different plots decreased with decreasing particle size, which was consistent with the conclusions of relevant studies [43]. The nutrient content of aggregates in the 0–20 cm layer was greater than that in the 20–40 cm layer, especially in the >2 mm aggregates, which had the highest nutrient content. Studies have shown that organic carbon in the 0–5 cm soil layer is mainly stored in 0.25–2 mm aggregates [44]. However, studies have also shown that large aggregates with the highest particle size (> 2 mm) are the main source of SOC reserves in the 0–30 cm layer [45]. This difference is caused by the influence of various factors, such as the soil parent material and land use type. The contents of SOC and TN in the soil aggregates of different particle sizes in LH were higher than those in the aggregates in the other tillage plots. Interception by hedgerows may have increased nutrient contact with the soil aggregates. Other studies have also found that hedgerows can increase the organic carbon content of >2 mm soil aggregates, which is in line with trends observed in relevant research [35].

4.3. Effects of Long-Term Tillage Measures on Soil Stoichiometric Ratios

Soil C:N, C:P and N:P ratios are important indexes reflecting soil nutrient composition and quality. The soil C:N ratio affects the circulation of C and N in soil and is a sensitive indicator of soil quality [46]. The global mean soil C:N ratio is 14.3 [47]; the Chinese mean soil C:N ratio is 11.9 [48]; and the Chinese cultivated soil mean C:N ratio is 11.8 [12]. In this study, the C:N range of the sloping farmland at 0–20 cm was 6.17–8.28, far lower than the national average C:N ratio of cultivated land and far lower than those of the other types of soil. Constant artificial fertilization is the main reason that the nitrogen content of cultivated land is much higher than the amount required by crops. This suggests that the cultivated soil in the study area is restricted by carbon. The soil C:P ratio is an important index of the potential for phosphorus release or phosphorus retention by the mineralization of soil organic matter [49]. The global mean soil C:P ratio is 186 [47]; the Chinese mean soil C:P ratio is 61 [48]; and the Chinese cultivated mean soil C:P ratio is 38.1 [12]. In this study, the C:P range of the 0–20 cm soil was from 9.11 to 14.85, which is lower than the national average C:P for cultivated soil and far lower than the average C:P of Chinese soil and the global average C:P of cultivated soil. Moreover, the phosphorus content of the soil in the test area is much higher than that of a nutrient-rich rice cultivation soil [26]. This further suggests that the cultivated soil in the study area is restricted by carbon. The main reason for the C restriction is that crops have been harvested for many years without returning organic matter to the soils, which has led to a low soil organic matter content. The C:N ratio is generally inversely proportional to the decomposition rate of organic matter [50]. C:N was low in this study, indicating that soil organic matter was mainly in a state of mineralization or decomposition. This explains why, under natural conditions, the soil stoichiometric ratio decreases with soil depth, but the soil stoichiometric ratio at 0–20 cm in this study was less than that at 20–40 cm. Therefore, organic matter should be returned to the sloping farmland in the study area, or organic fertilizer should be applied to provide enough organic matter. However, the soil C:P was still low even in the CS treatment, indicating that simply applying the straw on the ground does not increase the soil organic matter content. Increasing the soil organic matter content can be achieved only by plowing to mix the straw with the soil [51]. N:P is often used to diagnose soil nutrient limiting factors and to determine nutrient limitation thresholds [50]. The global mean soil N:P ratio is 13.1 [47]; the Chinese mean soil N:P ratio is 5.2 [48]; and the Chinese cultivated mean soil N:P ratio is 3.4 [12]. In this study, the N:P in the 0–20 cm soil on sloping land ranged from 1.39–1.88, which is lower than the national average N:P of cultivated land and far lower than the average Chinese soil N:P and global soil N:P. Thus, nitrogen is presumed to be a limiting factor. On the one hand, nitrogen in the upper soil layer may be more prone to loss and leaching because it exists in a dissolved state. However, P is mostly bound to sediments and is lost. Except for BL and LR, the plots included water conservation measures that resulted in less phosphorus loss, so the N loss was comparatively higher. On the other hand, as previously noted, due to the artificial application of a compound fertilizer with a fixed element ratio, both N and P are overabundant, and P is overabundant compared with N. Therefore, the proportion of fertilizer suitable for this study area should be redetermined in the later stage of crop growth according to the amount and specific gravity of the soil nutrients.
Because each plot was located on the same slope, the nutrient levels in aggregates of each particle size were assumed to be relatively similar in the early stage of soil utilization. The current changes in aggregate nutrient levels and size class proportions have mainly been caused by the influence of the different tillage measures applied in the past 20 years. The proportions of the different soil particle sizes in each tillage plot were similar to the total size class range observed in the soil. The soil C:N, C:P and N:P ratios in the exposed control plot decreased with decreasing particle size. The soil C:N, C:P, and N:P ratios in LR decreased first and then increased with decreasing particle size, and the turning point was at 0.25 mm. Soil nutrients with particle sizes <0.25 mm were more abundant in LR than in BL. C:N did not change much among particle sizes in CS; C:P and N:P decreased with decreasing particle size, but the decrease was not large compared with that in BL. This result indicates that straw mulching increased the content of nutrients in the soil aggregates with small particle sizes and resulted in a uniform nutrient distribution on the aggregates of different particle sizes. The soil C:N, C:P and N:P ratios in CR first increased and then decreased with decreasing particle size, which was similar to the conclusion in a related study [9]. The maximum values of C:N, C:P and N:P occurred in soil aggregates of different particle sizes in CR. The previous calculation of the soil nutrient contents of aggregates of various particle sizes revealed that the contents of C and N were higher in aggregates with larger particle sizes and lower in aggregates with smaller particle sizes. Therefore, the CR measure increased the nitrogen content in the >2 mm and 1–2 mm aggregates, and the C:N ratio of these two particle sizes were less than that of the 0.25–0.5 mm particle size. Therefore, the C:N ratio was the highest in particle sizes between 0.25 and 0.5 mm. The phosphorus content of the aggregates with 0.5–1 mm particle sizes was lower than that of the two adjacent size-class aggregates, and the C:P ratio in the aggregates with 0.5–1 mm particle sizes was the highest, which is similar to the findings of a related study [9]. The soil in CR showed increased nitrogen content in the 1–2 mm aggregates, while the phosphorus content in this particle size was relatively low. Therefore, the ratio of N:P in the 1–2 mm aggregates was the maximum. The N:P ratio under LH was similar to that under LR. Therefore, stoichiometric ratio trends by aggregate size in LH were similar to those in LR. However, due to the influence of hedgerows on the microtopography of the plot, the nutrient contents of <0.25 mm particles did not increase, so the stoichiometric ratio of the plot decreased with decreasing particle size. Compared to BL, the other tillage measures exhibited smaller differences in stoichiometric ratios between soil layers.

4.4. Comprehensive Analysis of the Influence of Various Factors on Soil Nutrients and Stoichiometric Ratios in Sloping Farmland

As shown in Table 6,the binary variance analysis of soil particle size, soil depth, tillage measures and the three factors’ mutual influences on soil C, N, and P contents and stoichiometric ratios showed that the single factors had stronger influences on nutrient content and stoichiometric ratios than the interactions between factors. Soil particle size contributed the most to the variation in soil nitrogen content, at 46.9%. Depth contributed the most to the variation in soil phosphorus content, with a contribution rate of 57.5%. Tillage measures contributed the most to the variation in soil carbon content, with a contribution rate of 25.4%. Depth contributed the most to the variation in the C:N ratio (39.4%). Tillage measures and soil particle size contributed the most to the variation in the C:P ratio (37.1% and 43.0%, respectively). The contribution rates of soil particle size, soil depth and tillage measures to the N:P ratio were similar, at 29.7%, 29.0%, and 27.4%, respectively.

5. Conclusions

Our study found that the nutrient level peaked in >2 mm soil aggregate across tillage patterns after 20 years. It also led to the difference of nutrient contents in soil aggregates under different tillage practices. LH increased the >2 mm aggregate proportion compared with other plots. So LH has the highest C, N, P content. LH is the optimal tillage pattern regarding to soil structure, nutrient level and balance. Moreover, the C:N, C:P, and N:P ratios are lower than the national average of cultivated land. This indicate carbon is the limiting factor for soil fertility in sloping farmland in this study area. Therefore, increased organic fertilization to replenish organic matter is suggested in this area. It is more appropriate to apply compound fertilizers with specific nutrient proportions determined on the basis of the current soil nutrient status than to apply fertilizers with fixed nutrient proportions. Among all the tillage measures, LH showed better water-stable aggregate enhancement and nutrient interception as well as suitable stoichiometric ratios. Therefore, LH can be recommended as a cultivation measure. The focus of this manuscript is to discuss the effects of different tillage measures to the changes in nutrient and stoichiometric characteristics. The authors hope that optimal C:N:P ratio value research can be further carried out in subsequent studies based on crop yield.

Author Contributions

Conceptualization, J.Z. and X.Z.; methodology, J.Z. and T.Z.; software, J.Z., H.L. and Y.Z.; validation, J.Z. and T.Z.; formal analysis, J.Z. and T.Z.; investigation, Y.L.; resources, Y.L.; data curation, J.Z.; writing—original draft preparation, J.Z.; writing—review and editing, J.Z. and T.Z.; visualization, J.Z.; supervision, X.Z.; project administration, J.Z.; funding acquisition, J.Z. All authors have read and agreed to the published version of the manuscript.

Funding

This research was supported by the National Natural Science Foundation of China (41877084, 41761063), National Key Research and Development Program of China (2017YFC0505405), Jiangxi Provincial Key Research and Development Program (20181BBF60031), Science and technology project of Jiangxi water resources department (201922ZDKT11, 201921YBKT08).

Institutional Review Board Statement

Not applicable.

Informed Consent Statement

Informed consent was obtained from all subjects involved in the study.

Data Availability Statement

Data sharing not applicable.

Acknowledgments

The data in this work were collected from the sloping farmland experimental area of Jiangxi Soil and Water Conservation Eco-science Park. The authors thank the observers for sampling and 20 years’ management.

Conflicts of Interest

The authors declare no conflict of interest.

References

  1. Ma, W.M.; Li, Z.W.; Ding, K.Y.; Huang, J.Q.; Nie, X.D.; Zeng, G.M.; Wang, S.G.; Liu, G. Effect of soil erosion on dissolved organic carbon redistribution in subtropical red soil under rainfall simulation. Geomorphology 2014, 226, 217–225. [Google Scholar] [CrossRef]
  2. Zhao, Q.G.; Huang, G.Q.; Ma, Y.Q. The problems in red soil ecosystem in southern of China and its countermeasures. Acta Ecol. Sin. 2013, 33, 7615–7622. [Google Scholar]
  3. Wang, W.Q.; Wang, C.; Sardans, J.; Min, Q.W.; Zeng, C.S.; Tong, C.; Peñuelas, J. Agricultural land use decouples soil nutrient cycles in a subtropical riparian wetland in China. Catena 2013, 133, 171–178. [Google Scholar] [CrossRef]
  4. Li, Z.P.; Han, C.W.; Han, F.X. Organic C and N mineralization as affected by dissolved organic matter in paddy soils of subtropical China. Geoderma 2010, 157, 206–213. [Google Scholar] [CrossRef]
  5. Chalise, D.; Kumar, L.; Kristiansen, P. Land degradation by soil erosion in Nepal: A review. Soil Syst. 2019, 3, 12. [Google Scholar] [CrossRef] [Green Version]
  6. Bronick, C.J.; Lal, R. Soil structure and management: A review. Geoderma 2005, 124, 3–22. [Google Scholar] [CrossRef]
  7. Zhang, B.; XU, Y.Z.; Li, N.; Qiao, Y.F.; Jiang, H.; Han, X.Z. Recent development in controlling factors for aggregated soil structure. Soil Crop 2014, 3, 41–49. [Google Scholar]
  8. Li, D.J.; Wen, L.; Yang, L.Q.; Luo, P.; Xiao, K.C.; Chen, H.; Zhang, W.; He, X.Y.; Chen, H.S.; Wang, K. Dynamics of soil organic carbon and nitrogen following agricultural abandonment in a karst region. J. Geophys. Res. Biogeosci. 2017, 122, 230–242. [Google Scholar] [CrossRef]
  9. Wang, C.; Xiong, F.; Lu, Y.; Li, B.; Tang, X.; Dong, Y.Q. Effect of land use on topsoil aggregate distribution and stoichiometric characteristics of C, N, and P in the Pearl River Delta. J. Agric. Resour. Environ. 2021, in press. [Google Scholar] [CrossRef]
  10. Wang, M.; Chen, H.; Zhang, W.; Wang, K. Soil nutrients and stoichiometric ratios as affected by land use and lithology at county scale in a karst area, southwest China. Sci. Total Environ. 2018, 619, 1299–1307. [Google Scholar] [CrossRef]
  11. Bradshaw, C.; Kautsky, U.; Kumblad, L. Ecological stoichiometry and multi-element transfer in a coastal ecosystem. Ecosystems 2012, 15, 591–603. [Google Scholar] [CrossRef] [Green Version]
  12. Guo, X.; Jiang, Y.F. Spatial characteristics of ecological stoichiometry and their driving factors in farmland soils in Poyang Lake Plain, Southeast China. J. Soils Sediments 2019, 19, 263–274. [Google Scholar] [CrossRef]
  13. Elser, J.J.; Fagan, W.F.; Denno, R.F.; Dobberfuhl, D.R.; Folarin, A.; Huberty, A.; Interlandi, S.; Kilham, S.S.; McCauley, E.; Schulz, K.L.; et al. Nutritional constraints in terrestrial and freshwater food webs. Nature 2000, 408, 578–580. [Google Scholar] [CrossRef] [PubMed]
  14. Hill, B.H.; Elonen, C.M.; Seifert, L.R.; May, A.A.; Tarquinio, E. Microbial enzyme stoichiometry and nutrient limitation in US streams and rivers. Ecol. Indic. 2012, 18, 540–551. [Google Scholar] [CrossRef]
  15. Niu, S.Q.; Ren, L.N.; Song, L.J.; Duan, Y.Y.; Huang, T.; Han, X.H.; Hao, W.F. Plant stoichiometry characteristics and relationships with soil nutrients in Robinia pseudoacacia communities of different planting ages. Acta Ecol. Sin. 2017, 37, 355–362. [Google Scholar] [CrossRef]
  16. Yang, Y.; Liu, B.R.; An, S.S. Ecological stoichiometry in leaves, roots, litters and soil among different plant communities in a desertified region of Northern China. Catena 2018, 166, 328–338. [Google Scholar] [CrossRef]
  17. Elser, J.J.; Fagan, W.F.; Kerkhoff, A.J.; Swenson, N.G.; Enquist, B.J. Biological stoichiometry of plant production: Metabolism, scaling and ecological response to global change. New Phytol. 2010, 186, 593–608. [Google Scholar] [CrossRef] [Green Version]
  18. Deng, L.; Wang, K.B.; Chen, M.L.; Shangguan, Z.P.; Sweeney, S. Soil organic carbon storage capacity positively related to forest succession on the Loess Plateau, China. Catena 2013, 110, 1–7. [Google Scholar] [CrossRef]
  19. Bing, H.J.; Wu, Y.H.; Zhou, J.; Sun, H.Y.; Luo, J.; Wang, J.P.; Yu, D. Stoichiometric variation of carbon, nitrogen, and phosphorus in soils and its implication for nutrient limitation in alpine ecosystem of Eastern Tibetan Plateau. J. Soils Sediments 2016, 16, 405–416. [Google Scholar] [CrossRef]
  20. Xu, C.H.; Xiang, W.H.; Gou, M.M.; Chen, L.; Lei, P.F.; Fang, X.; Deng, X.W.; Ouyang, S. Effects of forest restoration on soil carbon, nitrogen, phosphorus, and their stoichiometry in Hunan, southern China. Sustainability 2018, 10, 1874. [Google Scholar] [CrossRef] [Green Version]
  21. Wu, T.G.; Chen, B.F.; Xiao, Y.H.; Pan, Y.J.; Chen, Y.; Xiao, J.H. Leaf stoichiometry of trees in three forest types in Pearl River Delta, South China. J. Plant Ecol. 2010, 34, 58–63. [Google Scholar]
  22. Pan, F.J.; Zhang, W.; Wang, K.L.; He, X.Y.; Liang, S.C.; Wei, G.F. Litter C:N:P ecological stoichiometry character of plant communities in typical Karst Peak-Cluster Depression. Acta Ecol. Sin. 2011, 31, 335–343. [Google Scholar]
  23. Gao, Y.; He, N.P.; Yu, G.R.; Chen, W.L.; Wang, Q.F. Long-term effects of different land use types on C, N, and P stoichiometry and storage in subtropical ecosystems: A case study in China. Ecol. Eng. 2014, 67, 171–181. [Google Scholar] [CrossRef]
  24. An, W.L.; Xie, H.Y.; Wang, W.Q.; Zeng, C.S. Effects of straw returning on nutrient content and ecological stoichiometric ratio of soil water-stable aggregates in paddy field. Chin. J. Ecol. 2017, 36, 150. [Google Scholar]
  25. Liu, X.; Ma, J.; Ma, Z.W.; Li, L.H. Soil nutrient contents and stoichiometry as affected by land-use in an agro-pastoral region of northwest China. Catena 2017, 150, 146–153. [Google Scholar] [CrossRef]
  26. Du, L.; Zhang, X.Z.; Zheng, Z.C.; Li, T.X.; Wang, Y.D.; Huang, H.G.; Yu, H.Y.; Ye, D.H.; Liu, T. Paddy soil nutrients and stoichiometric ratios as affected by anthropogenic activities during long-term tillage process in Chengdu Plain. J. Soils Sediments 2020, 20, 3835–3845. [Google Scholar] [CrossRef]
  27. Du, Y.N.; Li, T.Y.; He, B.H.; He, X.R.; Fu, S. Stoichiometric Characteristics of Purple Sloping Cropland Under Long-term Fertilization and Cultivation. Environ. Sci. 2020, 41, 394–402. [Google Scholar]
  28. Zeng, Q.C.; Li, X.; Dong, Y.H.; An, S.S.; Darboux, F. Soil and plant components ecological stoichiometry in four steppe communities in the Loess Plateau of China. Catena 2016, 14, 481–488. [Google Scholar] [CrossRef]
  29. Piaszczyk, W.; Błońska, E.; Lasota, J.; Lukac, M. A comparison of C:N:P stoichiometry in soil and deadwood at an advanced decomposition stage. Catena 2019, 179, 1–5. [Google Scholar] [CrossRef]
  30. Lu, R.K. Methods of Soil Agricultural Chemical Analysis; China Agricultural Science and Technology Press: Beijing, China, 1999; pp. 107, 128, 135. [Google Scholar]
  31. Ministry of Agriculture, PRC. Soil Testing—Part 19: Method for Determination of Soil Water Stable Macro-Aggregates Distribution; China Agricultural Press: Beijing, China, 2008; pp. 1–3.
  32. Puget, P.; Chenu, C.; Balesdent, J. Dynamics of soil organic matter associated with particle-size fractions of water-stable aggregates. Eur. J. Soil Sci. 2000, 51, 595–605. [Google Scholar] [CrossRef]
  33. Six, J.; Elliott, E.T.; Paustian, K. Aggregate and soil organic matter dynamics under conventional and no-tillage systems. Soil Sci. Soc. Am. J. 1999, 63, 1350–1358. [Google Scholar] [CrossRef] [Green Version]
  34. He, S.L.; Huang, S.S.; Zhong, Y.J.; Huang, Q.R.; Cheng, Y.H.; Zhang, K.; Wu, L.; Li, X.F.; Ye, C. Effects of tillage depth on the characteristics of soil water-stability aggregates in sloping farmland of red soil. Res. Soil Water Conserv. 2019, 26, 127–132. [Google Scholar]
  35. Cheng, Y.H.; Wu, L.; Sun, H.J.; Zhong, Y.J.; Sun, Y.M.; Zhang, X.L.; Huang, S.S.; Huang, Q.R. Effects of straw mulching and Vetiver grass hedgerows on the size distribution of the soil water stable aggregates and aggregate-associated organic carbon in red soil. Acta Ecol. Sin. 2016, 36, 3518–3524. [Google Scholar]
  36. Zechmeister-Boltenstern, S.; Keiblinger, K.M.; Mooshammer, M.; Peñuelas, J.; Richter, A.; Sardans, J.; Wanek, W. The application of ecological stoichiometry to plant–microbial–soil organic matter transformations. Ecol. Monogr. 2015, 85, 133–155. [Google Scholar] [CrossRef] [Green Version]
  37. Zhao, S.W.; Su, J.; Wu, J.S.; Yang, Y.H.; Liu, N.N. Changes of Soil Aggregate Organic Carbon During Process of Vegetation Restoration in Ziwuling. J. Soil Water Conserv. 2006, 3, 114–117. [Google Scholar]
  38. Martínez, E.; Fuentes, J.P.; Pino, V.; Silva, P.; Acevedo, E. Chemical and biological properties as affected by no-tillage and conventional tillage systems in an irrigated Haploxeroll of Central Chile. Soil Tillage Res. 2013, 126, 238–245. [Google Scholar] [CrossRef]
  39. Gao, Y.; Yu, G.R.; Luo, C.Y.; Zhou, P. Groundwater nitrogen pollution and assessment of its health risks: A case study of a typical village in rural-urban continuum, China. PLoS ONE 2012, 7, e33982. [Google Scholar] [CrossRef] [Green Version]
  40. Jiang, Y.F.; Ye, Y.C.; Guo, X.; Rao, L.; Li, W.F.; Sun, K. Spatial distribution of soil available phosphorus and its driving factors under different erosion degrees in South China. Soils 2018, 50, 1013–1021. [Google Scholar]
  41. Zhang, Y.; Li, P.; Liu, X.J.; Xiao, L.; Shi, P.; Zhao, B.H. Effects of farmland conversion on the stoichiometry of carbon, nitrogen, and phosphorus in soil aggregates on the Loess Plateau of China. Geoderma 2019, 351, 188–196. [Google Scholar] [CrossRef]
  42. Pu, Y.L.; Xie, D.T.; Lin, C.W.; Wei, C.F. Characteristics of soil comprehensive anti-erodibility under sloped cropland with hedgerows. Trans. Chin. Soc. Agric. Eng. 2013, 29, 125–135. [Google Scholar]
  43. Gao, H.Y.; Guo, S.L.; Liu, W.Z.; Che, S.G.; Li, M. Effect of fertilization on organic carbon distribution in various fractions of aggregates in caliche soils. Acta Pedol. Sin. 2010, 47, 931–938. [Google Scholar]
  44. Wright, A.L.; Hons, F.M. Carbon and nitrogen sequestration and soil aggregation under sorghum cropping sequences. Biol. Fertil. Soils 2005, 41, 95–100. [Google Scholar] [CrossRef]
  45. Kan, Z.R.; Ma, S.T.; Liu, Q.Y.; Liu, B.Y.; Virk, A.L.; Qi, J.Y.; Zhao, X.; Lal, R.; Zhang, H.L. Carbon sequestration and mineralization in soil aggregates under long-term conservation tillage in the North China Plain. Catena 2020, 188, 104428. [Google Scholar] [CrossRef]
  46. Wang, S.Q.; Yu, G.R. Ecological stoichiometry characteristics of ecosystem carbon, nitrogen and phosphorus elements. Acta Ecol. Sin. 2008, 28, 3937–3947. [Google Scholar]
  47. Cleveland, C.C.; Liptzin, D. C:N:P stoichiometry in soil: Is there a “Redfield ratio” for the microbial biomass? Biogeochemistry 2007, 85, 235–252. [Google Scholar] [CrossRef]
  48. Tian, H.Q.; Chen, G.S.; Zhang, C.; Melillo, J.M.; Hall, C.A.S. Pattern and variation of C:N:P ratios in China’s soils: A synthesis of observational data. Biogeochemistry 2010, 98, 139–151. [Google Scholar] [CrossRef]
  49. Cheng, H.; Gong, Y.B.; Wu, Q.; Li, Y.; Liu, Y.; Zhu, D.W. Content and ecological stoichiometry characteristics of organic carbon, nitrogen and phosphorus of typical soils in sub-alpine/alpine mountain of Western Sichuan. J. Nat. Resour. 2018, 33, 161–172. [Google Scholar]
  50. Batjes, N.H. Total carbon and nitrogen in the soils of the world. Eur. J. Soil Sci. 1996, 47, 151–163. [Google Scholar] [CrossRef]
  51. Spaccini, R.; Piccolo, A.; Haberhauer, G.; Stemmer, M.; Gerzabek, M.H. Decomposition of maize straw in three European soils as revealed by DRIFT spectra of soil particle fractions. Geoderma 2001, 99, 245–260. [Google Scholar] [CrossRef]
Figure 1. Location of the study area.
Sustainability 13 00890 g001
Figure 2. Pictures of tillage treatment plots.
Sustainability 13 00890 g002
Figure 3. Picture of the S-type sampling method.
Sustainability 13 00890 g003
Figure 4. Distribution of dry-sieved aggregates under different tillage measures.
Sustainability 13 00890 g004
Figure 5. Distribution of wet-sieved aggregates under different tillage measures.
Sustainability 13 00890 g005
Figure 6. (a) 0–20 cm soil nutrient contents under the different tillage treatments. (b) 20–40 cm soil nutrient contents under the different tillage treatments. Significant differences between treatments are indicated with uppercase letters, while significant differences between soil layers are indicated with lowercase letters.
Sustainability 13 00890 g006
Figure 7. (a) 0–20 cm soil stoichiometric ratio value of plots under the different tillage measures. (b) 20–40 cm soil stoichiometric ratio value of plots under the different tillage measures. Multiple comparisons between measures are marked with uppercase letters, and multiple comparisons between soil layers are marked with lowercase letters.
Sustainability 13 00890 g007
Figure 8. (a) 0–20 cm C:N ratios in soil aggregates of different particle sizes under different tillage measures. (b) 20–40 cm C:N ratios in soil aggregates of different particle sizes under different tillage measures. Multiple comparisons between measures are marked with uppercase letters, and multiple comparisons between soil layers are marked with lowercase letters.
Sustainability 13 00890 g008aSustainability 13 00890 g008b
Figure 9. (a) 0–20 cm C:P ratios in soil aggregates of different particle sizes under different tillage measures. (b) 20–40 cm C:P ratios in soil aggregates of different particle sizes under different tillage measures. Multiple comparisons between measures are marked with uppercase letters, and multiple com-parisons between soil layers are marked with lowercase letters.
Sustainability 13 00890 g009
Figure 10. (a) 0–20 cm N:P ratios in soil aggregates of different particle sizes under different tillage measures. (b) 20–40 cm N:P ratios in soil aggregates of different particle sizes under different tillage measures. Multiple comparisons between measures are marked with uppercase letters, and multiple com-parisons between soil layers are marked with lowercase letters.
Sustainability 13 00890 g010
Table 1. Study area soil physical and chemical properties.
SOC
(g.kg−1)
TN
(g.kg−1)
TP
(g.kg−1)
TK
(g.kg−1)
pHSand
(0.05–2 mm)
Silt
(0.002–0.05 mm)
Clay
(<0.002 mm)
8.64 0.55 0.31 15.87 6.73 29.68%45.56%24.76%
Table 2. Details of tillage treatment plots.
Tillage MeasureSlopePlot SizeReplicatesTreatment Details
Bare land (BL)10°5 × 20 m2Pure soil that nothing grows, Plowed and fertilized in the same way as the other plots.
Longitudinal-ridge tillage (LR)10°5 × 20 m2Ridges (70 cm wide) and furrows (30 cm wide).
Conventional tillage + straw mulching (CS)10°5 × 20 m2Flat-plowed without ridging and covered with straw (1 kg/m2).
Cross-ridge tillage (CR)10°5 × 20 m2Ridges (70 cm wide) and furrows (30 cm wide).
Longitudinal-ridge tillage + hedgerows (LH)10°5 × 20 m2Ridges (70 cm wide) and furrows (30 cm wide). Two daylily hedgerows (50 cm wide) were planted at the bottom and 10 m from the bottom the plot.
Table 3. SOC content of aggregates of different particle sizes.
Aggregates of Different Grain Sizes0–20 cm20–40 cm
BLLRCSCRLHBLLRCSCRLH
>25.16 ± 0.206.57 ± 0.164.90 ± 0.073.86 ± 0.007.61 ± 0.155.40 ± 0.184.67 ± 0.155.08 ± 0.274.15 ± 0.115.22 ± 0.18
2–14.24 ± 0.305.01 ± 0.114.23 ± 0.043.98 ± 0.086.33 ± 0.044.60 ± 0.273.41 ± 0.024.13 ± 0.293.35 ± 0.074.87 ± 0.07
0.5–14.15 ± 0.283.91 ± 0.073.68 ± 0.063.86 ± 0.035.96 ± 0.034.41 ± 0.273.11 ± 0.053.88 ± 0.273.90 ± 0.084.45 ± 0.12
0.25–0.53.73 ± 0.272.99 ± 0.113.68 ± 0.063.86 ± 0.065.38 ± 0.103.99 ± 0.232.77 ± 0.003.88 ± 0.273.18 ± 0.044.17 ± 0.07
0.0016–0.253.43 ± 0.253.32 ± 0.173.34 ± 0.083.21 ± 0.014.74 ± 0.054.06 ± 0.092.52 ± 0.033.79 ± 0.292.94 ± 0.033.70 ± 0.03
<0.00163.06 ± 0.183.40 ± 0.103.05 ± 0.072.98 ± 0.014.04 ± 0.013.23 ± 0.123.28 ± 0.163.00 ± 0.182.85 ± 0.023.06 ± 0.10
Table 4. TN contents of aggregates of different particle sizes.
Aggregates of Different Grain Sizes0–20 cm20–40 cm
BLLRCSCRLHBLLRCSCRLH
>20.73 ± 0.060.88 ± 0.060.73 ± 0.030.70 ± 0.060.89 ± 0.020.73 ± 0.060.75 ± 0.110.71 ± 0.060.66 ± 0.040.71 ± 0.08
2–10.70 ± 0.090.70 ± 0.030.64 ± 0.020.69 ± 0.010.79 ± 0.060.67 ± 0.090.60 ± 0.010.63 ± 0.120.66 ± 0.010.72 ± 0.01
0.5–10.66 ± 0.070.66 ± 0.040.57 ± 0.070.66 ± 0.010.77 ± 0.070.66 ± 0.070.59 ± 0.000.60 ± 0.090.61 ± 0.000.66 ± 0.01
0.25–0.50.64 ± 0.090.63 ± 0.040.59 ± 0.020.61 ± 0.000.72 ± 0.070.61 ± 0.090.56 ± 0.000.58 ± 0.090.59 ± 0.000.61 ± 0.03
0.0016–0.250.63 ± 0.070.60 ± 0.020.54 ± 0.040.58 ± 0.030.66 ± 0.070.63 ± 0.070.54 ± 0.020.56 ± 0.080.57 ± 0.010.61 ± 0.00
<0.00160.60 ± 0.070.59 ± 0.000.47 ± 0.050.56 ± 0.030.60 ± 0.040.58 ± 0.060.50 ± 0.000.53 ± 0.050.53 ± 0.000.57 ± 0.01
Table 5. TP content of aggregates of different particle sizes.
Aggregates of Different Grain Sizes0–20 cm20–40 cm
BLLRCSCRLHBLLRCSCRLH
>20.27 ± 0.040.46 ± 0.120.33 ± 0.020.31 ± 0.000.41 ± 0.040.26 ± 0.030.32 ± 0.080.43 ± 0.120.29 ± 0.040.27 ± 0.00
2–10.29 ± 0.030.35 ± 0.070.33 ± 0.060.31 ± 0.000.37 ± 0.030.27 ± 0.020.26 ± 0.040.31 ± 0.000.27 ± 0.010.28 ± 0.00
0.5–10.30 ± 0.040.34 ± 0.060.31 ± 0.050.32 ± 0.010.36 ± 0.030.27 ± 0.020.27 ± 0.000.31 ± 0.030.26 ± 0.010.29 ± 0.00
0.25–0.50.30 ± 0.030.36 ± 0.060.30 ± 0.050.29 ± 0.010.33 ± 0.040.28 ± 0.020.27 ± 0.010.34 ± 0.050.28 ± 0.030.28 ± 0.00
0.0016–0.250.33 ± 0.040.39 ± 0.060.32 ± 0.060.31 ± 0.030.36 ± 0.060.30 ± 0.020.31 ± 0.040.36 ± 0.050.28 ± 0.030.26 ± 0.01
<0.00160.32 ± 0.020.37 ± 0.050.29 ± 0.050.29 ± 0.030.32 ± 0.040.29 ± 0.000.28 ± 0.050.32 ± 0.050.27 ± 0.030.23 ± 0.00
Table 6. Bivariate analysis of soil nutrients and stoichiometric ratio in sloping farmland by various factors.
CNPC:NC:PN:P
Gp<0.0010.000 <0.378<0.2670.000 0.000
Contribution(%)37.01 46.86 4.60 10.7143.0129.65
Dp<0.067<0.004<0.001<0.031<0.343<0.011
Contribution(%)18.0925.60 57.4739.436.4528.98
Mp<0.002<0.001<0.001<0.092<0.0010.000
Contribution(%)25.3715.4615.4617.0537.1427.41
GⅹDp<0.974<0.867<0.994<0.997<0.998<0.938
Contribution(%)0.860.970.00 0.530.371.06
GⅹMp<0.994<0.980<0.975<0.999<0.994<0.994
Contribution(%)1.831.452.30 2.142.481.45
DⅹMp<0.088<0.091<0.003<0.047<0.812<0.207
Contribution(%)11.026.2818.3920.892.796.35
GⅹDⅹMp111111
Contribution(%)0.630.481.151.140.710.94
G is short for grade of aggregate; D is short for depth of soil; M is short for tillage measure.
Publisher’s Note: MDPI stays neutral with regard to jurisdictional claims in published maps and institutional affiliations.

