Article

Perception Analysis of E-Scooter Riders and Non-Riders in Riyadh, Saudi Arabia: Survey Outputs

by
Mohammed Hamad Almannaa
1,*,
Faisal Adnan Alsahhaf
1,
Huthaifa I. Ashqar
2,
Mohammed Elhenawy
3,
Mahmoud Masoud
3 and
Andry Rakotonirainy
3
1
Department of Civil Engineering, College of Engineering, King Saud University, P. O. Box 800, Riyadh 11421, Saudi Arabia
2
Booz Allen Hamilton, Washington, DC 20003, USA
3
Centre for Accident Research and Road Safety, Queensland University of Technology, Brisbane, QLD 4059, Australia
*
Author to whom correspondence should be addressed.
Sustainability 2021, 13(2), 863; https://doi.org/10.3390/su13020863
Submission received: 14 November 2020 / Revised: 7 January 2021 / Accepted: 13 January 2021 / Published: 16 January 2021
(This article belongs to the Section Sustainable Transportation)

Abstract

:
This study explores the feasibility of launching an e-scooter sharing system as a new micro-mobility mode, and part of the public transportation system in the city of Riyadh, Saudi Arabia. Therefore, survey was conducted in April 2020 to shed light on the perception of e-scooter systems in Riyadh. A sample of 439 respondents was collected, where majority indicated willingness to use the e-scooter sharing system if available (males are twice as likely to agree than females). Roughly 75% of the respondents indicated that open entertainment areas and shopping malls are ideal places for e-scooter sharing systems. Results indicated that people who use ride-hailing services such as Uber, expressed more willingness to use e-scooters for various purposes. The study found that the major obstacle for deploying e-scooters in Saudi Arabia is the lack of sufficient infrastructure (70%), followed by weather (63%) and safety (49%). Moreover, the study found that approximately half of the respondents believed that COVID-19 will not affect their willingness to ride e-scooters. Two types of logistic regression models were built. The outcomes of the models show that gender, age, and using ride-hailing services play an important role in respondents’ willingness to use e-scooter. Results will enable policymakers and operating agencies to evaluate the feasibility of deploying e-scooters and better manage the operation of the system as an integral and reliable part of public transportation.

1. Introduction

As traffic congestion continues to increase dramatically, policymakers and researchers have been working relentlessly to provide the transportation sector with solutions that will mitigate traffic congestion issues. One solution that has emerged in recent years is the introduction of micro-mobility modes, such as two- or three-wheeled e-scooters and bike sharing systems. These new systems have gained attention due to their quick and effective impact in attracting more users in such a relatively short time. Specifically, e-scooter sharing systems started in early 2012 when Scoot Networks released a moped-style vehicle that provided a short-range rental of scooters [1]. The venture bloomed remarkably after 2017, thus beating other transportation-sharing services, such as bike sharing systems.
In 2017, e-scooter sharing systems have reached more than 85 cities worldwide with more than 1.8 million registered users [2]. In 2018, e-scooter systems have exceeded dock-less and dock-based bike sharing systems in terms of number of total trips [3]. Only in the USA, for example, approximately 38.5 million trips were made using e-scooter sharing systems in 2018. The usage proliferation of e-scooter systems (i.e., compared with other public transportation systems) has attracted the attention of policymakers, investors, and researchers to investigate user acceptance across regions and enable further expansion [3].
As e-scooter sharing systems continue expanding and reaching new cities and countries worldwide, policymakers and investors in certain countries who attempt to adopt the system are facing cultural, climatic, operational, economical, and safety concerns. For example, Saudi Arabia faces several potential challenges, which may affect the introduction of such a system in the country, such as the extremely hot weather in summer (~45 °C), cultural barriers to the use of public transportation services, and lack of regulation and sufficient infrastructure, such traffic lanes dedicated for e-scooters. Although they have not yet been legislated, two startup companies, namely, Wee and DarbRide, performed two pilot testing studies on e-scooter sharing systems. Pilot testing was conducted only during a limited time throughout the day (i.e., from sunset until midnight) in late 2019 in specifically closed areas, such as the Diplomatic Quarter and Riyadh Front (large shopping center).
The study aims to investigate the perception of e-scooter users and non-users in the city of Riyadh, Saudi Arabia. Therefore, survey was conducted in April 2020 to shed light on the perception of e-scooter systems in Riyadh. This research work has four main contributions: (1) shed light on how people living in Riyadh, Saudi Arabia perceive the new micromobility mode, (2) investigate the experience of Saudi users of e-scooter sharing system inside and/or outside of Saudi Arabia, (3) explore how various socioeconomic and demographic factors may influence attitude toward the deployment and use of the e-scooter sharing system in Saudi Arabia, and (4) provide knowledge on how the COVID-19 situation influences travelers’ choice if the e-scooter sharing system becomes available.

2. Literature Survey

Extensive research that investigated the potential benefits and behavior of uses of e-scooter sharing systems have recently emerged [4,5,6,7,8]. Anderson-Hall et al. endeavored to draft policies regulating the new micromobility modes in the USA by summarizing contemporary news articles and professional reports [5]. The conclusion of the study provided cities and policymakers with information on the better management of the negative and positive impacts of the new transportation mode. Smith and Schwieterman explored the ability of e-scooter sharing systems to attract a portion of the daily trips that occur in Chicago neighborhoods [4]. The authors examined how travel time and cost of other modes of transportation would be influenced if the new micromobility mode is widely used in the city. The study analyzed 30,000 randomly selected hypothetical trips in the city and showed that using e-scooters for short trips would significantly compete with personal vehicles but fail with long trips.
Studies that analyzed the perception of e-scooter users based on surveys across countries and regions are relatively few. Aguilera-Gracia et al. investigated the benefits and obstacles of the e-scooter sharing system through an online survey distributed to people in Spain [9]. The authors planned to anticipate the number of potential users before launching the service and found that age and level of education play a significant role in targeting potential users. Fitt and Curl conducted a survey on perception about e-scooters in five cities in New Zealand [10]. The forecasted the number, behavior, and perception of early users and how these factors may change over time. The study collected 591 valid responses, and results indicated that 25% of e-scooter users used an e-scooter at one time, whereas 75% used e-scooters more than once. The findings illustrated concerns about safety, cost, and suitable clothing when using the e-scooter sharing system. In Taiwan, Huang and Lin conducted a survey to investigate the acceptance of long-term use of scooter rides [11]. A total of 198 e-scooter commuters participated in the survey, and results showed that hedonic quality has a positive impact on user experience. Additionally, the authors found that age and gender influence e-scooter usage behavior. Moreover, Chen et al. investigated the effect of e-scooter sharing systems on economic benefit, locational benefit, and sustainability [7]. An online survey was collected solely from the students of a Taiwanese University. The results demonstrated that e-scooter sharing systems are positively related to the abovementioned benefits. In the USA, James et al. conducted a survey in Rosslyn, Virginia among 181 e-scooter riders and non-riders with the goal of measuring perception and experience [12]. The researchers found that perception changes based on whether the respondent has used the e-scooter or not. The survey outputs indicated that non-riders lack knowledge regarding laws and regulations on e-scooters, whereas the opposite is true for e-scooter riders.
Laa et al. assessed the socio-economic characteristics and usage of both renters and owners of e-scooters in Australia [13]. They found the age, gender, and education background are significant factors in the e-scooter’s usage. People who are young, male and highly educated tend to use e-scooters more than others. Sanders et al. investigated the barriers and benefits of e-scooter usage inside a university town [14]. Their study shows that the e-scooter is seen by the majority of responses as a convenient transportation mode, particularly in in a hot weather and compared to walking. Additionally, they found that the demographic characteristics of users are a significant barrier in front of users as their findings indicate African American and non-white Hispanic are more likely to use e-scooters than non-Hispanic white. Furthermore, women respondents were found to be concerned with the safety risk of riding e-scooters.
To the best of our knowledge, the study is the first to endeavor to understand the perception regarding e-scooters from the context of Saudi Arabia. The researchers are hopeful that the research findings can be beneficial for policymakers, researchers, and entrepreneurs who plan to invest in Saudi Arabia through micromobility modes. In addition to investigating the perception of e-scooter use inside and outside Saudi Arabia, the study explored the attitudes of users regarding the impact of COVID-19 on e-scooter sharing systems. Lastly, the study provides a discussion and final recommendation for policymakers, operating agencies, researchers, and potential users.

3. Methodology

3.1. Dataset

The survey was designed with two main sections, namely, socioeconomic and demographic (9 questions) as well as mobility and e-scooter perception (17 questions) as presented in Table 1. The twenty-nine questions were distributed in four sections as follows: Section one obtains the demographic information of respondents; Section two discusses the experience of previous e-scooter users; Section three discusses the willingness-to-use and the potential purpose for new e-scooter users; Section four includes six general questions with regard to safety and obstacles of e-scooter sharing systems, COVID-19 impact, and potential places for e-scooters in Saudi Arabia.
Respondents first answer eight demographic questions, followed by indicating their previous experience with e-scooters. Respondents were moved automatically to Section 2 if they had previous experience with e-scooters and to Section 3, if not. In the last section (Section 4), six general questions were given for all respondents.
Google Forms was used to build the survey, which was then distributed in Riyadh through word of mouth, Riyadh social media accounts, and the list of users of the two e-scooter companies in Riyadh. No incentives were provided. Only responses from adults were considered (18 aged and above). A total of 439 complete responses were received. The minimum sample size needed to estimate the true population proportion with a 95% confidence level and a 5% marginal error, which were used to determine a statistically representative sample size for the population is about 385 (i.e., sample size = 439 > 385). This was done using the following equation [15]:
m i n   r e q u i r e d   s a m p l e   s i z e =   N × X X + N 1
where N is the population size (here is 4.7 million), X   =   Z a / 2 2 × p × ( 1 p ) M O E 2 , Z a / 2 is the critical value of the Normal distribution at a / 2 , M O E is the margin of error, and p is the sample proportion. We should highlight that this sample size is the same as the one obtained using the Krejcie and Morgan’s formula [16].
As the sample was established, the researchers then ensured that the key socioeconomic and demographic indicators of the survey respondents are comparable to those of the Riyadh population over age of 18 (i.e., about 4.7 million) [17], if possible. In Table 2, the socioeconomic and demographic of our sample and the Saudi population are presented. It is noticed that there are some deviations from the characteristics of the population such as nationality and monthly income. Preliminary analysis indicates that approximately 18% of the respondents have previously used e-scooters at least once, in which 63% used it outside of Saudi Arabia.

3.2. Adopted Models

In this research effort, two types of logistic regression models were used in the analysis depending on the type of response variables. Details are given in the following subsections.

3.2.1. Binary Logistic Regression Model

A logistic regression model was adopted for binary response variables [18]. The response is assumed to come from a Bernoulli distribution with two potential outcomes e.g., will/will not use e-scooters if the ride-sharing trips are more expensive (usage because of price) or will/will not use e-scooters in the future. This model is capable of accounting for the interactive and confounding factors. The logistic regression model can be formulated as follows:
Y i =   { 1   u s a g e   b e c a u s e   o f   p r i c e   ( o r   w i l l   u s e   t h e m   i n   f u t u r e ) 0 n o   u s a g e   ( o r   t h e y   w i l l   n o t   u s e   t h e m   i n   f u t u r e ) ,  
  i = 1 ,   ,   I
Y i B e r n o u l l i   ( p i )
where I is the number of respondents; p i is probability of Y i = 1 . A logit link function was used to link the probability of having a previous usage of e-scooters ( p i ) with a set of covariates as shown below.
l o g i t ( p i ) =   l o g   ( p i 1 p i ) =   β 0   +   β 1 X 1 i +   β 2 X 2 i +   + β k X k i ,
where X k i is the variable for potential factor k ,   and β k is the corresponding regression coefficient. Several factors were included in the model, including gender, income, sport, and previous e-scooter usage, and the usage of bike. More details are given in the Results Section.

3.2.2. Ordinal Logistic Regression Model
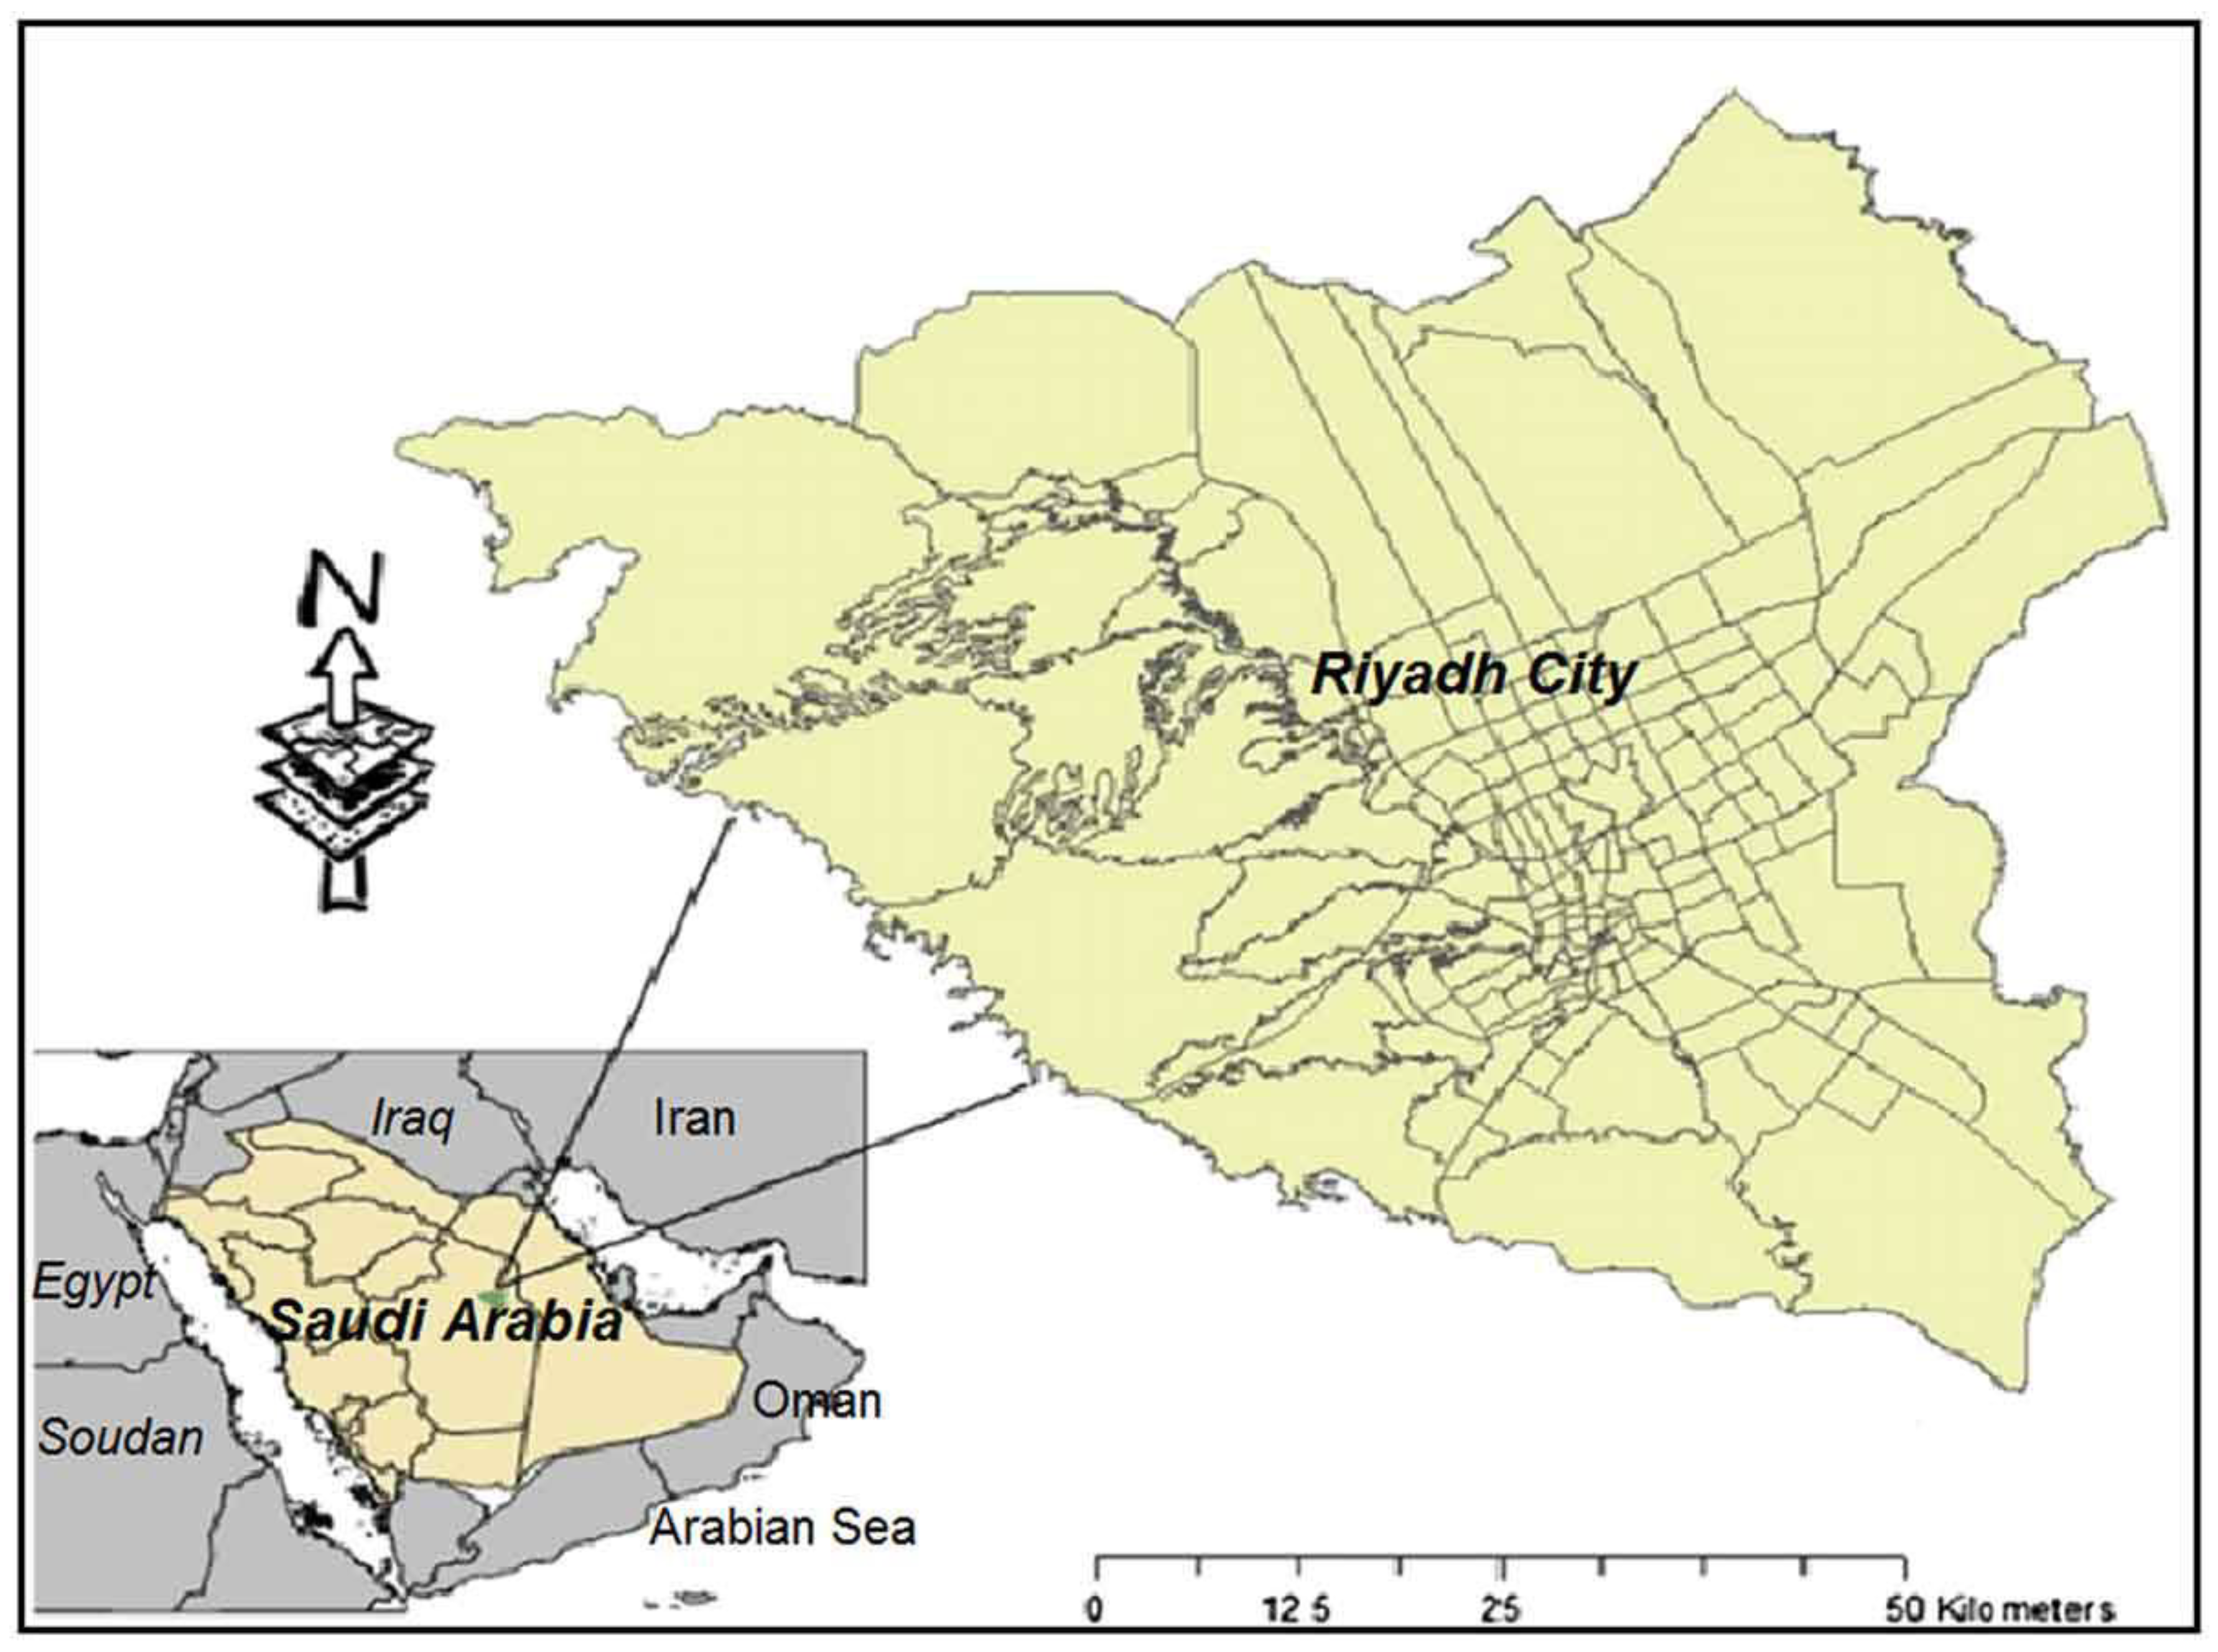
The ordinal logistic regression model was used when the response is categorical and includes many levels that have a natural ordering. For example, a response variable may include “No”, “Maybe”, and “yes” as answers to a question about whether e-scooter is safe. However, these responses can be ordered in levels so that “No” is lower than “Maybe”, which in turn is lower than “Yes” regarding the scale of agreement with the question. Therefore, this natural ordering can be incorporated into the model using different logit transformations of the response probabilities. One possible logit transformation method is using the cumulative probabilities (i.e., P ( Y     j ) =   π 1 + ·   ·   · + π j   where   j   =   1 ,   .   .   .   ,   J   and   P ( Y     J )   =   1 ) based on the natural ordering of the response levels. In this study, we used the proportional odds model that linearly explains the variability in the cumulative probabilities in terms of the explanatory variables’ variations. The proportional odds model is formulated as follows:
l o g   ( P ( Y     j ) P ( Y >   j ) ) = logit ( P ( Y     j ) )   =   β j 0   +   β 1 x 1   +   ·   ·   ·   +   β p x p ,   j   =   1 ,   .   .   .   ,   J     1
It is worth noting that the number of equations describing this model equals the number of the response levels minus one. Moreover, these equations have the same slopes for each category j (but they have different intercepts), which means that explanatory variables have the same effect independent of the P ( Y     j ) that creates the log odds.

4. Area of Study

As mentioned above, Riyadh was chosen for the study given it is the capital and largest city of the Kingdom of Saudi Arabia (Figure 1). It is located in the central region of Saudi Arabia covering a total area of 3115 square kilometers at 600 m above the sea level. Riyadh’s climate is very hot in summer and cool in winter with low humidity levels around the year. According to “Riyadh, Oasis of Heritage and Vision” by Peter Harrigan, there are significant temperature fluctuations between day and night [19]. In the summer, the average temperature rises to 43 °C during the day and 28 °C at night. In the winter, Riyadh climate is cool with temperature dropping to an average of 21 °C during the day and 9 °C at the night and sometimes it gets below zero. Average annual rainfall is about 137 mm [19]. According to the Royal Commission for Riyadh City Population Study conducted in 2016, Riyadh has a population of 6,506,700 persons; 26.6% of which are of ages under 15 years old, 69.2% are of ages between 15 and 59, and 4.2% are of ages 60 and above [20]. In the period between 2004 and 2016, the number of internal migrants to Riyadh city was about 276,000, mainly for work opportunities (75.4%). Most Saudi males wear the traditional Saudi dress (Thobe), which is a loose white dress, yet many wear casual and sport clothes during non-work times. Females in Riyadh wear Abayas which loosely cover the body.
According to Omar Alotaibi asnd Dimitris Potoglou, the first Master plan of Riyadh, which was developed by Doxiadis Associates (Greek consulting firm) in the 1960s considered private cars as the main transportation mode in the city [21]. Accordingly, Riyadh does not have a sufficient public transport system. In the 1990s, the Ministry of Municipal and Rural Affairs developed the Metropolitan Development Strategy for Riyadh (MEDSTAR). The new strategy aims to manage the city development for the next 50 years. MEDSTAR introduced an implementation plan for the authorities working in the city. In addition, MEDSTAR has identified key transport strategies in Riyadh including the development of sufficient public transport system, the alignment of higher density development along major public transport spines, the development of the ring road system to support the congested central arterial roads. Furthermore, the improvement of traffic management practices in Riyadh, the introduction of demand management measures and the development of an integrated corridor management program to ensure that major corridors serve the proposed public transport network and advanced traffic management schemes [20].
According to the Royal Commission for Riyadh City Population Study (2016), the total number of housing units in Riyadh is 1,217,996 housing units; 52% of which are villas and 42% are apartments [20]. Private cars are the major transportation mode in Riyadh (77.2%), followed by buses/vans (16%). There are more than 2 million registered vehicles in Riyadh. The average car ownership in the city is 1.9 car per household. Private cars are the major transportation mode in Riyadh (77.2%), followed by private buses/vans (16.1%), taxis/limousines (3.7%), public buses (2.2%), heavy trucks (0.8%). The average car ownership in the city is 1.9 car per household with more than 2 million registered cars in Riyadh. [20]. Riyadh Metro project, which started construction in 2014, is planned to offer public transport services with a network of six lines that has a total length of 176 km and 85 stations around the city in integration with Riyadh Bus Network [22]. Riyadh Metro project was reported to be 90% complete by the end of 2019, and test runs of several Metro lines were conducted in 2019 and 2020. Riyadh Metro is planned to be fully operational by 2021. In 2019, Riyadh Grand projects were announced aiming to improve air quality, reduce temperature, encourage healthy lifestyles and improve the quality of life in the city. The four projects managed by the Royal Commission for Riyadh City are “King Salman Park Project”, “Green Riyadh Project”, “Sports Boulevard Project” and “Riyadh Art Project”. We hypothesize that these giant projects will create a last-mile transportation problem and thus micro-mobility transportation modes will be needed in the near future.

5. Results

In this section, we present the questionnaire’s outputs using two approaches: descriptive and statistical analysis. In the descriptive approach, we explored and summarized the survey outputs using percentage of response and distribution to show the main findings of the survey. In the statistical analysis approach, we studied the relationship between selected responses and socioeconomic and other information using two logistic regression models, namely: binary and ordinal logistic regression models. We added all the twelve variables (that we collected from the survey) as regressors in the models. The twelve regressors are age, gender, income, sport activity, educational background, professional occupancy, marriage status, car ownership, bike usage, motorcycle usage, ride-hailing apps usage, and previous e-scooter usage. More information is given in the following two subsections.

5.1. Descriptive Results

Table 3 summarizes the distribution of using e-scooters between respondents in Saudi Arabia in terms of several categories. Here are some important observations to note. The survey shows that 40% of the respondents have never used an e-scooter for any purpose and are unfamiliar with it, whereas 42% of the respondents, although familiar with e-scooters, have never used it before. However, only approximately 10% reported having used an e-scooter at least once and roughly 8% of the respondents have used e-scooters more than once. In addition, the survey shows that roughly 63% of e-scooter users have used them outside Saudi Arabia, whereas the opposite is true for the remaining 32%. The survey investigated the potential purposes of e-scooter use in Saudi Arabia by instructing the respondents to answer the related question in a multiple answer format. In other words, several respondents may have used (or will have used) e-scooters for various reasons and not necessarily for one purpose. This means that the response rates may not equal to 100%. Results of the potential purposes of using e-scooters are summarized in Figure 2. It is worth noticing that entertainment was the major (potential) purpose for using e-scooter sharing systems in Saudi Arabia. Notably, roughly 16.9% of non-user respondents are willing to use e-scooters for reasons other than the abovementioned. Respondents who used them only once came next with 8.8% followed by frequent users at only 2.2%. This finding indicates that those who never used e-scooters previously expressed more enthusiasm to use e-scooters for new potential purposes that should be determined and implemented by operators. The following subsections investigate in details four main findings.

5.1.1. Safety of E-Scooters

A part of the survey was dedicated to the investigation of the respondents’ experience and perception of the safety of e-scooters. A total of 19% of respondents who have previously used e-scooters have been involved in crashes related to e-scooters (this type of crashes can be assigned into one or multiple categories, such as an e-scooter hitting a pedestrian or vehicle/fixed object or being hit by a vehicle and high-risk or reckless behavior by an e-scooter rider that may have directly or indirectly caused an accident). Additionally, 38% of the same respondent category were involved in a near-miss crash (i.e., an unplanned event that has the potential to cause but does not actually result in human injury, environmental, or equipment damage, or an interruption to normal operation [23]. These respondents indicated that 51% of the crashes and/or near-miss crashes took place inside Saudi Arabia, whereas the remainder occurred outside Saudi Arabia. This relatively high percentage of e-scooter crash involvement is backed by recently published reports and studies such as Namiri et al. [24]. Exploring the perception of e-scooter safety, the majority of respondents (82%) who have previously used e-scooters reported that they consider e-scooters a safe or may be a safe mode of transportation, whereas only 18% consider e-scooters as unsafe. On the contrary, approximately 63% of the respondents who have never used an e-scooter expect that e-scooters will be safe or at least may be safe, whereas more than the third anticipate that e-scooters will unsafe. However, 90% of the respondents who expect or consider e-scooters an unsafe mode of transportation have never ridden one, 5% have ridden at least one inside Saudi Arabia, and 4% have ridden at least one outside Saudi Arabia. Only 1% has used an e-scooter inside and outside Saudi Arabia and still considers e-scooters unsafe.

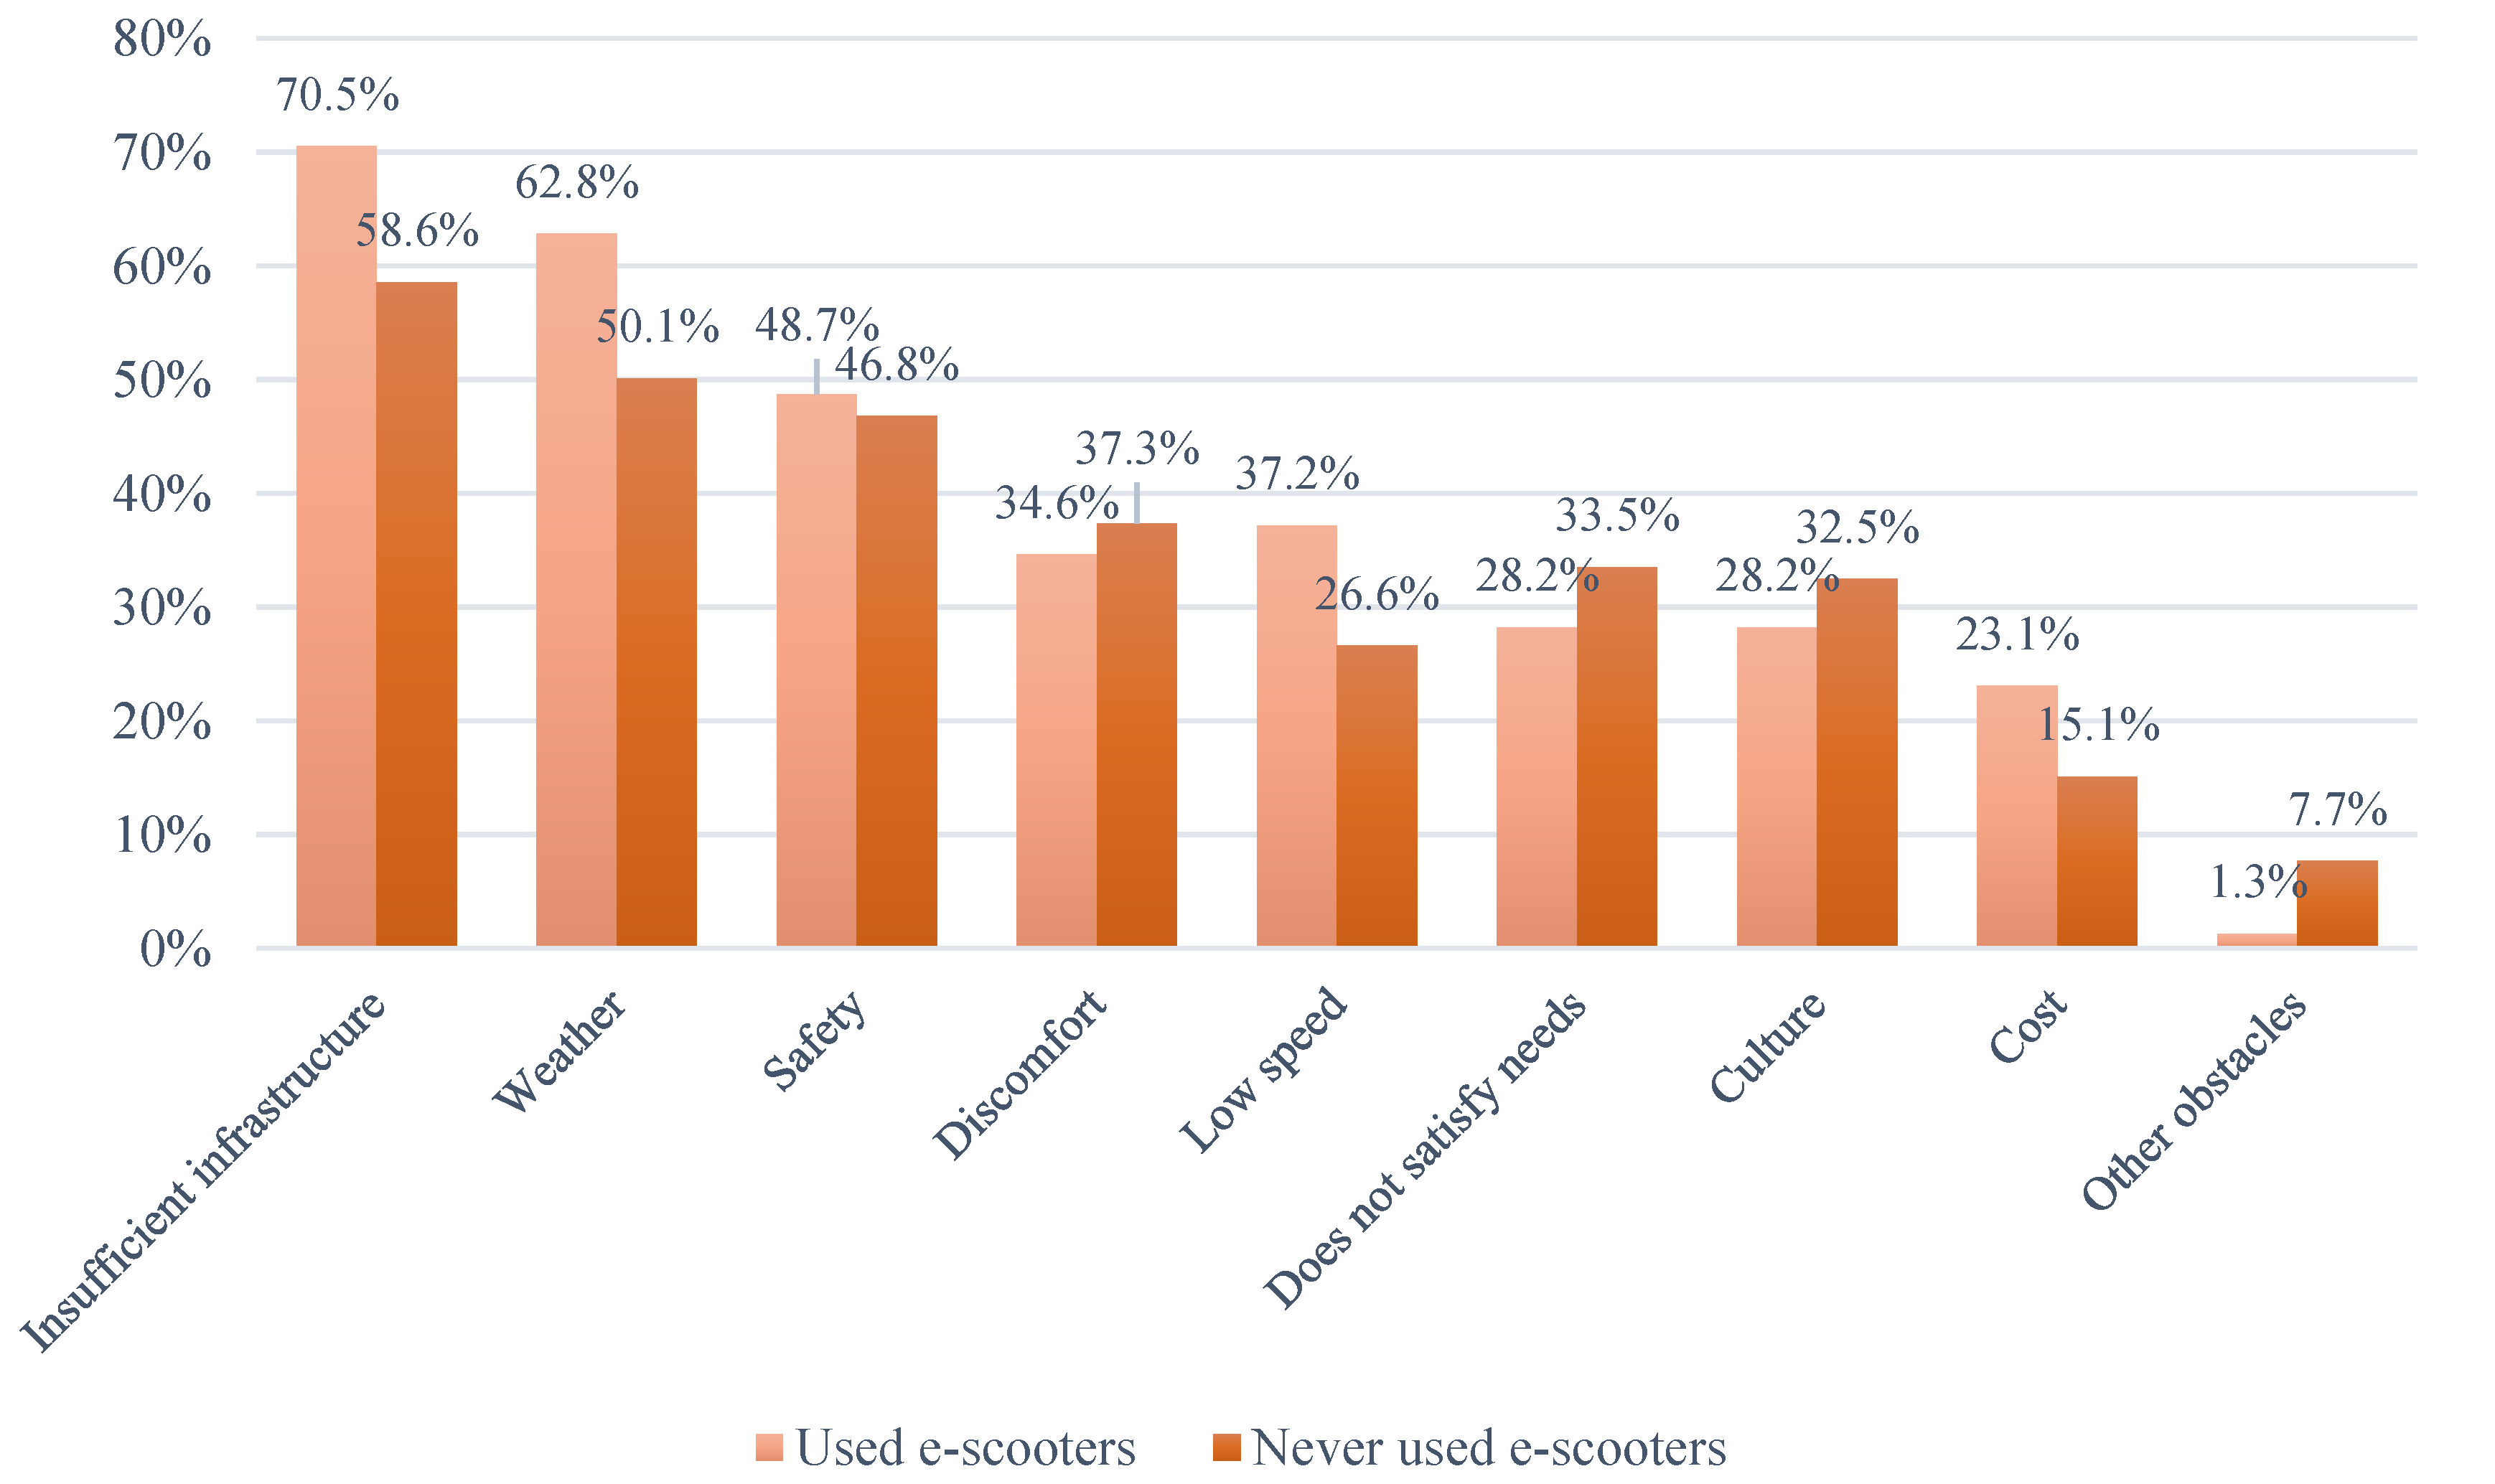
5.1.2. Obstacles to Deployment of E-Scooters

The study explored the obstacles that may delay the deployment of e-scooter systems or impede the usage of such systems in Saudi Arabia. Toward this end, multiple answer questions were used. In other words, the response rates may not add up to 100%. Respondents who have used e-scooters reported that insufficient infrastructure, weather, safety, low speed, discomfort, satisfaction of needs, culture, and cost are a few of the obstacles that faces the deployment and usage of e-scooters. Similarly, respondents who have never used an e-scooter indicated that they expect the same obstacles but, to a certain extent, with different response rates for several of the abovementioned obstacles, as shown in Figure 3. The respondents were enabled to add other obstacles as an option. Respondents added two main obstacles, namely, wearing traditional dresses and age of the user, which could be linked to culture as well.

5.1.3. E-Scooters and Ride-Hailing

The study investigated the relationship between e-scooter systems as micromobility trend and ride-hailing systems (e.g., Uber/Careem) in Saudi Arabia. The recent years have witnessed the introduction of different mobility network trends, such as MaaS. The introduction of these mobility solutions may enable them to become more integrated in the public transportation system in the near future [25]. Approximately 82% of the respondents who frequently use ride-hailing services have used and/or are willing to use e-scooters if available, whereas only around 18% have not and are unwilling to use e-scooters. However, the percentage of those who have used and/or are willing to use e-scooters decreased to 77% for non-frequent users of ride-hailing services. Economically, approximately 54% of respondents, out of which only 20% are frequent users of ride-hailing services, stated that they will use or continue to use ride-hailing systems even if they will cost more than e-scooters. However, 46% will use an e-scooter system instead if it costs less.

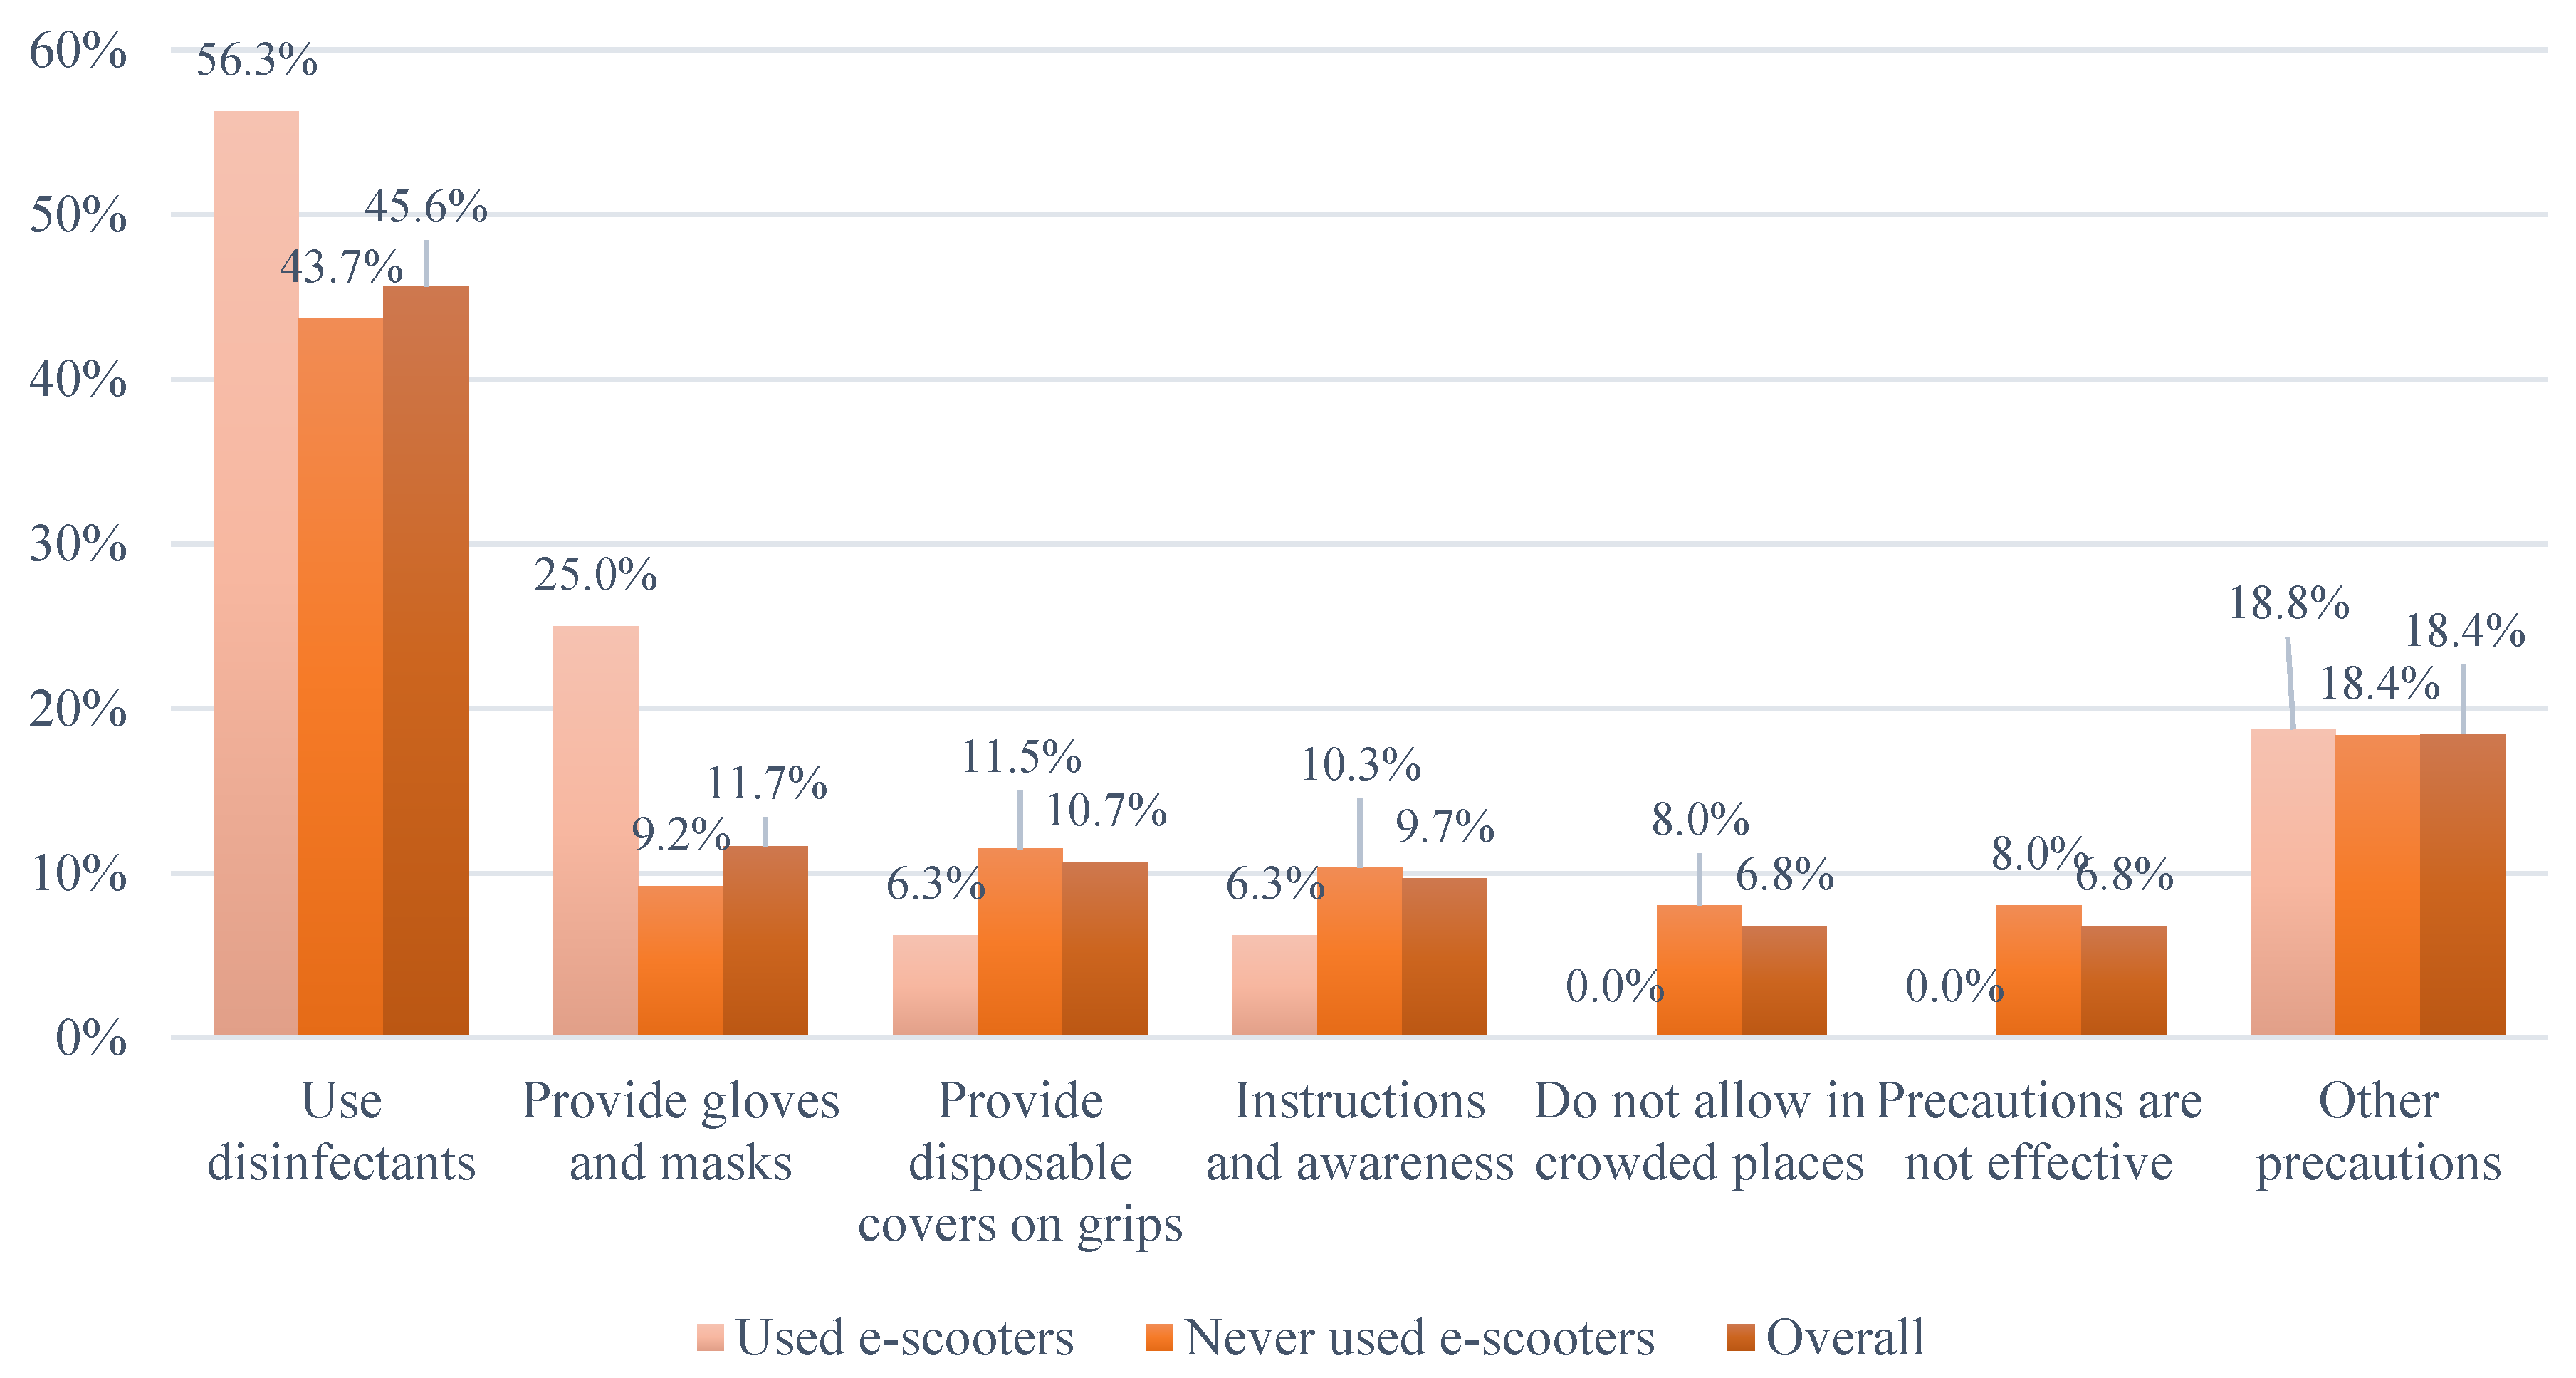
5.1.4. E-Scooters and the COVID-19 Effect

As the debate over the future of transportation continues in the midst of the COVID-19 pandemic as a deepening global crisis, micromobility seems to be not spared by the quick and disrupting changes that may arise from the pandemic that swept the world [26,27]. Part of the survey was designed to gauge the respondents’ perception of the effect of the COVID-19 pandemic on the use of e-scooters in Saudi Arabia. Results are shown in Table 4. Notably, more than half of the respondents who have previously used e-scooters indicated that e-scooter usage will decrease, whereas 41% indicated that it will not be affected, and 8% suggested that the usage will increase. Moreover, the study investigated the respondents’ reactions to the process of applying safety precautions against the spread of COVID-19 disease on e-scooter systems, as shown in Table 4. Approximately one-third of respondents who have previously used e-scooters indicated that applying safety precautions will decrease fears and concerns, about half of them indicated that it may decrease fears, and the remainder suggested that it will not decrease fears of using e-scooters due to the spread of the COVID-19 disease.
Respondents were also asked to suggest precautions to be considered by e-scooter operators to reduce the fear of using e-scooters due to the COVID-19 pandemic. More than 100 suggestions were provided, which can be grouped into five main categories. Respondents suggested that operators should provide disinfectants, such as sprays or wipes, for each e-scooter, single-use gloves and masks, disposable covers on grips, and infographics to increase awareness of self-sanitary and cleanliness. Figure 4 provides detailed results. Responses on the other precautions option were analyzed and found that the majority is related to policy and regulations, such as the importance of following preventive measures and precautions issued by the government.
Respondents were also asked to suggest potential places to deploy e-scooter sharing systems in Saudi Arabia. Table 5 shows the details of the suggested places with a few examples. Suggested places can be classified into nine main categories, namely, open entertainment areas, shopping centers and malls, building complexes, residential areas and compounds, downtown cities, seasonal large events, and other places, such as parking lots and stations.

5.2. Statistical Analysis Results

In this research effort, three logistic regression models were built with the same twelve variables but with different responses. The twelve regressors are age, gender, income, sport activity, educational background, professional occupancy, marriage status, car ownership, bike usage, motorcycle usage, ride-hailing apps usage, and previous e-scooter usage as listed in Table 6. The three responses are the usage because of price (prefers to use e-scooter if ride-hailing trips is more expensive) and the willingness to use e-scooters both as binary, and the attitude toward the safety of the e-scooters as ordinal (Table 7). The following subsections present in details the outputs of each model. We also showed the p-value, standard deviation, and the coefficient estimate for each variable as well as LogWorth, which is defined as - l o g 10 (p-value). This transformation adjusts p-values to provide an appropriate scale for graphing.

5.2.1. Binary Logistic Regression Model

i.
Response: e-scooter usage because of price
The binary logistic regression was adopted with the response of the e-scooter usage because of price. The effect summary of regressors of the binary logistic regression model is shown in the Appendix A (Table A1). There are only two significant factors: sport activity and gender. The goodness of fit tests was conducted and summarized (Appendix A, Table A2). The Whole Model Test shows the model is significant as a whole and means there is a significant difference between the reduced model and the full model. The results show that men are less likely to use e-scooters because of price. The odds ratio o d d s u s i n g   e s c o o t e r |   f e m a l e o d d s u s i n g   e s c o o t e r |   m a l e = e 0.4154001 = 1.52 given all coefficients else are unchanged (calculated from Table 8). That means the odds for females using e-scooters because of price are 52% higher than the odds for male using e-scooters because of price. Similarly, as for sport activity, people who never do physical activity are more likely to use e-scooters because of price than active people.
ii.
Response: willingness to use in the future
The binary logistic regression was adopted again but with the response of “willingness to use in the future”. The model includes the previous regressors, excluding the “previous bike usage” given this question was only for those who have not used in the past. The effect summary of regressors of the binary logistic regression model are shown in the Appendix A (Table A3). There are three significant factors: gender, age, and ride-hailing apps usage. The goodness of fit tests was conducted and summarized in (Appendix A, Table A4). The Whole Model Test shows the model is significant as a whole, which means there is a significant difference between the reduced model and the full model. Before discussing the results, it is worth noting that we removed the Motorcycle Usage as a factor from this model because, if included, the model becomes numerically singular and thus unstable. The results given in Table 9 show that women are more likely to use e-scooter in the future. As for age, being in the middle age are more likely to use e-scooter than other age groups. Additionally, ride-hailing users are more likely to use e-scooter than who do not usually use the service.

5.2.2. Ordinal Logistic Regression Model

The effect summary of regressors of the ordinal logistic regression model is shown in the Appendix A (Table A5). There are three significant factors: previous e-scooter usage, age, and income. The goodness of fit tests was conducted and summarized (Appendix A, Table A6). The Whole Model Test shows the model is significant as a whole, which means there is a significant difference between the reduced model and the full model. The results show (Table 10) the following:
1-
For people who are in the age group of 31–45, the odds of being more likely to feel safety toward scooters is 1.85 times that of participant in the other age groups.
2-
For people who had a previous e-scooter usage, the odds of being more likely to feel safety toward e-scooters is 1.43 times that of participant who did not have a previous e-scooter usage.

6. Discussion

The study investigates the Saudis’ perception of launching e-scooter sharing systems as a new mobility mode for public transportation in Saudi Arabia. Results showed that the majority of the Saudi community is unfamiliar with e-scooter systems as most of them have never used an e-scooter previously. Most of those who have ridden e-scooters before—have tried it outside Saudi Arabia. In addition, e-scooters are still not legislated and officially launched yet in Saudi Arabia. Only two pilot studies were recently conducted for only 2–3 weeks. Moreover, results showed that e-scooter systems have the potential to increase in demand on the Saudi market and attract riders for various purposes. A significant percent of the respondents who have never used an e-scooter previously have expressed willingness to use it if available.
The survey revealed that males will be potentially using such a system more than females in Saudi Arabia, and the age of the majority of potential users will presumably be between 18 and 45 years old, which presents the largest portion of the Saudi community (more than half of the population [17]). The low potential female users may be related to the low number of females’ participation in the workforce, and also the low number of female drivers given the ban on women driving was lifted recently. Thus, we hypothesize that this would change if females’ participation in the workforce is increased. As for income, potential e-scooter users will most likely belong to all income levels. However, many of them may belong to the relatively low-income groups as many are students and relatively young users. People who frequently use ride-hailing services, such as Uber and Careem, tend to show more willingness to use e-scooters in the future. This tendency refers to the idea that both systems (e-scooters as micromobility and Uber/Careem as ride-hailing mobility) are part of the mobility network trend that was introduced recently as MaaS. The introduction of these mobility solutions may lead them to become more integrated in the public transportation system in the future. However, most of the frequent ride-hailing users tend not to prefer e-scooters even if an e-scooter ride will cost less than the same ride in Uber or Careem. This preference could be due the abovementioned obstacles that face the deployment of e-scooter systems in Saudi Arabia (Figure 4).
The survey revealed that e-scooters may be used for many reasons in various places in Saudi Arabia. The main purpose for riding an e-scooter would seemingly be for entertainment. However, other purposes may include commuting between home and work, shopping, visiting family or friends, and switching to another mode of transportation. This finding could be explained by the nature of the current travel behavior of people in Saudi Arabia, which is mainly based on driving private cars for most daily trips [28]. Respondents who have never used an e-scooter are more likely to use it, if ever, for entertainment. They also might be ready to use them for a variety of purposes, such as switching to another mode of transportation, shopping, visiting family or friends, and commuting between work and home.
The recent proliferation in e-scooter use across the world has raised concerns regarding the safety of riders and pedestrians [29]. Saudi’s perception with regard to e-scooter safety is seemingly positive as half of the respondents reported that e-scooters may be safe for use. Notably, the majority of respondents who have used e-scooters have not been involved in a crash with an e-scooter, but more than the third have been involved in a near-miss. This finding indicates that considering precautions and ensuring safety is crucial for potential operators and regulators if they plan to deploy an e-scooter system. The majority of the Saudi community appears to have certain concerns related to e-scooter safety as approximately 90% have never used it previously. However, their perception is projected to change positively as they start experiencing the system directly or indirectly, such as seeing others use them. In this manner, we recommend that operating agencies should incentivize potential users to encourage them to become frequent riders (e.g., by offering a special discount rate for first-time users).
The findings revealed several obstacles facing the deployment of e-scooter systems in Saudi Arabia. Results showed that the three top ranked obstacles in Saudi Arabia are insufficient infrastructure, weather, and safety. In this regard, the respondents suggested various potential deployment places based on these obstacles. As the number of shopping centers is increasing rapidly in new locations with relatively large areas, such as supermarkets, food courts, and playgrounds, the respondents proposed malls as potential areas for the deployment of e-scooters. Additionally, building complexes, such as the King Abdullah Financial District, Diplomatic Quarter in Riyadh, university campuses, and medical cities can also be potential places for e-scooters. Such places have free-car policy zones and a relatively sufficient and suitable infrastructure for e-scooters as a micromobility mode (e.g., protected and safe sidewalks). The study argues that these suggested places will hypothetically be worthy of consideration if operators will deploy e-scooter sharing systems in Saudi Arabia in the meantime given the various obstacles.
City downtowns are typically suitable places for e-scooter systems. As the heart of the city, downtowns streets suffer from traffic congestions during the day. Thus, they become a potential place for successful e-scooter sharing systems especially for short trips (i.e., last-mile trips). A very dynamic and 24 h congested downtown in Saudi Arabia is the central area of the Makkah and Madinah cities, which contain the two holy mosques in the Islamic world. According to the Ministry of Hajj and Umrah, the two central areas receive more than 10 million visitors every year (inside and outside Saudi Arabia). Thereby, the government dedicated this area as a very limited entry zone or no-entry for personal cars to accommodate the high number of visitors [30]. Launching e-scooter sharing systems will facilitate mobility in these areas and help in the case of walking long distances. This scenario will become crucial during the annual Islamic pilgrimage (Hajj) to Makkah city, where approximately three million visitors gather in one location and move simultaneously from one place to another (with short distances in between), thus leading to an over-capacity demand for transportation networks.
Results indicated that few suggested roads and retail streets are candidates for the deployment of e-scooter systems in Saudi Arabia due to the current insufficient infrastructure. This perception is expected to be changed in the future if infrastructure is improved in these areas in Saudi Arabia. Similarly, very few suggested using e-scooters to switch from one transportation mode to another as Saudi Arabia lacks the efficient public transportation system in many cities. In the suburbs, e-scooter systems may be a successful transportation mode in economical and industrial cities, resorts, and certain provinces to meet the demand of short-distance commute without the need to drive personal vehicles.
Survey revealed that insufficient infrastructure may impede the success of e-scooter systems in different cities in Saudi Arabia. Sufficient infrastructure is essential to facilitate the effective integration of e-scooters into the urban mobility ecosystem and for users to commute safely and efficiently when passing nearby cars and/or pedestrians [31,32]. In addition, results showed that closed areas may be suitable for the launch of the system because the weather is typically very hot in summer (~45 °C), which may also hinder the deployment of e-scooters [31,33]. We hypothesize that deploying e-scooters in open areas would meet the demand of users who would use them during the early morning or after sunset.
In terms of deployment obstacles, although it seems that e-scooter safety is a shared concern in the Saudi community, other impediments include uncomfortableness of riding e-scooters as a transportation mode for commuting, which could be related to the current insufficient infrastructure. To mitigate this belief, introducing policies regarding maximum speed, especially in vulnerable congested areas, is prudent for operating agencies and urban planners [34]. In contrast, results show that many respondents view this scenario as a disadvantage given that it will increase the delay in travel time. Furthermore, other obstacles imply that e-scooters fail to satisfy certain needs, such as the capacity issue of e-scooters. However, trip cost may not be essential in limiting the usage of e-scooters.
Although the full impact of COVID-19 on mobility remains to be seen in the future, its immediate effect “has forced many of us to break out of our travel habits” [26]. Micro-mobility has gained a steady increase in demand in recent years because of its ability to provide convenient, pleasurable, and independent travel. During the COVID-19 lockdown in many cities, many people have started using e-scooters (along with bikes) for leisure, to remain healthy, for mobility, and to maintain social distancing [26,27]. In Saudi Arabia, a shared concern appears that e-scooter usage might decrease due to fears from the spread of COVID-19. E-scooters grips, for example, may become a source of the spread of COVID-19. In spite of this tendency, the finding revealed hope that COVID-19 will have a minimal effect on e-scooter demand, whereas others believe that the pandemic may increase the usage of e-scooters. People moving in short distances will aim to maintain the required social distancing by avoiding modes of public transportation, which may result in increased usage of e-scooters. Precautions and preventive measures have been proven efficient in reducing the spread of viruses [35,36]. As a result, considering the required precautions to reduce the spread of COVID-19 by e-scooter operators will decrease or decrease the fear and concerns related to the use of e-scooters. The respondents suggested that providing disinfectants, gloves and masks for riders, and disposable covers on e-scooter grips. Additionally, findings illustrated that instructions and awareness, which should be provided by operators, are also crucial.
There are some limitations to this study. First, the sample size might not be considered statistically representative, some of the key socioeconomic and demographic indicators of the survey respondents could be deemed incomparable to those of the Saudi Arabia population. For example, females were under-represented in the sample and the young population was over-represented. Second, this study could be implemented to data from different geographical locations in the Saudi Arabia. A different survey from different locations in Saudi Arabia could further leverage this study to increase its veracity and might shift some of its conclusions. Still, the results of this study primarily contain significant finding in this field to build on, the first of its kind, and sheds the light of significant new understanding of this emerging class of shared-road users that policy-makers, operators, and researchers would find intriguing to understand for safety, transportation, health, and recreation purposes.

7. Conclusions

Micromobility transportation modes have blossomed recently in many dense and congested cities across the world motivated by the increased over-capacity daily traffic demand. E-scooter sharing systems, which are examples of the MaaS mode, have been widely deployed as a means to minimize the usage of personal vehicles mainly for short trips. A number of recent studies investigated users’ perception of using e-scooter systems as a micro-mobility mode. The present study analyzed the outputs of the survey on the perception of potential users of e-scooter systems as a new micro-mobility mode in the city of Riyadh which has not been launched officially. In particular, the study explored the socioeconomic and demographic factors that influence the perception of potential users living in Riyadh. Additionally, the study investigated the respondents’ reaction on the spread of COVID-19 and how it might influence the deployment of e-scooter systems. A web-based questionnaire was conducted in April 2020 targeting e-scooter riders and non-riders. A sample of 439 respondents from various age groups, educational background, level of income, and gender was collected. Approximately 18% of the survey respondents has previously used an e-scooter at least once (others have used e-scooters inside and outside Saudi Arabia). Two types of logistic regression models were built. The outcomes of the models show that gender, age, and using ride-hailing services play an important role in respondents’ willingness to use e-scooter. This study provides significant findings that would be beneficial for policymakers, operators, and researchers in understanding this emerging class of mobility system.

Author Contributions

Conceptualization, M.H.A., M.E. and H.I.A.; methodology, M.H.A., M.E. and H.I.A.; software, F.A.A.; validation, M.H.A., M.E. and H.I.A.; formal analysis, F.A.A., M.H.A., M.E. and H.I.A.; investigation, F.A.A., M.H.A., M.E. and H.I.A.; resources, M.H.A. and M.M.; data curation, M.H.A. and M.E; writing—original draft preparation, F.A.A., M.H.A., M.E. and H.I.A.; writing—review and editing, M.M.; visualization, M.M.; supervision, A.R.; project administration, M.H.A.; funding acquisition, M.H.A. All authors have read and agreed to the published version of the manuscript.

Funding

This research received funds from: Researchers Supporting Project number (RSP-2020/291), King Saud University, Riyadh, Saudi Arabia.

Data Availability Statement

Dataset is available upon request.

Acknowledgments

Researchers Supporting Project number (RSP-2020/291), King Saud University, Riyadh, Saudi Arabia.

Conflicts of Interest

The authors declare no conflict of interest.

Appendix A

Table A1. Effect Summary of the coefficients of binary logistic regression model (Response: the e-scooter usage because of price).
SourceLogWorth p-Value
Sport Activity2.385 Sustainability 13 00863 i0010.00412
Gender1.548 Sustainability 13 00863 i0020.02834
Age1.037 Sustainability 13 00863 i0030.09187
Bike usage0.830 Sustainability 13 00863 i0040.14786
Marriage status0.626 Sustainability 13 00863 i0050.23661
motorcycle usage0.539 Sustainability 13 00863 i0060.28918
Professional occupancy0.518 Sustainability 13 00863 i0070.30313
Income0.451 Sustainability 13 00863 i0080.35369
Educational background0.187 Sustainability 13 00863 i0090.64957
Ride-hailing apps Usage0.118 Sustainability 13 00863 i0100.76178
Car ownership0.089 Sustainability 13 00863 i0110.81426
Previous e-scooter usage0.068 Sustainability 13 00863 i0120.85569
Table A2. Goodness of fit statistics (Response: the e-scooter usage because of price).
Whole Model Test
Model-LogLikelihoodDFChiSquareProb > ChiSq
Difference27.962102555.924190.0004
Full273.37498
Reduced301.33708
Goodness of fit
R-Square0.0928
AIC602.174
BIC704.828
Table A3. Effect Summary of the regressors of binary logistic regression model (Response: willing to use in the future).
SourceLogWorth p-Value
Gender1.859 Sustainability 13 00863 i0130.01384
Age1.760 Sustainability 13 00863 i0140.01739
Ride-hailing Systems Usage1.648 Sustainability 13 00863 i0150.02250
Professional Occupancy0.827 Sustainability 13 00863 i0160.14887
Marriage status0.332 Sustainability 13 00863 i0170.46510
bike usage0.309 Sustainability 13 00863 i0180.49037
Sport Activity0.265 Sustainability 13 00863 i0190.54283
Educational Background0.082 Sustainability 13 00863 i0200.82740
Income0.078 Sustainability 13 00863 i0210.83487
Car Ownership0.021 Sustainability 13 00863 i0220.95255
Table A4. Goodness of fit statistics (Response: willing to use in the future).
Whole Model Test
Model-LogLikelihoodDFChiSquareProb > ChiSq
Difference37.190504674.3810.0051
Full321.91653
Reduced359.10704
Goodness of fit
R-Square0.1036
AIC755.007
BIC926.233
Table A5. Effect Summary of the coefficients of binary logistic regression model (Response: Do you think e-scooter is a safe mode).
SourceLogWorth p-Value
Previous e-scooter usage2.087 Sustainability 13 00863 i0230.008
Age1.525 Sustainability 13 00863 i0240.029
Income1.520 Sustainability 13 00863 i0250.030
Marriage status0.726 Sustainability 13 00863 i0260.187
bike usage0.605 Sustainability 13 00863 i0270.248
Sport Activity0.559 Sustainability 13 00863 i0280.275
gender0.532 Sustainability 13 00863 i0290.293
Car Ownership0.456 Sustainability 13 00863 i0300.350
Educational Background0.435 Sustainability 13 00863 i0310.367
motorcycle usage0.240 Sustainability 13 00863 i0320.5757
Ride-hailing Systems Usage0.156 Sustainability 13 00863 i0330.699
Professional Occupancy0.088 Sustainability 13 00863 i0340.815
Table A6. Goodness of fit statistics (Response: Do you think e-scooter is a safe mode).
Whole Model Test
Model-LogLikelihoodDFChiSquareProb > ChiSq
Difference30.502892561.00578<0.0001
Full396.41541
Reduced426.91830
Goodness of fit
R-Square0.0714
AIC850.528
BIC956.989

References

  1. Lawler, R. “Zipcar for Scooters” Startup Scoot Networks Launches to the Public in San Francisco. 2012. Available online: http://tcrn.ch/SlDjD3 (accessed on 15 July 2020).
  2. Howe, E.; Bock, B. Global Scooter Sharing Market Report, 2018 ed.; InnoZ-Innovation Centre for Mobility and Societal Change: Berlin, Germany, 2018; Available online: https://cdn.unumotors.com/press/releases/en/1211-unu-sharing-report-2019-en.pdf (accessed on 15 July 2020).
  3. National Association of City Transportation Officials (NACTO). Shared Micromobility in the U.S.: 2018. Available online: https://nacto.org/shared-micromobility-2018 (accessed on 15 July 2020).
  4. Smith, C.S.; Schwieterman, J.P. E-scooter scenarios: Evaluating the potential mobility benefits of shared dockless scooters in Chicago. In Proceedings of the Transportation Research Board 97th Annual Meeting, Washington, DC, USA, 13–17 January 2018. [Google Scholar]
  5. Anderson-Hall, K.; Bordenkircher, B.; O’Neil, R.; Scott, S.C. Governing micro-mobility: A nationwide assessment of electric scooter regulations. In Proceedings of the Transportation Research Board 98th Annual Meeting, Washington, DC, USA, 13–17 January 2019. [Google Scholar]
  6. Shaheen, S.; Chan, N. Mobility and the sharing economy: Potential to facilitate the first-and last-mile public transit connections. Built Environ. 2016, 42, 573–588. [Google Scholar] [CrossRef]
  7. Chen, C.-F.; Cheng-Chien, K.; Yi-Ju, L. Investigating barriers and facilitators of attitude and intention to use e-scooter sharing system. In 22nd International Conference of Hong Kong Society for Transportation Studies: Transport and Society, HKSTS 2017; Hong Kong Society for Transportation Studies Limited: Hong Kong, China, 2017; pp. 399–406. [Google Scholar]
  8. Almannaa, M.H.; Ashqar, H.I.; Elhenawy, M.; Masoud, M.; Rakotonirainy, A.; Rakha, H. A Comparative Analysis of E-scooter and E-bike Usage Patterns: Findings from the City of Austin, TX. Int. J. Sustain. Trans. 2020. [Google Scholar]
  9. Aguilera-García, A.; Gomez, J.; Sobrino, N. Exploring the adoption of moped scooter-sharing systems in Spanish urban areas. Cities 2020, 96, 102424. [Google Scholar] [CrossRef]
  10. Fitt, H.; Curl, A. Perceptions and experiences of Lime Scooters: Summary Survey Results. 2019. Available online: https://ir.canterbury.ac.nz/handle/10092/16336 (accessed on 15 July 2020).
  11. Huang, F.-H.; Lin, S.-R. A Survey of User Experience of Two Wheeler Users in Long-Term Interactions in Congress of the International Ergonomics Association; Springer International Publishing: Cham, Switzerlnd, 2019; pp. 1465–1472. [Google Scholar]
  12. James, O.; Swiderski, J.I.; Hicks, J.; Teoman, D.; Buehler, R. Pedestrians and e-scooters: An initial look at e-scooter parking and perceptions by riders and non-riders. Sustainability 2019, 11, 5591. [Google Scholar] [CrossRef] [Green Version]
  13. Laa, B.; Leth, U. Survey of E-scooter users in Vienna: Who they are and how they ride. J. Transp. Geogr. 2020, 89, 102874. [Google Scholar] [CrossRef]
  14. Sanders, R.L.; Branion-Calles, M.; Nelson, T. To scoot or not to scoot: Findings from a recent survey about the benefits and barriers of using E-scooters for riders and non-riders. Transp. Res. Part A Policy Pr. 2020, 139, 217–227. [Google Scholar] [CrossRef]
  15. Daniel, W.W.; Cross, C.L. Biostatistics: A Foundation for Analysis in the Health Sciences; Wiley: Hoboken, NJ, USA, 2018. [Google Scholar]
  16. Krejcie, R.V.; Morgan, D.W. Determining Sample Size for Research Activities. Educ. Psychol. Meas. 1970, 30, 607–610. [Google Scholar] [CrossRef]
  17. General Authority for Statistics (GASTAT). The Total Population in Saudi Arabia. 2020. Available online: https://www.stats.gov.sa/en (accessed on 15 July 2020).
  18. Tranmer, M.; Elliot, M. Binary Logistic Regression. Available online: http://link.springer.com/chapter/10.1007/978-1-4757-3462-1_10 (accessed on 15 August 2020).
  19. Harrigan, P. Riyadh Oasis of Heritage and Vision; Medina Publishing: Riyadh, Saudi Arabia, 2013. [Google Scholar]
  20. ADA. Riyadh City Population Study. 2016. Available online: https://www.rcrc.gov.sa/res/ada/ar/Researches/Riyadh-Population-Study-1437H-2016/index.html (accessed on 5 December 2020).
  21. Alotaibi, O.; Potoglou, D. Introducing public transport and relevant strategies in Riyadh City, Saudi Arabia: A stakeholders’ perspective. Urban, Plan. Transp. Res. 2018, 6, 35–53. [Google Scholar] [CrossRef]
  22. ADA. Riyadh Metropolitan Development Strategies, Executive Summary. 2013. Available online: http://www.ada.gov.sa/res/ada/ar/Researches/Riyadh_Metropolitan_Development_Strategy_Executive_Summary/index.html#/11/ (accessed on 5 December 2020).
  23. Occupational Safety and Health Administration (OSHA). Incident Investigation. 2020. Available online: https://www.osha.gov/dcsp/products/topics/incidentinvestigation/ (accessed on 15 July 2020).
  24. Namiri, N.K.; Lui, H.; Tangney, T.; Allen, I.E.; Cohen, A.J.; Breyer, B.N. Electric scooter injuries and hospital admissions in the United States, 2014–2018. JAMA Surg. 2020, 155, 357–359. [Google Scholar] [CrossRef] [PubMed] [Green Version]
  25. Aasebø, H.K.W. Shared Micro Mobility: What Is Happening in Our Streets? Master’s Thesis, University of Oslo, Oslo, Norway, 2019. Available online: https://www.duo.uio.no/bitstream/handle/10852/69645/7/AaseboHaakon.pdf (accessed on 15 July 2020).
  26. Chang, A.; Miranda-Moreno, L. “Rethinking the Way We Move Beyond COVID-19,” SAE Technical Paper WP-0012; McGill University: Montreal, Canada, 2020. [Google Scholar]
  27. Atkinson, C. The Future of Mobility—Lessons from a Pandemic. 2020. Available online: https://www.linkedin.com/pulse/future-mobility-lessons-from-pandemic-chris-atkinson-chris-atkinson/ (accessed on 15 July 2020).
  28. Al-Atawi, A.; Saleh, W. Travel behaviour in saudi arabia and the role of social factors. Transport 2014, 29, 269–277. [Google Scholar] [CrossRef] [Green Version]
  29. Sikka, N.; Vila, C.; Stratton, M.; Ghassemi, M.; Pourmand, A. Sharing the sidewalk: A case of e-scooter related pedestrian injury. Am. J. Emerg. Med. 2019, 37, 1807.e5–1807.e7. [Google Scholar] [CrossRef] [PubMed]
  30. Ministry of Hajj and Umerah. Open Data Platform; 2020. Available online: https://www.haj.gov.sa/en/InternalPageCategories/Details/50 (accessed on 15 July 2020).
  31. Hardt, C.; Bogenberger, K. Usage of e-Scooters in Urban Environments. Transp. Res. Procedia 2019, 37, 155–162. [Google Scholar] [CrossRef]
  32. Liu, M.; Seeder, S.; Li, H. Analysis of e-scooter trips and their temporal usage patterns. Inst.Transp. Engineers. ITE J. 2019, 89, 44–49. [Google Scholar]
  33. Mathew, J.K.; Liu, M.; Bullock, D.M. Impact of weather on shared electric scooter utilization. In Proceedings of the 2019 IEEE Intelligent Transportation Systems Conference (ITSC), Auckland, New Zealand, 27–30 October 2019; pp. 4512–4516. [Google Scholar]
  34. Gössling, S. Integrating e-scooters in urban transportation: Problems, policies, and the prospect of system change. Transp. Res. Part D Transp. Environ. 2020, 79, 102230. [Google Scholar] [CrossRef]
  35. World Health Organization (WHO). Infection Prevention and Control of Epidemic- and Pandemic-Prone Acute Respiratory Diseases in Health Care. 2007. Available online: https://www.who.int/csr/resources/publications/WHO_CDS_EPR_2007_6c.pdf (accessed on 15 July 2020).
  36. Centers for Disease Control and Prevention. How to Protect Yourself & Others; 2020. Available online: https://www.cdc.gov/coronavirus/2019-ncov/prevent-getting-sick/cloth-face-cover-guidance.html (accessed on 15 July 2020).
Figure 1. City of Riyadh, study area [21].
Sustainability 13 00863 g001
Figure 2. Various (potential) purposes for using e-scooter sharing systems in Saudi Arabia.
Sustainability 13 00863 g002
Figure 3. Obstacles facing e-scooters usage in Saudi Arabia.
Sustainability 13 00863 g003
Figure 4. Suggested precautions and preventive measures for consideration of e-scooter operators.
Sustainability 13 00863 g004
Table 1. Questionnaire.
Q.Section 1—Background
1Nationality
2Marriage Status
3Age
4Gender
5Professional occupation
6Income
7Education background
8Workout
9Do you own a car?
10Are you a user of cab-hailing apps
11Do you ride a cycle on a regular basis?
12Do you ride a motorcycle on a regular basis?
13Do you ever ride a shared e-scooter?
Section 2(only if said Yes to Q.13)
14Where did you use it? (inside or outside Saudi Arabia)?
15What was the purpose of your usage?
16Have you had a near-crash incident when riding the shared e-scooter?
17Have you had a crash when riding the shared e-scooter?
Section 3 (only if said No to Q.13)
18If you have found a shared e-scooter, would you use it?
19What would be the purpose of that usage?
20If the price of the trip using ride-hailing apps (Uber, Careem, etc.) is higher than the price of using a shared e-scooter, will you use the shared e-scooter?
Section 4
21Do you think the e-scooter sharing system is a safe mode?
22What are the obstacles of e-scooter sharing systems in launched in Saudi Arabia?
23As you know about the spread of the new Corona virus around the world, what is the impact of the spread of such infectious diseases on your decision to use the shared e-scooter?
24If the companies operating the shared e-scooter took the precautionary and preventive measures with regard to COVID-19, do you think that would remove the fears of their use?
25(Optional) question: What measures or precautions can operators of shared e-scooter systems take to reduce fears of these infectious diseases?
26(Optional) question: What places would you suggest that the e-scooter sharing systems to launch within the Kingdom of Saudi Arabia?
Table 2. The socioeconomic and demographic characteristics of the respondents compared to the population [17].
Percent (%)
CategorySubcategorySample Population
NationalitySaudi98.462
Non-Saudi1.638
GenderMale66.760
Female33.340
Marriage StatusSingle34.432
Married65.668
Age18–304832
31–454041
46–601022
>6025
Monthly IncomeSR3500 ($933) or less3731
More than SR3500 ($933) and less than SR7000 ($1866)7
More than SR7,000 ($1866) and less than SR13,000 ($3466)1539
More than SR13,000 ($3466) and less than SR20,000 ($5333)2530
More than SR20,000 ($5333)1620
Educational BackgroundHigh School1454
Diploma511
Bachelor5532
Master142
PhD121
Professional OccupationStudent29.8
Employed—Public Sector41.5
Employed—Private Sector8.7
Freelancer5.2
Retired3.2
Unemployed11.6
Sport ActivityDaily16.2
Several days a week36.2
Once a week18.2
At least once a month14.8
Never14.6
Car OwnershipOwn a car72.9
Does not own a car27.1
Ride-hailing Systems UsageDaily1.6
Weekly8.0
Monthly10.2
Rarely59.0
Never21.2
Bike UsageFrequent user of bikes8.0
Does not use bikes frequently92.0
Motorcycle UsageFrequent user of motorcycles2.3
Does not use motorcycles frequently97.7
Table 3. Distribution of e-scooter users between respondents in Saudi Arabia in terms of several categories.
CategorySubcategoryPercent (%)
General use of e-scootersNever seen an e-scooter40
Never used an e-scooter but familiar with it42
Used e-scooter at least once8
Used e-scooter several times10
Location of using e-scooterIn Saudi Arabia32
Out Saudi Arabia63
In and out Saudi Arabia5
Willingness to use e-scooterWould use e-scooter19
Would never use e-scooter27
May use e-scooter54
Gender of e-scooter users and potential usersMale will use e-scooter53
Male used e-scooter20
Female will use e-scooter24
Female used e-scooter3
Table 4. Effect of COVID-19 on using e-scooters according to the survey respondents.
CategorySubcategoryPercent (%)
Used E-ScootersNever Used E-ScootersOverall
Effect of fear from COVID-19Decreased usage51.345.246.2
No effect41.048.547.2
Increased usage7.76.46.6
Effect of considering precautions to minimize COVID-19 spreadWould decrease fear of using e-scooters33.324.125.7
May decrease the fear51.358.256.9
Would not decrease the fear15.417.717.3
Table 5. Potential places for deployment of e-scooter sharing systems in Saudi Arabia.
CategoryExample of PlacesResponses (%)
Open entertainment areasSquares, parks, plazas, such as Al-Bujairy, King Abdullah Walkway, and Jeddah Waterfront40.9
Shopping centersMalls and hypermarkets26.2
Building complexesConnected business buildings, medical cities, university campuses, such as e.g., Diplomatic Quarter and King Abdullah Financial District21.5
Residential areasResidential compounds and districts or neighborhoods12.8
DowntownsCenter of Riyadh, Center of Jeddah, Makkah central area, and Madinah central area11.4
RoadsRetail streets in Riyadh, Jeddah, and Dammam8.1
Seasonal large eventsArea of annual Islamic pilgrimage (Hajj) and Al-Janadiriyah festival4.7
SuburbsEconomical/industrial cities, provinces, and resorts4.0
OtherParking, airports, and train/metro stations5.4
Table 6. Regressors of the three logistic regression models.
RegressorsMeasureValue
Age Ordinal1: 18–30 young (48%)
2: 31–45 middle age (40%)
3: 46–60 (10%)
4: >60 (2%)
GenderNominal1: Male (66.7%)
2: Female (33.3%)
Income Ordinal1: SR3500 or less (37%)
2: More than SR3500 and less than SR7000 (7%)
3: More than SR7000 and less than SR13,000 (15%)
4: More than SR13,000 and less than SR20,000 (25%)
5: More than SR20,000 (16%)
Sport ActivityOrdinal1: Never (14.6%)
2: At least once a month (14.8%)
3: Once a week (18.2%)
4: Several days a week (36.2%)
5: Daily (16.2%)
Educational Background Ordinal1: Diploma or less (19%)
2: Bachelor (55%)
3: Master (14%)
4: PhD (12%)
Professional OccupancyNominal1: Student (29.8%)
2: Freelancer (5.2%)
3: Employed (50.2%)
4: Retired (3.2%)
5: Unemployed (11.6%)
Marriage statusNominal1: Single (34.4%)
2: Married (65.6%)
Ride-hailing Apps UsageNominal1: Never or rarely (80.2%)
2: Yes frequently (19.8%)
Car OwnershipNominal1: No (72.9%)
2: Yes (27.1%)
Bike UsageNominal1: No (92%)
2: Yes (8%)
Motorcycle usageNominal1: No (97.7%)
2: Yes (2.3%)
Previous e-scooter usageNominal1: No (82%)
2: Yes (18%)
Table 7. Response of the three logistic regression models.
ResponseModel TypeValue
If the ride-hailing trip’s cost is higher than e-scooter’s cost, will you use e-scooter? (usage because of price)Binary1: No (%54)
2: Yes (46%)
Will you use an e-scooter?Binary1: No (27%)
2: Yes (73%)
Do you think e-scooter is a safe mode?Ordinal1: No (33%)
2: maybe (53%)
3: Yes (14%)
Table 8. Estimates of regressors of the binary logistic regression model (Response: the e-scooter usage because of price).
Term[Level]EstimateStd ErrorChiSquareProb > ChiSq
Intercept−0.1810.6270.080.772
Marriage status0.2030.1731.380.240
Age [2]0.4270.3231.740.187
Age [3]0.0110.3580.000.974
Age [4]2.0581.1763.060.080
Gender [1]−0.4150.1934.610.031
Professional Occupancy [1]0.16740.3390.240.621
Professional Occupancy [2]−0.4630.4211.210.272
Professional Occupancy [3]0.3970.3091.650.198
Professional Occupancy [4]−0.5510.5341.060.302
income[2]0.1010.4720.050.830
income [3]−0.0400.5120.010.937
income [4]0.6700.3733.220.072
income [5]−0.3860.3841.010.314
Educational Background [2]0.0830.2980.080.780
Educational Background [3]0.4010.3431.370.242
Educational Background [4]−0.1940.4700.170.679
Sport Activity [2]−1.4010.41211.540.0007
Sport Activity [3]0.1380.3600.150.701
Sport Activity [4]0.3370.3011.260.262
Sport Activity [5]−0.1920.3170.370.544
Car Ownership [1]−0.0440.1910.060.814
Ride-hailing Systems Usage [1]0.0400.1340.090.761
bike usage [1]0.2820.1982.030.154
motorcycle usage [1]0.3750.3651.050.304
Previous e-scooter usage [1]−0.0260.1430.030.855
Table 9. Estimates of regressors of the binary logistic regression model (Response: willing to use in the future).
Term [Level]EstimateStd ErrorChiSquareProb > ChiSq
Intercept0.7890.7960.980.321
Marriage status [1]0.2370.2530.880.348
Age [2]0.1520.4680.110.744
Age [3]1.6850.6157.500.006
Gender [1]−0.9340.3367.730.005
Professional Occupancy [1]0.1660.5620.090.766
Professional Occupancy [2]−1.0850.5843.450.063
Professional Occupancy [3]−0.1480.5220.080.776
Professional Occupancy [4]−0.0520.9770.000.956
Income [2]0.2590.8190.100.751
Income [3]0.1320.8550.020.876
Income [4]0.2240.5420.170.678
Income [5]−0.7010.5161.850.174
Educational Background [2]0.3280.4470.540.462
Educational Background [3]−0.1500.4900.090.759
Educational Background [4]0.1330.6670.040.841
Sport Activity [2]−0.4270.5980.510.475
Sport Activity [3]0.0770.5330.020.885
Sport Activity [4]0.1290.4360.090.766
Sport Activity [5]−0.8340.4543.380.066
Car Ownership [1]−0.0940.3030.100.755
Ride-hailing Systems Usage [1]0.4000.1824.850.027
bike usage [1]0.1090.2750.160.691
Table 10. Estimates of regressors of the ordinal logistic regression model (Response: Do you think e-scooter is a safe mode).
Term [Level]EstimateStd ErrorChiSquareProb > ChiSq
Intercept [1]−0.9790.5663.000.083
Intercept [2]1.8270.57210.180.001
Marriage Status [1]0.2070.1581.710.190
Age [2]0.6120.3014.120.042
Age [3]0.6150.3313.450.063
Age [4]−0.17400.8290.040.833
Gender [1]−0.1770.1671.120.290
Professional Occupancy [1]0.0080.3120.000.977
Professional Occupancy [2]−0.0260.3810.000.944
Professional Occupancy [3]0.1220.2790.190.662
Professional Occupancy [4]−0.4200.4830.760.383
Income [2]−0.0550.4260.020.897
Income [3]−0.5710.4721.470.226
Income [4]1.1070.34510.250.001
Income [5]−0.5400.3492.390.122
Educational Background [2]0.4450.2752.610.106
Educational Background [3]−0.1870.3110.360.547
Educational Background [4]0.3200.4250.570.451
Sport Activity [2]−0.2350.3560.440.508
Sport Activity [3]−0.3720.3391.200.273
Sport Activity [4]0.3680.2831.690.192
Sport Activity [5]−0.3980.2941.830.176
Car Ownership[1]0.1610.1730.870.351
Ride-hailing Systems Usage [1]−0.0490.1240.160.692
bike usage [1]−0.2070.1801.320.250
motorcycle usage [1]−0.1780.3260.300.585
Previous e-scooter usage [1]0.3570.1356.980.008
Publisher’s Note: MDPI stays neutral with regard to jurisdictional claims in published maps and institutional affiliations.

