Abstract
One of the main pillars of sustainable urban development at the local scale is to control the social aspect of urban equality of socio-economic systems. A number of studies confirm that poverty in urban space is accompanied by negative phenomena, such as high unemployment, social pathologies, increased crime rate, or the high level of the decapitalization of space, including the poor condition of housing and municipal infrastructure. However, there is a gap in defining the relation between urban poverty and city structure to control and preferably minimize social inequalities. The aim of the study was to empirically verify the impact of the location of residential properties in relation to poverty-stricken areas in the city. The research covered the housing market in one Polish city (Kalisz) in the years 2006–2018. By applying GIS technologies, we identified the location of each property in relation to poverty areas. The data was subjected to regression analysis, with the use of the hedonic approach based on exponential models. The analysis of data allowed us to conclude that location in a poorer area does affect the prices of new flats, which is not only a contribution to the development of science, but is also information that could be used by developers or property valuers to establish the prices of flats, as well as city managers to avoid pauperization of urban districts.
1. Introduction
Nowadays, more than half of the world’s population lives in cities, and this rate is expected to rise to 60% in the next 10 years. Rapidly progressing urbanization processes have a huge impact on the natural environment, therefore, they are associated with the need for proper spatial planning, creating conditions for economic progress and social development.
Sustainable development of the cities is possible by taking into account the Sustainable Development Goals (SDG) [1], which include, among others, “Sustainable Cities and Communities” (Goal 11). From an urbanism point of view, it is important to ensure access for all to adequate, safe, and affordable housing and basic services in particular to different groups of persons. Currently, social inequalities are an increasingly serious problem in urbanization. The biggest urban challenges include overcrowding, low-quality infrastructure, housing scarcity, and poverty. Poverty prevention is another goal of sustainable development (No Poverty—Goal 1) that relates to conscious and sustainable urbanization. Overcoming challenges in a way that will allow cities to improve resource management and reduce pollution and poverty is influenced not only by government and local authorities, but also by enterprises and society.
Sustainable urban development supports the long-term prosperity of cities and their inhabitants. In some cities, the rapid expansion reflects unplanned urban sprawl, making the delivery of services costlier and inefficient. Urbanization reshapes cities and contributes to rising house prices, affordable housing shortages, and inflexible housing stock, which in turn threaten quality of life. The population continues to flow to cities, which means that, due to increased demand and rigid, limited supply in times of crises, housing prices are rising. This leads to a housing affordability crisis, which affects not only the poor, but also median income residents [2].
The possibility of improving the housing situation and counteracting social inequalities, including poverty, is largely dependent on the situation of the real estate market. Of course, there is no versatile solution to rising housing prices and the affordability of urban housing. While housing prices and affordability can be viewed from many different perspectives, the main factors to tackle this problem require a significant increase in housing supply and ensuring a better fit between the house and the resident.
Cities should focus on creating more housing, including a more diverse range of options so that the housing stock can better meet the needs of different household types and income levels. Particular attention should be paid to good density. By densifying cities in the right way, ensuring mixed use, green space, and good connectivity, we create vibrant, livable, and sustainable communities, while also reducing energy consumption and emissions and decreasing the infrastructure costs per resident, which is important from the economic, social, and environmental dimensions of the SDGs. Applying the principle of good density means, inter alia, planning space and investments in a sustainable manner, thus preventing ghettoization [3].
Local real estate markets play an important role in achieving the goals of sustainable urban development. All human activity takes place in a rare space that is considered as a rare good. Both limited supply and varied quality (attractiveness) of space in cities lead to differentiation of real estate prices. In order to shape the conditions of permanent and balanced spatial development, urban policy should monitor and influence the real estate market through regulations that favor economic rationality and at the same time protect the public interest.
Urban policy tools, such as e.g., revitalization programs, support for residents, and entrepreneurship, investment incentives, as a result, should lead to a sustainable level of real estate prices. In turn, the lack of control of factors negatively influencing real estate prices (such as concentration of poverty, environmental pollution, crime, noise, and traffic) may lead to the segmentation of space and the creation and aggravation of social inequalities.
One of the most urgent issues of the contemporary social policy of central and eastern European countries is the phenomenon of urban poverty, usually accompanied by the poor condition of housing resources, high unemployment, the occurrence of social pathologies, high crime rate, violence, and noise. With political changes in Poland, which started in the late 1980s, the process of progressive stratification of society began, accompanied by the growing diversification of the spatial scale of poverty. At the same time, researchers took more interest in studying the problem of poverty, which used to be neglected due to the lack of consent from socialist authorities [4]. Studies of poverty were conducted in different fields of science, with an emphasis put on various aspects of this notion. There are sociological, economic, psychological, and political concepts of poverty [5]. Much less attention has been paid to spatial issues in this regard.
The findings of spatial studies of the concentration of the poor and the distribution of poverty areas in cities showed that poor citizens mainly inhabited the central parts of American cities (inner cities), which were gradually becoming the subject of economic marginalization and spatial decapitalization. It was also observed that urban poverty had a class and racial character, and was combined with crime, youth’s lack of social adaptation, drug addiction, illiteracy, family pathology, and the physical degradation of housing and municipal infrastructure. In turn, the rich, educated, and qualified population of high social and economic status resided in the outskirts of cities, transforming them into economically wealthy and relatively safe suburbs [6,7]. This type of dualization of urbanized areas is also clearly evident in contemporary cities, where sections of development and economic prosperity neighbor the areas of economic collapse. Therefore, it seems justified to pose a question about the influence of poverty on the urban real property market.
The analysis of the literature allows us to identify a number of factors determining housing prices, which are largely dependent on general location (in a broader context, with reference to a continent, state, city, or district) and the condition of the property’s surroundings (e.g., the quality of space). Location is one of the key determinants of housing prices [8,9,10,11,12]. It can be perceived in a number of ways, e.g., as the distance from the city center, the vicinity of commercial and service centers, public space, greenery, accessibility, etc. [13,14,15,16,17]. Some authors see location as a three-level feature, consisting of the property’s designation (the condition and/or the development potential, etc.), the character of its immediate surroundings and their influence on the property, the overall urban structure, and the interrelationships in the structure of the city’s spatial development, be it those currently existing and those planned or likely to exist in the future [18]. Real estate properties are inseparably linked with a place, so they also differ in terms of micro-location. Thus, their prices are influenced by changes in the surroundings [19]. It is residential properties that are most strongly dependent on micro-location, while investment decisions in the commercial market often go beyond the local market [20]. Housing properties, especially in the countries of central and eastern Europe, where the historical conditions of their ownership structure are the explanation of the current low level of population mobility, are to a far higher degree subject to competition in different micro-locations of the local market [21]. It appears that researchers have not examined the impact of another determinant, i.e., the effect of the location in relation to poverty areas on the prices of flats. This is why the research problem in this article is the analysis of factors that affect housing prices, taking into consideration the issues of the location of difficult areas that have not been studied before. The aim of the research was to verify the impact of the location of urban properties in an area of poverty on their prices. In order to achieve this aim, we used a two-stage research procedure, in which we identified areas of poverty in one Polish city, after which we showed their role in determining prices in the housing market. We used three models of the socio-spatial structure in the city as theoretical concepts to identify areas of poverty: (1) the Burgess zone concentric model [22], (2) the Hoyt (sector) model [23], and (3) the multiple nuclei model by Harris and Ullmann [24]. The study was conducted in the housing market of a city of sub-regional character (Kalisz, Poland), and the analysis covered the years 2006–2018. The analysis of data allowed us to conclude whether location in an area of poverty has an impact on the prices of new flats, which is a valuable contribution to the development of science and reveals information that could be used by developers or property valuers to establish the prices of flats.
In the paper, we provided a review of the literature on the traditional and specific determinants of housing prices, after which we described the research procedure and data sources, and then discussed the obtained results and referred to the findings of other studies in this field.
2. Literature Review
2.1. Traditional Determinants of the Prices of Flats
Urban properties are among the most frequently purchased ones, fulfilling the basic needs of human existence and at the same time being an investment. While the existing housing resources are impossible to move, new flats can be built in the place chosen by an investor—if it is available—and the decision on the location of new facilities is made after the analysis of various factors, including those referring to location.
Location refers to position in a specific place, which involves a number of factors. The influence of these factors on the prices of flats has been extensively examined in the literature. This influence may be analyzed from different perspectives, as the impact of (1) external factors from distant surroundings (macro-environment), (2) external factors from the close surroundings (micro-environment), and (3) internal factors (in the so-called ultra-environment) [25,26].
The most frequently analyzed factors in the literature are the macroeconomic ones. Factors in the macro-environment are important for the level of prices, rather than the prices of specific real properties. There is an increasing number of studies on the influence of economic, social, political, legal, and other processes in the urban area. The most commonly identified factors include:
- International economic situation—the global crisis has a negative impact on the situation in the real estate market [27,28].
- Investors’ sentiment and the level of development of the national economy—there is a long-term relationship between the prices of flats and the gross domestic product per capita [29]; the prices of flats are indirectly (through an increase of demand) influenced by the wealth of the society [30] and the unemployment rate [31].
- Macroeconomic policy, especially in the conditions of the common market, which is the case of, for example, EU member states. The European Union influences, through a number of instruments (pricing and wage policy, interest and exchange rates, tax and customs policy), the fluctuations of the prices of flats in different countries. Research shows that the state’s interference with the market significantly determines the balance of housing prices, but it appears that there are differences in the response to various types of policy [32], as well as spatial differences in the implications of policies pursued in the residential property markets [25,33]. The positive influence of the inflation level on the increase of housing prices is also observed [4,34].
- The state’s housing policy—market limitations resulting from, among others, the housing policy or law regulations are difficult to observe, but they do have an impact on the housing market [35]; subsidies for the real estate market (government schemes) affect the dynamics of the prices of flats—residential property markets are not as volatile as other sectors of the economy, and the inertia of local real estate markets becomes particularly evident during violent changes. What affects the prices of residential properties in central and eastern European countries are factors that are specific to political transformation, connected with the demand for flats (financing the purchase through grants or aid schemes) [36]. Housing policy may promote the development of housing construction, but it may also contribute to an increase in the supply of flats and the ownership of wealthy citizens, deepening social and spatial inequalities [37].
- The banking system—the availability of diverse forms of providing loans for purchasing properties in the real estate market, including banks’ credit policies, as well as the availability and interest rate of loans, affect the level of housing prices and determine the volume of sales [4,36], while changes in the value of financed properties may contribute to the instability of banks [38].
- The business cycle, which affects cycles in the real estate market, but these changes do not have to be strongly correlated. Most studies of cycles in this market concern the reference variable of the price of flats. The specific sectors of the market are heterogeneous, which means that some markets are more cyclical than others; moreover, housing shocks are usually short-term [39]. Changes in the prices of flats particularly depend on the geographical location of the urbanization degree and individual features of a flat (e.g., age and material) [40].
Factors in the micro-environment influence the level of development of local markets and their diversification. They include:
- Local economy, including the income of the population in this area and local employment level [41,42,43].
- Local tax policy—the level of taxes and the system of reliefs and exemptions may influence the supply and prices of flats to a negligible degree in the long-term, but are quite noticeable in the short-term [44].
- Spatial policy, which affects the investment potential of a given area, promoting the increase of supply or reducing it. Land control and zoning create the opportunities to build new flats, thus influencing their prices [35].
- Geographical environment—in this context, the characteristics of the climate, terrain, wind direction, insolation, and the amount of natural resources [4,45].
- The demographic situation of a region, the size of families, lifestyle, fashion, and local demand—these phenomena mainly have a short-term influence on the prices of flats [46,47].
The authors often focus on the features of properties that affect their prices. They are connected with the ultra-environment, and include:
- General location—location in a specific city, the distance from the central business district (CBD), and the property’s surroundings, including natural environment, green areas, and accessibility [43,48,49,50], which is more important in areas inhabited by a low-income population [51]. In the post-socialist cities of central and eastern Europe, zones that are characteristic for socio-economic phenomena have developed: (1) central parts of cities (old-town buildings), (2) large-block housing estates (with an increased crime rate), and (3) suburban areas (rural areas annexed to cities in the last few decades, inhabited by poor indigenous people with a mentality different from that of urban residents) [8,52,53,54].
- The individual features of properties—the floor area, number of rooms, architecture, design, the size and characteristics of the garden, technical condition, age, quality of materials used, frequency of repairs, quality of installations, possibility of extension, and renovation are all significant determinants of prices [55,56].
- Lessees—the value of a property with a lessee may differ from the value of a property without a tenant [57].
- Easiness of sale (time needed to perform a transaction) and the availability of information about a property—there is a big difference between asking prices and transaction prices; when combined with the sellers’ reluctance to reduce the price or delaying action in this regard, it prolongs the time in which the property is exposed in the market [58].
2.2. The Specific Determinants of the Prices of Flats
The findings of various studies partly correspond with each other, confirming the influence of certain features on the value of residential properties, but the catalogues of attributes significant for this value differ depending on the market segment, the specific local market, and the time of the analysis. However, the influence of the location of a flat on its price is out of the question. Location is directly connected with the surroundings, in which, apart from other flats, there are public spaces (streets, squares, green and blue areas), the natural environment and its pollution (dust, noise), and the people who live and behave in a specific way—e.g., consistent or inconsistent with social norms (social problems—poverty, unemployment, alcoholism, homelessness, etc.) [59,60,61,62,63]. These factors may determine the quality of the location and its impact upon the prices of flats. The issue of the location of properties in areas affected by social problems and its influence on housing prices has been neglected by science, and has only been examined to a limited degree.
For example, the study conducted by American scholars [64] in Chicago, Illinois concerned the location of new flats in poor districts. Although they analyzed in detail the relationship between the price of flats and the type of building, distinguishing between three urban design types (enclave, traditional neighborhood development, and infill), the research covered only a sample of flats located in a poor district. What encourages investing in problem areas are low prices and the availability of land. Another benefit of developing poor areas is the social integration of the poor population with other residents. It is an added value for developers, who, apart from obtaining economic profit, may promote themselves as socially responsible companies.
Another US study carried out in St. Louis, Missouri [65], focused on the neighborhood and its transformation based on five neighborhood succession theories seen from different perspectives. (1) The bid rent function theory attempts to balance two contradictory desires in housing preferences: people would like to own larger flats, which are at the same time located close to the center of the city they work in. Therefore, the location value of flats is a difference between the consumption of land (in the form of housing) and the cost of commuting to the CBD. According to (2) the housing bundle theory, the characteristics of the neighborhood, including socio-economic ones, significantly determine the value of a property. (3) The broken window theory focuses on behavior norms and society’s control over them. When people with low moral standards settle in a district, its reputation worsens. Consequently, flats located there become less attractive, and their price gradually falls. (4) Segregation theory is based on preferences with regard to the race of neighbors. Civil rights movements led to the protection of a race against discrimination. Despite this, some social/ethnic groups may still be discriminated against due to their disproportionately low income. Finally, (5) the game theory of real estate investment states that the value of a property is determined by its neighborhood. It is assumed that there are a number of real estate properties and owners in the neighborhood, which makes it difficult for them to find a common ground. Decisions concerning the location of new investments in an unfavorable environment are made autonomously by properties’ owners, who, facing uncertainty, choose a safe option—they do not invest in the development of the property, as it gives them a higher potential return than investing while their neighbors are not doing the same. This model explains why the surroundings deteriorate rather than improve in many urban districts. In light of the above theories, we can conclude that the influence of the neighborhood on housing prices is an extremely complex issue.
Among the few scholars who examined the influence of location on housing prices were Spanish researchers [51] who used the case of the urban area in Valencia, Spain. They distinguished the following aspects: (1) accessibility and the vicinity of necessary or attractive objects, (2) the surroundings and the quality standards of nearby facilities, and (3) the socio-economic status of the neighborhood and immigration level. The authors point out that location combines a variety of factors, from employment prospects to leisure opportunities. Location in a specific place is connected with a sense of security among the potential buyers of new flats—it involves different attributes that translate into the benefits and satisfaction of buyers.
In another study, conducted in Columbus, Ohio [66], the authors analyzed the influence of crime rate on the prices of flats. To this end, they had gathered data concerning various types of crime (homicide, rape, robbery, assault, burglary, theft, and car theft), dividing them into three groups: crimes in general, violent crimes, and property crimes. The data was subjected to geocoding with the use of the location of an event as a spatial reference point. In order to discover whether the impact of crime differs among districts, they divided the sample into categories according to the income per inhabitant of the district in which the house was located. The authors found that, in the period under study, the crime rate decreased in the region with low income, while increasing in those with middle and high income. Poor areas had an approximately 50% higher share of flats occupied by owners (in contrast to flats for rent), and about two times fewer vacant properties than in districts in less attractive locations. Districts in an unfavorable situation also featured the highest population density, unemployment rate, and share of a population of 25 or more years of age. The inhabitants of housing estates with the highest income were predominantly of the Caucasian race (91%), with only 52% of the residents of low-income districts being white. The findings show that the influence of crime on housing prices differs depending on the type of district, thus leading to differences in the urban area. Violent crimes negatively affect the prices of flats in all districts. This influence is the strongest in low-income areas.
Although the theoretical concepts cited above apply to North American and western European cities, many of these findings are universal, and can also be observed in modern cities in developing countries. Therefore, taking into account some differences and specificity of central and eastern European post-socialist cities, the concepts were adopted as the theoretical framework of the research.
3. Materials and Methods
The research procedure aimed at accomplishing the aim of the paper consisted of two main stages. The first involved the identification of areas of the particular concentration of poverty in the city. The source material was obtained from the Municipal Social Welfare Centre (Miejski Ośrodek Pomocy Społecznej—MOPS) in Kalisz and the Citizen Affairs Department of the City Hall of Kalisz. Poverty concentration areas were detected with the application of GIS technologies in ArcINFO software.
In the latter stage, we verified whether the location of poverty concentration areas had an influence on housing prices. We applied regression models (OLSs), using SPSS software for analytic purposes. The analysis was based on data concerning the prices of residential properties sold, collected from the register of prices and values of properties run by the District Geodetic and Cartographic Documentation Centre in Kalisz.
3.1. Stage I—Poverty Concentration Areas
In seeking poverty concentration areas in the city, we referred to the so-called statutory poverty line. In accordance with this definition, the poor are defined as household members who were provided with financial support as part of the public social welfare system because their income was lower than the statutory criterion of income per person in a family. From 2018, the criteria set out in the Regulation of the Council of Ministers of 18 July 2018 on the verified income criteria and the amounts of cash benefits from social assistance (Journal of Laws 2018, item 1358) were in force, according to which the right to receive cash benefits under social assistance was (1) a single-person household with a monthly income not exceeding PLN 701 (approx. EUR 160), and (2) a multi-person household with a monthly income not exceeding PLN 528 (approx. EUR 120) per person [67]. This definition is related to the European Commission’s definition of poverty, understanding poverty as a relative concept, going beyond the lack of basic physical needs and aspiring to the standards of social participation or human functioning [68]. The category of the poor defined in this way allowed us to identify the address details of poor citizens and the location of the phenomenon of poverty within the city borders.
The empirical research was done on the basis of data obtained from the MOPS as the city’s organizational unit for analyzing social problems on its territory and providing institutional support in this regard. Its database contains information about all beneficiaries of MOPS in the period under analysis, together with complete address details and the category that entitles them to seek aid.
First, the data concerning people whose income did not exceed the amount specified as the statutory poverty line were collected. We rejected the data that referred to people who received help due to their disability, orphanhood, homelessness, maternity protection, having a large number of children, home violence, chronic illness, and other cases that entitle one to apply for social assistance.
Finally, for analytical purposes, we used a query covering 410 households, in which more than 6000 social benefits a year were provided on account of low income. After that, we performed the geocoding of the address base of distinguished poor households.
When analyzing the distribution of the poor population in the city, we used three patterns of research procedure, thus referring to three classical models of the social and spatial structure of cities [69,70]—the Burgess zone concentric model [22], the Hoyt (sector) model [23], and the multiple nuclei model by Harris and Ullmann [24]. The classic models of the social and spatial structure of cities became the basis for the identification of poverty concentration areas, and then for the verification of the impact of poverty on housing prices.
In the first case, three concentric buffer zones around the pre-established central point of the city were marked. The historical center with the market and the town hall, which was also the administrative center of the city, was adopted as the central point. The successive buffer zones were set by equi-distances, with values changing every 0.5 km. In this way, 16 buffer zones were established. Then, the number of households and inhabitants who received financial aid from MOPS on account of poverty was identified in each of the concentric zones marked. The obtained results were compared with the analogical structure concerning the overall population of the city. Such an attempt to identify poverty was theoretically justified by the model originally proposed by Burgess [22], according to which the distance from the center is the fundamental factor determining the city’s spatial structure, thus also the distribution of poverty within its space.
The second method was based on Hoyt’s theoretical construct [23], according to which the city develops along its main travel links. As a result, it assumes the shape of a star, with clearly distinguished sectors radiating from the center. Thus, we divided the area of the city under examination into 16 sectors coinciding in the central point established before. The area of each sector was reduced by the area of the very center of the city, covering the historical Old Town, surrounded by town walls in Middle Ages, and now replaced by Planty park. Next, in each of the distinguished sectors, we counted the beneficiaries of social welfare and compared the obtained structure with the population structure according to the place of residence in each sector.
In the third approach to the identification of poverty concentration areas, we divided the territory of the city into a grid of squares with each side 0.2 km in length. In this way, 1860 fields with an area of 0.04 square meters were generated. In further analysis, they were treated as basic research units. Then, with the application of GIS technologies, we identified the number of poor people and the total size of the population in each basic field (square). By comparing the places of residence of poor citizens and the overall population of the city, we were able to identify poverty concentration areas, irrespective of the distance from the center, and travel links. Thus, the established areas may refer to the multi nuclei model developed by Harris and Ullman [24].
The quantitative measure of the concentration of the poor population in the city was the location quotient, which was calculated according to the following formula:
where ni denotes the number of poor residents in a given basic field (square), nk is the total number of poor people in the city, pi is the size of the population inhabiting a given basic field, and pk is the total population of the city.
The location quotient determined in this way was a measure of the degree of poverty concentration in a given area (in relation to the degree of population concentration in this area). It was assumed that if the indicator values were above one, the poverty concentration in a given area was high. In such a situation, the share of poor people (as a percent of the total size of the poor population) was higher than the share of the population in this area (as percent of the total population of the city).
3.2. Stage II—The Regression Analysis of the Prices of Flats
The verification of the influence of location in a poverty area on the price of a property was conducted by way of regression analysis. To this end, we built a database including all transactions in the urban area in the examined city in the years 2006–2018, and then selected the transactions in the primary market. We decided that flats in this market would be the best research material owing to their homogeneity in terms of the technical condition of buildings and the standards of flats. These attributes differentiate the secondary market to a far higher degree, constituting a significant price-setting factor. In regression models, however, they are a predictor that is difficult to quantify, as its values arise from subjective judgment.
We built a database consisting of almost 1000 records. From the initial database, we removed records that included incomplete information, e.g., it was impossible to learn about the characteristics of a flat. In the end, the regression analysis covered 879 flats from the primary market. The transaction price for one square meter was adopted as the dependent (endogenous) variable. A set of independent (exogenous) variables, in turn, included a wide range of market attributes (information about the date of sale of a flat, its location, address, district, floor area, the size and type of associated area, the number of floors, and location a poverty area). In the beginning, we tried to select the biggest possible number of independent variables, realizing that the set would be subject to reduction as a result of the verification of the significance of individual variables for further procedure. Potential independent variables were finally accepted or removed on the basis of statistical and formal criteria.
The set of potential independent variables included attributes connected with the location of a property in a poverty concentration rea. In accordance with the previously discussed procedure, the location in a poverty area was established in three ways:
- Location in a concentric zone, in which there was a surplus of a poor population;
- Location in a radiating sector, in which there was a surplus of a poor population;
- Location in a basic field of the grid of squares, in which there was a surplus of a poor population.
As poverty areas delineated by way of different approaches overlapped, we estimated three independent regression models, each of which took into account a poverty area, delimited by a different method (respectively: the buffer model, the sector model, and the multiple nuclei model). A complete list of potential independent variables is presented in Table 1.

Table 1.
Potential independent variables explaining the unit price of flats.
In the regression analysis, we used a non-linear approach, estimating exponential models described with the following equation:
where y denotes the dependent variable (i.e., the transaction price for one square meter of a residential property), x1, x2, …, xk are independent variables (market attributes of a property), and α0, α1, …, αk are the model’s structural parameters.
The exponential model was subjected to log-linearization, then we estimated the linear auxiliary model using the least squares method and evaluated its quality. After that, we moved the estimated values of parameters to the main (exponential) model and calculated change rates y according to a given xk, in accordance with the following formula:
This type of procedure is often applied in the literature on the issue of property mass valuation. Exponential models used for automatic valuation are better known as hedonic models [71,72,73].
4. Results
In accordance with the adopted research methodology, in the first stage, we distinguished poverty areas in the space of the examined city. We used three ways of establishing the boundaries of the problematic area. Then, we analyzed the influence of the flat’s location in a poverty area and of other factors differentiating flats sold on the price for one square meter.
4.1. Poverty Concentration Areas
The results of the analysis of poverty concentration in the successive distance zones have shown that the largest number of inhabitants who received benefits on account of poverty lived from 0.5 km to 1.5 km from the city center (over 55% of the total number of social welfare benefits). Quite a lot of residents covered by financial assistance were also identified in the distance zone from 2.5 km to 3.0 km (13%), and in the zones of up to 0.5 km and from 2 km to 2.5 km (almost 10% in each of these zones). Lower values of the analyzed phenomena were observed in the zone from 1.5 km to 2 km (7%). Distance zones of above 3.5 km featured far fewer inhabitants receiving social benefits (below 1%) (see Figure 1).
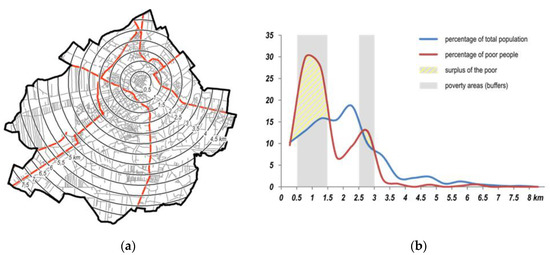
Figure 1.
Poverty in the city space—buffer model: (a) concentric poverty areas in Kalisz; (b) the comparison of the distribution of the total population and poor population. Source: Authors’ own study based on the data from the Municipal Social Welfare Centre and the City Hall in Kalisz.
The curves illustrating the distribution of poor people and of the total population depending on the distance from the central point allow us to identify two characteristic areas (zones) that stand out regarding the poverty level. Within the distance from 0.5 km to 1.5 km from the city center, there was a relative excess of poor population in relation to the total number of inhabitants, with the highest surplus in the zone from 1.5 km to 1 km. The second area with a relative excess of poor residents was the zone between 2.5 km and 3 km. When we look at the zones from 1.5 km to 2.5 km and from 3 km to 6 km, the share of poor inhabitants was lower than the percentage of the total population, and the highest relative difference was observed in the distance from 2 km to 2.5 km. In more distant zones (more than 6.0 km from the center), covering the peripheral area of the city, the analysis has shown the relative balance of the two structures.
The graphic illustration of poverty concentration in radiating sectors shows that the eastern (sectors from 11 to 14) and northwestern (sectors 2 and 3) parts of the city were the areas with a particularly high intensity of a poor population. In the other parts, the percentage of the poor population was lower than the share of the total population. The highest surplus of the poor in relation to the total population was identified in sector 14, with slightly lower values in sectors 11 and 12 (see Figure 2).
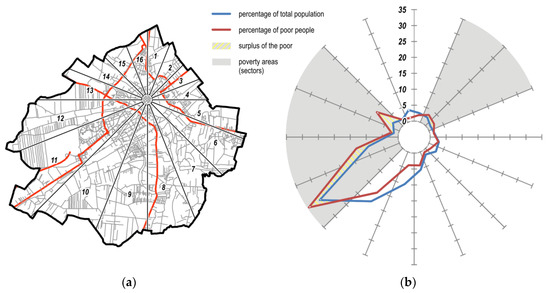
Figure 2.
Poverty in the city—sectoral model: (a) radiating poverty zones in Kalisz; (b) the comparison of the distribution of the total population and poor population. Source: Authors’ own study based on the data from the Municipal Social Welfare Centre and the City Hall in Kalisz.
The results of the analysis of poverty areas established on the basis of a square grid and location quotients showed that areas with a high poverty concentration could be found in the territory of the whole city, with quite clearly evident regularities (see Figure 3). More compact poverty areas tended to be located in central districts. This part of the square grid illustrating the concentration of poor residents basically overlapped with the concentric zones in the distance of 0.5–1.5 km from the city center. High values of the location quotient were also identified in the areas of the intermediate zone of the city, in highly urbanized areas. The other poverty zones were unevenly distributed in the peripheral parts of the city, and the concentration of poverty in these areas was often associated with quite a large number of council flats there.
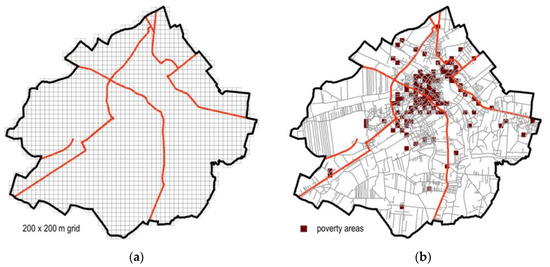
Figure 3.
Poverty in the city—square grid: (a) a grid of squares 200 × 200 m placed on the city of Kalisz; (b) poverty concentration areas (the surplus of the percentage of the poor population over the percentage of the total population of the city). Source: Authors’ own study based on the data from the Municipal Social Welfare Centre and the City Hall in Kalisz.
Referring the obtained results to the functional and spatial structure of the city, we were able to identify certain regularities, characteristic of big cities in Poland and other post-socialist countries [8,74,75,76]. Taking into consideration different ways of delimiting poverty areas, we can observe that the poverty concentration marked mainly three specific problem areas: central parts of cities, areas dominated by large-block housing estates, and suburban areas. In central parts of cities, apart from representative city centers and service and commercial malls, there are also old and decapitalized buildings with a very diverse urban structure. Large-block housing estates built after World War Two are strongly diversified in terms of social characteristics and construction quality. In turn, in the outskirts of cities subject to intense suburbanization processes, two types of areas are now developing: rich residential properties owned by middle class and poor estates transformed from rural buildings. Similar conclusions related to the condition of poverty in Polish cities’ social and spatial structures are offered in relevant publications—for example in Białystok, Gdynia, Poznań, Słupsk, and the cities of Upper Silesia [76].
4.2. Regression Analysis
The estimated regression equations showed that the explained part of the variability of the unit prices of residential properties in the primary market was determined by the non-linear combinations of variables that described flats according to their floor area, the number of rooms, associated area, type of construction (low block), location in a specific estate, and location in a poverty area. The upward trend in prices in the primary market in the years under study was also statistically significant (Table 2).
Table 2.
Modelling unit prices (PLN/m2) in the primary market, taking into consideration the poverty concentration factor.
Trends are consistent with the theory of economics and the logic of a cause and effect relationship. Larger flats had lower unit prices on average, but a bigger number of rooms on the same area stimulated the price for one square meter. The unit price also increased with each square meter of the associated area. On average, lower prices of flats in low blocks (up to five floors) stemmed from the specific nature of the local primary market—high blocks were predominantly upgraded apartment buildings (with a panoramic lift, spectacular views, etc.). Marks next to regression coefficients referring to the specific districts of the city show that ceteris paribus flats in District XI (considered the base category) were the most expensive, while the biggest minus percentage deviations were observed in District II. It is a large-blocks housing estate with undesirable neighborhood characteristics; although it is located close to the city center, it has post-war, modernistic architecture (prefabricated buildings in poor state), a high density with an insufficient number of parking places and garages, and is inhabited by older people, with an average age of over 50 years.
The estimated regression models have shown that the location of a property in a poverty area had a statistically significant influence on the unit price of residential properties in the primary market. The probability of error in the evaluation of statistical significance in buffer and sector models was close to zero (p-values < 0.001), while, in the case of the square grid model, it slightly exceeded 3%. As expected, flats located in poverty concentration areas were cheaper, and the price drop fluctuated from about 1.6%, in the case of location in an area classified as a poverty area, with 2% in a zone distant from the city center that was recognized as a poverty area, to almost 10% in the case of a poverty area delineated on the basis of the square grid model.
The biggest price decreases in the case of the square grid model were the result of the most precise way of delimiting poverty areas. The buffer and sector models were more generalized, so the negative impact of poverty areas in these models is not so evident (although statistically significant). At the same time, we can assume that the latter models paid more attention to the neighborhood of problem areas—the established buffers and sectors, as larger areas, also took into account transactions located some distance away from the places of residence of the poor.
The applied measures of goodness-of-fit and model quality indicated that the buffer model came closest to the reality representative of the empirical data, while the model based on the square grid reflected this reality to the smallest degree. The values of linear determination coefficients of auxiliary models were from 33% (square grid model) to 38% (buffer model). It should be remembered that, in models estimated on the basis of cross-sectional data, R2 coefficients tend to be low, and do not attain as high of levels as in the case of the application of time series. However, considering the large size of the sample, we can say that low values of R2 do not mean that the model is low quality [77,78,79]. This is confirmed by the results of F tests, which verify the combined significance of all variables included in the models. The high statistical significance of the F tests showed that the estimated models are quite satisfactory and have a high cognitive value.
5. Discussion
The applied research procedure allowed us first to identify poverty areas in a medium-sized city in Poland. We discovered that some regularities concerning the distribution of poverty in the city space are consistent with the findings of previously published studies, according to which poverty areas in many post-socialist cities can be found in three characteristic locations: midtown housing estates, post-war districts of blocks, and peripheral areas of cities, which, despite being incorporated into the city’s administrative borders, often retained their rural character. Poverty concentration in these areas is associated with the fact that council flats are often located there [8,74,75,76,77]. It is also pointed out in the literature that the largest concentration of poverty in Polish cities is observed in the areas inhabited by an older population, and the phenomenon of urban poverty is accompanied by prolonged unemployment, social pathologies, and crime. Poverty areas, analogically to slums in Western metropolises, are marked by a high degree of space decapitalization, high unemployment rate, their prolonged dependence on social welfare, deep material deprivation of residents, and the intensification of pathological behaviors, such as crime, alcoholism, family break-ups, and home violence [8,52,53,54,80,81,82,83].
All of these phenomena shape the urban space, influencing the development of housing and differentiating the prices of apartments in the specific locations. Despite this, issues concerning poverty and its concentration in various parts of the city have not been widely discussed in the literature so far. The findings of our study confirm that the prices of flats in the primary market do depend on their location in a poverty area. Regardless of the method of delimiting poverty areas, the constructed models show that unfavorable location in such an area contributes to a drop in housing prices. These results confirm some other researchers’ findings [51,59,60,61,64,65,66].
Our paper is in line with the neighborhood succession theories discussed above. According to the bid rent function theory, people would like to live close to the city center and, indeed, flats located in the midtown district of the examined city (District XI) were the most expensive. In accordance with the housing bundle theory, the value of a property is determined by the characteristics of the neighborhood, including socio-economic ones, which is reflected by all of the models—a neighborhood classified as a poverty area negatively affects housing prices. Our models also confirm the tenets of the broken window theory—the prices of flats are inversely proportional to the occurrence of people who give a district a bad reputation. In the case of Polish cities, especially medium-sized ones, it is difficult to prove the thesis of the segregation theory—the share of foreigners of another race among the population is negligible. It is evident, in turn, that the presence of people with low income has a negative impact on prices.
The only theory that cannot be confirmed by our study is the game theory of real estate investment. It is based on the assumption that the value of a property influences its surroundings, but it is difficult to attempt discussion on this issue in the context of our research. Game theory refers to investors who are the owners of a property, obtain income from it, and consider further growth. Investment made by developers, in turn, consists of a complete change in the use of a property (undeveloped land, a multi-family building), which, consequently, should lead to sale rather than providing long-term income.
The identification of poverty areas in the city space is just an initial phase of research into the problems of social deprivation. In further stages, more attention should be paid to the factors and determinants of poverty concentration in the specific parts of urban space, and to the co-occurring phenomena (unemployment, homelessness, pathologies). Full analysis may be an important source of information for tasks in the field of social welfare and spatial policy in the city. The consequent actions may result in the reduction of socially negative processes and in the stimulation of social integration. They would also definitely influence prices in the urban area; thus, the economic effect of intervention would be revealed. The growth in the value of flats would enable sellers to obtain bigger profit, while the increased tax revenue to city budgets would stimulate local economy.
Our study is a contribution to a broader discussion on the determinants of prices in an urban area, with particular emphasis on the location factor. We can cite papers that analyze the influence of such disadvantages of localization, such as aircraft noise [59,84,85], rail noise level [61], road noise [60], traffic [86], pollution [87,88], or other environmental effects [89,90]. At the same time, a number of studies identify the advantages of localization, such as municipal transport accessibility [91,92], the vicinity of green areas [93], revitalization [78,94], and others. The presented study provides new arguments in the discussion on the complexity of the real estate market in terms of spatial non-linearity [95] and the diversification of property price determinants.
The identified relationships have a significant impact on the shaping of sustainable spatial development in cities. As shown, the concentration of poverty leads to lower housing prices. A decline in the attractiveness of some urban areas may result in a multiplier mechanism discouraging people from settling in and doing business in these places. This, in turn, will result in further pauperization and deterioration of socio-economic conditions. This may result in the segregation of urban space into attractive areas that attract the rich population and degraded areas with a high proportion of the poor. Thus, socio-economic inequalities in spatial terms may increase in urban space.
Large price differences in various areas of the city are unfavorable from the point of view of spatial development or the location of new investments. The concentration of poverty in selected areas makes it impossible to use land rent, which is an obstacle to the appropriate and intensive use of urban land. Urban policy, striving for sustainable development of urban areas, should focus on eliminating or reducing the concentration of poverty areas.
When making decisions concerning the location of new housing investments, developers are not only motivated by the shortage of flats, i.e., the potential demand for them, but they first of all seek profit opportunities. Location thus influences the prices of flats and, indirectly, the profitability of an investment. Important elements of localization at the construction stage are easy access, the availability of infrastructure, and the vicinity of the sources of supply. At the stage of sales, location becomes strictly linked with the condition of the property’s surroundings and the wealth of the neighbors, which affect housing prices and, consequently, the developer’s profit. Our study may be of value for active participants of the housing market (developers, property valuers, and estate agents), providing them with better possibilities of modelling price levels, as well as for local authorities, allowing them to forecast phenomena in the local development.
Author Contributions
Conceptualization, W.K. and I.R.; Methodology, W.K. and I.R.; Software, W.K. and I.R.; Validation, W.K. and I.R.; Formal Analysis, W.K. and I.R.; Investigation, W.K. and I.R.; Resources, W.K. and I.R.; Data Curation, W.K. and I.R.; Writing-Original Draft Preparation, W.K. and I.R.; Writing-Review & Editing, W.K. and I.R.; Visualization, W.K. and I.R.; Supervision, W.K. and I.R.; Project Administration, W.K. and I.R.; Funding Acquisition, W.K. and I.R. All authors have read and agreed to the published version of the manuscript.
Funding
This research received no external funding.
Institutional Review Board Statement
Not applicable.
Informed Consent Statement
Not applicable.
Data Availability Statement
The data presented in this study are available on request from the corresponding author. The data are not publicly available due to privacy restrictions.
Conflicts of Interest
The authors declare no conflict of interest.
References
- Take Action for the Sustainable Development Goals. Available online: https://www.un.org/sustainabledevelopment/sustainable-development-goals/ (accessed on 21 November 2020).
- Claeys, G.; Efstathiou, K.; Schoenmaker, D. Soaring House Prices in Major Cities: How to Spot and Moderate Them. In Hot Property. The Housing Market in Major Cities; Nijskens, R., Lohuis, M., Hilbers, P., Heeringa, W., Eds.; Springer: Cham, Switzerland, 2019; pp. 169–179. [Google Scholar] [CrossRef]
- van Doorn, L.; Arnold, A.; Rapoport, E. In the Age of Cities: The Impact of Urbanisation on House Prices and Affordability. In Hot Property. The Housing Market in Major Cities; Nijskens, R., Lohuis, M., Hilbers, P., Heeringa, W., Eds.; Springer: Cham, Switzerland, 2019; pp. 3–13. [Google Scholar] [CrossRef]
- Isaac, D. Property Valuation Principles; Palgrave: London, UK, 2002. [Google Scholar]
- Ramrattan, L.; Szenberg, M. The Sensitivity Analysis of the FHA Technique of Housing Market Analysis: The Effect of Ratios and variables, and Their Perturbations on Family and Elderly Demand Estimates. Am. Econ. 2004, 48, 61–88. [Google Scholar] [CrossRef]
- Ranci, C.; Brandsen, T.; Sabatinelli, S. (Eds.) Social Vulnerability in European Cities: The Role of Local Welfare in Times of Crisis; Palgrave Macmillan: London, UK, 2014. [Google Scholar]
- Ferlan, N.; Bastic, M.; Psunder, I. Influential Factors on the Market Value of Residential Properties. Inz. Ekon. -Eng. Econ. 2017, 28, 135–144. [Google Scholar] [CrossRef]
- Węcławowicz, G. Przestrzeń ubóstwa—nowy czy stary wymiar zróżnicowania społeczno-przestrzennego w miastach Polski (Areas of Poverty—New or Old Dimension of the Socio-spatial Differentiation in Polish Cities). Przegląd Geogr. 2001, 73, 451–475. [Google Scholar]
- Swiader, M.; Szewrański, S.; Kazak, J. Poverty risk index as a new methodology for social inequality distribution assessment. IOP Conf. Ser. Mater. Sci. Eng. 2017, 245. [Google Scholar] [CrossRef]
- Anderson, T.R. Social and Economic Factors Affecting the Location of Residential Neighborhoods. Pap. Proc. Reg. Sci. Assoc. 1962, 9, 161–170. [Google Scholar] [CrossRef]
- Goodhall, B. The Economics of Urban Areas; Pergamon: Oxford, NY, USA, 1972. [Google Scholar]
- Emerson, M.J.; Lamphear, F.C. Urban and Regional Economics; Allyn & Bacon: Boston, MA, USA, 1975. [Google Scholar]
- Malienė, V.; Atkinson, I.; Šubic Kovač, M.; Pȍdör, A.; Nyiri Mizseiné, J.; Dixon-Gough, R.; Hernik, J.; Pazdan, M.; Gaudėšius, R.; Gurskienė, V. Property Markets and Real Estate Valuation Practice in Central and Eastern Europe - Slovenia, Hungary, Poland and Lithuania. In Real Estate, Construction and Economic Development in Emerging Market Economies; Abdulai, R.A., Obeng-Odoom, F., Ochieng, E., Maliene, V., Eds.; Routledge: New York, NY, USA, 2016. [Google Scholar]
- Kiel, K.A.; Zabel, J.E. Location, location, location: The 3L Approach to house price determination. J. Hous. Econ. 2008, 17, 175–190. [Google Scholar] [CrossRef]
- Liang, X.; Liu, Y.; Qiu, T.; Jing, Y.; Fang, F. The effects of locational factors on the housing prices of residential communities: The case of Ningbo, China. Habitat Int. 2018, 81, 1–11. [Google Scholar] [CrossRef]
- Heyman, A.V.; Sommervoll, D.E. House prices and relative location. Cities 2019, 95. [Google Scholar] [CrossRef]
- Owusu-Manu, D.-G.; Edwards, D.J.; Donkor-Hyiaman, K.A.; Asiedu, R.O.; Hosseini, M.R.; Obiri-Yeboah, E. Housing attributes and relative house prices in Ghana. Int. J. Build. Pathol. Adapt. 2019, 37, 733–746. [Google Scholar] [CrossRef]
- Fanning, S.F. Market Analysis for Real Estate, 2nd ed.; Appraisal Institute: Chicago, IL, USA, 2014. [Google Scholar]
- Greer, G.E.; Kolbe, P.T. Investment Analysis for Real Estate Decisions; Dearborn Real Estate Education: Chicago, IL, USA, 2003. [Google Scholar]
- Kucharska-Stasiak, E. Ekonomiczny Wymiar Nieruchomości; Wydawnictwo Naukowe PWN: Warszawa, Poland, 2016. [Google Scholar]
- Rącka, I.; Palicki, S.; Kostov, I. State and Determinants of Real Estate Market Development in Central and Eastern European Countries on the Example of Poland and Bulgaria. Real Estate Manag. Valuat. 2015, 23, 74–87. [Google Scholar] [CrossRef]
- Burgess, E.W. The growth of the city: An introduction to a research project. In The City; Park, R.E., Burgess, E.W., Eds.; University of Chicago Press: Chicago, IL, USA, 1925; pp. 47–62. [Google Scholar]
- Hoyt, H. The Structure and Growth of Residential Neighborhoods in American Cities; Federal Housing Administration: Washington, DC, USA, 1939. [Google Scholar]
- Harris, C.D.; Ullman, E.L. The Nature of Cities. Ann. Am. Acad. Pol. Soc. Sci. 1945, 242, 7–17. [Google Scholar] [CrossRef]
- Galati, G.; Teppa, F.; Alessie, R. Macro and Micro Drivers of House Price Dynamics: An Application to Dutch Data. Ned. Bank Work. Pap. 2011, 288. Available online: https://www.dnb.nl/en/binaries/Working%20Paper%20288_tcm47-250127.pdf (accessed on 21 November 2020). [CrossRef]
- Mach, Ł.; Rącka, I. An analysis of the impact and influence of the global economic crisis on the housing market in European post-communist countries. In Proceedings of the 32nd International Business Information Management Association Conference (IBIMA), Vision 2020: Sustainable Economic Development and Application of Innovation Management from Regional expansion to Global Growth, Seville, Spain, 15–16 November 2018; pp. 2573–2584. [Google Scholar]
- Kisiała, W.; Suszyńska, K. The impact of the global economic crisis on the housing sector in Poland. In Globalization and Its Socio-Economic Consequences; Kliestik, T., Ed.; ZU—University of Zilina: Zilina, Slovakia, 2017; pp. 937–944. [Google Scholar]
- Mach, Ł. Measuring and assessing the impact of the global economic crisis on European real property market. J. Bus. Econ. Manag. 2019, 20, 1189–1209. [Google Scholar] [CrossRef]
- Rehman, M.U.; Ali, S.; Shahzad, S.J.H. Asymmetric Nonlinear Impact of Oil Prices and Inflation on Residential Property Prices: A Case of US, UK and Canada. J. Real Estate Finance Econ. 2020, 61, 39–54. [Google Scholar] [CrossRef]
- Olszewski, K.; Augustyniak, H.; Laszek, J.; Leszczynski, R.; Waszczuk, J. On the dynamics of the primary housing market and the forecasting of house prices. In Combining Micro and Macro Data for Financial Stability Analysis; Bank for International Settlements: Basel, Switzerland, 2016; Volume 41. [Google Scholar]
- Ma, Y.; Gopal, S. Geographically Weighted Regression Models in Estimating Median Home Prices in Towns of Massachusetts Based on an Urban Sustainability Framework. Sustainability 2018, 10, 1026. [Google Scholar] [CrossRef]
- Rosenberg, S. The effects of conventional and unconventional monetary policy on house prices in the Scandinavian countries. J. Hous. Econ. 2019, 46. [Google Scholar] [CrossRef]
- Duan, K.; Mishra, T.; Parhi, M.; Wolfe, S. How Effective are Policy Interventions in a Spatially-Embedded International Real Estate Market? J. Real Estate Finance Econ. 2019, 58, 596–637. [Google Scholar] [CrossRef]
- Frappa, S.; Mesonnier, J.S. The Housing Price Boom of the late 1990s: Did Inflation Targeting Matter. J. Financ. Stab. 2010, 6, 243–254. [Google Scholar] [CrossRef][Green Version]
- de La Paz, P.T. New housing supply and price reactions: Evidence from Spanish markets. J. Eur. Real Estate Res. 2014, 7, 4–28. [Google Scholar] [CrossRef]
- Hildebrandt, A.; Huynh-Olesen, D.T.; Steiner, K.; Wagner, K. Residential Property Prices in Central, Eastern and Southeastern European Countries. Focus Eur. Econ. Integr. 2013, 2, 52–76. [Google Scholar]
- Murie, A. Housing Policy and the Making of Inequality. In Inequalities in the UK; Fée, D., Kober-Smith, A., Eds.; Emerald Publishing Limited: Bingley, UK, 2017; pp. 185–204. [Google Scholar] [CrossRef]
- Koetter, M.; Poghosyan, T. Real estate prices and bank stability. J. Bank. Financ. 2010, 34, 1129–1138. [Google Scholar] [CrossRef]
- Klarl, T. The nexus between housing and GDP re-visited: A wavelet coherence view on housing and GDP for the U.S. Econ. Bull. 2016, 36, 704–720. [Google Scholar]
- Galati, G.; Teppa, F. Heterogeneity in House Price Dynamics; DNB Working Papers; Research Department, Netherlands Central Bank: Amsterdam, The Netherlands, 2017. [Google Scholar]
- Shiller, R. Long-Term Perspective on the Current Boom in Home Prices. Econ. Voice 2006, 3. [Google Scholar] [CrossRef]
- Wheaton, W.C.; Nechayev, G. The 1998–2005 Housing ‘Bubble’ and the Current ‘Correction’: What’s Different this Time? J. Real Estate Res. 2008, 30, 1–26. [Google Scholar] [CrossRef]
- Archer, W.R.; Gatzlaff, D.H.; Ling, D.C. Measuring the Importance of Location in House Price Appreciation. J. Urban Econ. 1996, 40, 334–353. [Google Scholar] [CrossRef]
- Lin, S.H.; Li, J.H.; Hsieh, J.C.; Huang, X.; Chen, J.T. Impact of Property Tax on Housing-Market Disequilibrium in Different Regions: Evidence from Taiwan for the period 1982–2016. Sustainability 2018, 10, 4318. [Google Scholar] [CrossRef]
- Saiz, A. The Geographic Determinants of Housing Supply. Q. J. Econ. 2010, 125, 1253–1296. [Google Scholar] [CrossRef]
- Dąbrowski, J.; Hvizdová, E.; Polačko, J. Demography as essential variable in real estate price prognosis. Geomat. Environ. Eng. 2019, 13, 19–29. [Google Scholar] [CrossRef]
- Monnet, E.; Wolf, C. Demographic cycles, migration and housing investment. J. Hous. Econ. 2017, 38, 38–49. [Google Scholar] [CrossRef]
- Timmermans, H.; van der Waerden, P.; Alves, M.; Polak, J.; Ellis, S.; Harvey, A.S.; Kurose, S.; Zandee, R. Spatial context and the complexity of daily travel patterns: An international comparison. J. Transp. Geogr. 2003, 11, 37–46. [Google Scholar] [CrossRef]
- Poudyal, N.C.; Hodges, D.G.; Merrett, C.D. A hedonic analysis of the demand for and benefits of urban recreation parks. Land Use Policy 2009, 26, 975–983. [Google Scholar] [CrossRef]
- Mulley, C.; Tsai, C.H.P. When and how much does new transport infrastructure add to property values? Evidence from the bus rapid transit system in Sydney, Australia. Transp. Policy 2016, 51, 15–23. [Google Scholar] [CrossRef]
- Fernandez-Duran, L.; Llorca, A.; Ruiz, N.; Valero, S. The impact of location on housing prices: Applying the Artificial Neural Network Model as an analytical tool. ERSA Conf. Pap. 2011, p. ersa11p1595. Available online: http://www-sre.wu.ac.at/ersa/ersaconfs/ersa11/e110830aFinal01595.pdf (accessed on 21 November 2020).
- Kozińska, D. Problemy mieszkaniowe osób w starszym wieku. Sprawy Mieszk. 1984, 1, 8–16. [Google Scholar]
- Węcławowicz, G. Elderly people in the socio-spatial structure of some Polish towns. Geogr. Pol. 1988, 54, 139–149. [Google Scholar]
- Węcławowicz, G. Some Aspects of Income and Spatial Disparities in Poland—Regional and Intra-Urban Scale. In Urban and Regional Development in Italy and in Poland; Besana, A., Ed.; Edizioni Colibri: Trident, Italy, 1997; pp. 315–334. [Google Scholar]
- Sirmans, S.; Macpherson, D.; Zietz, E. The Composition of Hedonic Pricing Models. J. Real Estate Lit. 2005, 13, 1–44. [Google Scholar] [CrossRef]
- Anthony, O.A. Examination of the determinants of housing values in urban Ghana and implications for policy makers. J. Afr. Real Estate Res. 2012, 2, 58–85. [Google Scholar]
- Carr, D.H.; Lawson, J.; Schultz, J. Mastering Real Estate Appraisal; Dearborn Real Estate Education: Chicago, IL, USA, 2003. [Google Scholar]
- Cirman, A.; Pahor, M.; Verbic, M. Determinants of Time on the Market in a Thin Real Estate Market. Inz. Ekon. -Eng. Econ. 2015, 26, 4–11. [Google Scholar] [CrossRef]
- Batóg, J.; Foryś, I.; Gaca, R.; Głuszak, M.; Konowalczuk, J. Investigating the Impact of Airport Noise and Land Use Restrictions on House Prices: Evidence from Selected Regional Airports in Poland. Sustainability 2019, 11, 412. [Google Scholar] [CrossRef]
- Szopińska, K.; Krajewska, M. Methods of assessing noise nuisance of real estate surroundings. Real Estate Manag. Valuat. 2016, 24, 19–30. [Google Scholar] [CrossRef]
- Diao, M.; Qin, Y.; Sing, T.F. Negative Externalities of Rail Noise and Housing Values: Evidence from the Cessation of Railway Operations in Singapore. Real Estate Econ. 2015, 44, 878–917. [Google Scholar] [CrossRef]
- Szewrański, S.; Świąder, M.; Kazak, J.K.; Tokarczyk-Dorociak, K.; van Hoof, J. Socio-Environmental Vulnerability Mapping for Environmental and Flood Resilience Assessment: The Case of Ageing and Poverty in the City of Wrocław, Poland. Integr. Environ. Assess. Manag. 2018, 14, 592–597. [Google Scholar] [CrossRef] [PubMed]
- Świąder, M.; Szewrański, S.; Kazak, J. Spatial-Temporal Diversification of Poverty in Wroclaw. Procedia Eng. 2016, 161, 1596–1600. [Google Scholar] [CrossRef]
- Ryan, B.D.; Weber, R. Valuing New Development in Distressed Urban Neighborhoods. J. Am. Plan. Assoc. 2007, 73, 100–111. [Google Scholar] [CrossRef]
- Judson, D. Where the Streets have no Neighborhoods: Marginality and Decline in St Louis, Missouri (USA). Adv. Educ. Diverse Communities Res. Policy Prax. 2012, 8, 201–267. [Google Scholar] [CrossRef]
- Tita, G.E.; Petras, T.L.; Greenbaum, R.T. Crime and Residential Choice: A Neighborhood Level Analysis of the Impact of Crime on Housing Prices. J. Quant. Criminol. 2006, 22, 299. [Google Scholar] [CrossRef]
- Act of 12 March 2004 on Social Assistance. Journal of Laws No. 64, item. 593, as Amended. Available online: https://isap.sejm.gov.pl/isap.nsf/DocDetails.xsp?id=WDU20040640593 (accessed on 21 November 2020).
- The Measurement of Extreme Poverty in the European Union. Available online: https://ec.europa.eu/social/BlobServlet?docId=6472&langId=en (accessed on 27 December 2020).
- Johnston, R.J. Urban geography: City structures. Progr. Hum. Geogr. 1977, 1, 118–129. [Google Scholar] [CrossRef]
- Swanson, K. Human Geography; Kaplan Publishing: Wokingham, UK, 2016. [Google Scholar]
- McCluskey, W.J.; McCord, M.; Davis, P.T.; Haran, M.; McIlhatton, D. Prediction accuracy in mass appraisal: A comparison of modern approaches. J. Prop. Res. 2013, 30, 239–265. [Google Scholar] [CrossRef]
- Doumpos, M.; Papastamos, D.; Andritsos, D.; Zopounidis, C. Developing automated valuation models for estimating property values: A comparison of global and locally weighted approaches. Ann. Oper. Res. 2020. [Google Scholar] [CrossRef]
- Morano, P.; Rosato, P.; Tajani, F.; Manganelli, B.; Di Liddo, F. Contextualized Property Market Models vs. Generalized Mass Appraisals: An Innovative Approach. Sustainability 2019, 11, 4896. [Google Scholar] [CrossRef]
- Słodczyk, J. Kierunki przemian funkcjonalno-przestrzennej struktury miast w Polsce po roku 1989. In Człowiek i Przestrzeń; Instytut Geografii i Gospodarki Przestrzennej UJ: Kraków, Poland, 2001; pp. 123–132. [Google Scholar]
- Prawelska-Skrzypek, G.; Porębski, W. Obszary deprywacji w Krakowie oraz zmiany w ich rozmieszczeniu w latach 1992–2001. Nierówności Społeczne a Wzrost Gospod. 2003, 2, 433–445. [Google Scholar]
- Weltrowska, J.; Kisiała, W. Obszary koncentracji ubóstwa w strukturze przestrzennej miasta (na przykładzie Poznania) (Areas of Concentration of Poverty in the City’s Spatial Structure—The Case Study of Poznań). Prace Naukowe Uniwersytetu Ekonomicznego we Wrocławiu Res. Pap. Wroc. Univ. Econ. 2014, 331, 235–245. [Google Scholar] [CrossRef]
- Wooldridge, J.M. Introductory Econometrics: A Modern Approach; Nelson Education: Toronto, Canada, 2016. [Google Scholar]
- Cox, D.R.; Wermuth, N. A comment on the coefficient of determination for binary responses. Am. Stat. 1992, 46, 1–4. [Google Scholar] [CrossRef]
- Murray, M.P. Econometrics. A Modern Introduction; Addison-Wesley Pearson: Boston, MA, USA, 2006. [Google Scholar]
- Bartnicki, S. Percepcja zagrożenia przestępczością—wstępna prezentacja wyników badań przeprowadzonych w 12 warszawskich osiedlach mieszkaniowych. Confer. Pap. IGiPZ PAN 1991, 14, 117–124. [Google Scholar]
- Grotowska-Leder, J. Zachowania aspołeczne w enklawach biedy. In Żyć i Pracować w Enklawach Biedy; Warzywoda-Kruszyńska, W., Ed.; Łódź: Angraf, Poland, 1998; pp. 99–121. [Google Scholar]
- Panek, T. Strefa niedostatku i jej determinanty w Polsce. Wiadomości Statystyczne 2001, 1, 21–32. [Google Scholar]
- Skupowa, J. Gdynia. Osiedla bogactwa i biedy. In Wybrane Problemy Badawcze Geografii Społecznej w Polsce; Sagan, I., Czepczyński, M., Eds.; Katedra Geografii Ekonomicznej, Uniwersytet Gdański: Gdansk, Poland, 2001; pp. 189–194. [Google Scholar]
- Trojanek, R.; Tanas, J.; Raslanas, S.; Banaitis, A. The impact of aircraft noise on housing prices in Poznan. Sustainability 2017, 9, 2088. [Google Scholar] [CrossRef]
- Trojanek, R.; Huderek-Glapska, S. Measuring the noise cost of aviation–The association between the Limited Use Area around Warsaw Chopin Airport and property values. J. Air Transp. Manag. 2018, 67, 103–114. [Google Scholar] [CrossRef]
- Guijarro, F. Assessing the Impact of Road Traffic Externalities on Residential Price Values: A Case Study in Madrid, Spain. Int. J. Environ. Res. Public Health 2019, 16, 5149. [Google Scholar] [CrossRef]
- He, Y.; Collins, A.R. Does environmental pollution affect metropolitan housing prices? Evidence from Guangzhou, China (1987–2014). Appl. Econ. Lett. 2020, 27, 213–220. [Google Scholar] [CrossRef]
- Yue, W.; Ni, C.; Tian, C.; Wen, H.; Fang, L. Impacts of an Urban Environmental Event on Housing Prices: Evidence from the Hangzhou Pesticide Plant Incident. J. Urban Plan. Dev. 2020, 146, 04020015. [Google Scholar] [CrossRef]
- Chiarazzo, V.; Coppola, P.; Dell’Olio, L.; Ibeas, A.; Ottomanelli, M. The Effects of Environmental Quality on Residential Choice Location. Procedia Soc. Behav. Sci. 2014, 162, 178–187. [Google Scholar] [CrossRef]
- Harrison, D.M.; Smersh, G.T.; Schwartz, A.L., Jr. Environmental Determinants of Housing Prices: The Impact of Flood Zone Status. J. Real Estate Res. 2001, 21, 3–20. [Google Scholar] [CrossRef]
- Gadziński, J.; Radzimski, A. The first rapid tram line in Poland: How has it affected travel behaviours, housing choices and satisfaction, and apartment prices? J. Transp. Geogr. 2016, 54, 451–463. [Google Scholar] [CrossRef]
- Trojanek, R.; Gluszak, M. Spatial and time effect of subway on property prices. J. Hous. Built Environ. 2018, 33, 359–384. [Google Scholar] [CrossRef]
- Trojanek, R. The impact of green areas on dwelling prices–the case of Poznań city. Entrep. Bus. Econ. Rev. 2016, 4, 27–35. [Google Scholar] [CrossRef]
- Palicki, S.; Rącka, I. Influence of Urban Renewal on the Assessment of Housing Market in the Context of Sustainable Socioeconomic City Development. In Smart City 360°; Springer: Cham, Switzerland, 2016. [Google Scholar] [CrossRef]
- Bełej, M.; Figurska, M. 3D Modeling of Discontinuity in the Spatial Distribution of Apartment Prices Using Voronoi Diagrams. Remote Sens. 2020, 12, 229. [Google Scholar] [CrossRef]


Publisher’s Note: MDPI stays neutral with regard to jurisdictional claims in published maps and institutional affiliations. |
© 2021 by the authors. Licensee MDPI, Basel, Switzerland. This article is an open access article distributed under the terms and conditions of the Creative Commons Attribution (CC BY) license (http://creativecommons.org/licenses/by/4.0/).