An Alternative Risk Assessment Model of Urban Waterlogging: A Case Study of Ningbo City

Abstract
1. Introduction
2. Literature Review
2.1. Urban Waterlogging
2.2. Risk Assessment of Urban Waterlogging
2.2.1. Formation Mechanism of Natural Disaster Risk
2.2.2. Waterlogging Risk Assessment Model
3. Methodology
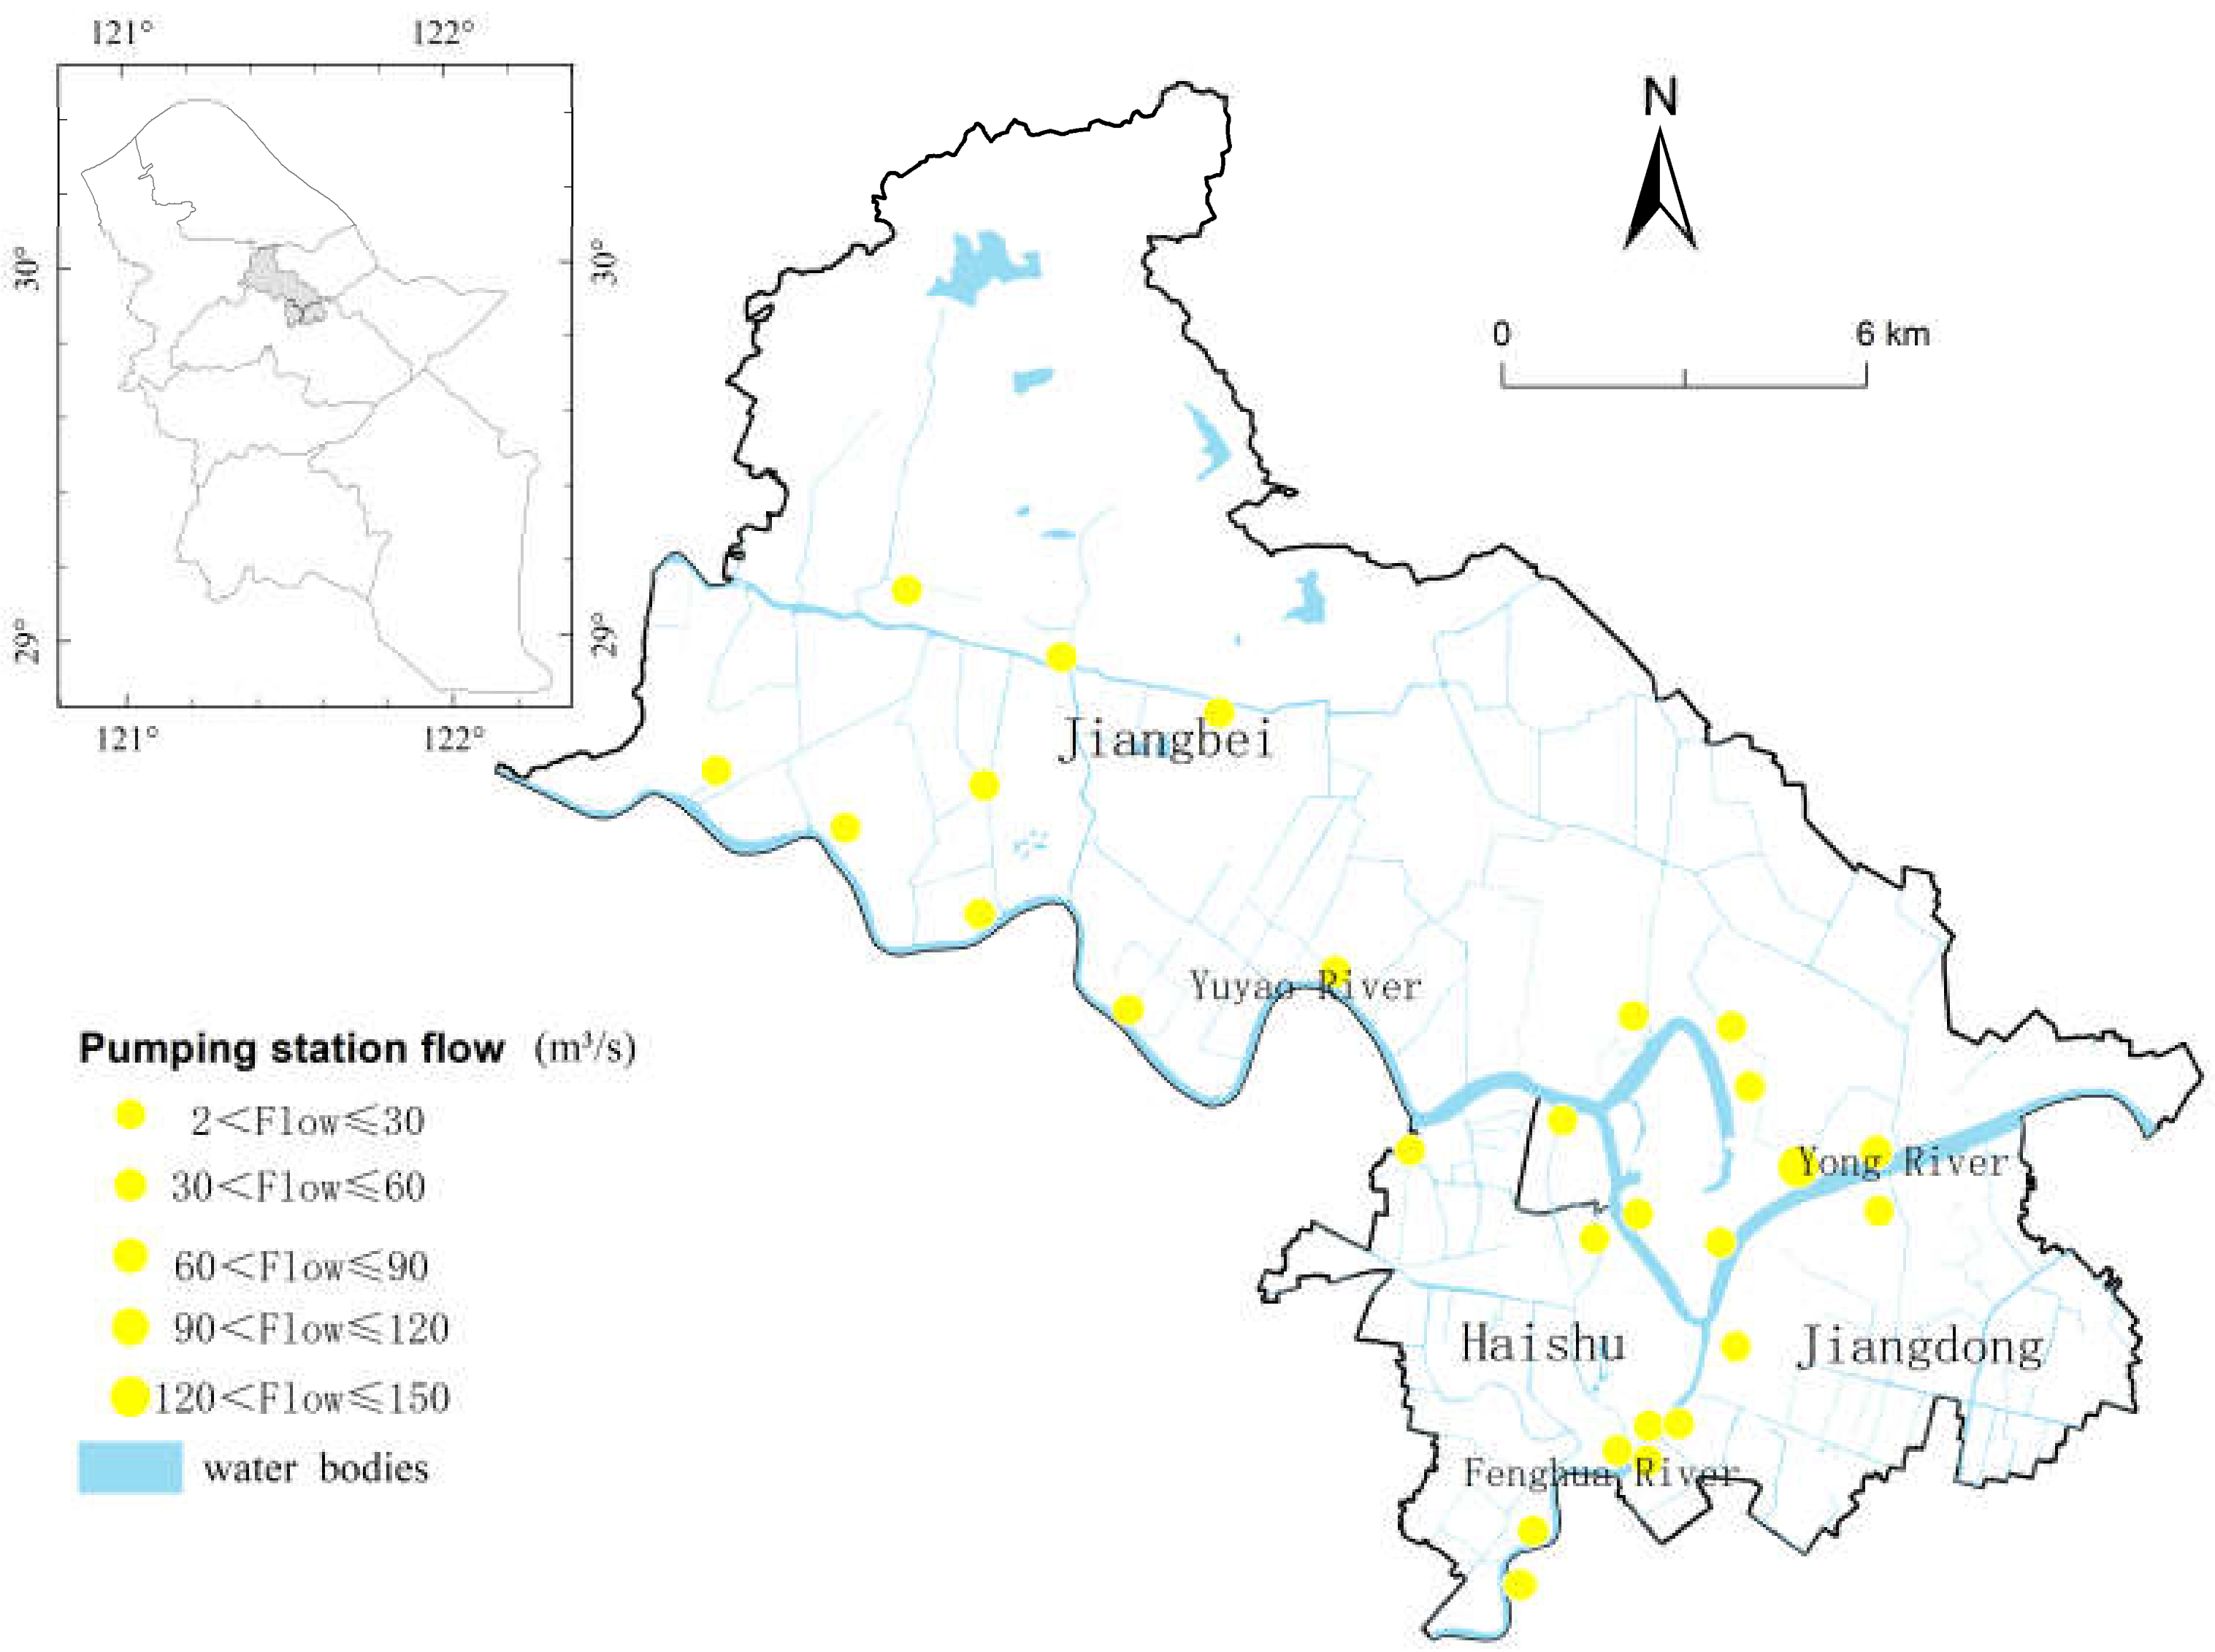
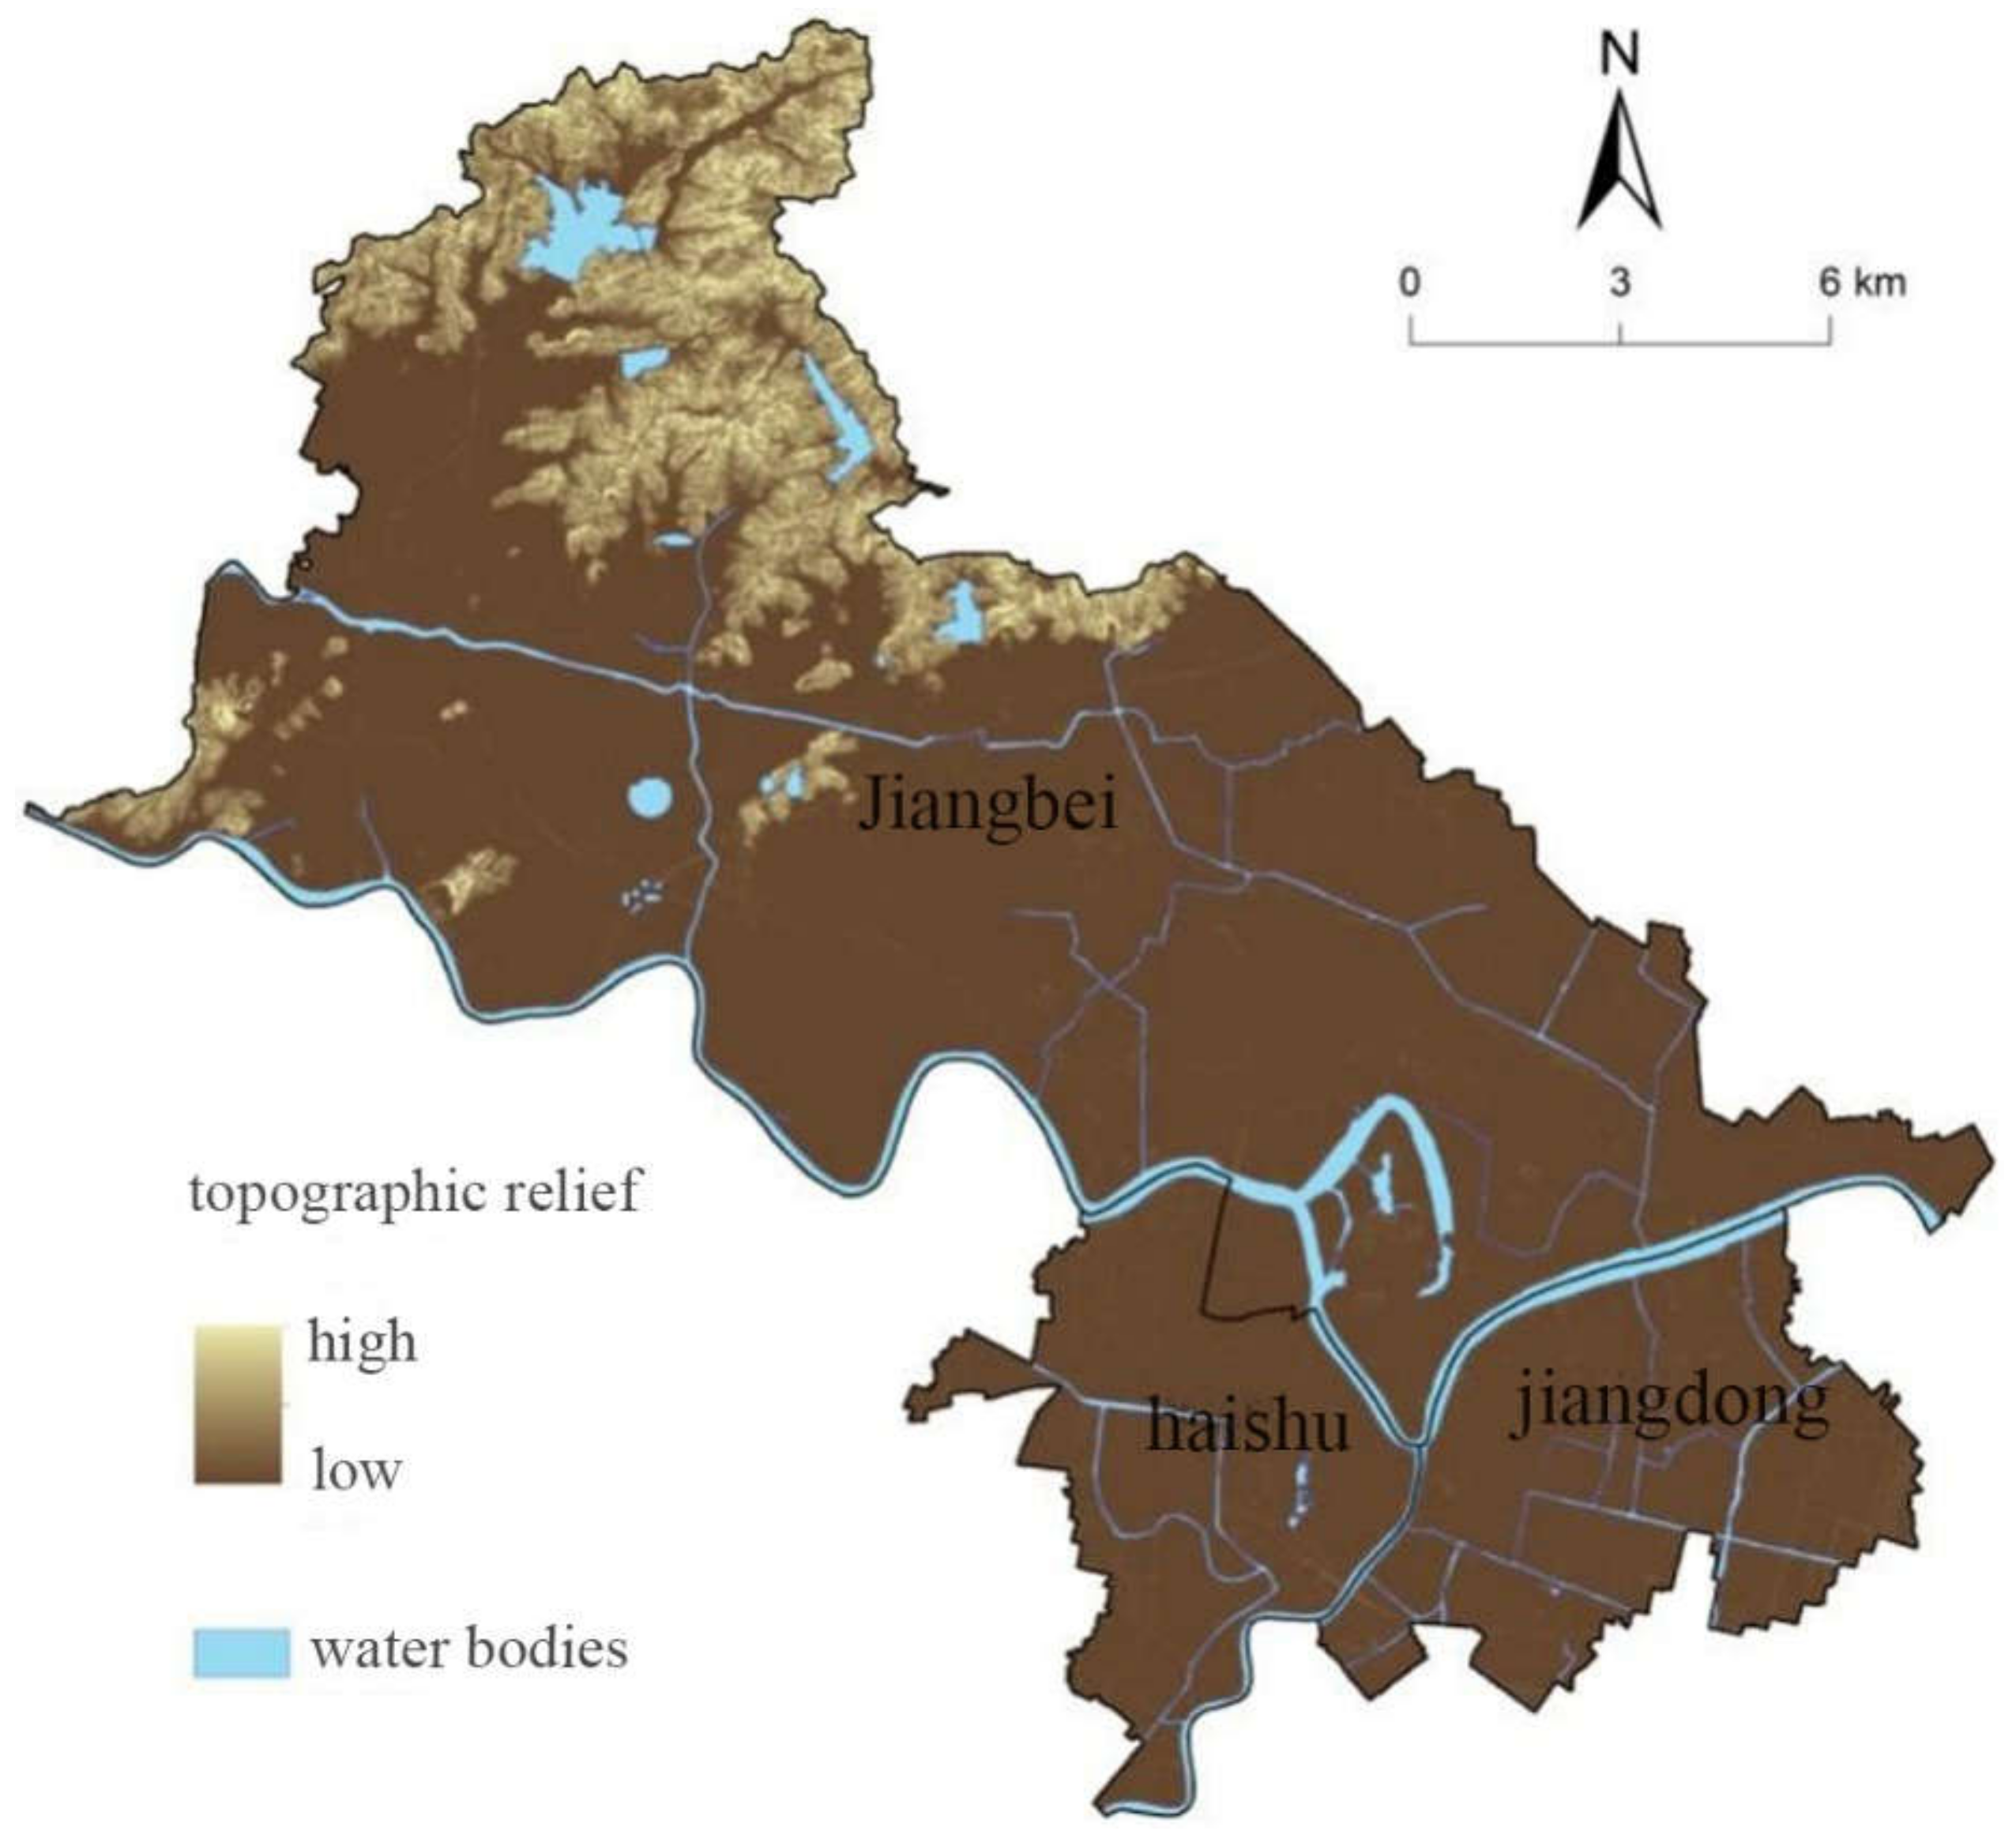
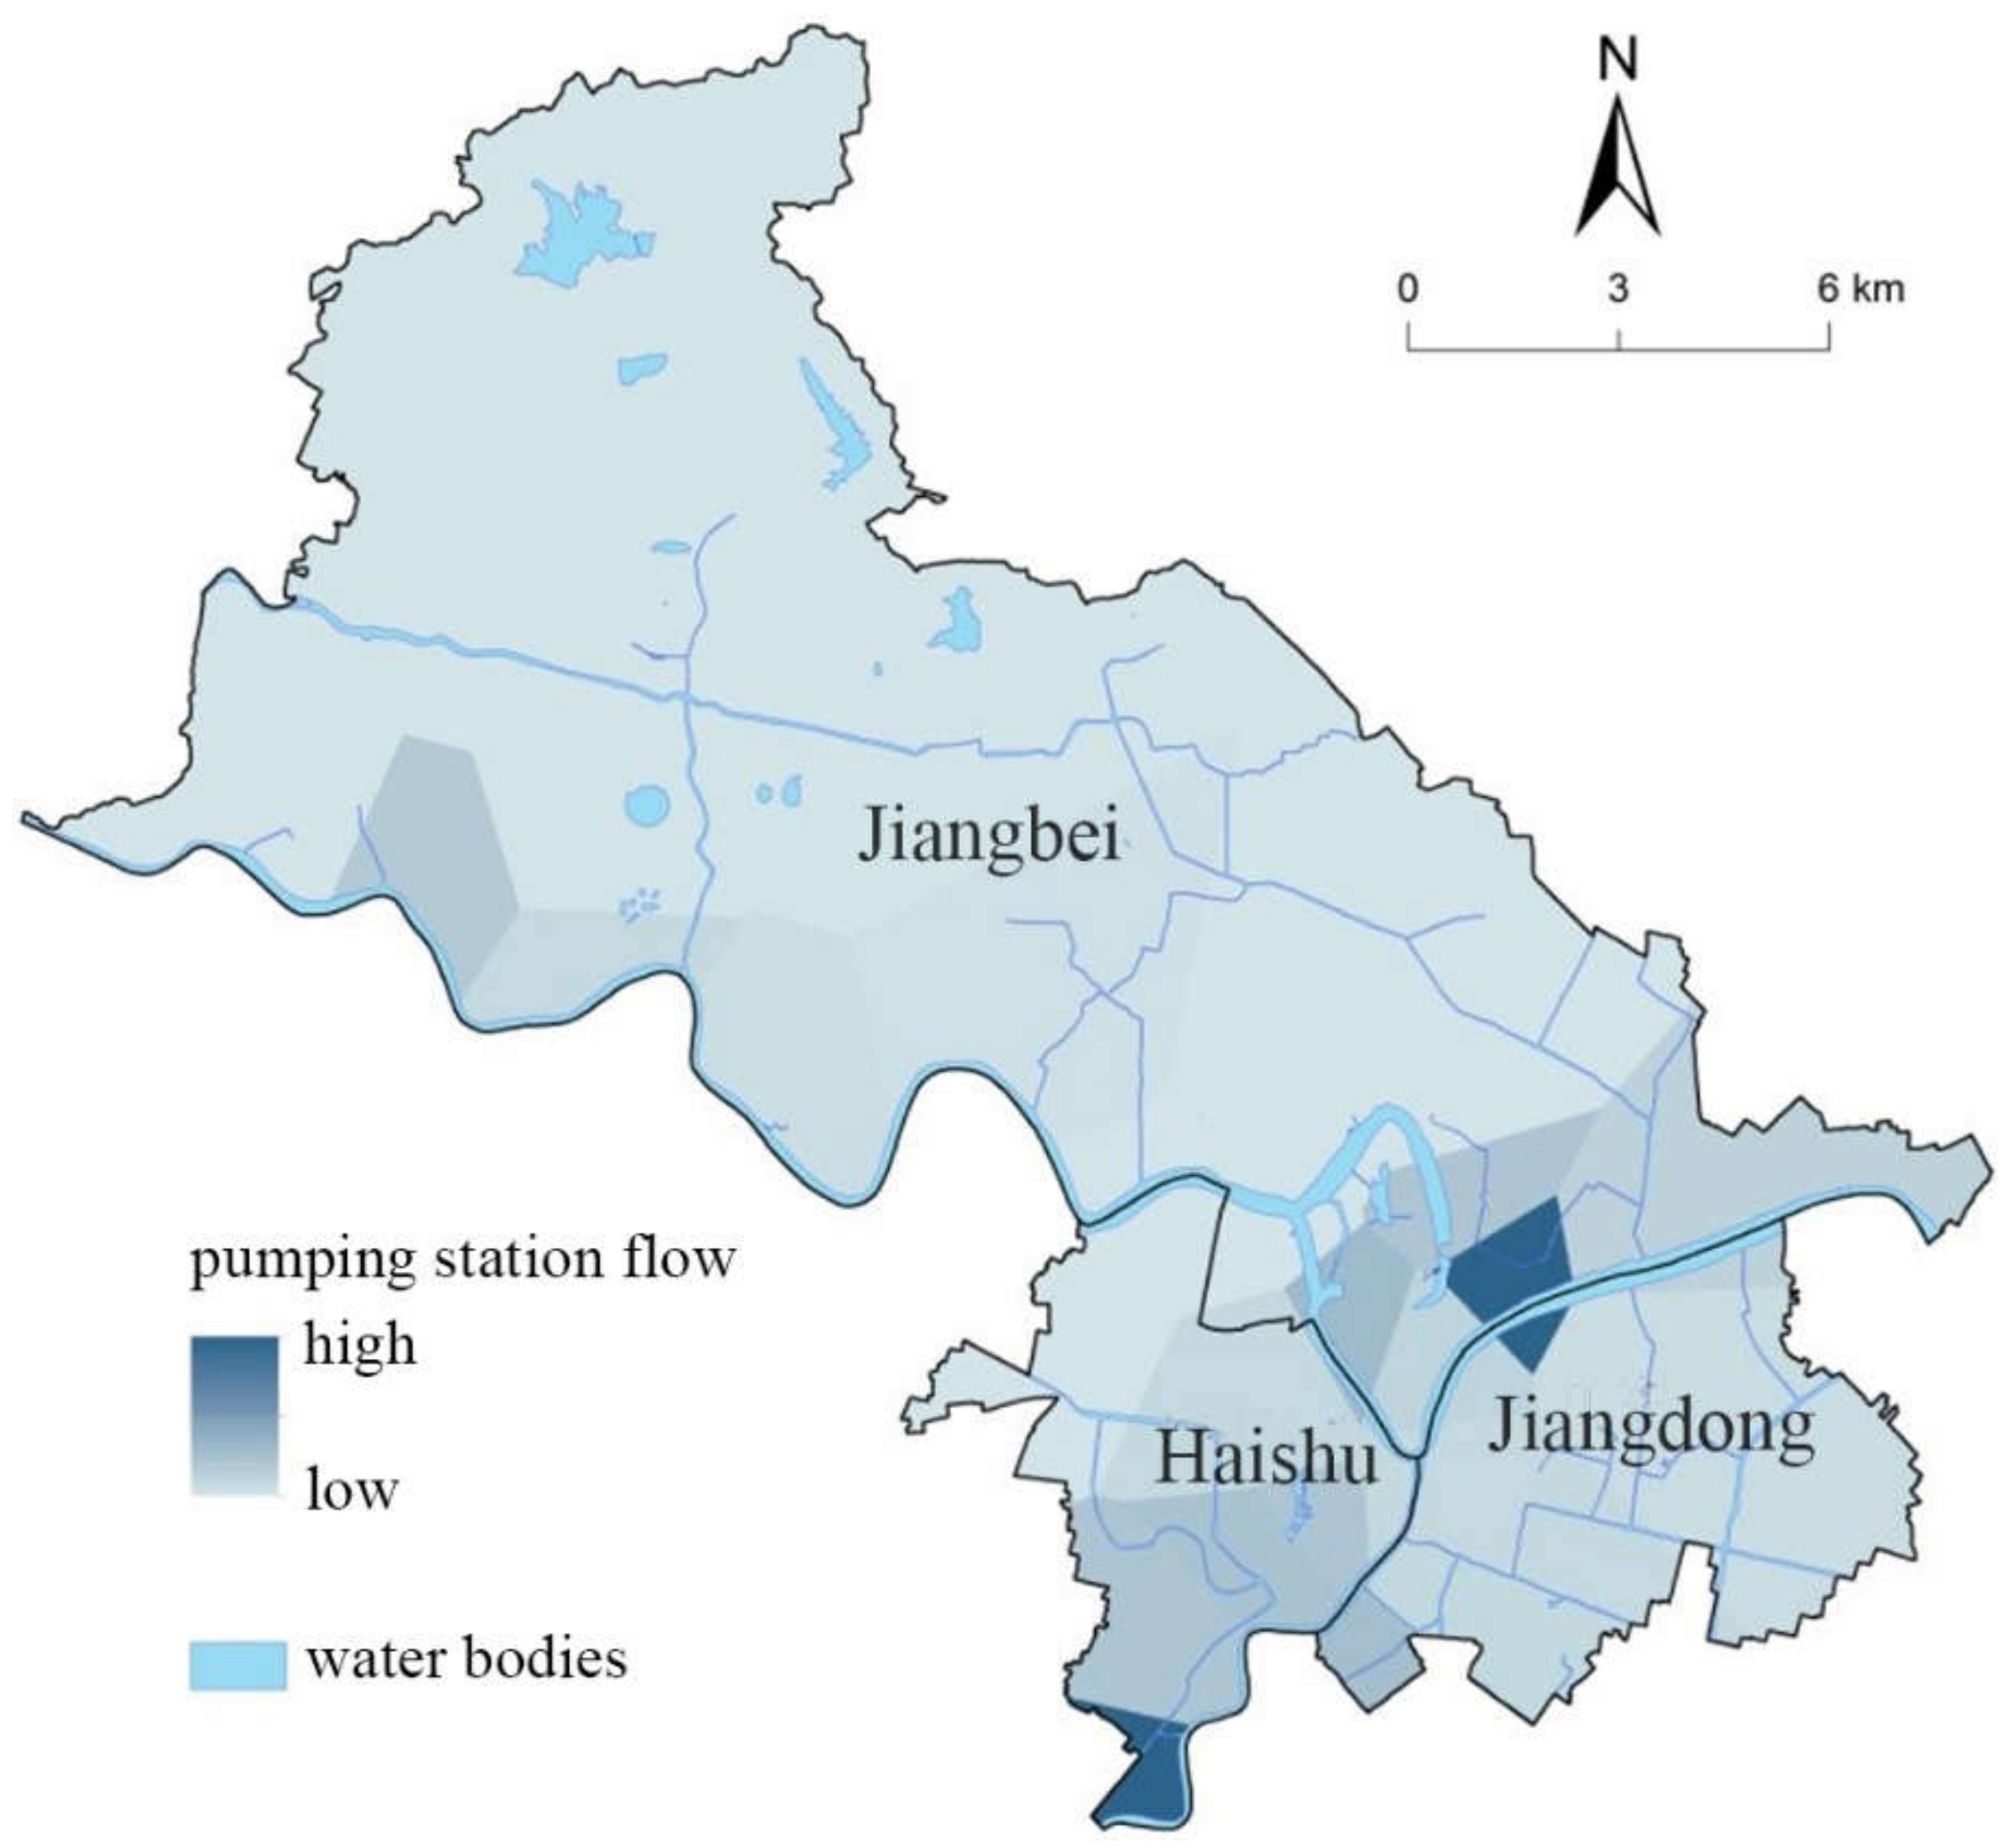
3.1. Research Area
3.2. Data Collection
3.3. Data Processing
3.4. Risk Indicator Weight
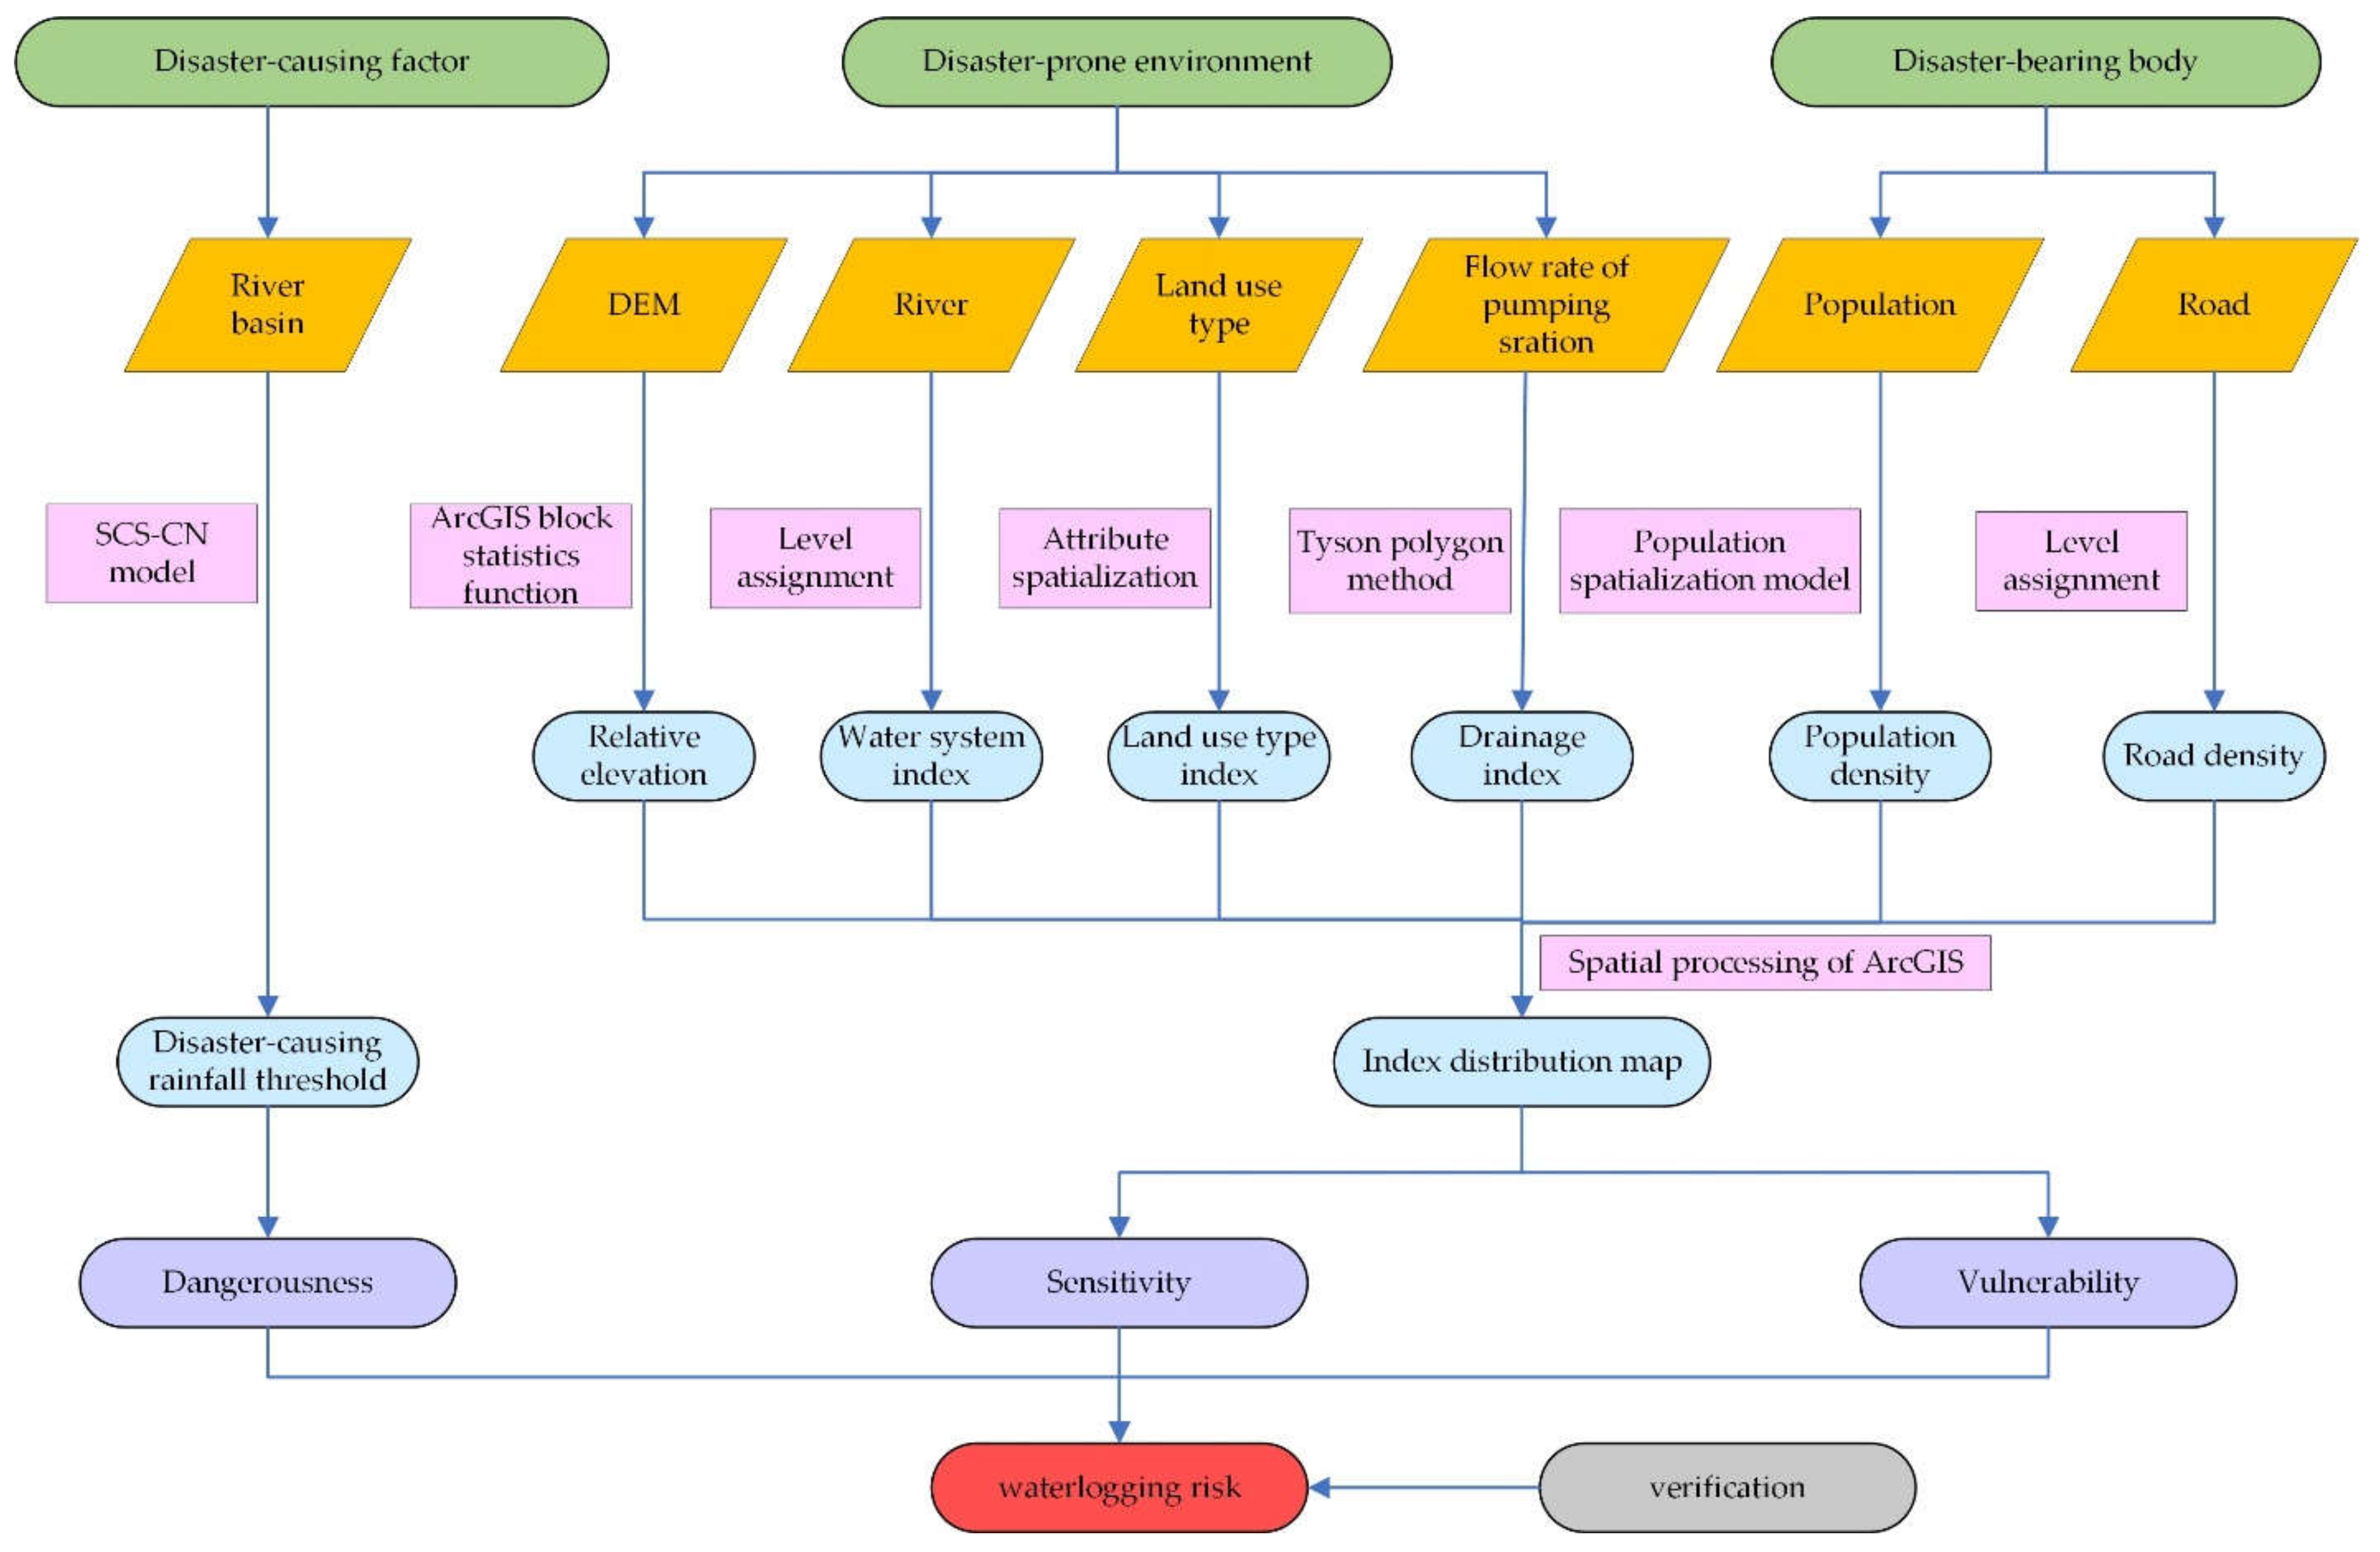
3.5. Risk Assessment Model
4. Results
4.1. Urban Waterlogging Risk Assessment Model
4.2. Risk Assessment Based on the Risk Assessment Model
4.2.1. Calculation of Risk Indicator Weight
4.2.2. Waterlogging Risk Assessment in the City Proper of Ningbo
- Waterlogging Dangerousness Assessment
- 2.
- Waterlogging Sensitivity Assessment
- 3.
- Waterlogging Vulnerability Assessment
- 4.
- Comprehensive Waterlogging Risk Assessment in the City Proper of Ningbo
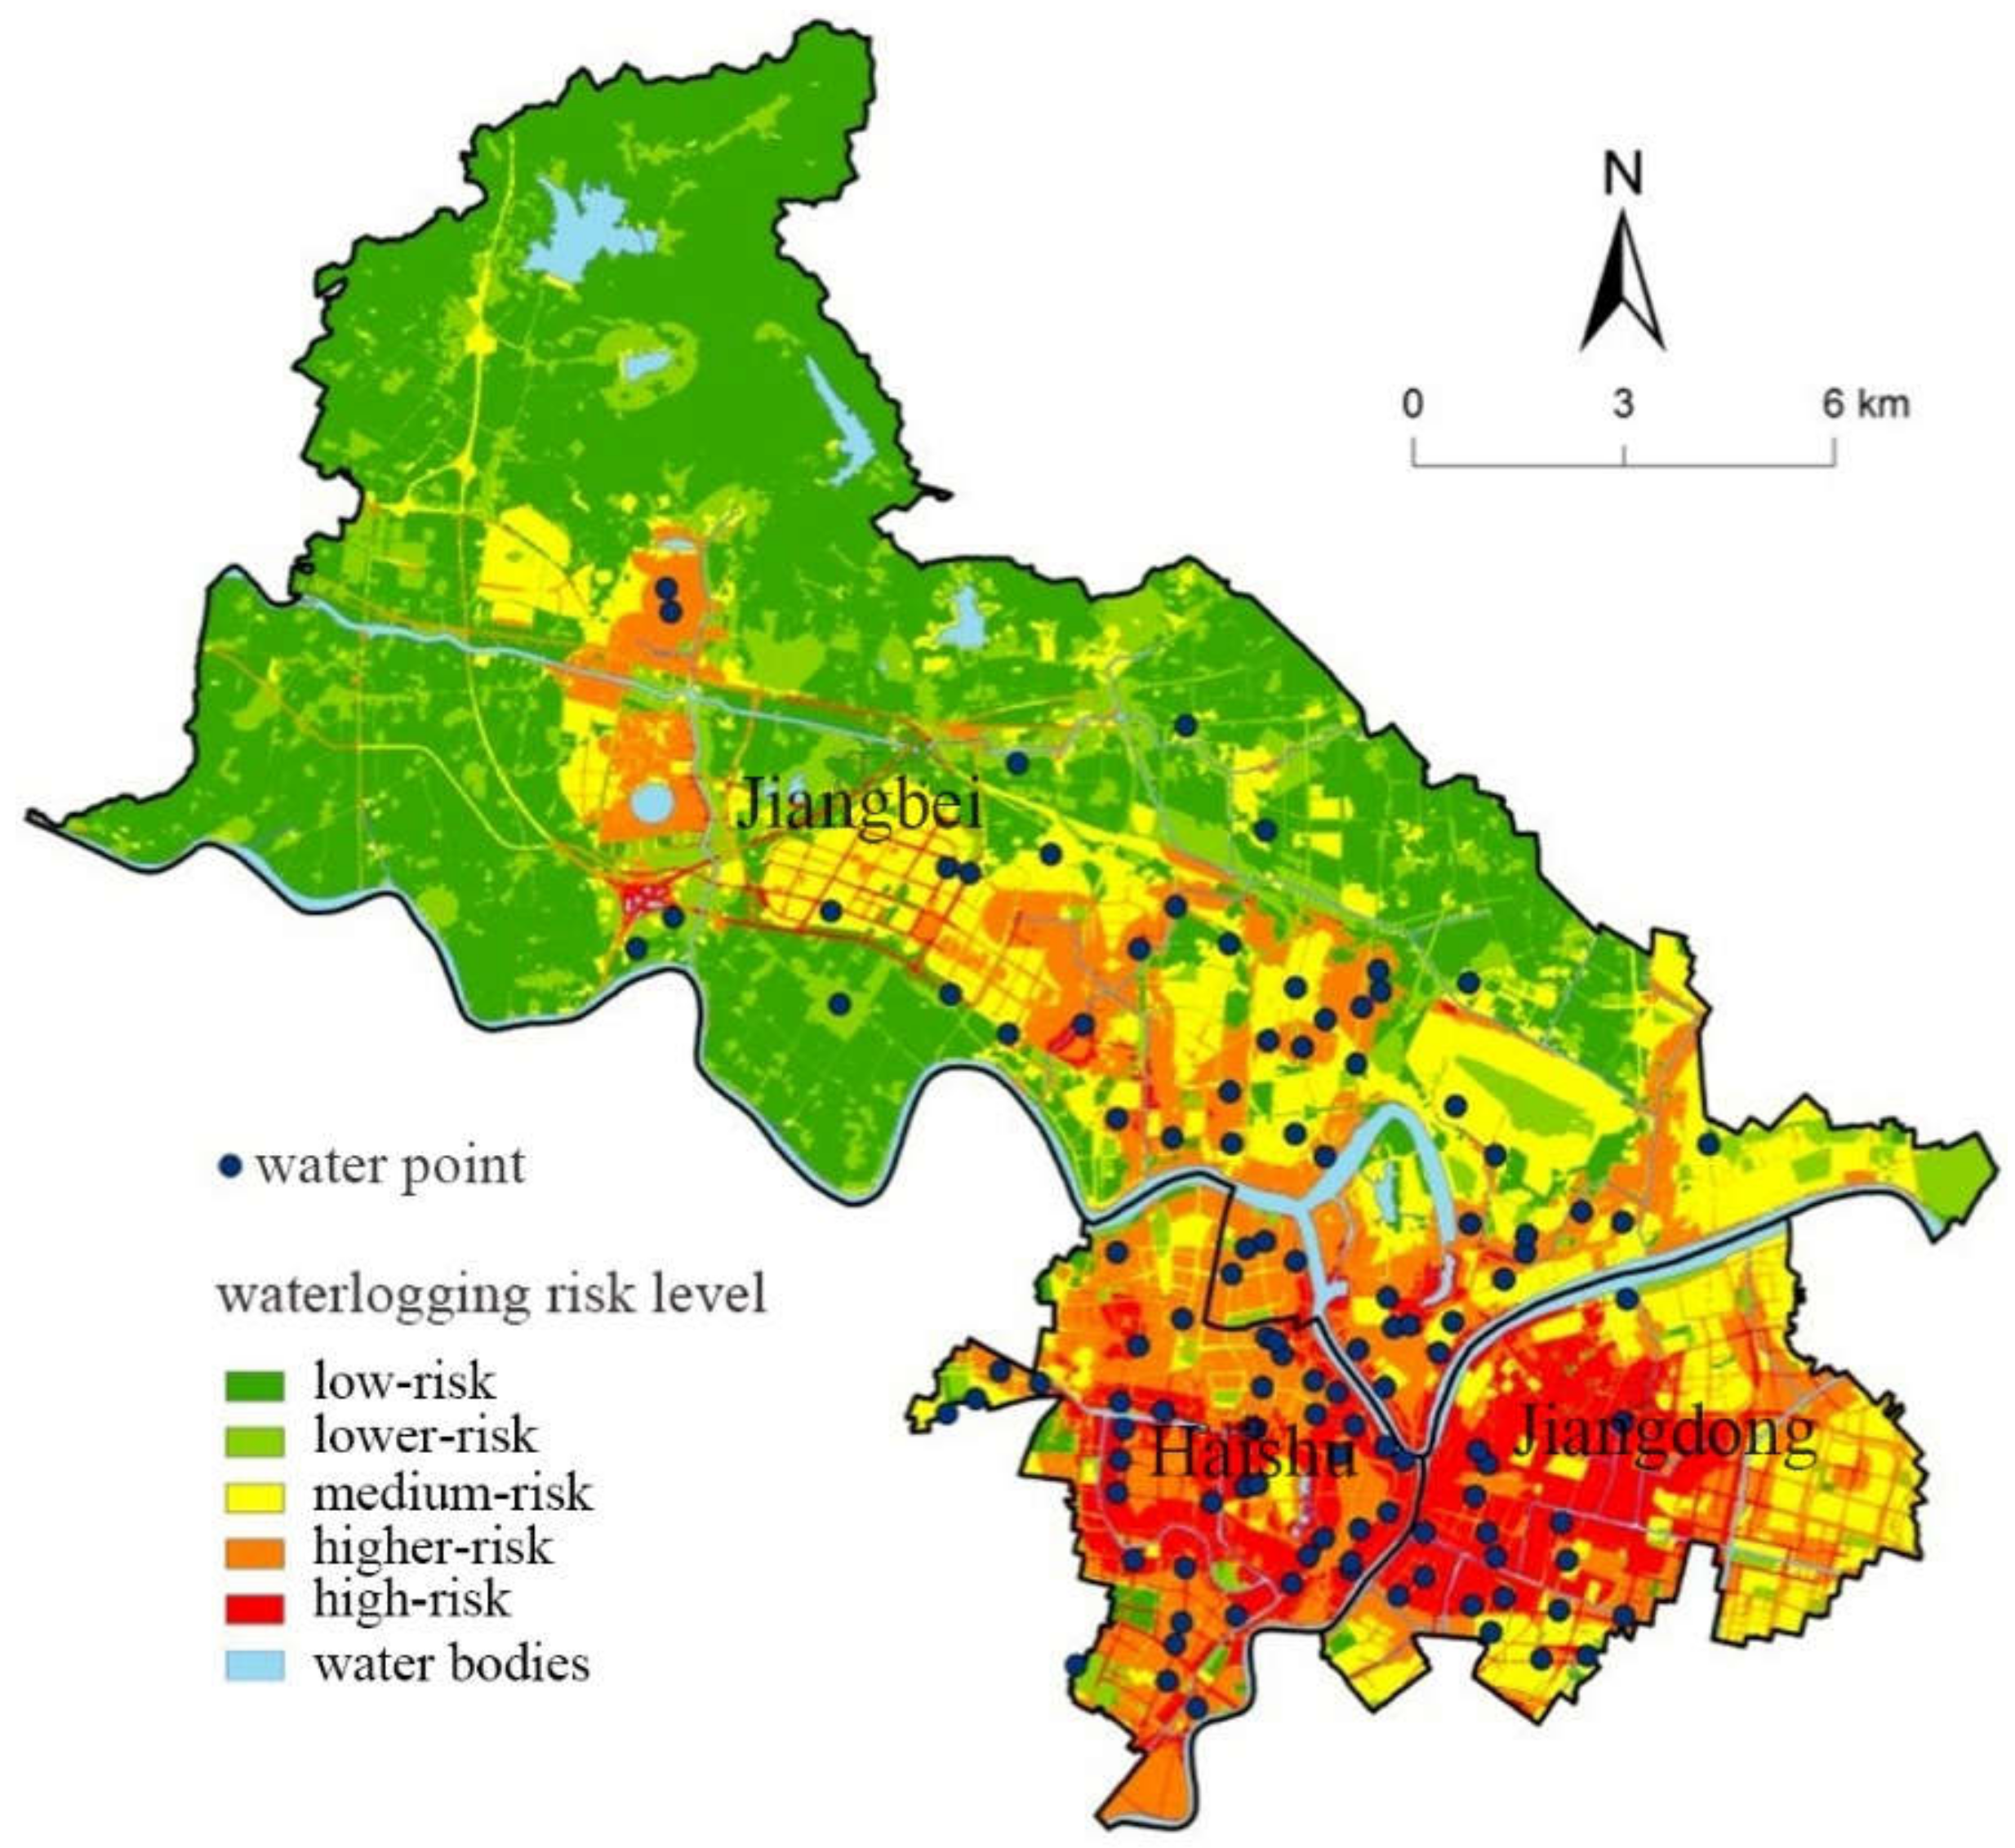
4.2.3. Verification
5. Discussion
- (1)
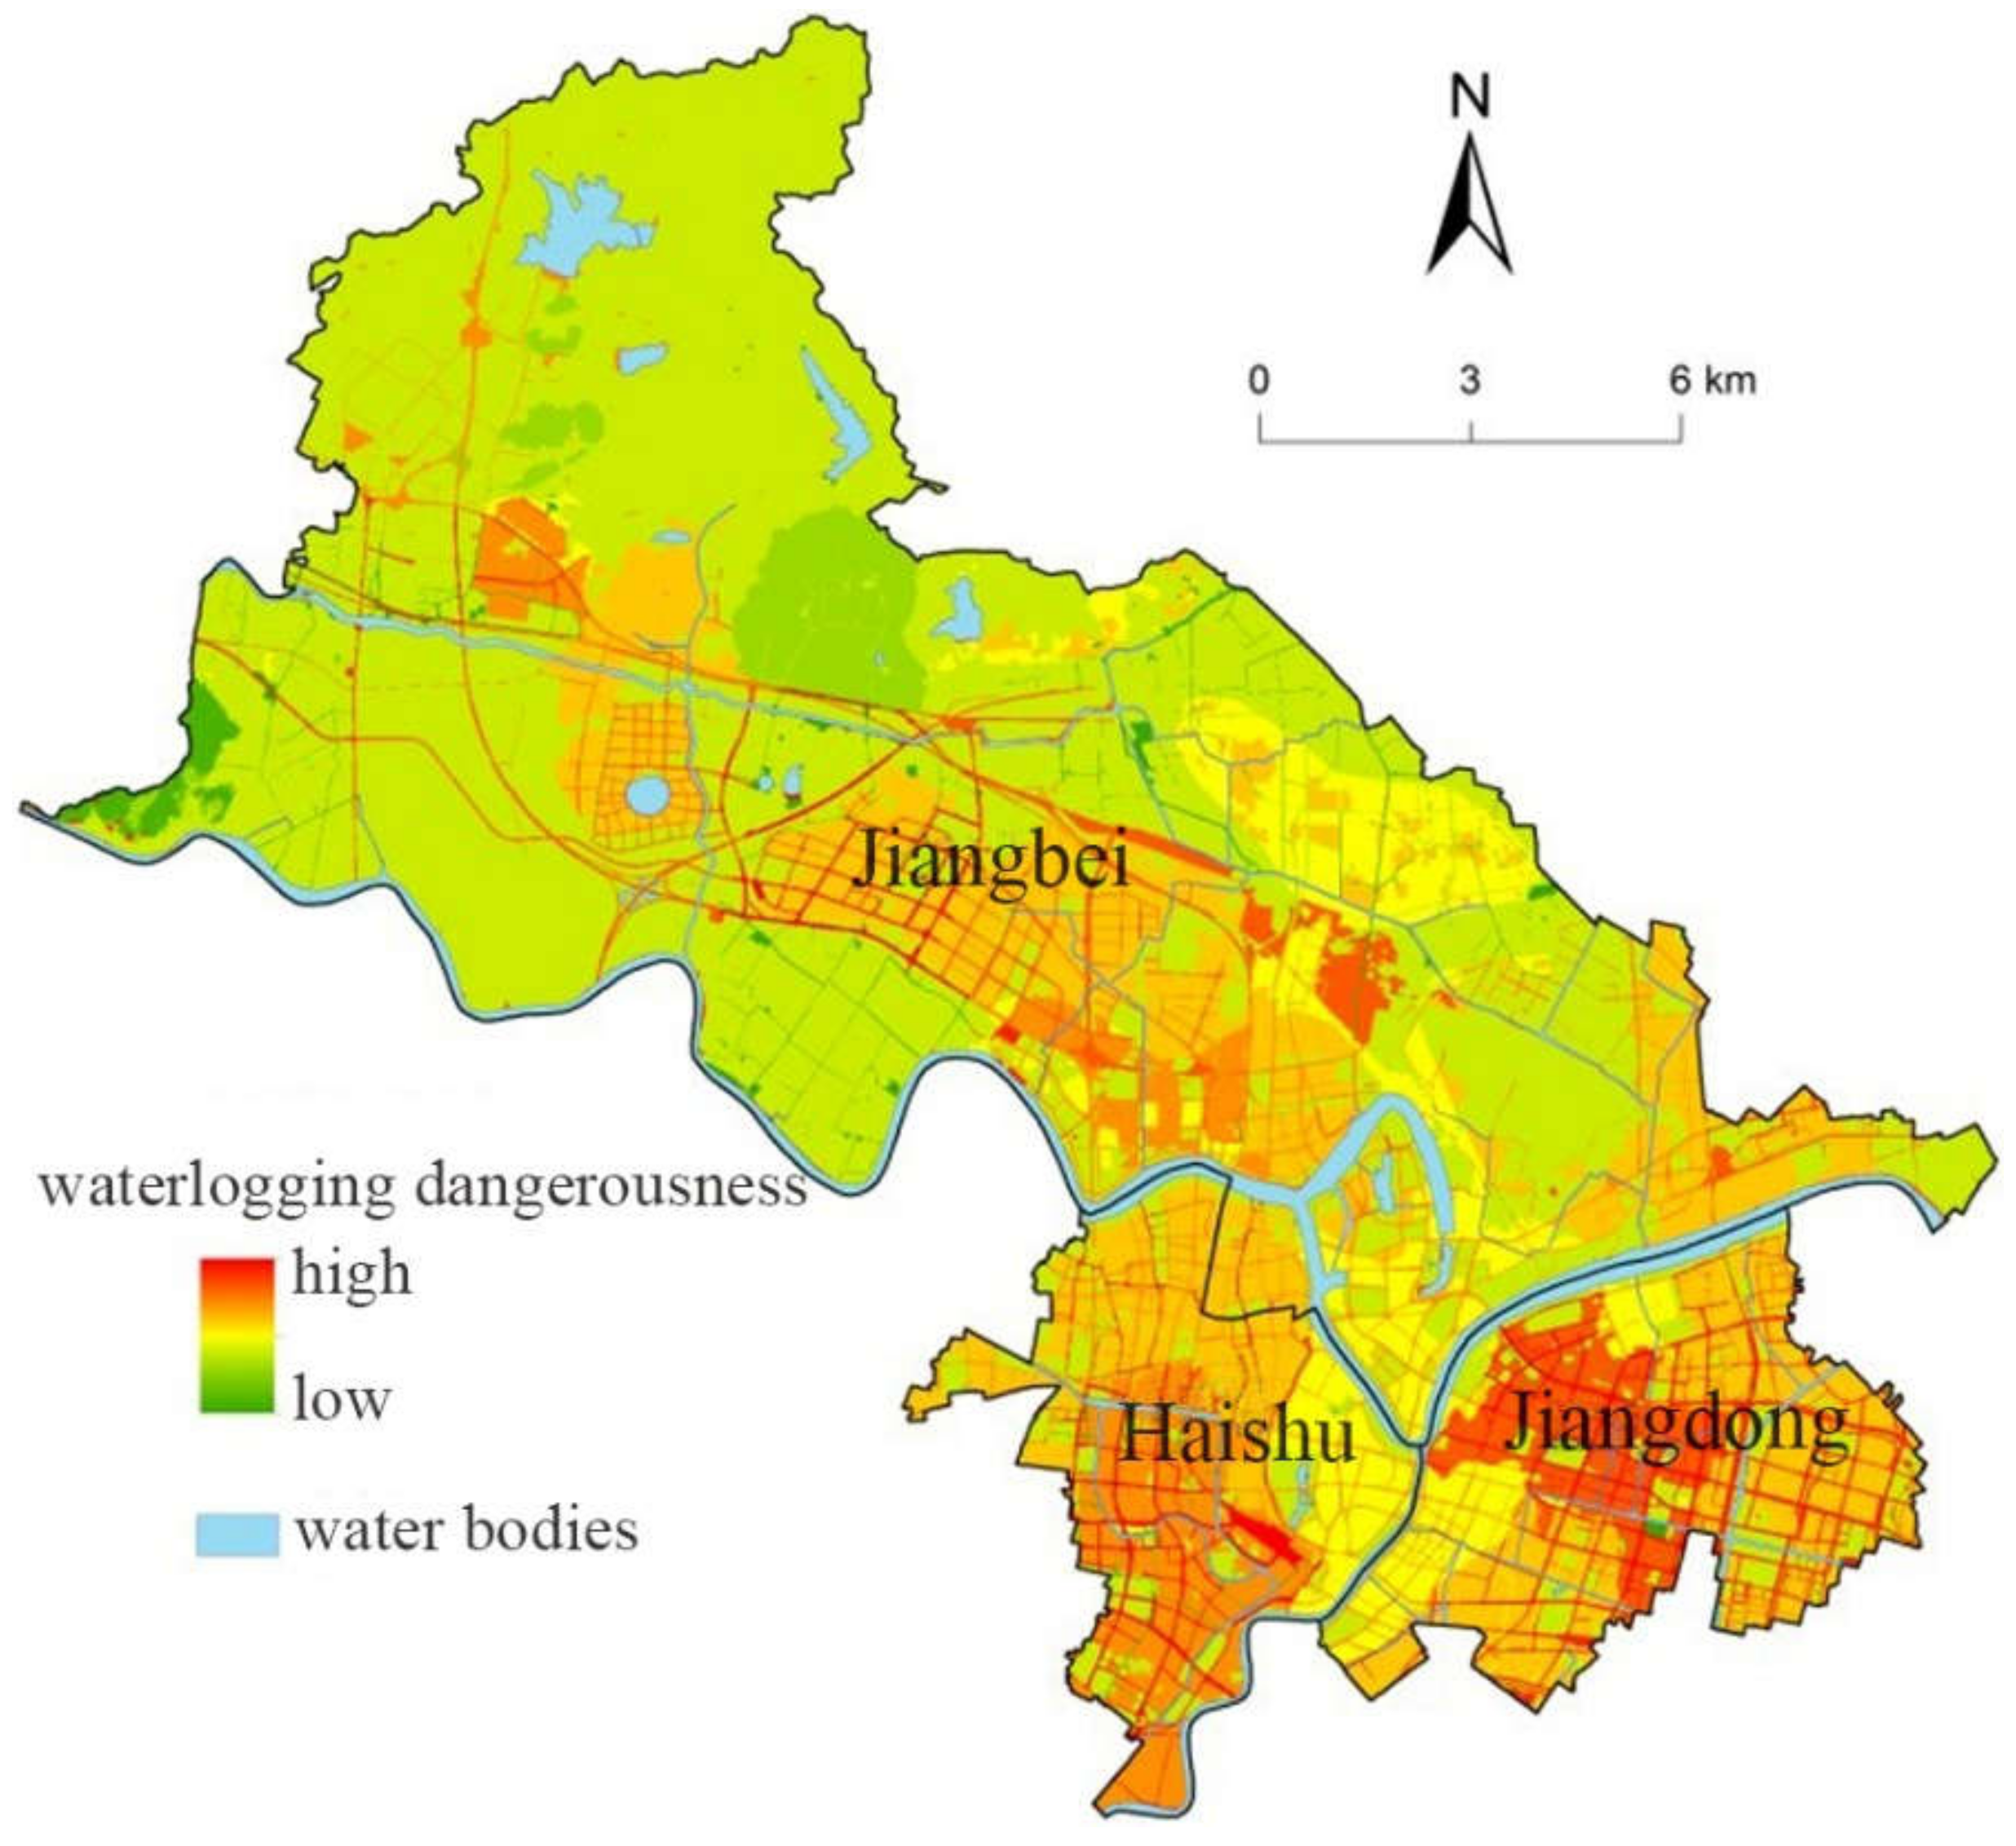
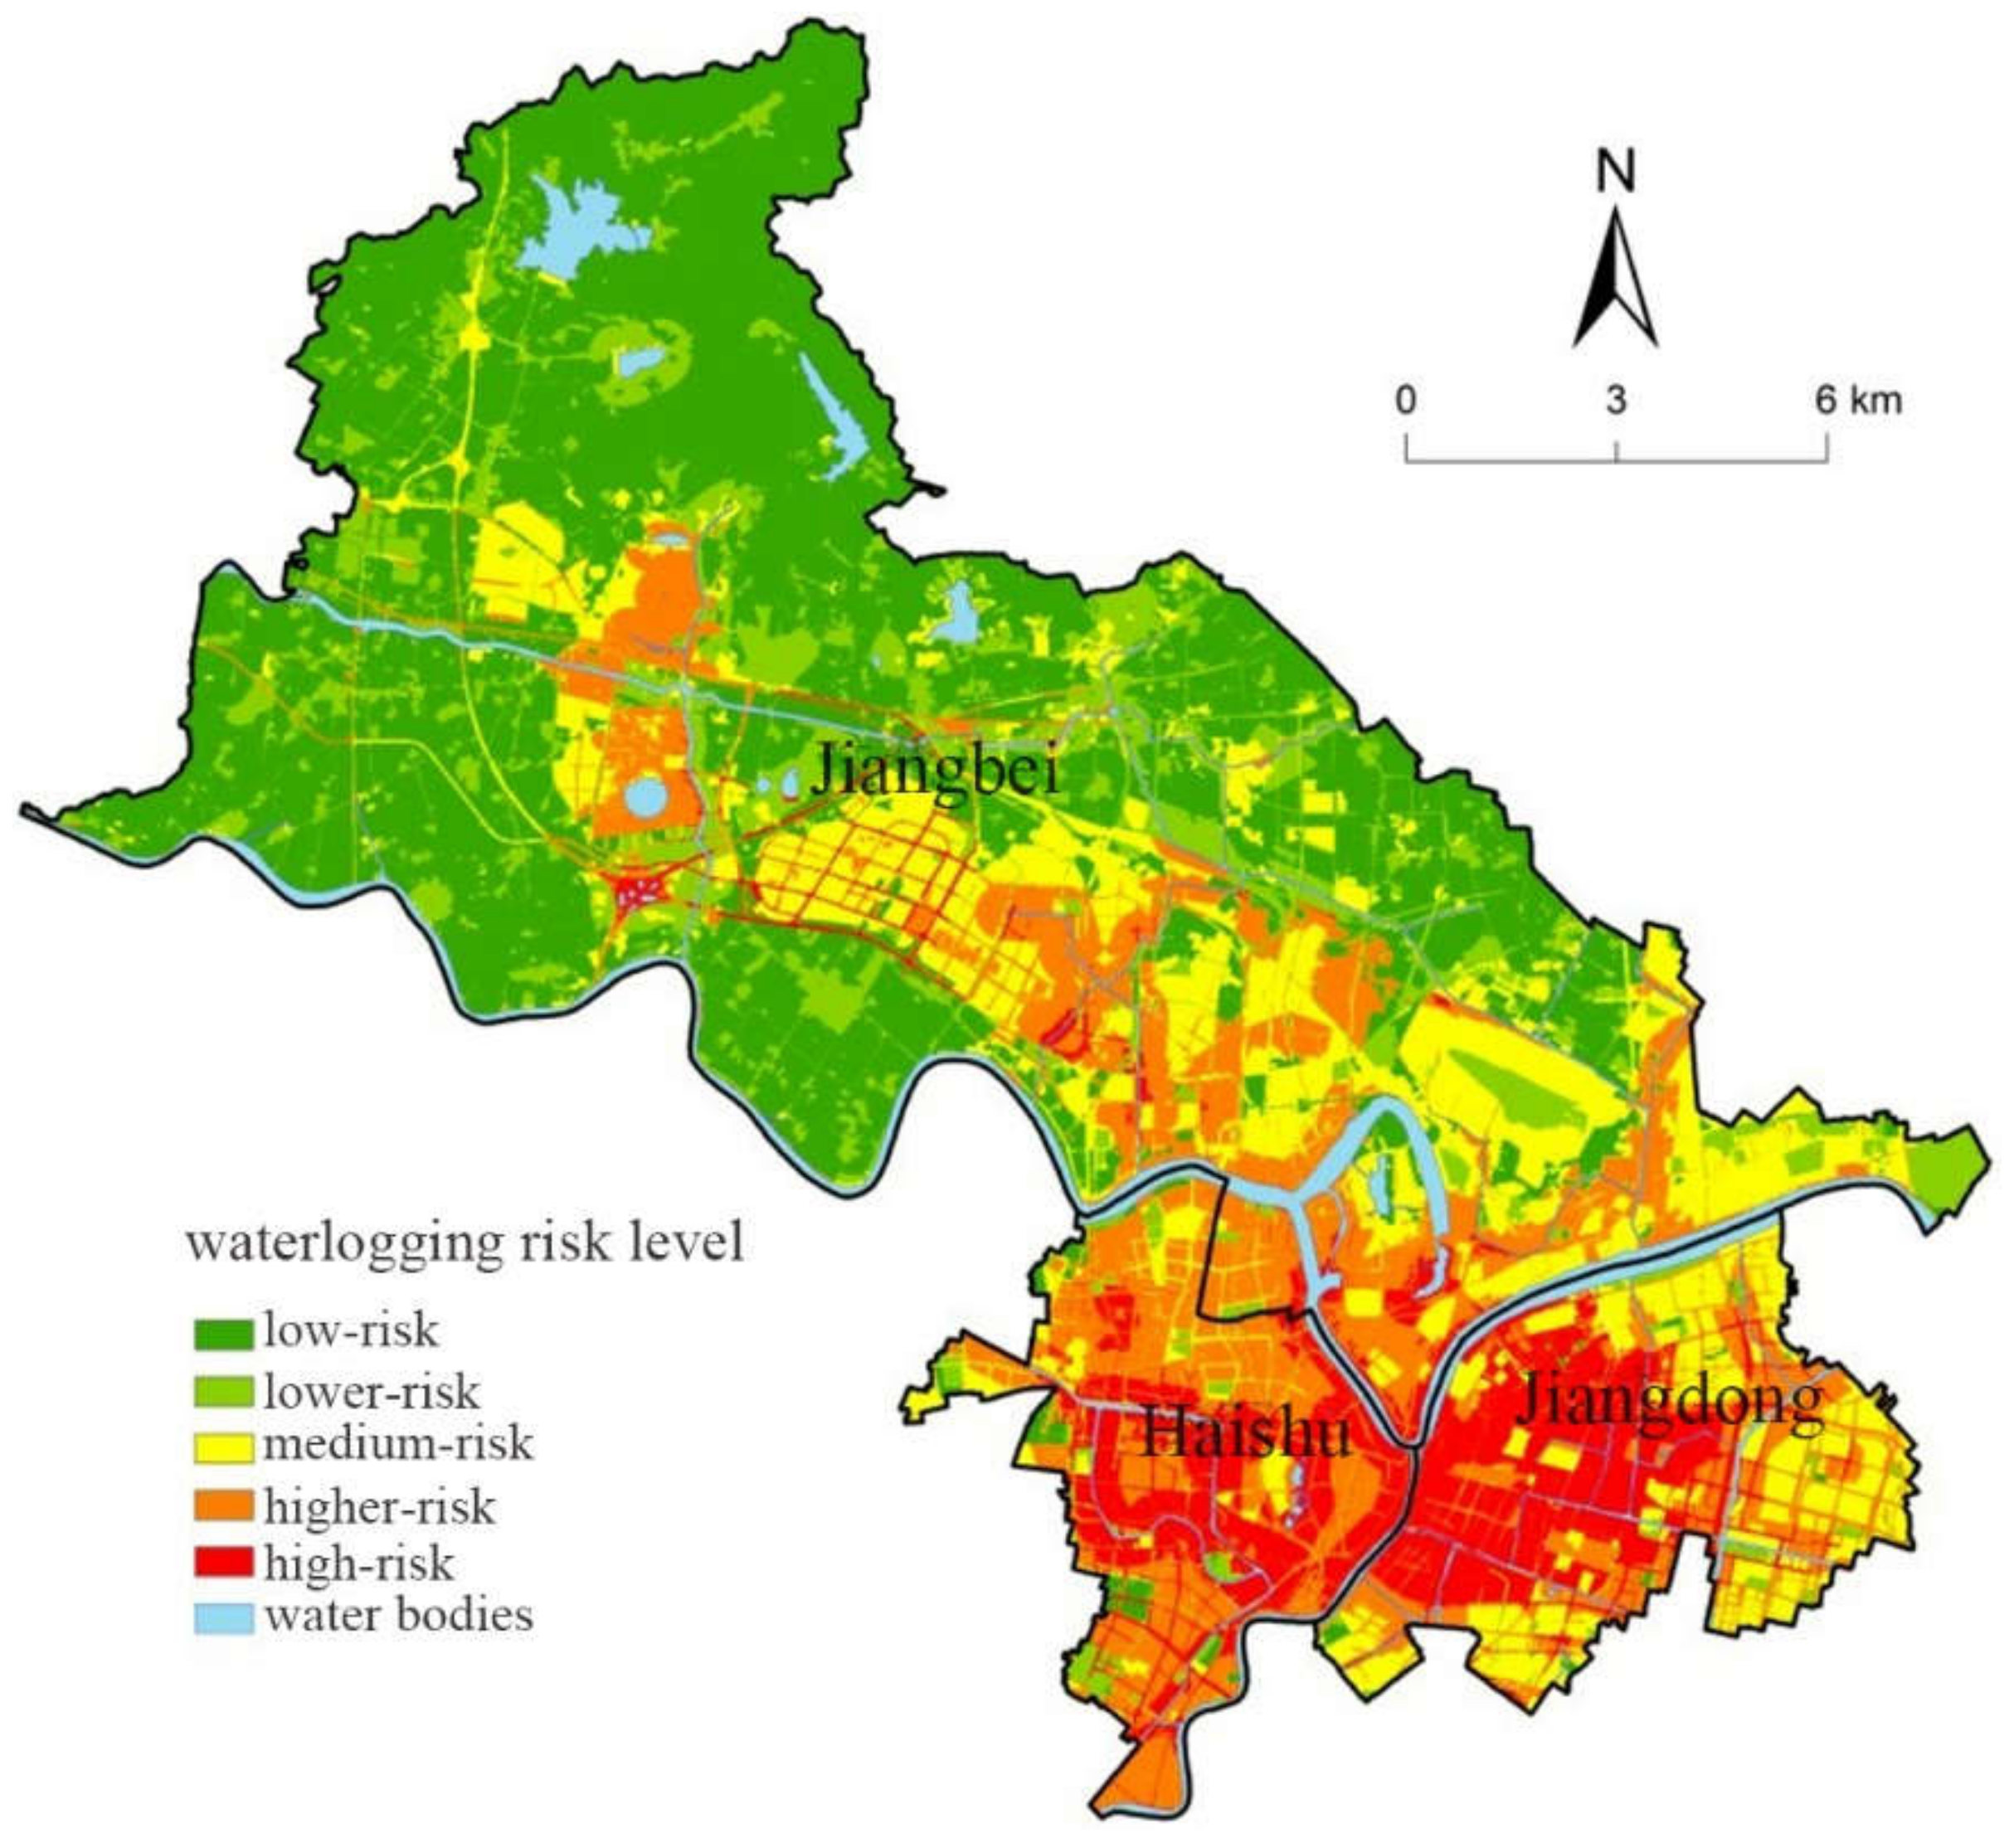
- By considering the small watershed as the research unit, this study conducted the risk assessment of city proper of Ningbo with different grades of waterlogging by combining with the SCS-CN model and superimposing the risk assessment map. The results show that the low-risk areas were mainly located in Jiangbei district, and the high-risk areas were mainly located in the middle of Jiangdong district and the southern part of Haishu district. The dangerousness for waterlogging factors in the city proper was mainly low.
- (2)
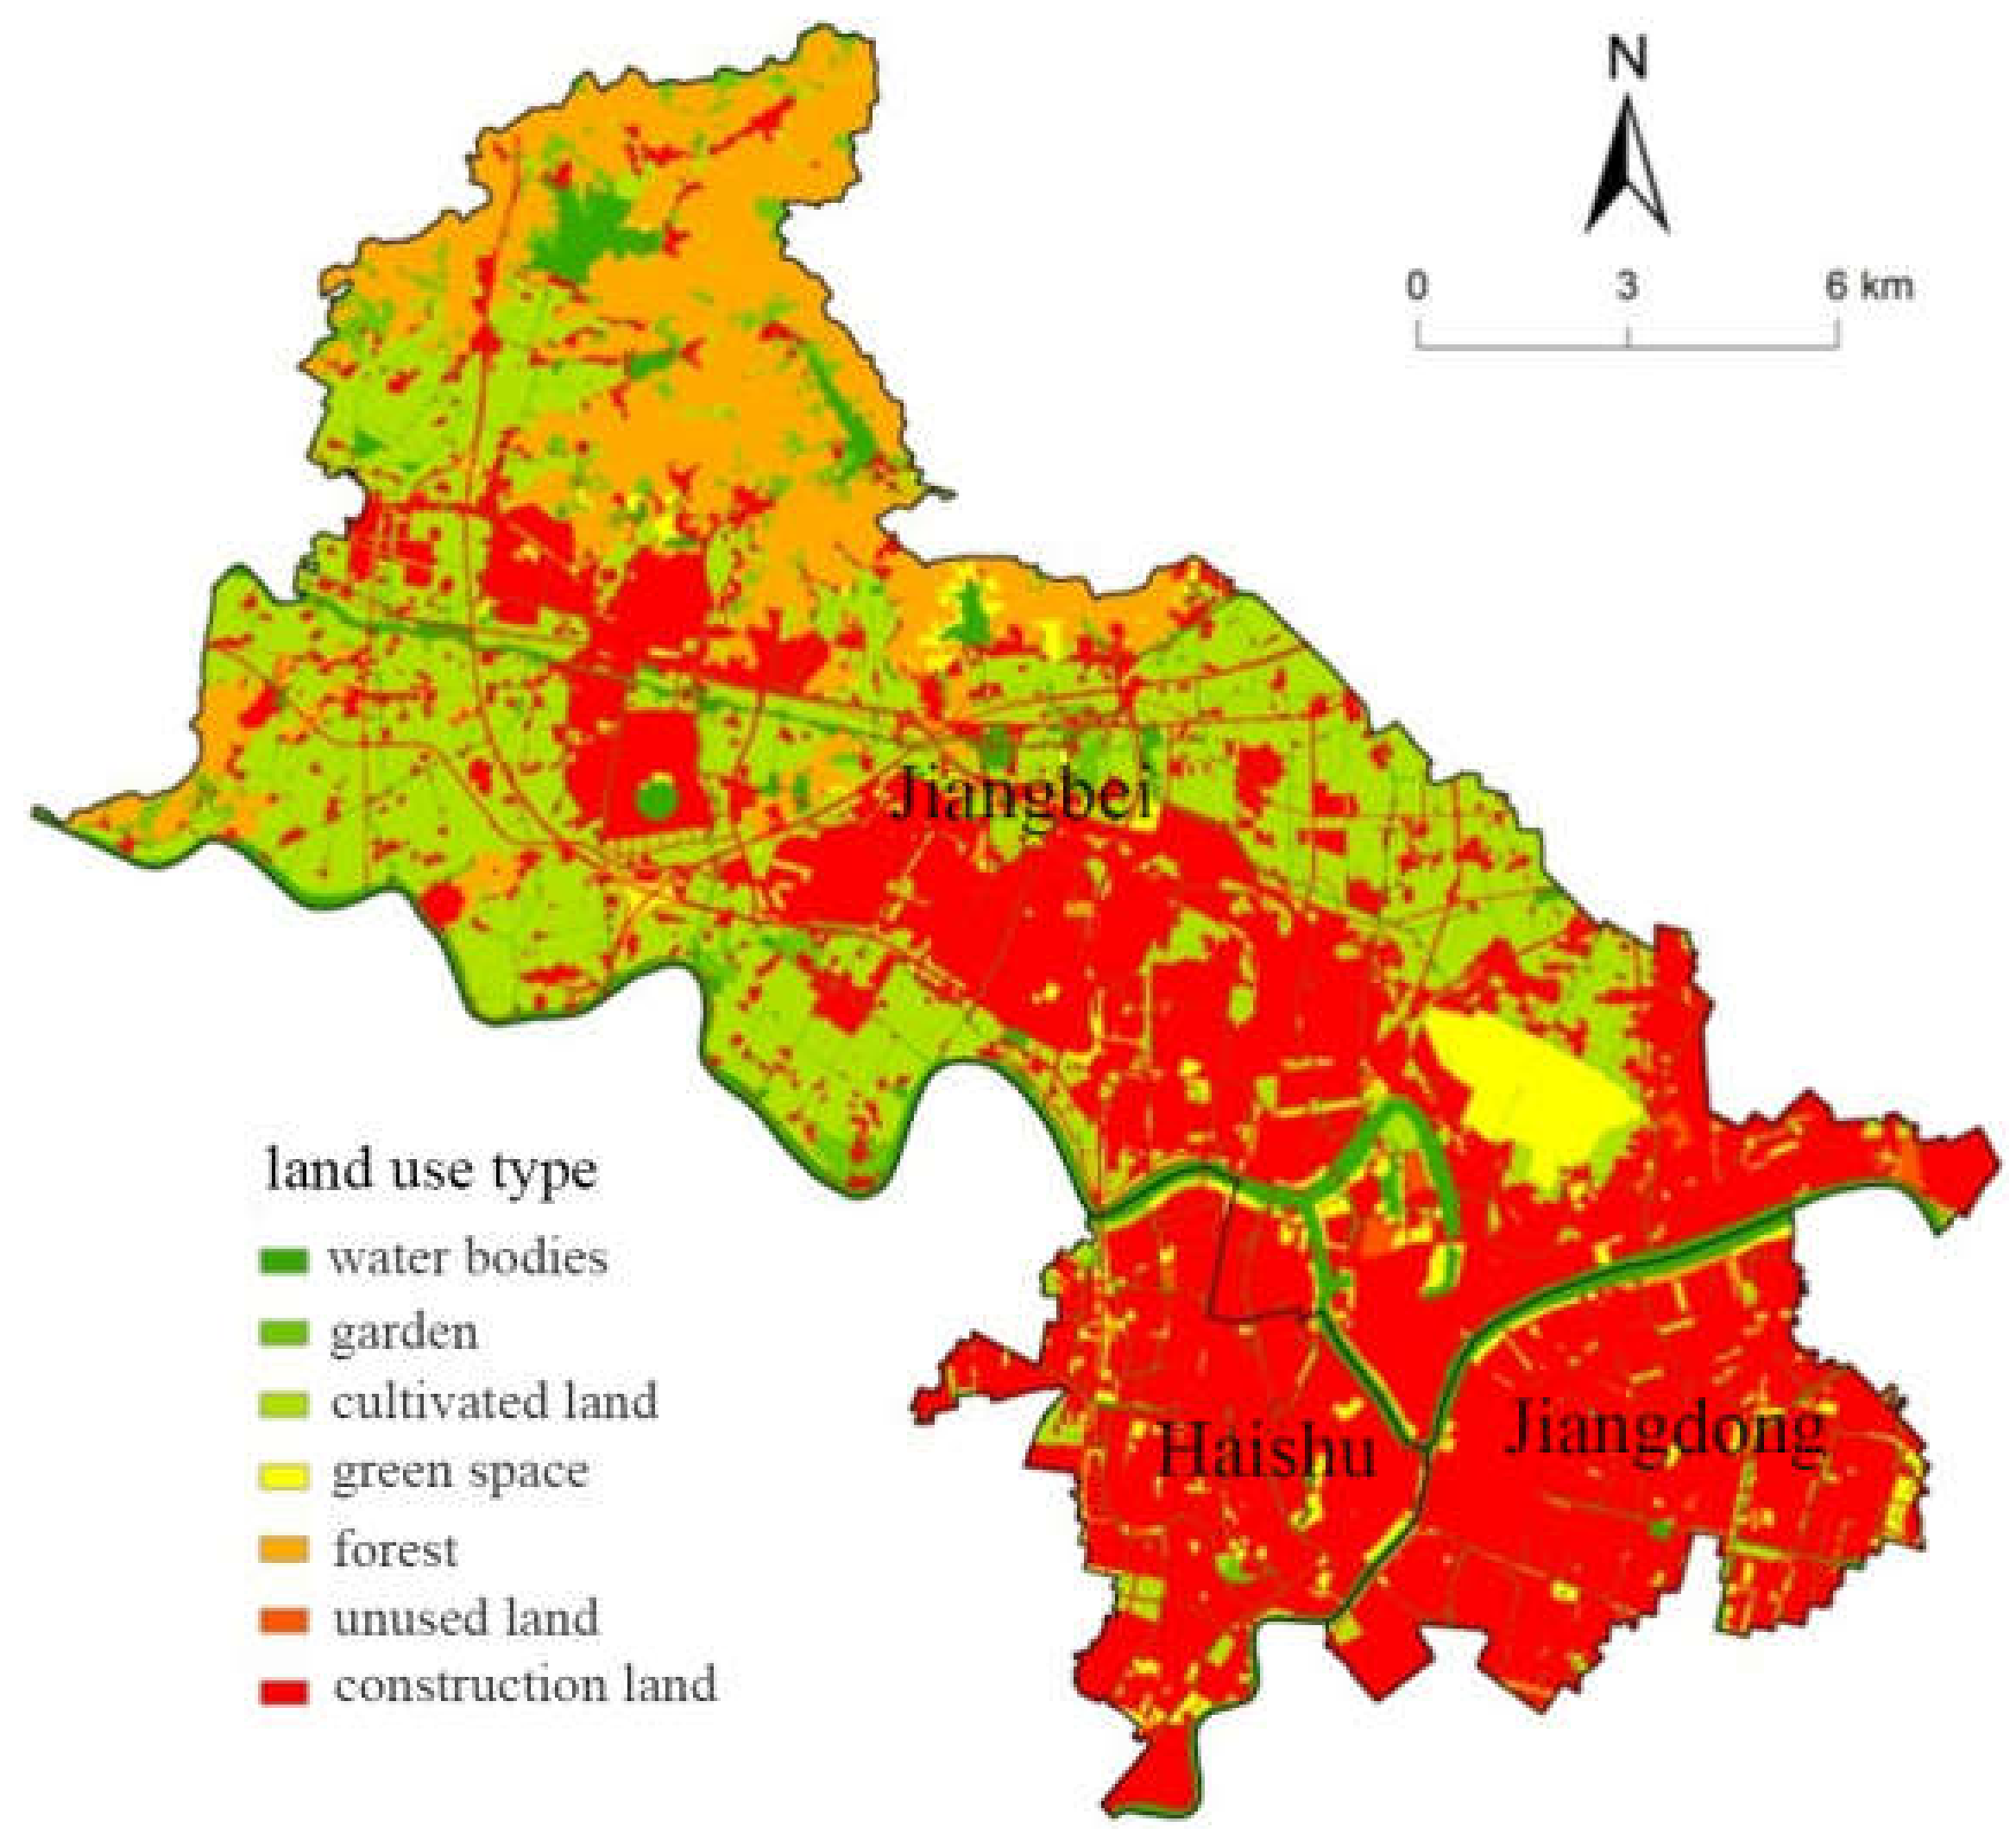
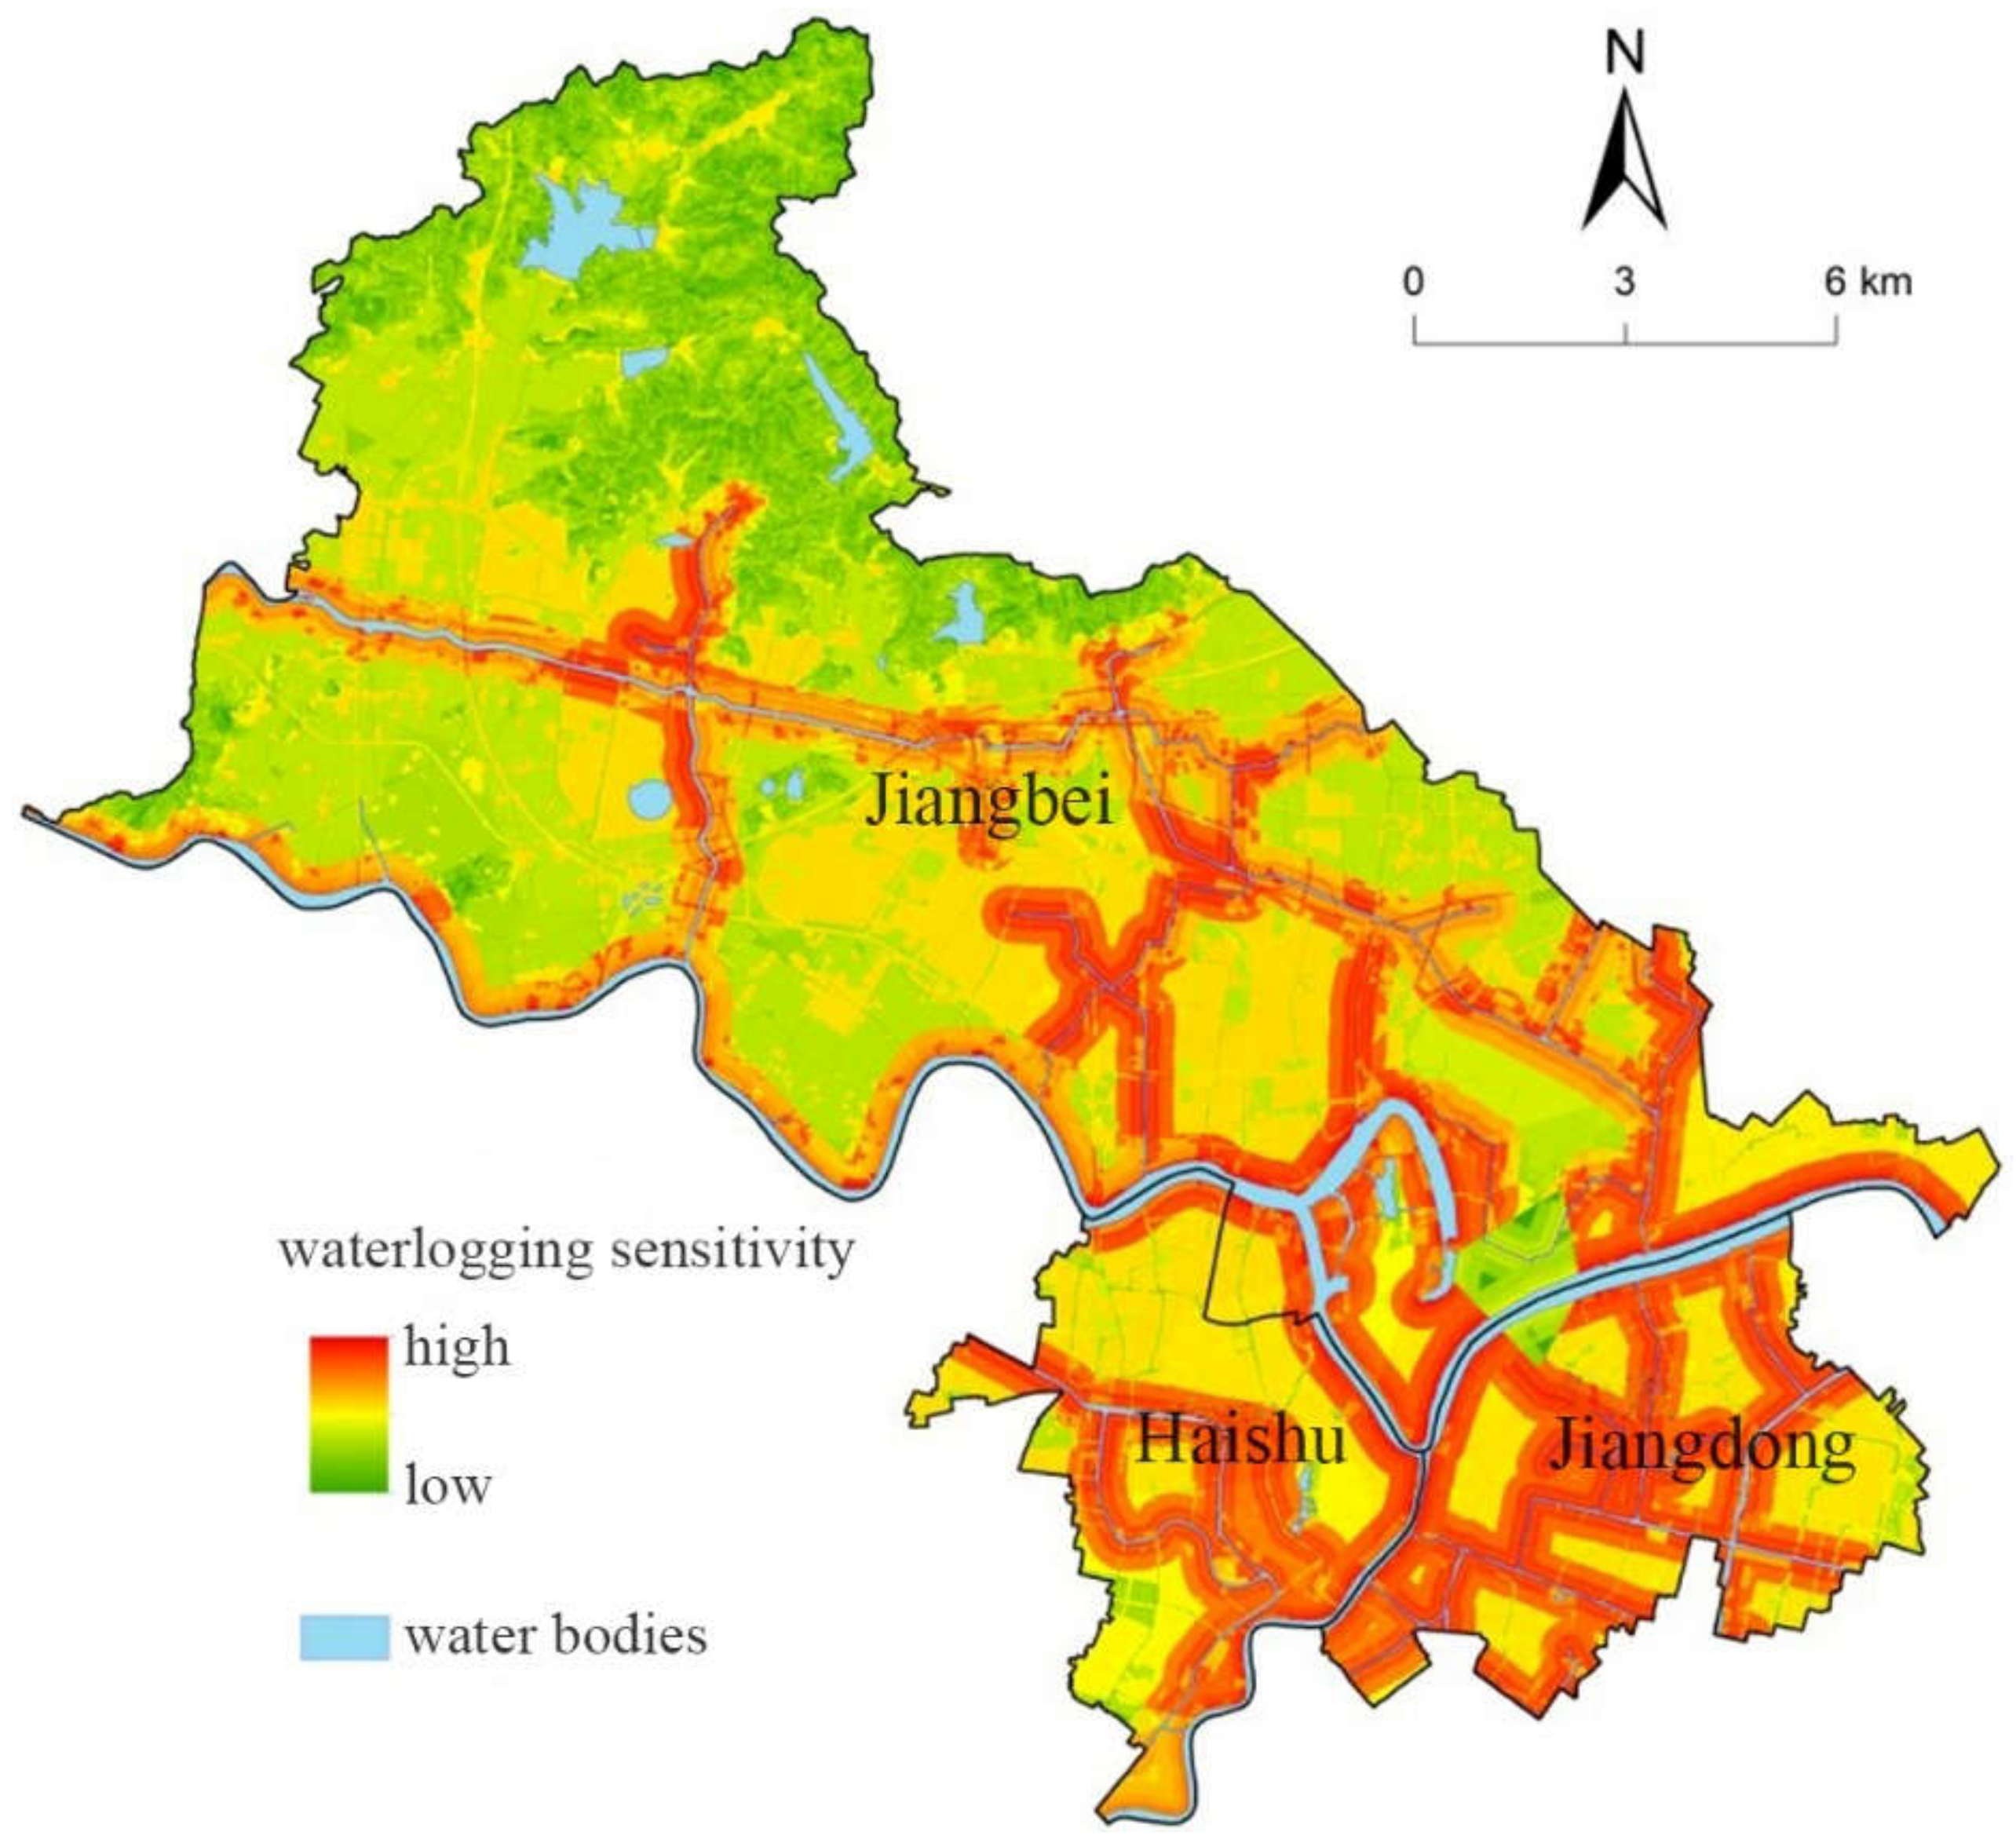
- On the basis of the weight coefficients, this study superimposed the secondary index layer of disaster-prone environment sensitivity to obtain the assessment map of disaster-prone environment sensitivity in the city proper of Ningbo. The results show that the areas with low sensitivity were mainly located in the northern part of Jiangbei district, and the areas with medium-high sensitivity were located in the southern part of the city proper. The distribution of the highly sensitive area was largely affected by the river networks because the type of land cover affects the distribution pattern of urban waterlogging sensitivity.
- (3)
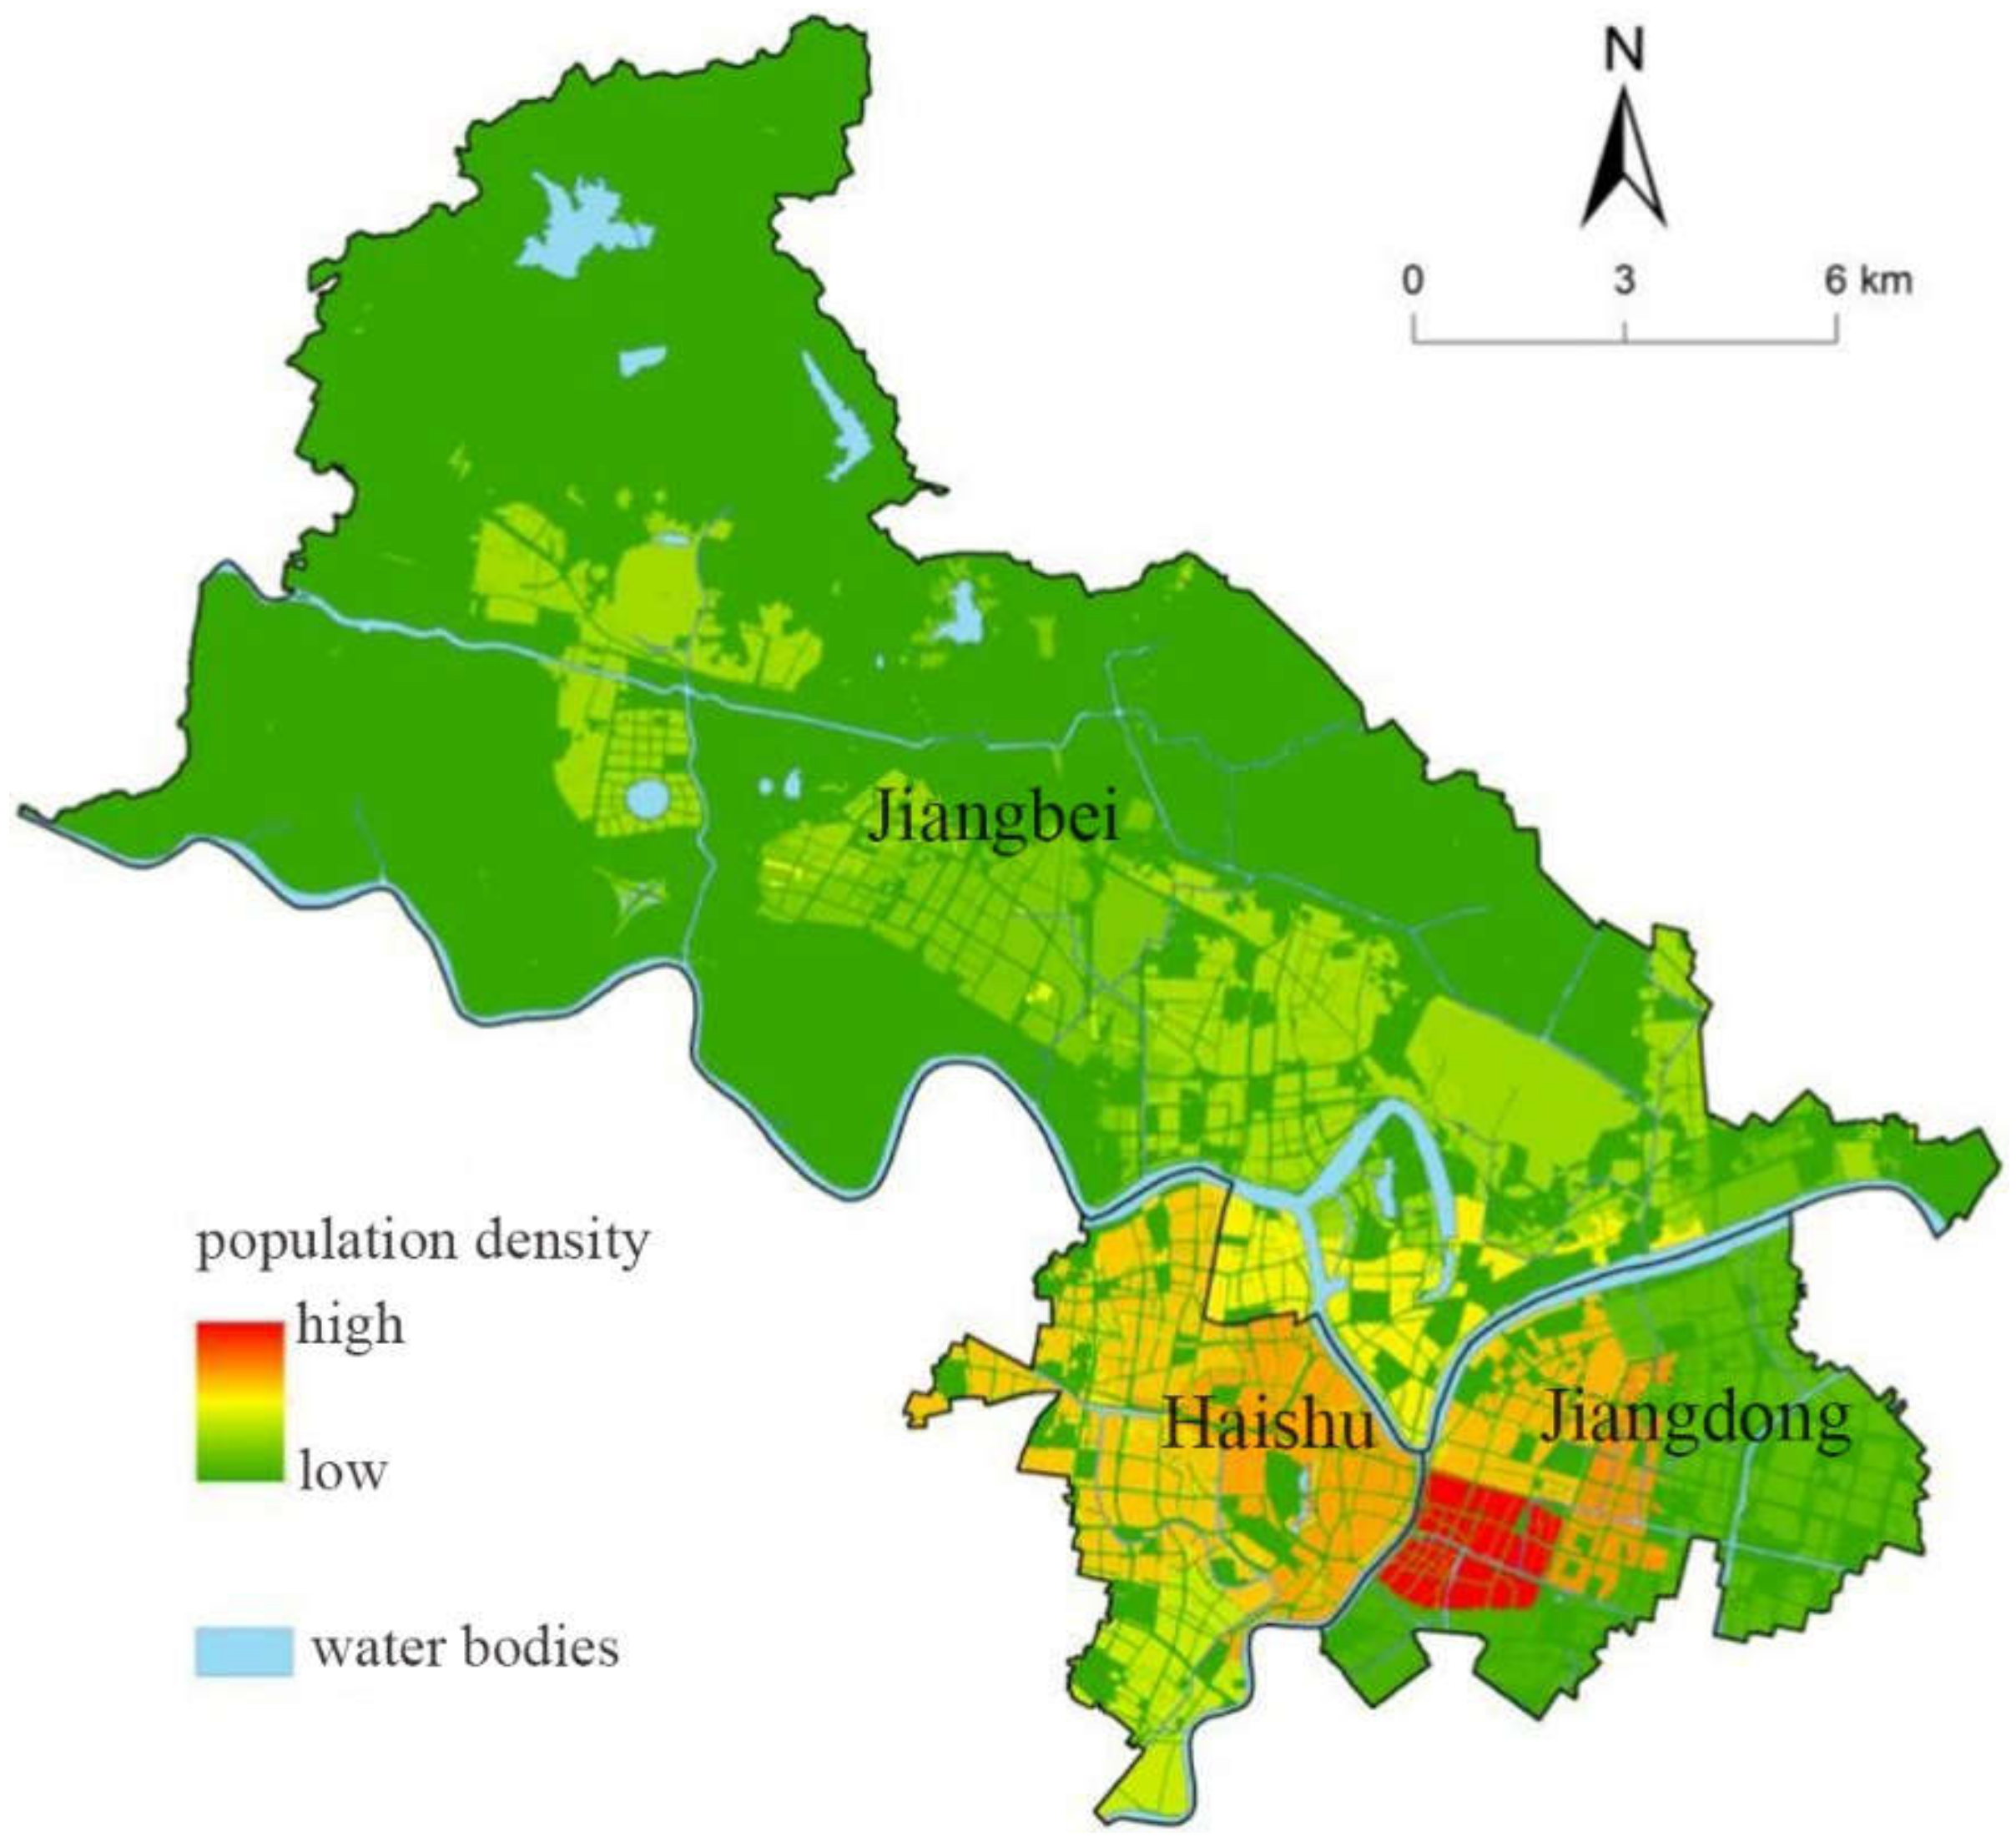
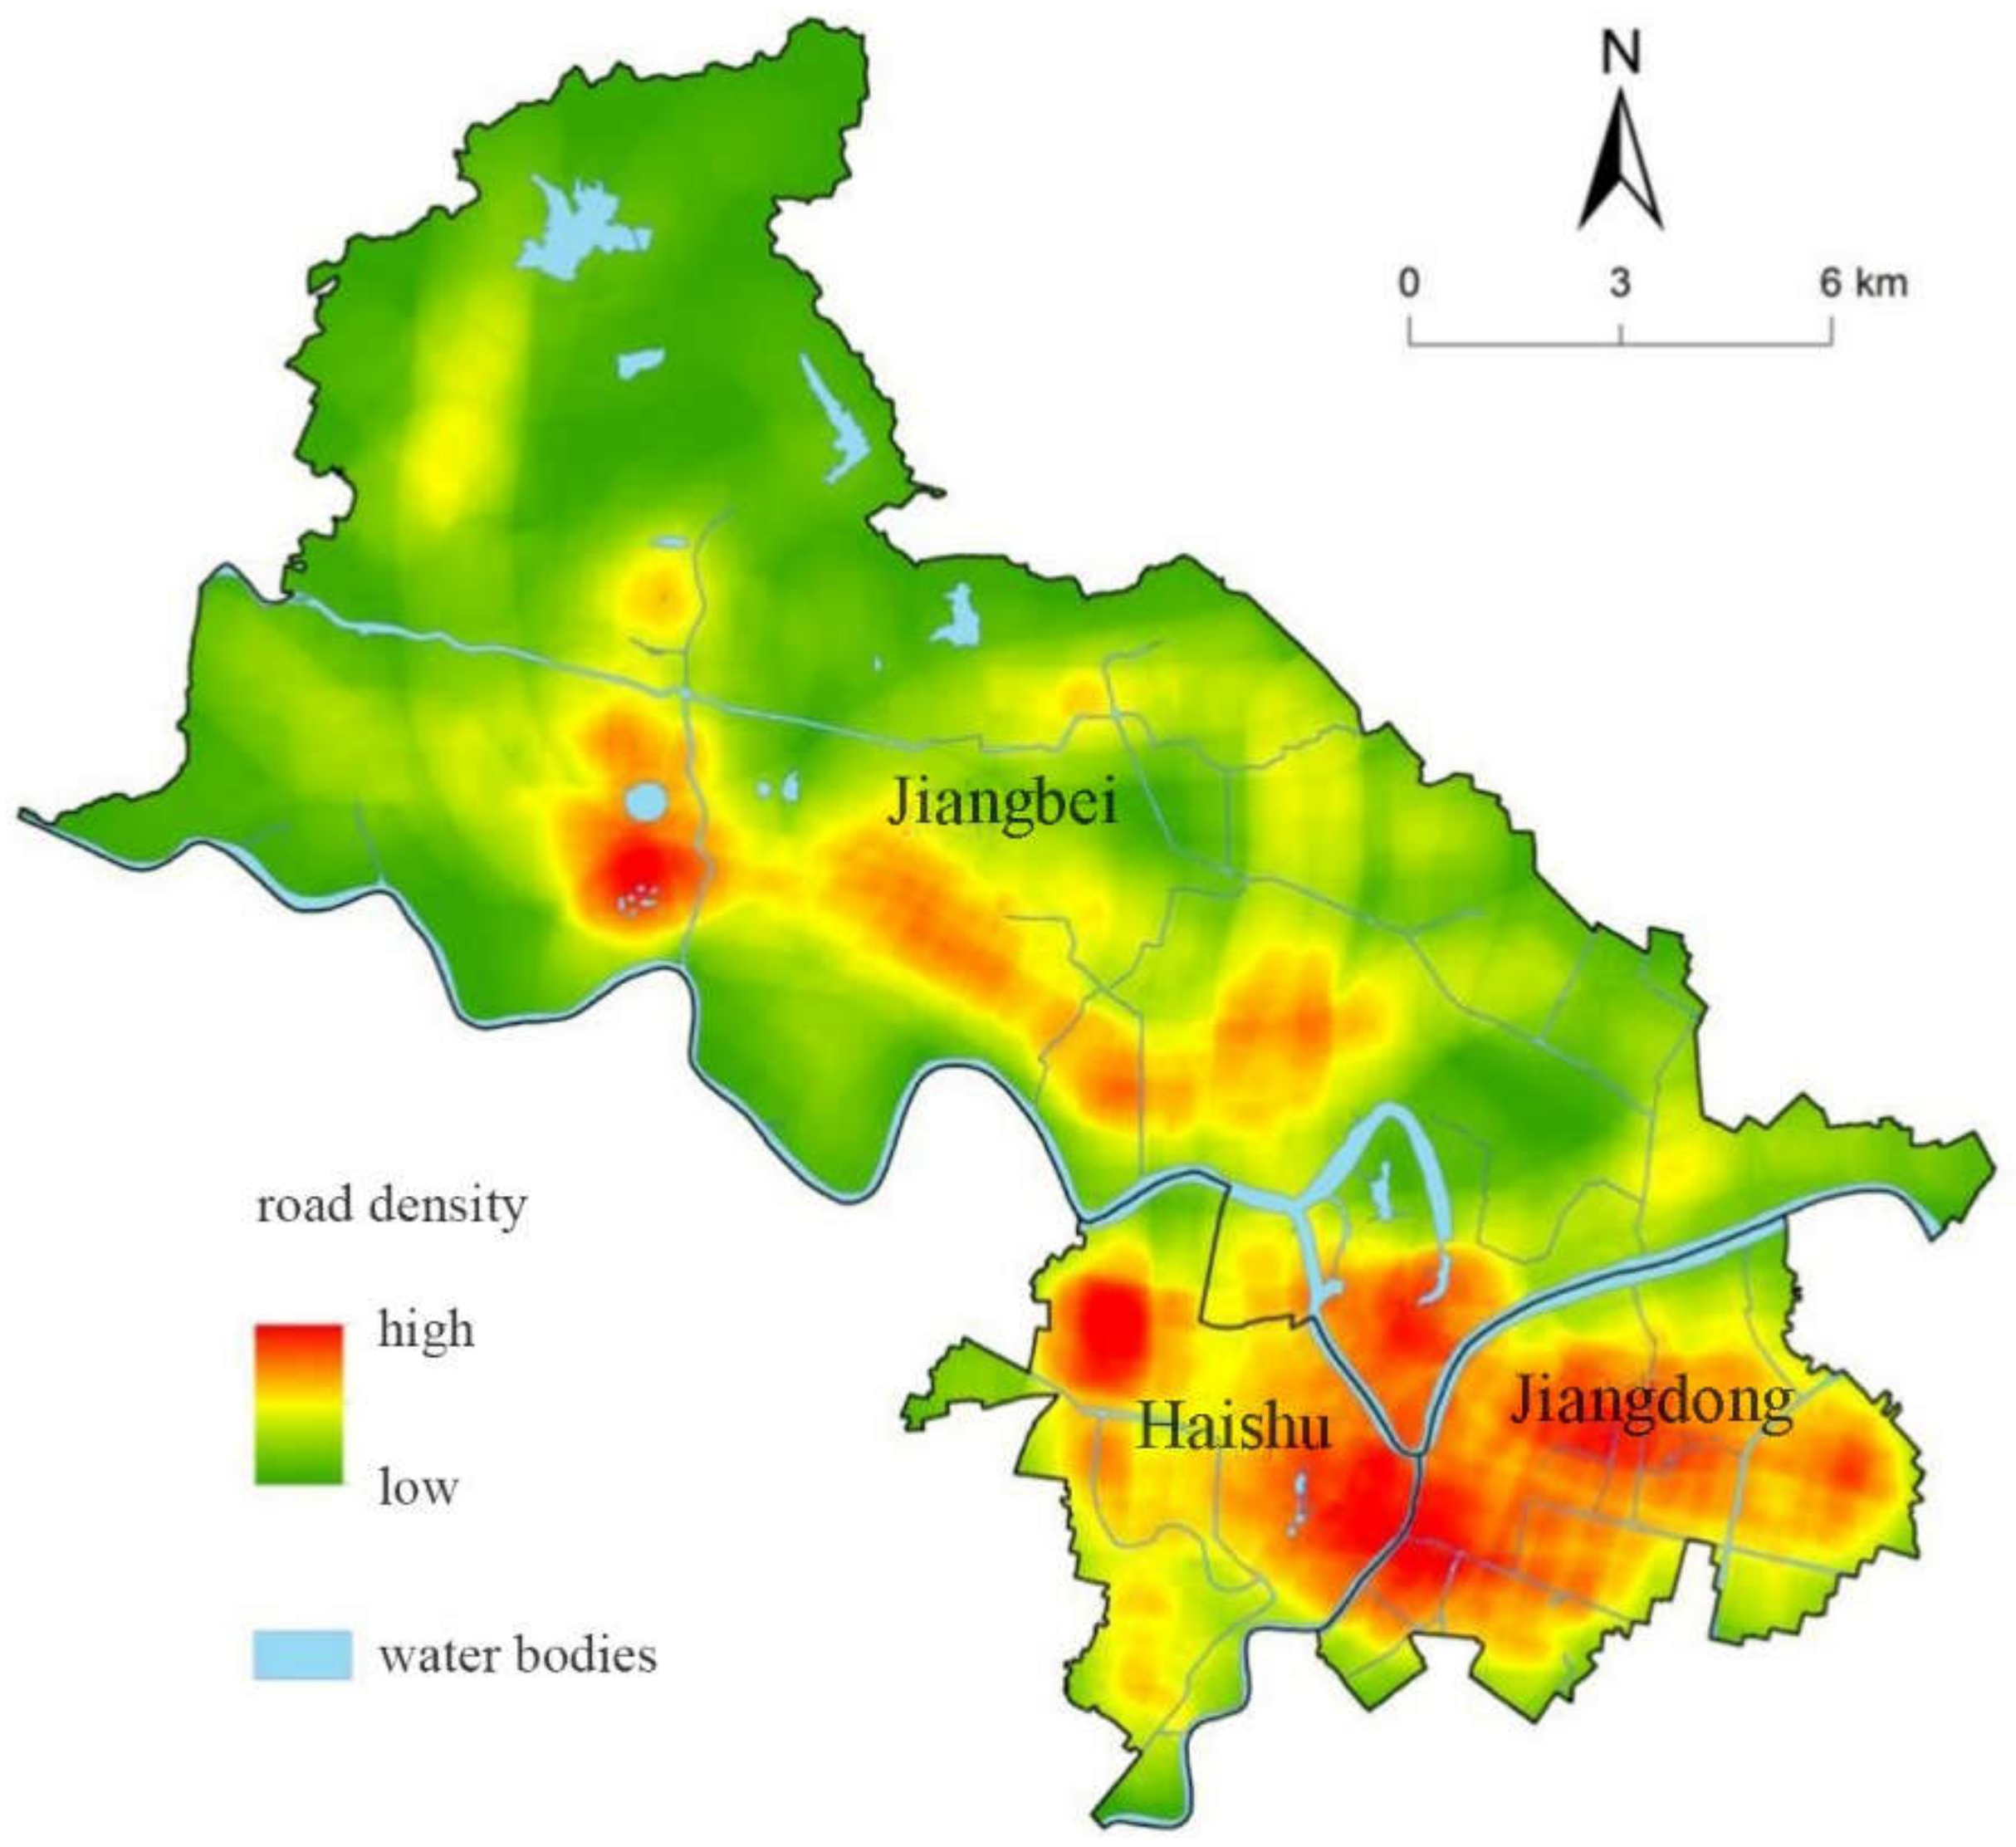
- On the basis of the weight coefficients, this study obtained the assessment map of waterlogging vulnerability in the city proper of Ningbo by overlaying the population density and road density layers. The results showed that the areas with low vulnerability were mainly located in Jiangbei district; the areas with high vulnerability were mainly located at the intersection of three rivers, namely, Jiangdong district, Haishu district, and Jiangbei district; and small parts of this area was located in Wangchun street, Haishu district.
- (4)
- On the basis of the weight coefficients, this study obtained the waterlogging risk assessment map in the city proper of Ningbo by overlaying three first-level index layers. The results showed that the low-risk area was mainly located in the northern part of Jiangbei district, the higher-risk area was mainly located in Haishu district, with small parts located in the middle of Jiangbei district, and the high-risk areas were mainly concentrated in the west of Jiangdong district and the middle of Haishu district. In general, the eastern part of Jiangdong district and Haishu district of Ningbo were areas with a high incidence of waterlogging.
6. Conclusions
Author Contributions
Funding
Data Availability Statement
Conflicts of Interest
Abbreviations
| ILLUDAS | Illinois Urban Drainage Area Simulator |
| SRM | Snowmelt–Runoff Model |
| SWMM | Storm Water Management Model |
| GDP | Gross Domestic Product |
| DEM | Digital Elevation Model |
| SCS-CN | Soil Conservation Service Curve Number |
| AHP | Analytic Hierarchy Process |
References
- Jenkins, K.; Surminski, S.; Hall, J.; Crick, F. Assessing surface water flood risk and management strategies under future climate change: Insights from an Agent-Based Model. Sci. Total Environ. 2017, 595, 159–168. [Google Scholar] [CrossRef]
- Gupta, V.; Jain, M.K. Impact of ENSO, global warming, and land surface elevation on extreme precipitation in India. J. Hydrol. Eng. 2020, 25, 05019032. [Google Scholar] [CrossRef]
- Wang, Y.J.; Gao, C.; Zhai, J.Q.; Li, X.C.; Su, B.D.; Hartmann, H. Spatio-temporal changes of exposure and vulnerability to floods in China. Adv. Clim. Chang. Res. 2014, 5, 197–205. [Google Scholar] [CrossRef]
- Menéndez, M.; Woodworth, P.L. Changes in extreme high water levels based on a quasi-global tide-gauge data set. J. Geophys. Res. Ocean. 2010, 115. [Google Scholar] [CrossRef]
- Xia, J.; Zhang, Y.Y.; Xiong, L.H.; He, S.; Wang, L.F.; Yu, Z.B. Opportunities and challenges of the Sponge City construction related to urban water issues in China. Sci. China Earth Sci. 2017, 60, 652–658. [Google Scholar] [CrossRef]
- Ministry of Water Resources of the People’s Republic of China. China Flood and Drought Disaster Bulletin 2018; China Water Resources Press: Beijing, China, 2019; pp. 15–32. (In Chinese)
- Alderman, K.; Turner, L.R.; Tong, S. Floods and human health: A systematic review. Environ. Int. 2012, 47, 37–47. [Google Scholar] [CrossRef]
- Ministry of Housing and Urban-Rural Development of The People’s Republic of China. Code for Design of Outdoor Wastewater Engineering 2011; Ministry of Housing and Urban-Rural Development of the People’s Republic of China (MOHURD): Beijing, China; General Administration of Quality Supervision, Inspection and Quarantine of the People’s Republic of China: Beijing, China, 2011. (In Chinese)
- Zhang, Q.; Wu, Z.; Zhang, H.; Fontana, G.D.; Tarolli, P. Identifying dominant factors of waterlogging events in metropolitan coastal cities: The case study of Guangzhou, China. J. Environ. Manag. 2020, 271, 110951. [Google Scholar] [CrossRef]
- Zhang, H.; Cheng, J.; Wu, Z.; Cheng, L.; Qin, J.; Liu, T. Effects of impervious surface on the spatial distribution of urban waterlogging risk spots at multiple scales in Guangzhou, South China. Sustainability 2018, 10, 1589. [Google Scholar] [CrossRef]
- Yu, H.; Zhao, Y.; Fu, Y.; Li, L. Spatiotemporal Variance Assessment of Urban Rainstorm Waterlogging Affected by Impervious Surface Expansion: A Case Study of Guangzhou, China. Sustainability 2018, 10, 3761. [Google Scholar] [CrossRef]
- Quan, R.S.; Liu, M.; Lu, M.; Zhang, L.J.; Wang, J.J.; Xu, S.Y. Waterlogging risk assessment based on land use/cover change: A case study in Pudong New Area, Shanghai. Environ. Earth Sci. 2010, 61, 1113–1121. [Google Scholar] [CrossRef]
- Eagleson, P.S. Dnamic Hydrology; Mc Graw-Hill Book Company: New York, NY, USA, 1970. [Google Scholar]
- Keifei, C.J.; Huang, C.Y.; Wolka, K. Modified Chicago Hydrograph method, Storm Sewer Design; University of Illionis: Chicago, IL, USA, 1978. [Google Scholar]
- USDA-SCS. Hydrology. In National Engineering Handbook; Section 4; Soil Conservation Service, US Department of Agriculture: Washington, DC, USA, 1985. [Google Scholar]
- Rauch, W.; Bertrand-Krajewski, J.L.; Krebs, P.; Mark, O.; Schilling, W.; Schütze, M.; Vanrolleghem, P.A. Deterministic modelling of integrated urban drainage systems. Water Sci. Technol. 2002, 45, 81–94. [Google Scholar] [CrossRef] [PubMed]
- Salarpour, M.; Rahman, N.A.; Yusop, Z. Simulation of flood extent mapping by InfoWorks RS-Case study for tropical catchment. J. Softw. Eng. 2011, 5, 127–135. [Google Scholar] [CrossRef]
- Scofield, R.A. The NESDIS operational convective precipitation-estimation technique. Mon. Weather Rev. 1987, 115, 1773–1793. [Google Scholar] [CrossRef]
- Bisht, D.S.; Chatterjee, C.; Kalakoti, S.; Upadhyay, P.; Sahoo, M.; Panda, A. Modeling urban floods and drainage using SWMM and MIKE URBAN: A case study. Nat. Hazards 2016, 84, 749–776. [Google Scholar] [CrossRef]
- Xu, S.Y.; Wang, J.; Shi, C. Research of the natural disaster risk on coastal cities. Acta Geogr. Sin. 2006, 61, 127–138. (In Chinese) [Google Scholar]
- Peng, Y. A comparison of two approaches to develop concentrated rural settlements after the 5.12 Sichuan Earthquake in China. Habitat Int. 2015, 49, 230–242. [Google Scholar] [CrossRef]
- Peng, Y.; Zhu, X.T.; Zhang, F.Y.; Huang, L.; Xue, J.B.; Xu, Y.L. Farmers’ risk perception of concentrated rural settlement development after the 5.12 Sichuan Earthquake. Habitat Int. 2018, 71, 169–176. [Google Scholar] [CrossRef]
- Cui, P.; Li, D.Z. Measuring the disaster resilience of an urban community using ANP-FCE method from the perspective of capitals. Soc. Sci. Q. 2019, 100, 2059–2077. [Google Scholar] [CrossRef]
- Shi, Y. Risk analysis of rainstorm waterlogging on residences in Shanghai based on scenario simulation. Nat. Hazards 2012, 62, 677–689. [Google Scholar] [CrossRef]
- Quan, R.S.; Zhang, L.J.; Liu, M.; Lu, M.; Wang, J.J.; Niu, H.Y. Risk assessment of rainstorm waterlogging on subway in central urban area of Shanghai, China based on scenario simulation. In Proceedings of the 19th International Conference on Geoinformatics, Shanghai, China, 24–26 June 2011; pp. 1–6. [Google Scholar]
- Huang, H.B.; Chen, X.; Zhu, Z.Q.; Xie, Y.H.; Liu, L.; Wang, X.W.; Wang, X.; Liu, K. The changing pattern of urban flooding in Guangzhou, China. Sci. Total Environ. 2018, 622, 394–401. [Google Scholar] [CrossRef]
- Wang, X.N.; Wang, X.W.; Zhai, J.Q.; Li, X.C.; Huang, H.B.; Li, C.M.; Zheng, J.; Sun, H.Y. Improvement to flooding risk assessment of storm surges by residual interpolation in the coastal areas of Guangdong Province, China. Quat. Int. 2017, 453, 1–14. [Google Scholar] [CrossRef]
- Zhang, J.Y.; Chen, Y.B. Risk assessment of flood disaster induced by typhoon rainstorms in Guangdong province, China. Sustainability 2019, 11, 2738. [Google Scholar] [CrossRef]
- Zhang, H.P.; Cheng, X.W.; Jin, L.; Zhao, D.; Feng, T.J.; Zheng, K. A Method for Estimating Urban Flood-Carrying Capacity Using the VIS-W Underlying Surface Model: A Case Study from Wuhan, China. Water 2019, 11, 2345. [Google Scholar] [CrossRef]
- Liu, Q.; Yang, H.M.; Liu, M.; Sun, R.; Zhang, J.H. An Integrated Flood Risk Assessment Model for Cities Located in the Transitional Zone between Taihang Mountains and North China Plain: A Case Study in Shijiazhuang, Hebei, China. Atmosphere 2019, 10, 104. [Google Scholar] [CrossRef]
- Wu, Z.N.; Shen, Y.X.; Wang, H.L. Assessing urban areas’ vulnerability to flood disaster based on text data: A case study in Zhengzhou city. Sustainability 2019, 11, 4548. [Google Scholar] [CrossRef]
- Su, B.N.; Huang, H.; Zhang, N. Dynamic urban waterlogging risk assessment method based on scenario simulations. J. Tsinghua Univ. (Sci. Technol.) 2015, 55, 684–690. (In Chinese) [Google Scholar]
- Huang, T.L.; Wang, Y.P. Assessment of Waterlogging Hazard in Tianhe District of Guangzhou City Using Remote Sensing and GIS. In Proceedings of the 19th International Conference on Geoinformatics, Shanghai, China, 24–26 June 2011. [Google Scholar]
- Pandey, A.C.; Singh, S.K.; Nathawat, M.S. Waterlogging and flood hazards vulnerability and risk assessment in Indo Gangetic plain. Nat. Hazards 2010, 55, 273–289. [Google Scholar] [CrossRef]
- Gao, B.; Zhao, X.H.; Sun, X.; Peng, C.R. Study on risk assessment of urban waterlogging. In 2009 Third international symposium on intelligent information technology application. IEEE 2009, 3, 352–355. [Google Scholar]
- Schmitt, T.G.; Thomas, M.; Ettrich, N. Analysis and modeling of flooding in urban drainage systems. J. Hydrol. 2004, 299, 300–311. [Google Scholar] [CrossRef]
- Benito, G.; Lang, M.; Barriendos, M.; Llasat, M.C.; Francés, F.; Ouarda, T.; Thorndycraft, V.; Enzel, Y.; Bardossy, A.; Coeur, D.; et al. Use of systematic, palaeoflood and historical data for the improvement of flood risk estimation. Review of scientific methods. Nat. Hazards 2004, 31, 623–643. [Google Scholar]
- Kaźmierczak, A.; Cavan, G. Surface water flooding risk to urban communities: Analysis of vulnerability, hazard and exposure. Landsc. Urban Plan. 2011, 103, 185–197. [Google Scholar] [CrossRef]
- Zhang, M.S.; Tang, Y.M. Risk investigation method and practice of geohazards. Geol. Bull. China 2008, 27, 1205–1216. (In Chinese) [Google Scholar]
- Liu, Y.H.; Ge, Q.S.; Wu, W.X. Risk Management: Challenges of the New Century; China Meteorological Press: Beijing, China, 2005. (In Chinese) [Google Scholar]
- Xu, J.W.; Zhang, M.S.; Fan, W. An overview of geological disaster risk assessment. J. Catastrophology 2015, 30, 130–134. (in Chinese). [Google Scholar]
- Maskrey, A. Disaster Mitigation: A Community based Approach; Oxfam: Oxford, UK, 1989. [Google Scholar]
- United Nations Department of Humanitarian Affairs (UNDHA). Mitigating Natural Disasters: Phenomena, Effects and Options: A Manual for Policy Makers and Planners; United Nations: New York, NY, USA, 1991. [Google Scholar]
- Okada, N. Urban diagnosis and integrated disaster risk management. J. Nat. Disaster Sci. 2004, 26, 49–54. [Google Scholar]
- Shi, P.J. Theory on disaster science and disaster dynamics. J. Nat. Disasters 2002, 3, 1–9. (In Chinese) [Google Scholar]
- Zhang, Q.N.; Li, N. The Quantitative Method and Its Application of Risk Assessment and Management of Major Meteorological Disasters; Beijing Normal University Press: Beijing, China, 2007. (In Chinese) [Google Scholar]
- Lin, T.; Liu, X.F.; Song, J.C.; Zhang, G.Q.; Jia, Y.Q.; Tu, Z.Z.; Liu, C.L. Urban waterlogging risk assessment based on internet open data: A case study in China. Habitat Int. 2018, 71, 88–96. [Google Scholar] [CrossRef]
- Sun, S.; Zhai, J.Q.; Li, Y.; Huang, D.P.; Wang, G.F. Urban waterlogging risk assessment in well-developed region of Eastern China. Phys. Chem. Earth Parts A/B/C 2020, 115, 102824. [Google Scholar] [CrossRef]
- Saaty, T.L. The Analytic Hierarchy Process; McGraw-Hill: New York, NY, USA, 1980. [Google Scholar]
- Huang, T.L.; Zhang, J.L.; Wang, Y.P. Simulation and analysis of urban waterlogging in Liwan district, Guangzhou city. Pearl River 2015, 36, 135–138. (In Chinese) [Google Scholar]
- Zhu, X.C.; Gao, Y.; Gao, J.Q. GIS-Based risk assessment method for county-level administrative regions: A case Study of rainstorm and flood disasters. Trop. Geogr. 2014, 34, 704–711. (In Chinese) [Google Scholar]
- Peng, Y.; Gu, X.B.; Zhu, X.T.; Zhang, F.Y.; Song, Y. Recovery evaluation of villages reconstructed with concentrated rural settlement after the Wenchuan earthquake. Nat. Hazards 2020, 104, 139–166. [Google Scholar] [CrossRef]
- Gao, W.Y.; Li, M.; Li, J. Distribution characteristics of waterlogging in Xi’an and its relationship with precipitation. J. Shaanxi Meteorol. 2014, 2, 17–20. (In Chinese) [Google Scholar]


| Data Category | Data | Sources |
|---|---|---|
| Geospatial data | DEM (Digital Elevation Model) data in the city proper (2 × 2 m) | Surveying and Mapping Institute of Ningbo |
| Soil classification map of Ningbo (1:1 million) | Institute of Soil Science, Chinese Academy of Sciences | |
| Remote sensing images in the city proper in 2016 (0.5 × 0.5 m) | Bureau of Land and Resources of Ningbo | |
| The type of land use in 2016 (1:10,000) | Bureau of Land and Resources of Ningbo | |
| Drainage pump station of main rivers in the city proper | Field investigation | |
| Boundary of the administrative district in the city proper | The research group | |
| Water accumulation points in the city proper in 2016 | News reports and field investigation | |
| Road distribution of Ningbo (county level) | Electronic Map of Ningbo (2015) | |
| Socioeconomic data | Population information of each street in the city proper in 2016 | 2017 Ningbo Statistical Yearbook |
| Soil property classification | Zhejiang Soil History |
| Basin Number | 1 | 2 | 3 | 4 | 5 | 6 | 7 | 8 | 9 | |
| Depth of Stagnant Water | ||||||||||
| 0.1 m | 16.2 | 5.6 | 9.95 | 5.37 | 16.01 | 10.62 | 10.51 | 10.85 | 6.65 | |
| 0.2 m | 25.5 | 14.65 | 14.95 | 10.1 | 21.08 | 17.6 | 13.53 | 16.1 | 8.46 | |
| 0.6 m | 114.1 | 50.14 | 40.86 | 30 | 54.9 | 54.78 | 30.38 | 53.67 | 58.35 | |
| 1 m | 189 | 148.22 | 74.11 | 45.51 | 91.96 | 73.07 | 92.9 | 96.19 | 198.12 | |
| Basin Number | 10 | 11 | 12 | 13 | 14 | 15 | 16 | 17 | 10 | |
| Depth of Stagnant Water | ||||||||||
| 0.1 m | 10.63 | 9.28 | 11.62 | 37.16 | 10.83 | 8.76 | 25.24 | 8.27 | 10.63 | |
| 0.2 m | 14.7 | 12.74 | 14.14 | 66.45 | 14.71 | 14.7 | 37 | 10.71 | 14.7 | |
| 0.6 m | 42.59 | 39.01 | 38.17 | 160 | 33 | 51 | 95.06 | 23.68 | 42.59 | |
| 1 m | 95.19 | 58 | 138.78 | 198 | 40.59 | 104.95 | 159.2 | 38.39 | 95.19 | |
| Target Layer | Criterion Layer | Indicator Layer | Scheme Layer |
|---|---|---|---|
| Waterlogging risk assessment | Dangerousness | Precipitation | Catastrophic rainfall threshold |
| Sensitivity | Terrain | Terrain relief | |
| Water system | River buffer | ||
| Drainage capacity | Pump station flow | ||
| Surface features | Land use type | ||
| Vulnerability | Population | Population density | |
| Road | Road density |
| Indicator Type | Weight | Indicator Layer | Weight |
|---|---|---|---|
| Dangerousness | 0.5 | Catastrophic rainfall threshold | 0.5 |
| Sensitivity | 0.25 | Land use type | 0.0325 |
| Terrain relief | 0.0975 | ||
| Pump station flow | 0.0475 | ||
| River buffer | 0.0725 | ||
| Vulnerability | 0.25 | Population density | 0.1675 |
| Road density | 0.0825 |
| Rainfall Classification | Light Waterlogging | Moderate Waterlogging | Heavy Waterlogging |
|---|---|---|---|
| (5.73, 10.1) | 5 | — | — |
| (10.1, 26.38) | 4 | 5 | — |
| (26.38, 38.89) | 3 | 4 | 5 |
| (38.89, 189) | 2 | 3 | 4 |
| (189, ~) | 1 | 2 | 3 |
Publisher’s Note: MDPI stays neutral with regard to jurisdictional claims in published maps and institutional affiliations. |
© 2021 by the authors. Licensee MDPI, Basel, Switzerland. This article is an open access article distributed under the terms and conditions of the Creative Commons Attribution (CC BY) license (http://creativecommons.org/licenses/by/4.0/).
Share and Cite
Zhou, M.; Feng, X.; Liu, K.; Zhang, C.; Xie, L.; Wu, X. An Alternative Risk Assessment Model of Urban Waterlogging: A Case Study of Ningbo City. Sustainability 2021, 13, 826. https://doi.org/10.3390/su13020826
Zhou M, Feng X, Liu K, Zhang C, Xie L, Wu X. An Alternative Risk Assessment Model of Urban Waterlogging: A Case Study of Ningbo City. Sustainability. 2021; 13(2):826. https://doi.org/10.3390/su13020826
Chicago/Turabian StyleZhou, Meiling, Xiuli Feng, Kaikai Liu, Chi Zhang, Lijian Xie, and Xiaohe Wu. 2021. "An Alternative Risk Assessment Model of Urban Waterlogging: A Case Study of Ningbo City" Sustainability 13, no. 2: 826. https://doi.org/10.3390/su13020826
APA StyleZhou, M., Feng, X., Liu, K., Zhang, C., Xie, L., & Wu, X. (2021). An Alternative Risk Assessment Model of Urban Waterlogging: A Case Study of Ningbo City. Sustainability, 13(2), 826. https://doi.org/10.3390/su13020826