Research on the Evaluation and Influence Mechanism of Public Housing Service Quality: A Case Study of Shanghai


Abstract
1. Introduction
- What is PHSQ? What attributes and elements are included?
- How can we evaluate PHSQ? What is the level of PHSQ in Shanghai? What kind of spatial pattern does it present?
- What are the key factors and motivation mechanisms that affect PHSQ?
2. Literature Review and Conceptual Connotations
2.1. Literature Review
2.1.1. Performance Measurement
2.1.2. Satisfaction Survey
2.1.3. Social-Space Effect Evaluation
2.2. Concept of PHSQ
2.3. Policy Background
3. Data Sources and Methods
3.1. Establishment of an Index System
3.2. Research Methods
3.2.1. Analytic Hierarchy Process (AHP)
3.2.2. Full Arrangement Polygon Method
3.2.3. Geodetector Model
3.2.4. Spatial Autocorrelation Analysis
4. Results and Analysis
4.1. Level Characteristics of PHSQ
4.1.1. Comprehensive Level Analysis
4.1.2. Single-Dimensional Quality Level Analysis
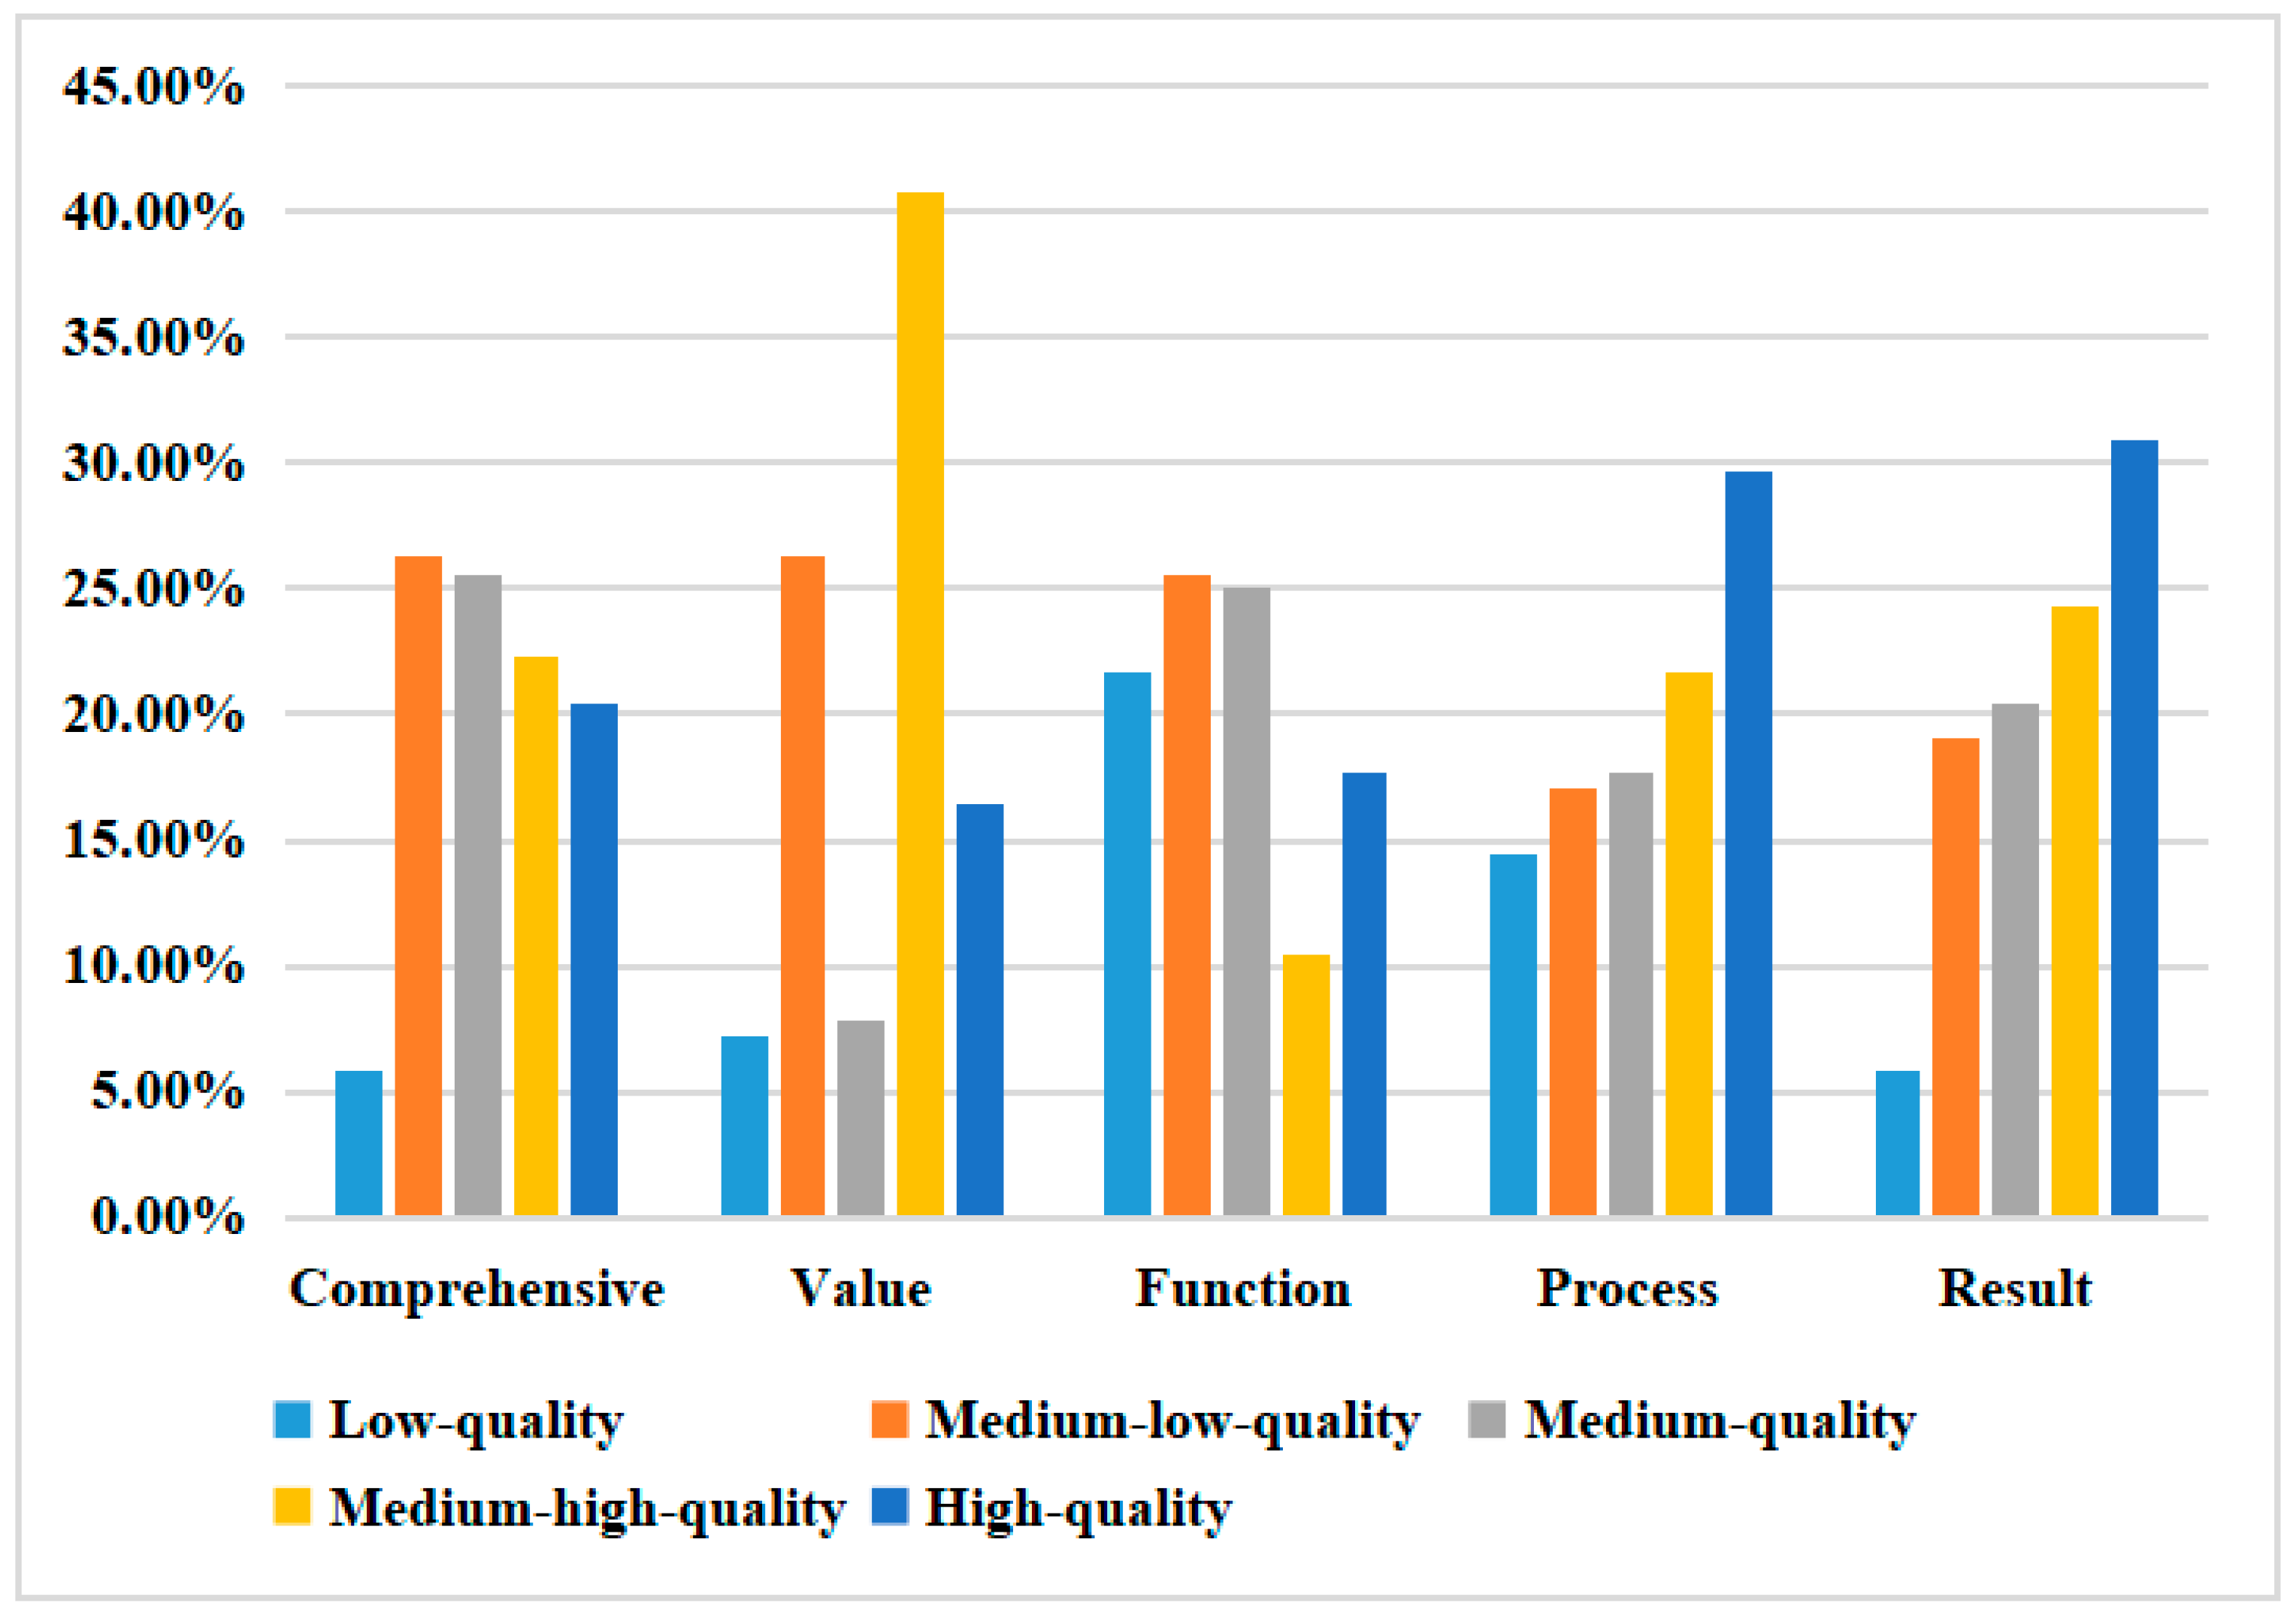
- In the value dimension, the medium-high-quality areas are the majority, and the high- and low-quality towns/streets are intermingled. In terms of the proportion of each type, the medium-high-quality area (40.7%) > medium-low-quality area (26.3%) > high-quality area (16.4%) > medium-quality area (7.9%) > low-quality area (7.23%). The proportion of the medium-high-quality areas are greater than other types. In terms of the average quality of each district, the core edge area (0.58) > suburban area (0.56) > central city area (0.43) > outer suburban area (0.39). The average quality of the core edge area is 1.49 times that of the outer suburban area, and the highest-quality street/town is 10.87 times that of the lowest-quality street/town. The city-wide difference coefficient was 0.37, which reflects significant regional differences in the quality of value dimensions.
- In the functional dimension, the quality is mainly in the middle and low grades and decreases from the core to the periphery, while the outer suburbs have become places of depression. In terms of the proportion of each type, the medium-low-quality area (25.6%) > medium-quality area (25.0%) > low-quality area (21.7%) > high-quality area (17.7%) > medium-high-quality area (10.5%). The middle- and below-quality areas accounted for 72.3%, implying that the streets/towns that had inferior quality accounted for the vast majority. Only one of the 84 towns that exceeds average quality is in the outer suburbs (Xujing Town, Qingpu). In terms of average values, the outer suburban area (0.44) < core area (0.72) < inner suburban area (0.67) < core edge area (0.61), and the quality of the outer suburban area is significantly lower than other areas.
- In the process dimension, the quality is mostly above the middle level, and the core area is outstanding. In terms of the proportion of each type, the high-quality area (29.6%) > medium-high-quality regional area (21.7%) > medium-quality area (17.7%) > medium-low-quality area (17.1%) > low-quality area (14.4%). The quality of the middle- and high-quality districts accounted for 69.0%, which reflects that the quality advantage of streets/towns accounted for the vast majority. Among the 26 high-quality streets/towns, 18 are in the core area or core edge areas, and the quality of Jiangsu Road in Changning District (belonging to the core area) is the highest (0.90). In terms of average quality, the core area (0.77) > suburban area (0.67) > outer suburban area (0.65) > core edge area (0.64), which reflects that the average quality of the process dimension in the core area far exceeds that of the other areas.
- In the result dimension, the quality is mainly of high and medium level, and each district matches one another. In terms of the proportion of each type, the high-quality area (30.9%) > medium-high-quality area (24.3%) > medium-quality area (20.4%) > medium-low-quality area (19.1%) > low-quality area (5.9%). The medium- and high-quality levels accounted for the vast majority. In terms of average quality, the core area (0.97) > core edge area (0.95) > suburban area (0.93) > outer suburban area (0.91), and the average quality of each district was between 0.91 and 0.97, while the coefficient of variance for each street/town was only 0.11. We can infer that the quality of the results dimension is relatively balanced, since each district is similar and has little difference.
4.2. Space Characteristics Analysis of PHSQ
4.2.1. Comprehensive Spatial Characteristics
- From the perspective of spatial form, a single high-quality center coexists with multiple low-quality centers, and a circle structure of “one high and many low” forms an approximate M-shaped spatial distribution pattern (Figure 3). The high-quality levels are mainly located in the core and core edge areas (the solid circle in Figure 3). With Dapuqiao Street in Huangpu District, Jiangsu Road in Changning District, and Fenglin Street in Xuhui District as the core, it then expands to the periphery, forming an approximately elliptical high-quality agglomeration area. The contiguous medium-low-quality and low-quality areas are concentrated in the north, west, and south (the dotted circle in Figure 3), forming six quality-depression areas. In the north, the center is composed of Chenjia Town in Chongming District, Luodian Town or Gucun Town in Baoshan District, and Anting Town in Jiading District. In the west, Jiuting Town, Sijing Town, and Dongjing Town in Songjiang District are the core. In the south, Caojing Town in Jinshan District, Qingshan Town in Fengxian District, and Huinan Town in Pudong are the core.
- From the perspective of overall trends (Figure 4), the city has formed a “core-periphery” pattern, with a high center and low periphery that gradually decreases from the center to the outside. The east is better than the west, the north higher than the south, and the difference in the north–south direction is notably greater than the difference in the east–west direction. The three low-quality depressions in the north can be regarded as the connection points that form a low-quality central axis, running from the northeast to the southwest. In the west, Songjiang is the core and its quality decreases in the two directions of northwest and southwest, respectively, while the south is linked by Jinshan, Fengxian, and Chongming Districts to form a low-quality central axis with an east–west trend.
- The spatial pattern of PHSQ is marked by obvious economic development and an urban development layout. The current low-quality agglomeration areas can be roughly divided into three categories. The first is the migrant-population concentrated area, represented by Jiuting Town in Songjiang District and Luxiang Town in Jinshan District. These regions have developed manufacturing industries and densely floating populations and have strong demand for housing security and public services. The second category is the large-scale residential communities that are imported from the urban area, represented by Maqiao Town in Minhang District, Sijing Town in Songjiang District, and Huinan Town in Pudong District. These areas coincide with the spatial location of 46 large residential communities, planned by the Shanghai Housing Construction Committee, which has undertaken many urban relocation and resettlement populations. However, the speed of infrastructure construction does not match the speed of the high-density residential development and large-scale population introduction. The third category is the urban fringe areas, represented by Gangyan Town in Chongming District, Baihe Town in Qingpu, and Jinshanwei Town in Jinshan District. Most of these low-quality streets/towns have relatively lagging economic development, marginalized access to resource elements, small radial driving effects from the central city, and insufficient socioeconomic endowment; and these factors have affected the PHSQ.
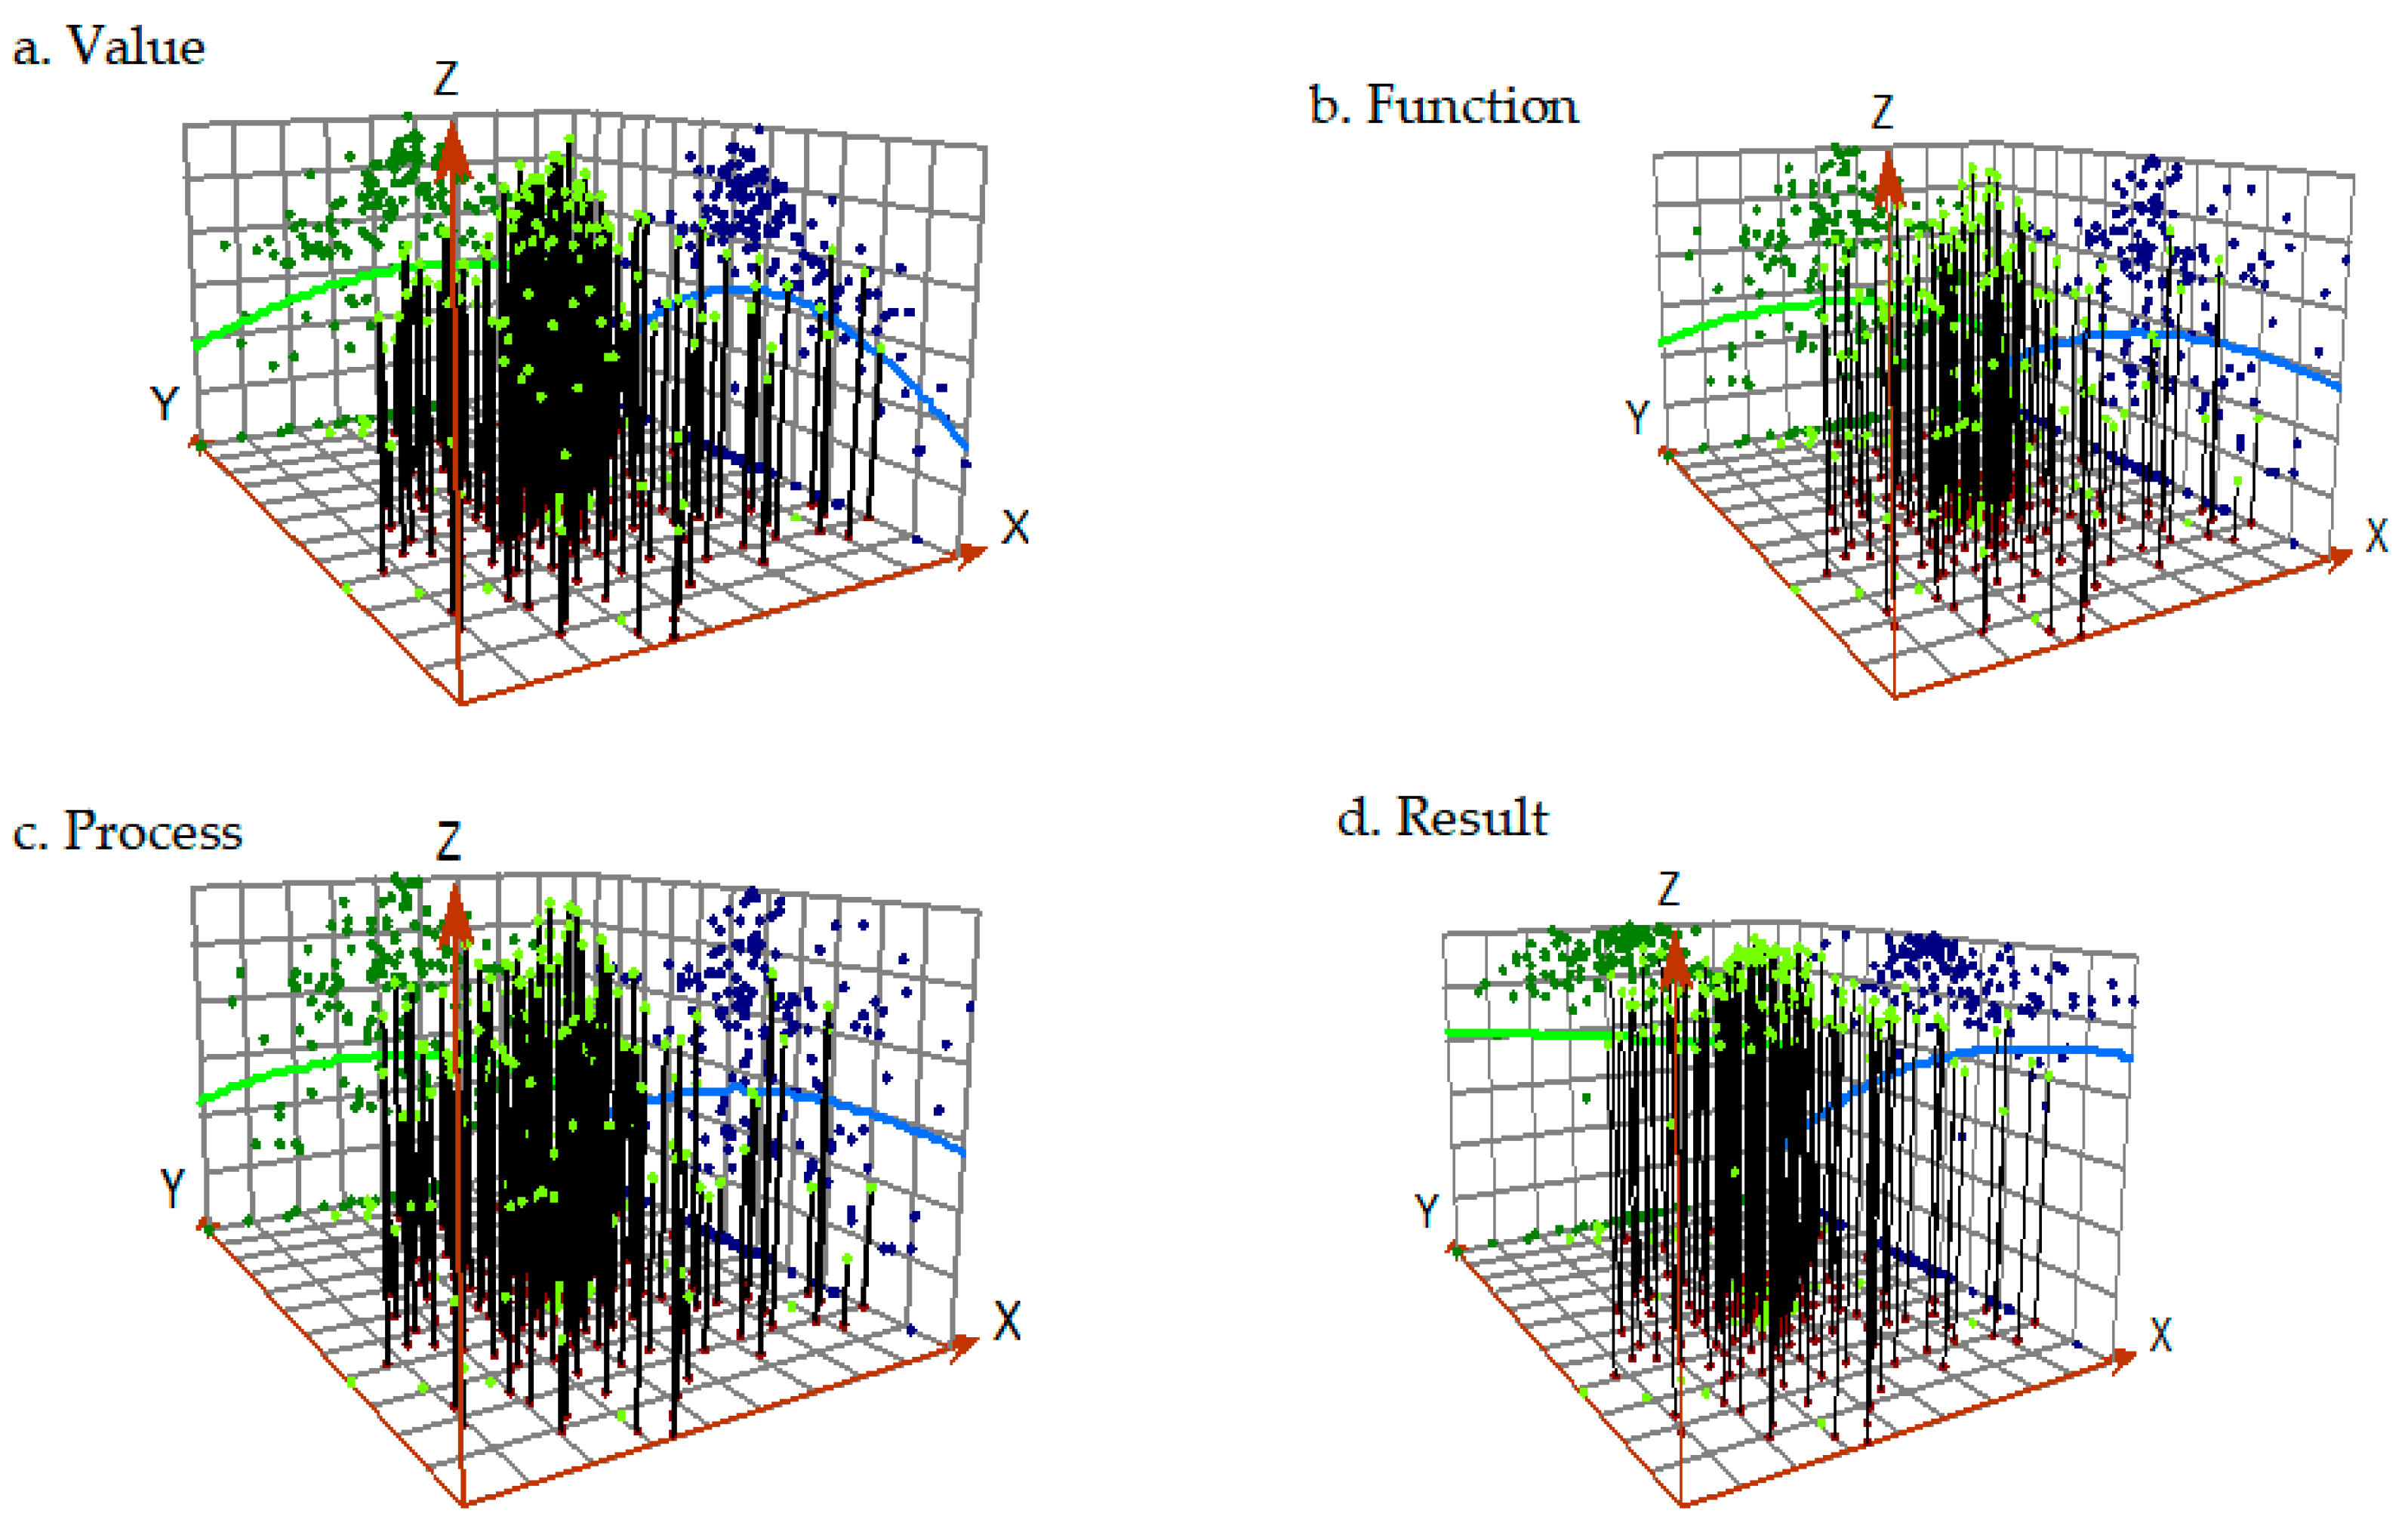
4.2.2. Spatial Characteristics of Each Dimension
5. Formation Mechanism of PHSQ
5.1. Factor Detection of PHSQ
5.2. Detection of PHSQ Interaction Factors
6. Conclusions and Discussion
Author Contributions
Funding
Institutional Review Board Statement
Informed Consent Statement
Data Availability Statement
Acknowledgments
Conflicts of Interest
References
- Kemeny, J. Housing and Social Theory; Routledge: London, UK, 2015; Volume 5, pp. 133–142. [Google Scholar]
- Glaeser, E.L.; Saks, G.R.E. Urban growth and housing supply. J. Econ. Geogr. 2005, 6, 71–89. [Google Scholar] [CrossRef]
- Li, D.; Chen, Y.; Chen, H.; Guo, K.; Hui, C.M.; Yang, J. Assessing the integrated sustainability of a public rental housing project from the perspective of complex eco-system. Habitat Int. 2016, 53, 546–555. [Google Scholar]
- Wu, G.; Duan, K.; Zuo, J.; Zhao, X.; Tang, D. Integrated sustainability assessment of public rental housing community based on a hybrid method of AHP-Entropy weigh and cloud model. Sustainability 2017, 9, 603. [Google Scholar]
- Galdini, R.; Lucciarini, S. Social innovation and environmental sustainability in social housing policies: Learning from two experimental case studies in Italy. In Different Strategies of Housing Design; Intech Open Limited: London, UK, 2019; Volume 2, pp. 105–121. [Google Scholar]
- Wu, F.; Liu, Y.; Zeng, Y. Evaluation of the human settlement environment of public housing community: A case study of Guangzhou. Sustainability 2020, 12, 7361. [Google Scholar] [CrossRef]
- Zeng, W.; Rees, P.; Xiang, L. Do residents of affordable housing communities in China suffer from relative accessibility deprivation? A case study of Nanjing. Cities 2019, 90, 141–156. [Google Scholar] [CrossRef]
- Andrews, R.; Steven, V.D.W. New public management and citizens′ perceptions of local service efficiency, responsiveness, equity, and effectiveness. Public Manag. Rev. 2013, 15, 762–783. [Google Scholar] [CrossRef]
- Gregg, G.; Van, R.; Douglas, M.; Stephen, I. Drivers and consequences of citizen satisfaction:an Application of the American Customer Satisfaction Index Model to New York City. Public Admini Rev. 2010, 3, 331–341. [Google Scholar]
- Heinrich, C.J. Outcomes-based performance management in the public sector: Implications for government accountability and effectiveness. Public Adm. Rev. 2002, 62, 712–725. [Google Scholar] [CrossRef]
- Wong, C. Indicators of Urban and Regional Planning: The Interplay of Policy and Methods; Routledge: London, UK, 2006; Volume 6, pp. 67–81. [Google Scholar]
- Shworth, R.E.; Boyne, G.A.; Entwistle, T. Public Service Improvement: Theories and Evidence; Oxford University Press: Oxford, UK, 2010; Volume 4, pp. 45–68. [Google Scholar]
- Wu, B.; Sun, H. Government performance evaluation research in housing security policy implementation in China. J. Ocean. Univ. China (Soc. Sci.) 2013, 4, 70–76. (In Chinese) [Google Scholar]
- Yuhong, P.; Yuanjun, X.; Weijun, M. An optimal public rental housing (PRH) distribution model based on DEA of the ideal decision-making unit. Urban. Stud. 2011, 8, 34–56. (In Chinese) [Google Scholar]
- Esruq-Labin, A.M.J.; Che-Ani, A.I.; Tawil, N.M. Criteria for affordable housing performance measurement: A review. E3S Web Conf. 2014, 3, 01003. [Google Scholar] [CrossRef]
- Chen, J.; Nong, H. The nonlinear and heterogeneous crowding-out effect of public housing: Empirical evidence from Chinese provincial panel data. Stat. Res. 2016, 33, 27–35. [Google Scholar]
- Li, M.; Zhou, Y. Measurement and empirical research on the social welfare effect of social housing construction. J. Zhongnan Univ. Econ. Law 2012, 5, 29–42. [Google Scholar]
- Xiao, Y.; Miao, S.; Sarkar, C. Do neighborhood ties matter for residents’ mental health in affordable housing: Evidence from Guangzhou, China. Cities 2020, 100, 1–4. [Google Scholar] [CrossRef]
- McCormick, N.J.; Joseph, M.L.; Chaskin, R.J. The new stigma of relocated public housing residents: Challenges to social identity in mixed-income developments. City Community 2012, 11, 285–308. [Google Scholar] [CrossRef]
- Varady, D.P.; Matos, F. Comparing public housing revitalization in a liberal and a Mediterranean society (US vs. Portugal). Cities 2017, 64, 37–46. [Google Scholar] [CrossRef]
- Chaskin, R.J.; Joseph, M.L. Integrating the Inner City: The Promise and the Perils of Mixed-Income Public Housing Transformation; University of Chicago Press: Chicago, IL, USA, 2015; Volume 7, pp. 47–51. [Google Scholar]
- Allen, R.; Goetz, E.G. Nativity, ethnicity, and residential relocation: The experience of Hmong refugees and African Americans displaced from public housing. J. Urban Aff. 2010, 32, 321–344. [Google Scholar] [CrossRef]
- Chen, J. Spatial mismatch evolution study of Tianjin public housing based on commuter perspective. Chin. Popul. Res. Environ. 2016, 26, 409–412. (In Chinese) [Google Scholar]
- Mohan, J.; Twigg, L. Sense of place, quality of life and local socioeconomic context: Evidence from the survey of English housing. Urban Stud. 2007, 44, 2029–2045. [Google Scholar] [CrossRef]
- Bouckaert, G.; Van, W.S. Comparing measures of citizen trust and user satisfaction as indicators of “good governance”. Int. Rev. Adm. Sci. 2003, 69, 329–343. [Google Scholar]
- Aernouts, N.; Ryckewaert, M. Reconceptualizing the “publicness” of public housing: The case of Brussels. Soc. Incl. 2015, 3, 56–61. [Google Scholar] [CrossRef]
- Rutgers, M.R. As good as it gets? On the meaning of public value in the study of policy and management. Am. Rev. Public Adm. 2015, 45, 29–45. [Google Scholar] [CrossRef]
- Jorgensen, T.B.; Bozeman, B. Public values: An inventory. Adm. Sci. 2007, 39, 354–381. [Google Scholar] [CrossRef]
- Schachter, H.L. Objective and subjective performance measures: A note on terminology. Adm. Soc. 2010, 42, 550–567. [Google Scholar] [CrossRef]
- James, O. Evaluating the expectations disconfirmation and expectations anchoring approaches to citizen satisfaction with local public services. J. Public Adm. Res. Theory 2009, 19, 107–123. [Google Scholar] [CrossRef]
- Van de Walle, S.; Van Ryzin, G.G. The order of questions in a survey on citizen satisfaction with public services: Lessons from a split-ballot experiment. Public Adm. 2011, 89, 1436–1450. [Google Scholar] [CrossRef]
- James, O. Performance measures and democracy: Information effect on citizens in field and laboratory experiments. J. Public Adm. Res. Theory 2011, 3, 399–418. [Google Scholar] [CrossRef]
- Ma, L.; Yang, Y. How does public participation in government performance evaluation affect citizen satisfaction? Evidence from Chinese prefectural-level cities. Adm. Trib. 2019, 26, 86–94. [Google Scholar]
- Swindell, D.; Kelly, J.M. Linking citizen satisfaction to performance measures: A preliminary evaluation. Pub. Perform. Manag. Rev. 2000, 24, 30–52. [Google Scholar] [CrossRef]
- Weizhen, C. Spatial effect and social influence of public space planning. Archit. J. 2004, 30, 34–42. [Google Scholar]
- Gowan, M.; Seymou, J. Service quality in a public agency: Same expectations but different perceptions by employees, managers, and customers. J. Qual. Manag. 2001, 6, 275–291. [Google Scholar] [CrossRef]
- Bouckaert, G. Conditions for introducing quality in public administration: Some elements of measurement and control. Natl. Cent. Public Adm. Athens 2010, 5, 46–71. [Google Scholar]
- Real-Estate Research Center of Speedbank. Correlation of the Price of Housing Units and Expected Economic Profit by Rebuilding; Real-estate Research Center Report: Texas, TX, USA, 2003. [Google Scholar]
- Kim, S.S.; Yang, I.H.; Yeo, M.S. Development of a housing performance evaluation model for multi-family residential buildings in Korea. Build. Env. 2005, 40, 1103–1116. [Google Scholar] [CrossRef]
- Ma, Z.; Li, C.; Zhang, J. Affordable housing brings about socio-spatial exclusion in Changchun, China: Explanation in various economic motivations of local governments. Habitat Int. 2018, 76, 40–47. [Google Scholar] [CrossRef]
- Skelcher, C. Improving the quality of local public services. Serv. Ind. J. 1992, 12, 463–477. [Google Scholar] [CrossRef]
- Rhee, S.K.; Rha, J.Y. Public service quality and customer satisfaction: Exploring the attributes of service quality in the public sector. Serv. Ind. J. 2009, 13, 1121–1123. [Google Scholar] [CrossRef]
- Xie, X. Basic public service quality: Multidimensional construction and stratified evaluation. J. Shanghai Adm. Inst. 2018, 19, 14–26. [Google Scholar]
- Oliver, R.L. Cognitive, affective, and attribute bases of the satisfaction response. J. Consum. Res. 1993, 20, 418–430. [Google Scholar] [CrossRef]
- Shin, H.B. Residential redevelopment and the entrepreneurial local state: The implications of Beijing’s shifting emphasis on urban redevelopment policies. Urban. Stud. 2009, 46, 2815–2839. [Google Scholar] [CrossRef]
- Shi, W.; Chen, J.; Wang, H. Affordable housing policy in China: New developments and new challenges. Habitat Int. 2016, 54, 224–233. [Google Scholar] [CrossRef]
- Rigolon, A. Green gentrification or “just green enough”: Do park location, size, and function affect whether a place gentrifies or not? Urban. Stud. 2020, 57, 402–420. [Google Scholar] [CrossRef]
- Available online: https://shanghai.anjuke.com/sale/ (accessed on 16 July 2020).
- Available online: https://sh.lianjia.com/46 (accessed on 17 July 2020).
- Galster, G.C.; Metzger, K.; Waite, R. Neighborhood opportunity structures and immigrants’ socio-economic advancement. J. Hous. Res. 1999, 10, 95–127. [Google Scholar] [CrossRef]
- Cheng, Z.; Wang, H. Do neighborhoods have effects on wages? A study of migrant workers in urban China. Habitat Int. 2013, 38, 222–231. [Google Scholar] [CrossRef]
- García, J.; Montolio, D.; María Raya, J. Local public expenditure and housing price. Urban. Stud. 2013, 47, 1501–1512. [Google Scholar] [CrossRef]
- Wang, Z.; Zhang, F.; Wu, F. Intergroup neighboring in urban China: Implications for the social integration of migrants. Urban. Stud. 2016, 53, 651–668. [Google Scholar] [CrossRef]
- Available online: https://www.haodf.com/ (accessed on 19 July 2020).
- Yang, Z.; Yi, C.; Zhang, W. Affordability of housing and accessibility of public services: Evaluation of housing programs in Beijing. J. Hous. Built Environ. 2014, 29, 521–540. [Google Scholar] [CrossRef]
- Available online: https://www.hujiang.com/46 (accessed on 18 July 2020).
- Levine, J.C. Rethinking accessibility and jobs-housing balance. J. Am. Plan. Assoc. 1998, 64, 133–149. [Google Scholar] [CrossRef]
- Available online: http://962121.fgj.sh.gov.cn/wyweb/web/front/index.jsp (accessed on 10 July 2020).
- Seng, M.P. Comment on Martin D. Abravanel’s public knowledge of fair housing law: Does it protect against housing discrimination? Hous. Pol. Debate 2002, 12, 334–354. [Google Scholar] [CrossRef]
- Wang, J.; Xu, C. Geodetector: Principle and prospective. Acta Geogr. Sin. 2017, 72, 116–134. [Google Scholar]
- Wijburg, G.; Aalbers, M.B. The alternative financialization of the German housing market. Hous. Stud. 2017, 32, 11–22. [Google Scholar] [CrossRef]
- Cleary, S. Funding community initiatives: The role of NGOs and their community organizations in improving housing and living conditions in the third world. Habitat Int. 1994, 18, 154–155. [Google Scholar] [CrossRef]
- McIntyre Hall, L.; Hula, R. Resident Initiatives in Public Housing. Hous. Soc. 1997, 11, 75–92. [Google Scholar] [CrossRef]
- Zhu, P.; Yu, T.; Chen, Z. High-speed rail and urban decentralization in China. Transp. Res. Rec. 2015, 15, 16–26. [Google Scholar] [CrossRef]
- Wynne, L.; Rogers, D. Emplaced displacement and public housing redevelopment: From physical displacement to social, cultural, and economic replacement. Hous. Pol. Debate 2020, 1, 1–16. [Google Scholar]
- Fields, D. Contesting the financialization of urban space: Community organizations and the struggle to preserve affordable rental housing in New York City. J. Urban Aff. 2015, 37, 334–356. [Google Scholar] [CrossRef]


| Dimension | Connotation | Content |
|---|---|---|
| Value | Fairness | Fair opportunity to access resources. The security object is reasonable and breaks through the restrictions of household registration, region, gender, and occupation [36]. The fairness results of resource allocation to various groups and regions are relatively balanced [37]. |
| Welfare | Provide housing to the poor at a low price or for free [38]. | |
| Function | Survivability | Building materials, house design, sunshine, ventilation, day lighting, greening, and other living conditions meet people’s survival needs. Residential committees and property companies provide basic life services such as fire protection, security, cleaning, food markets, childcare, and elderly care [39]. |
| Development | At the individual level, public service facilities (education, medical care, public transportation, libraries) can meet the needs of individuals and their comprehensive development. At the social level, an affordable housing community can avoid generating social problems such as “slums” and “stigmatization” [40]. | |
| Process | Responsiveness | Dynamic adjustment of service resource supply. Service content meets the different needs of the service object, and the services are accurate and effective [41]. |
| Participation | At the front-end of the planning and construction phase, introduce public participation in decision-making procedures; at the mid-point of the resource allocation stage, services are transparent and open. In the later stage of community service, introduce a third-party supervision mechanism to strengthen public participation. | |
| Responsibility | Implement institutional responsibility and ameliorate the relevant institutional policy system and supply responsibility. The government plays the leading role in supply, supervision, and responsibility, and cracks down on crime and maintains market order [42]. | |
| Result | Accessibility | Economically payable and low service acquisition cost. Public resources are accessible and the distance between the community and public facilities is moderate [43]. |
| Satisfaction | In the early stage of production and construction, the public have comfortable experiences of the government’s administrative services and have positive emotional states [44]; in the later stage of community services, the public is highly satisfied with the community environment and property management services. |
| Type | Target Group | Eligibility Requirement |
|---|---|---|
| For sale | ||
| Economical and comfortable housing (ECH) | Low-income “house-poor” households | Local residence permit (Hukou), housing area per capita ≦5 m2 co-applicants ≧2, per capita monthly disposable income ≦3300 yuan |
| Shared ownership housing (SOH) | Middle-income households | Local residence permit (Hukou), permanent residence has been registered at least for 3 consecutive years, have continuously paid social insurance or personal income tax in this city for at least 5 years |
| For rental | ||
| Cheap rental housing (CRH) | Lowest-income households, including elderly couples, major disease patients, disabled people, veterans, model workers | Residence permit (Hukou), family size ≧3 persons, per capita annual income ≦72,000 yuan; family size ≦2 persons, per capita annual disposable income ≦86,400 yuan |
| Public rental housing (PRH) | Employees of large state-owned enterprises, high-tech enterprise employees, and introduced talents | No local residence requirement, no income or space threshold |
| Dimension | Connotation | Index (Community or Town Scale) | Data Source | Literature Source |
|---|---|---|---|---|
| A1. Value | B1. Fairness (0.650) | C1. Whether the service is open to the public without local hukou (0.667) | Policy text | Rigolon [47] |
| C2. Results disclosure status of listing/applicant/lottery (0.333) | Government website | Rigolon [47] | ||
| B2. Welfare (0.350) | C3. Ratio of renting a house to purchasing in surrounding area (0.667) | Anjuke [48]/Lianjia. [49] | Self-developed | |
| C4. Housing property type (0.333) | Self-built database | Self-developed | ||
| A2. Function | B3. Survivability (0.383) | C5. Whether the community is equipped with an elevator (0.354) | Anjuke [48] | Galster et al. [50] |
| C6. Volume rate (0.646) | Anjuke [48] | Galster et al. [50] | ||
| B4. Developmental (0.617) | C7. Distance to People’s Square (0.717) | Self-built database | Self-developed | |
| C8. Property fee (0.283) | Anjuke [48] | Cheng [51] | ||
| A3. Process | B5. Responsibility (0.237) | C9. Percentage of housing security expenditure to total fiscal expenditure (1.000) | Government bulletin | Jaum et al. [52] |
| B6. Participation (0.417) | C10. Whether the neighborhood committee is established or not established (1.000) | Self-built database | Wang et al. [53] | |
| B7. Responsiveness (0.346) | C11. Waiting time (0.383) | Government website | Self-developed | |
| C12. Rate of online complaints (0.617) | Government website | Self-developed | ||
| A4. Result | B8. Accessibility (0.566) | C13. Distance to the nearest medical insurance-designated hospital (0.500) | Haodf net [54] | Yang et al. [55] |
| C14. Distance to the nearest key elementary school/junior high school (0.500) | Hujiang.net [56] | Levine [57] | ||
| B9. Satisfaction (0.434) | C15. Complaints from community residents (1.000) | Residential property net [58] | Seng [59] |
| Number | District | Town/Street | Score | Number | District | Town/Street | Score |
|---|---|---|---|---|---|---|---|
| 1 | Jinan | Jiangning | 3.93 | 77 | Minhang | Xingzhuang | 2.23 |
| 2 | Huangpu | Yuyuan | 3.92 | 78 | Pudong | Zhuqiao | 2.22 |
| 3 | Changning | Jiangsu | 3.85 | 79 | Songjiang | Yexie | 2.22 |
| 4 | Xuhui | Fenglin | 3.72 | 80 | Minhang | Xinhong | 2.20 |
| 5 | Xuhui | Changqiao | 3.69 | 81 | Pudong | Hudong | 2.20 |
| 6 | Xuhui | Longhua | 3.60 | 82 | Baoshan | Songnan | 2.17 |
| 7 | Huangpu | Dapuqiao | 3.48 | 83 | Jiading | Jiading | 2.17 |
| 8 | Changning | Beixinjing | 3.42 | 84 | Fengxian | Situan | 2.16 |
| 9 | Zabei | Beizhan | 3.38 | 85 | Pudong | Nicheng | 2.15 |
| 10 | Changning | Hongqiao | 3.36 | 86 | Jiading | Juyuan | 2.14 |
| … | … | … | … | … | … | … | … |
| 76 | Baoshan | Luojing | 2.24 | 152 | Songjiang | Jiuting | 0.64 |
| Item | Comprehensive | Value | Function | Process | Result |
|---|---|---|---|---|---|
| Moran’s I | 0.098 | 0.043 | 0.122 | 0.091 | 0.130 |
| Z-value | 2.144 | 1.071 | 3.426 | 2.101 | 3.787 |
| P-value | 0.01 | 0.04 | 0.05 | 0.05 | 0.01 |
| Item | Variable | Factors | Index |
|---|---|---|---|
| Foundation support capacity | X1 | Planning development maturity | Core area = 1; core edge area = 2; suburbs = 3; outer suburbs = 4 |
| X2 | Economic development level | Per capita GDP value of street/town | |
| Resource agglomeration capacity | X3 | Trade center accessibility | Distance from the community to the nearest Central Business District |
| X4 | Public transport accessibility | Distance from the community to the nearest subway station | |
| Government control capacity | X5 | Government attention | Ratio of housing security fiscal expenditure to total fiscal expenditure |
| X6 | Intergovernmental cooperation status | Meetings and surveys conduct by city/district leaders or Democratic Party | |
| Market driving capacity | X7 | Land development status | Land transfer area (2014–2019) |
| X8 | Housing market development | Average market price of second-hand commercial housing | |
| Social support capacity | X9 | Resident committee function fulfilment | Number of “civilized communities” in affordable housing communities |
| X10 | Public discourse expression | Number of symposiums/opinion solicitations/National People’s Congress meetings |
| X1 | X2 | X3 | X4 | X5 | X6 | X7 | X8 | X9 | X10 | |
|---|---|---|---|---|---|---|---|---|---|---|
| X1 | 0.280 | |||||||||
| X2 | 0.533 | 0.237 | ||||||||
| X3 | 0.408 | 0.358 | 0.130 | |||||||
| X4 | 0.390 | 0.486 | 0.356 | 0.241 | ||||||
| X5 | 0.321 | 0.299 | 0.160 | 0.334 | 0.007 | |||||
| X6 | 0.369 | 0.386 | 0.359 | 0.368 | 0.219 | 0.172 | ||||
| X7 | 0.593 | 0.554 | 0.559 | 0.560 | 0.556 | 0.596 | 0.577 | |||
| X8 | 0.316 | 0.347 | 0.231 | 0.293 | 0.082 | 0.248 | 0.547 | 0.006 | ||
| X9 | 0.449 | 0.419 | 0.428 | 0.445 | 0.718 | 0.443 | 0.579 | 0.343 | 0.273 | |
| X10 | 0.451 | 0.583 | 0.425 | 0.532 | 0.808 | 0.751 | 0.656 | 0.692 | 0.530 | 0.258 |
 = non-linear weakening relationship;
  = single-factor nonlinear weakening relationship; = non-linear enhancement relationship; and = two-factor strengthening relationship.
Publisher’s Note: MDPI stays neutral with regard to jurisdictional claims in published maps and institutional affiliations. |
© 2021 by the authors. Licensee MDPI, Basel, Switzerland. This article is an open access article distributed under the terms and conditions of the Creative Commons Attribution (CC BY) license (http://creativecommons.org/licenses/by/4.0/).
Share and Cite
Wei, C.R.; Wang, Y. Research on the Evaluation and Influence Mechanism of Public Housing Service Quality: A Case Study of Shanghai. Sustainability 2021, 13, 672. https://doi.org/10.3390/su13020672
Wei CR, Wang Y. Research on the Evaluation and Influence Mechanism of Public Housing Service Quality: A Case Study of Shanghai. Sustainability. 2021; 13(2):672. https://doi.org/10.3390/su13020672
Chicago/Turabian StyleWei, Cheng Rui, and Yu Wang. 2021. "Research on the Evaluation and Influence Mechanism of Public Housing Service Quality: A Case Study of Shanghai" Sustainability 13, no. 2: 672. https://doi.org/10.3390/su13020672
APA StyleWei, C. R., & Wang, Y. (2021). Research on the Evaluation and Influence Mechanism of Public Housing Service Quality: A Case Study of Shanghai. Sustainability, 13(2), 672. https://doi.org/10.3390/su13020672