Article

Potential of On-the-Go Gamma-Ray Spectrometry for Estimation and Management of Soil Potassium Site Specifically

1
Faculty of Electrical Engineering, Universiti Teknikal Malaysia Melaka, Hang Tuah Jaya, Durian Tunggal, Melaka 76100, Malaysia
2
Soil and Water Department, Faculty of Agriculture, Suez Canal University, Ismailia 41522, Egypt
3
Department of Environment, Faculty of Bioscience Engineering, Ghent University, 9000 Gent, Belgium
*
Author to whom correspondence should be addressed.
Sustainability 2021, 13(2), 661; https://doi.org/10.3390/su13020661
Submission received: 3 December 2020 / Revised: 31 December 2020 / Accepted: 6 January 2021 / Published: 12 January 2021
(This article belongs to the Special Issue Smart Farming and Sustainability)

Abstract

:
High resolution data on plant available potassium (Ka) is crucial to optimize variable rate potassium fertilizer recommendations, and subsequently improve crop growth and yield. A gamma-ray passive spectrometry sensor was evaluated for on-the-go mapping and management of the spatial distribution of Ka over a 8.4 ha field at Huldenberg, Belgium. During the on-the-go measurement, a 5 s sampling interval was used while driving at 3 km/h speed along 10 m parallel transects. Two calibration models to predict Ka across the field were developed and compared: (1) a simple third order polynomial function (3DPF) was established between the sensor reading of the naturally occurring radioactive isotope of potassium (K-40) and laboratory measured Ka and (2) a partial least squares regression (PLSR) model linking gamma-ray spectra and laboratory measured Ka. Although a relatively small number of samples (45 samples) were used for the development of the PLSR calibration model, the cross-validation analysis resulted in a very good performance with a coefficient of determination (R2) of 0.85, a residual prediction deviation (RPD) of 2.67, a root mean square error of cross-validation (RMSECV) of 2.29 (mg/100 g) and a ratio of performance to interquartile distance (RPIQ) of 2.61. This was a much better result that that obtained with the 3DPF model (R2 = 0.69). The spatial distribution of Ka developed based on 3DPF and PLSR methods showed great similarity with the corresponding map developed using the data from the laboratory analysis. The calculated variable rate fertilizer recommendation based on gamma-ray data showed marginal differences in the amount of K2O fertilizer applied, compared to the uniform rate fertilization based on the conventional laboratory chemical soil analyses. The on-the-go measurement of Ka using gamma-ray spectrometry shows high potential, although the technology needs to be evaluated in a larger number of fields.

1. Introduction

Plant available potassium (Ka) is an important nutrient for plant water regulation and metabolic pathway activation, which influence plant growth [1]. Ka is part of exchangeable potassium (K), which is bound to the surfaces of clay minerals or can be found between the layers of clay minerals [2]. However, the majority of total occurring potassium (Kt) found in soils is non-exchangeable K, which is bound into either a crystal lattice formation or between layers of phyllosilicates as fixed K [3]. Ka is the only K form that can be used by plants. Therefore, determining Ka is important to manage K fertilization towards increased crop production. Conventional methods of soil analysis are usually not efficient because they are very slow, costly, time consuming, and are associated with certain ecological hazards [4]. The need for the development of more time and cost-efficient ways of analyzing Ka is driving the scientific community to establish indirect estimation methods based on proximal soil sensors (PSS) [5].
Despite considerable effort having been made in the determination of Ka, none of the PSS techniques except electrochemical sensing technology (e.g., [6,7]) have been proven to be capable of providing sufficiently accurate results [5,8]. However, electrochemical sensors are complex and not reliable for on-the-go measurement modes, that are necessary to collect high density soil samples and analyze them in real time. Although very few on-the-go systems using electrochemical sensing techniques to measure Ka are reported in the literature (e.g., Adamchuk et al. [9] reporting coefficient of determination (R2) = 0.61–0.62), these have never found their way into practical applications. Therefore, there is still a need for an on-the-go sensor to map Ka, which is essential for variable rate potassium fertilization.
Passive gamma-ray spectroscopy is one of the potential sensing candidates to measure Ka. This is due to the fact that the crystal detector detects energy emitted by the soil due to the natural decay of radioisotopes, including thorium (Th-223), uranium (U-238) and potassium (K-40). It is a non-invasive and non-destructive method, and is absolutely safe to use due to passive detection of the natural decay of radioisotopes without the need for an energy source. It is suitable to be configured on a mobile platform for on-the-go measurements with a range of the detection up to 8 m, and it can be synchronized to digital GPS data [10]. Gamma-ray spectroscopy was reported to measure and map pH, total nitrogen, Ka and texture [10,11,12], and can be used to map soil with high sampling resolution when mounted on a moving vehicle [5,13].
Although correlations between Ka and K-40 exist [14,15], the potential of ground gamma-rays for measuring Ka in soils has not been fully explored [10,14,15,16,17,18]. Wong and Harper [14] examined the correlation between Ka with K-40 count in the Jerramungup region, Australia, reporting a high correlation (R2 = 0.93). However, the authors reported that the correlation model was considered unreliable to replace the traditional K test. Pracilio et al. [15] reported a less good correlation (R2 = 0.75) of Ka with K-40, at a site in Western Australia. Viscarra Rossel et al. [10] obtained a fair prediction of Ka (R2 = 0.61) using the bagging-partial least squares regression (PLSR) method and gamma-ray spectra. Although Dierke and Werben [18] reported significant correlations between K-40 and Ka (r = 0.67, p < 0.05), they concluded that K-40 is not applicable for the indirect mapping of Ka under their specific study conditions, indicating that the estimation is possible if Ka in soils shows a major proportion of the Kt. Whether or not successful prediction of Ka using gamma-ray spectrometry depends on successful correlations between K-40 and Ka, is still a research question to be answered. The literature shows very limited studies comparing the prediction accuracy of simple regression analysis of K-40 versus Ka with that of spectra based regression to predict Ka [18,19]. Furthermore, to the best of our knowledge the evaluation of the potential benefit of using on-the-go gamma-ray sensing for variable rate K2O fertilization compared to the traditional method has not been reported.
The aim of this research is to evaluate the potential of on-the-go gamma-ray spectroscopy for predicting Ka in an agricultural field. The objectives were to: (1) compare the accuracy between the simple nonlinear polynomial and PLSR method for predicting Ka; (2) evaluate the suitability of adapted soil sampling method for collecting reference soil samples for developing the calibrating models of Ka, and (3) compare the amount of K2O needed for traditional uniform rate with that for variable rate fertilization, based on an on-the-go predicted Ka map, produced with the two calibration methods.

2. Materials and Methods
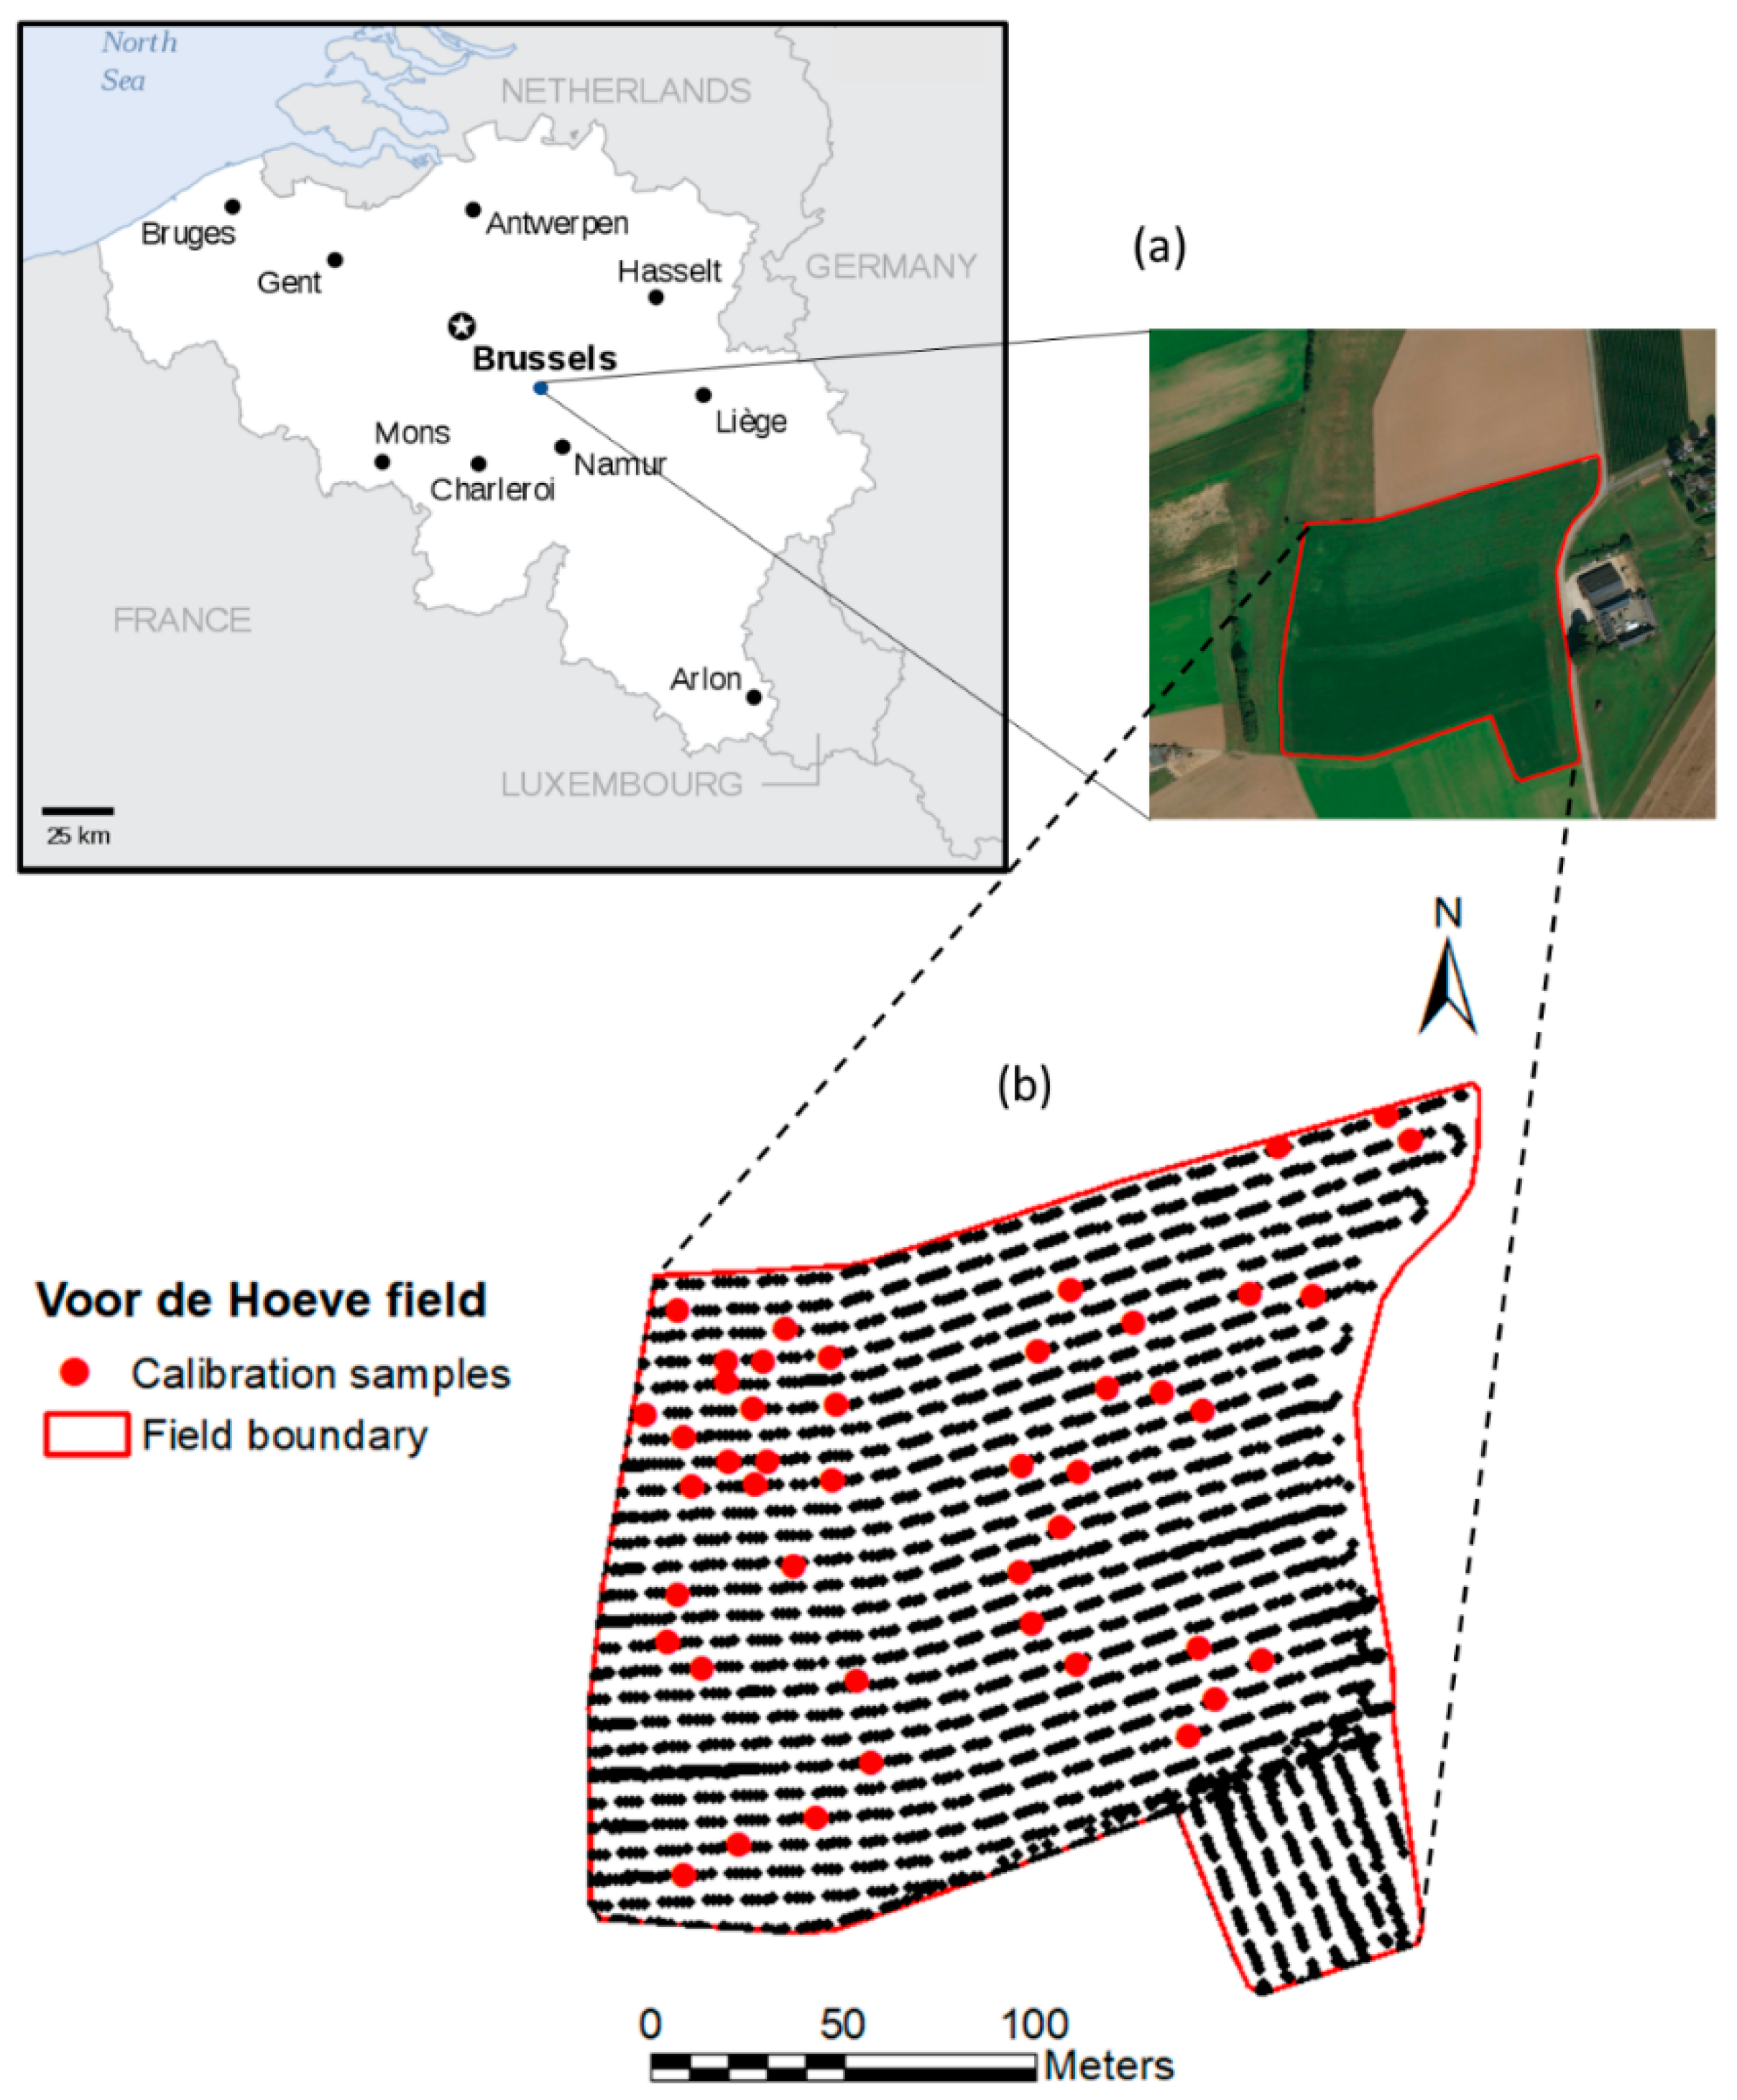
2.1. Study Area

The experiment was carried out in Voor de Hoeve field (VH), near Brussels in Flanders, Belgium. The 8.5 ha target field is located in Huldenberg with longitudes of 4.34° and 4.45° W, and latitudes of 50.1° and 50.2° N (Belgian Lambert 1972) (Figure 1). The elevation ranged between 78 to 120 m above sea level. This field is characterized by a warm summer with daily mean air temperatures from 11 °C to 23 °C and a cold winter with temperatures ranging from 1 °C to 8 °C. The average annual rainfall is 800 mm [20]. The target field is cultivated with potato, winter wheat, barley, and oil seed rape or sugar beet in rotation. The result of the texture analysis using the Pipette method of representative samples (5) indicated that the dominant soil texture is a silt loam (sand = 9.5%, silt = 78.5, and clay = 12%). Eutric Nudiargic Retisols (Siltic) characterize the plateau positions, while Haplic Luvisols (Siltic, Colluvic) and Eutric Cambisols (Siltic) are found in the colluvial thalwegs and bottom parts, respectively [21,22]. The apparent electrical conductivity (ECa) ranged between 0.23 and 0.79 dS/m. The soil organic matter (SOM) ranged between 1.55% to 4.9%.

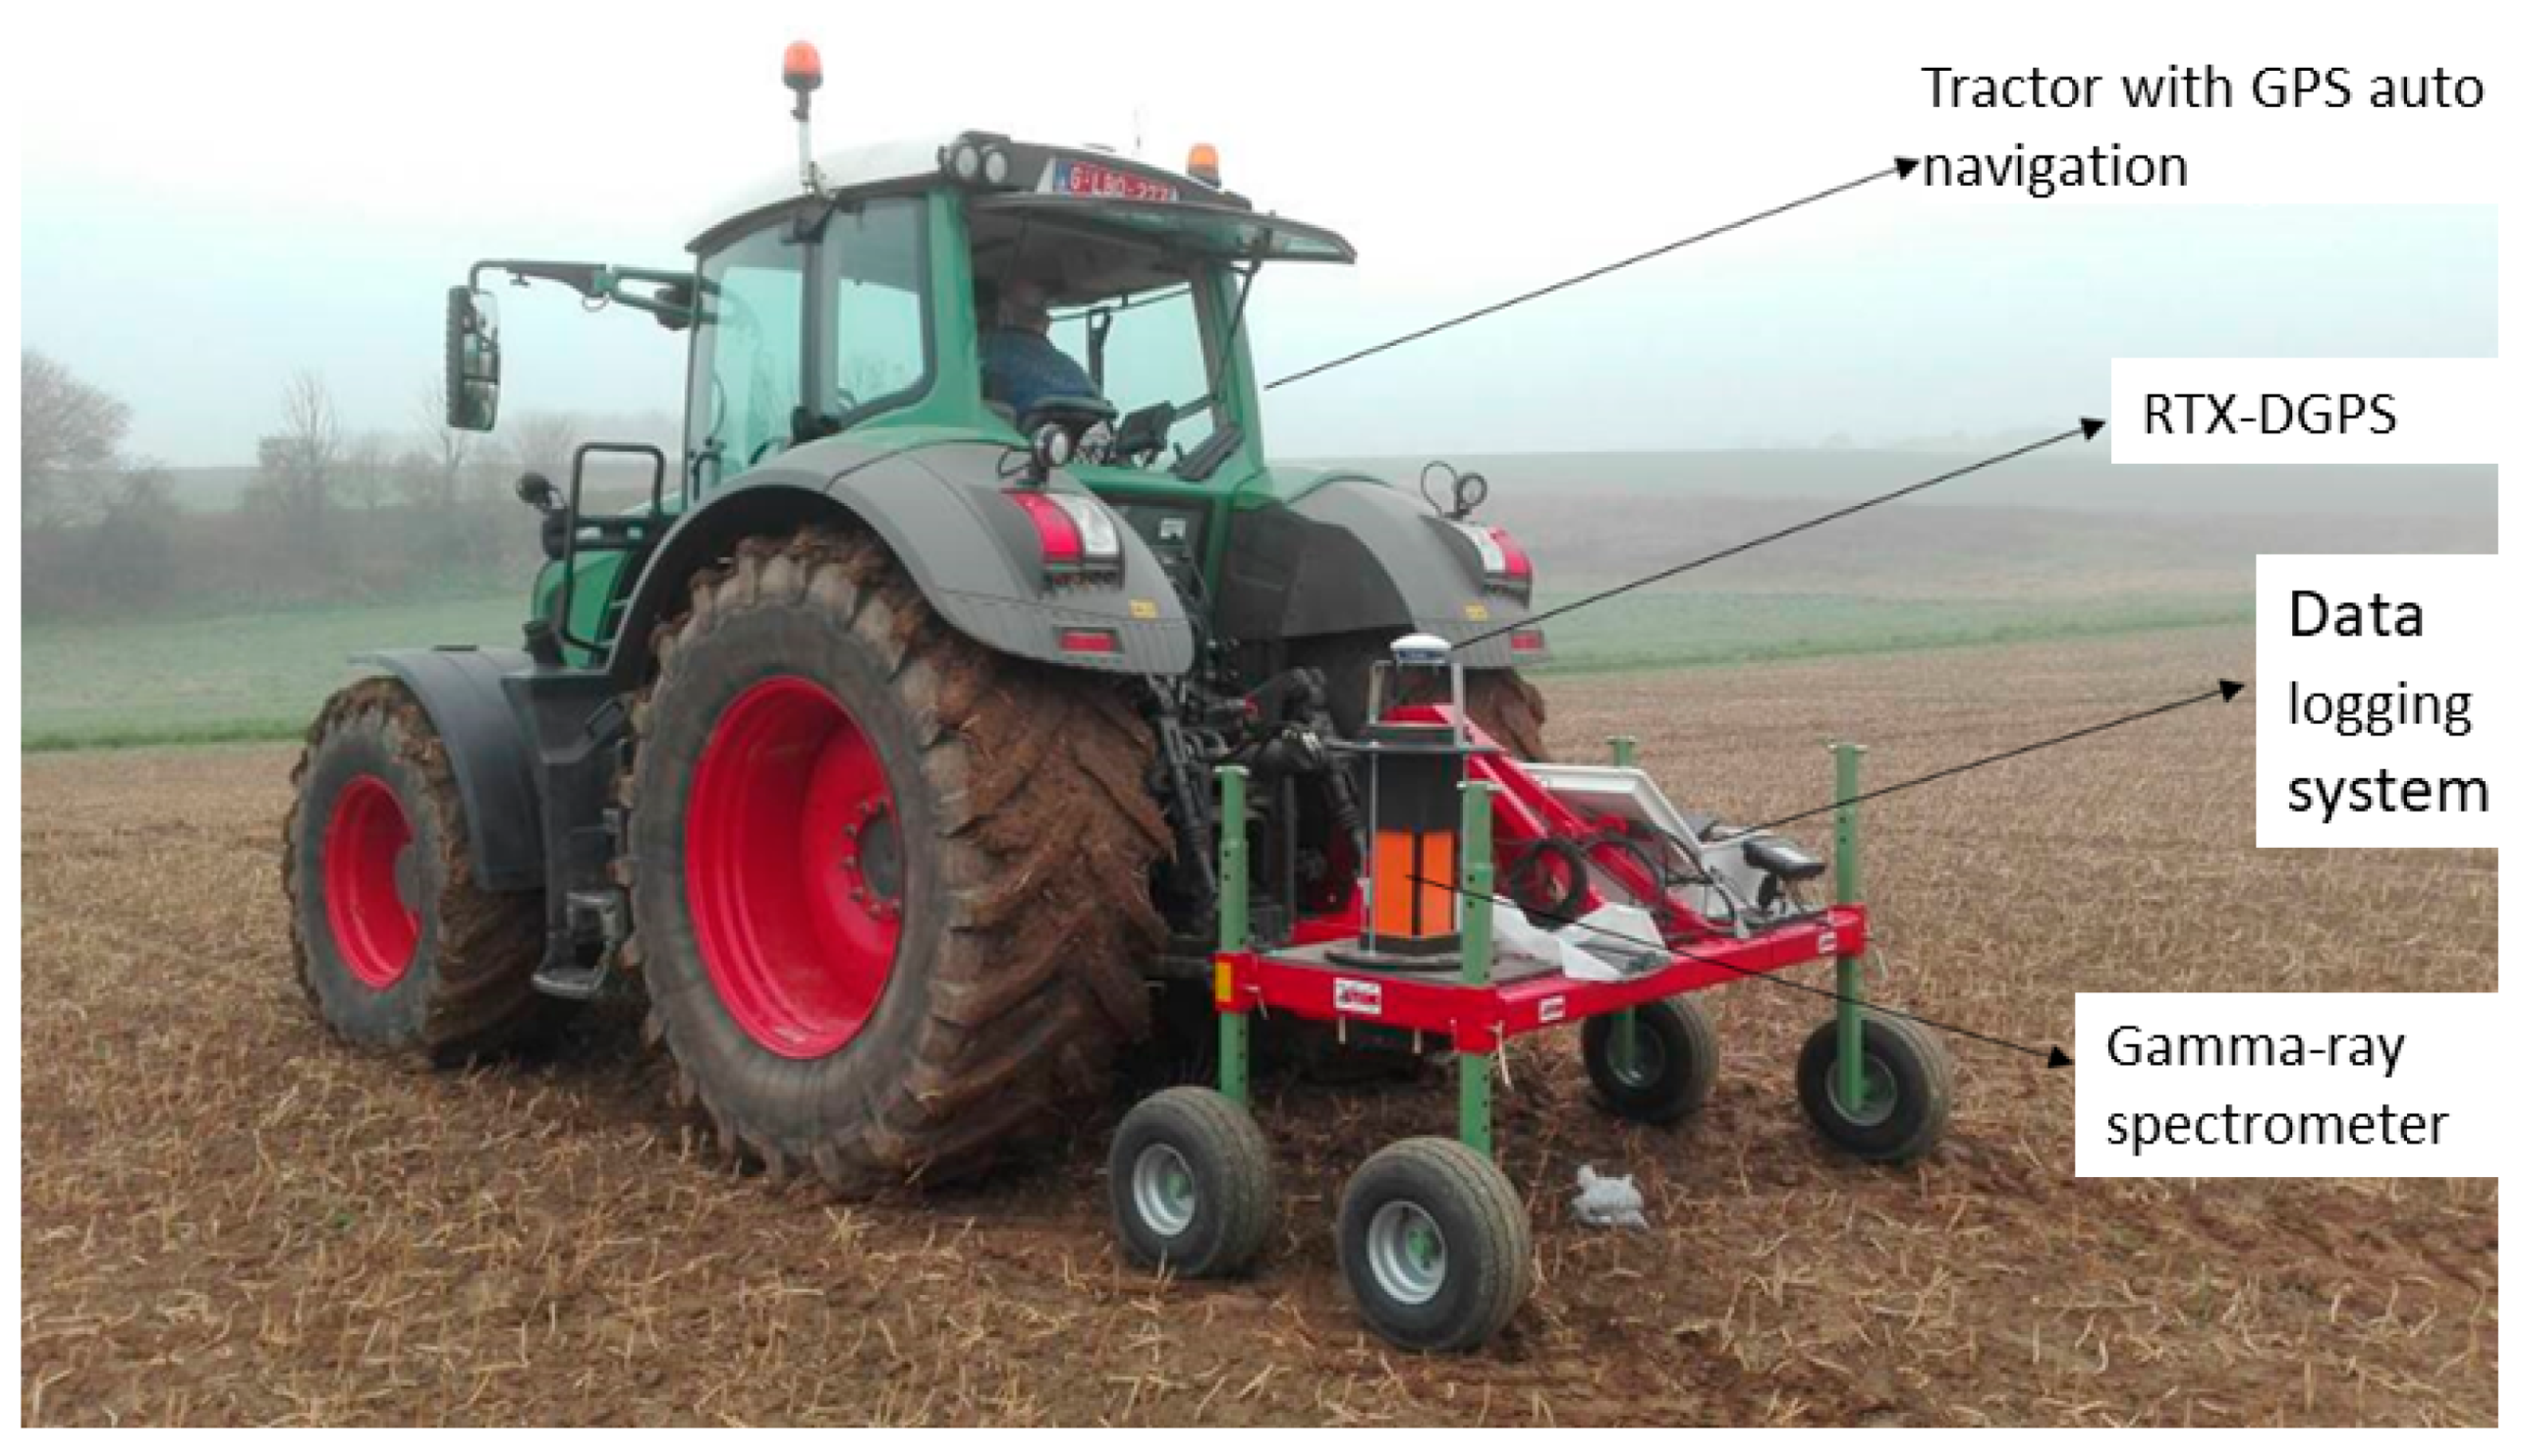
2.2. On-The-Go Gamma-Ray Spectrometer and Measurement

The on-the-go measurement system designed and developed to measure the gamma-ray radiation consisted of a Gamma Surveyor (GS) Car portable gamma-ray spectrometer (GF Instruments, Brno, Czech Republic), fixed to a metal frame, which was attached to a tractor by means of the three-point linkage (Figure 2). The spectrometer had a 4 L NaI(Tl)-crystal, automatic peak-stabilization detector, with 512 channels and an energy range between 100 keV and 3 MeV. It was powered by a 12 V DC power supply that can be supplied from a tractor or an independent battery. Along with the gamma-ray data, sampling position was recorded with a differential global positioning system (DGPS) (CFX-750 RangePoint RTX, Trimble, CA, USA), with 30 cm accuracy. The DGPS data output was synchronized with the gamma-ray data, and was recorded in one text file for data processing and analysis. Figure 2 shows the on-the-go measurement setup with the gamma-ray sensor.
On-the-go measurement followed by soil sampling was conducted in the spring of 2018. During the on-the-go measurement, a 5 s sampling interval for gamma-ray measurements was used. Data quality of the calculated concentration of radioactive decay of isotopes improves with measuring time at a point [23]. Thus, the speed of measurement is an important parameter to set correctly for gamma-ray measurements in order to collect sufficient total counts to enable successful spectral analysis. Therefore, the on-the-go data were recorded at a speed of 3 km/h. The measured count per seconds (cps) was converted for each data point into concentrations of K-40 (%), Th-230, and U-238 (ppm) using the supplier’s software (GF Instruments, Brno, Czech Republic). The sensor was driven along parallel lines of 10 m gap intervals between neighboring lines.

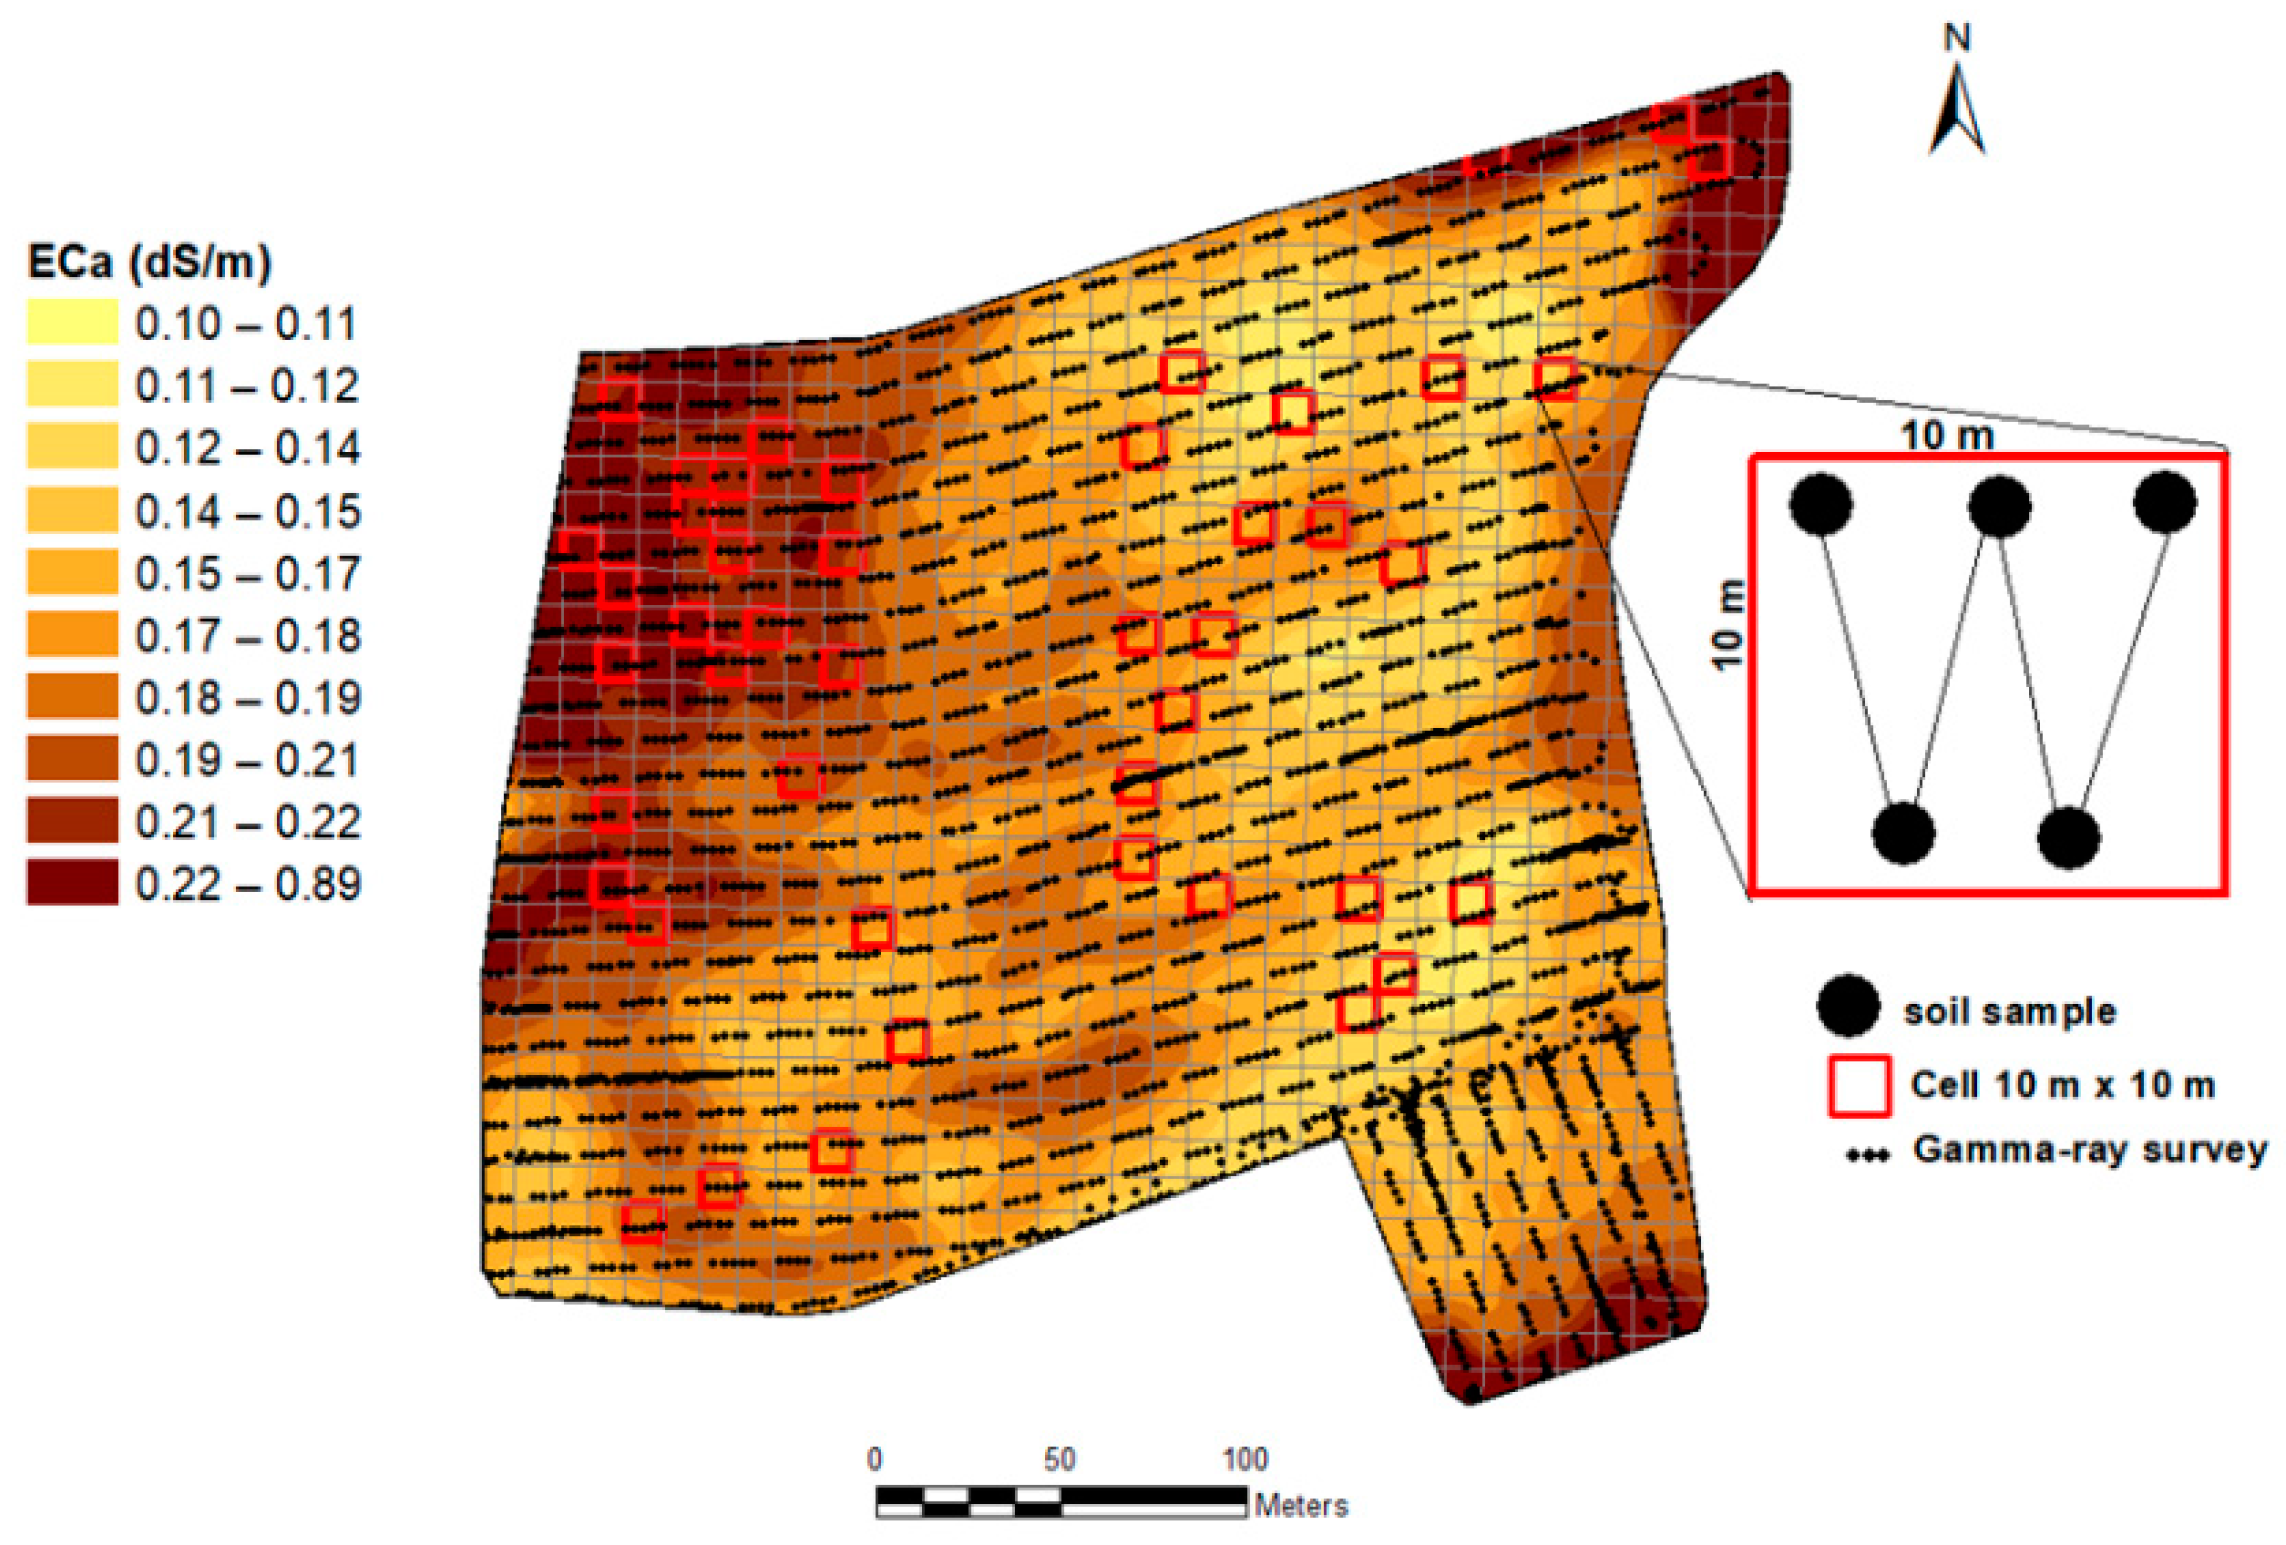
2.3. Soil Samples and Laboratory Analysis

A total of 45 soil samples (5 samples/ha) were collected during the on-the-go measurement of VH field, to be used for Ka analysis. The positions of samples to be collected were defined in advance based on the measurement of the apparent electrical conductivity (ECa) maps measured in the previous year using an electromagnetic induction sensor (EMI) connected to a quadbike. The ECa maps enable exploring the within field variability, hence, ECa is frequently used in research and commercially to determine locations in the field where soil nutrient levels differ [5,24,25,26]. Because ECa can directly measure key soil properties, such as soil water content, cation exchange capacity (CEC), and texture [27,28], it has the potential to identify management zones with differing productivity potential and nutrient requirements [26,29]. The field was divided into 10 m by 10 m cells, as illustrated in Figure 3. Static gamma-ray point measurements were taken during the on-the-go measurement, whereas the instrument was placed at each cell for 5 min at the same position. At each position, a composite sample of five surface sub-samples (0–30 cm), was collected using the W-shape sampling protocol over a square area of 100 m2 (10 m by 10 m) (Figure 3). Another set of soil samples were collected each as a composite sample over 1.2 m distance and 0–20 cm depth, from three other fields, e.g., Kouter (Huldeberg, Flanders, Belgium), Beers and Watermachine (De Panne, Wallonia, Belgium) (Table 1). This was done in order to acquire large number of samples, necessary for running PLSR analysis. These three fields were referred to as “sampling fields”, whereas the VH field was termed the target field.
The collected samples were transferred to the Soil Survey of Belgium (https://www.bdb.be/), to be analyzed for pH, total organic carbon (TOC), and available potassium (Ka), sodium (Na), calcium (Ca), magnesium (Mg), and phosphorous (P). Soil pH was measured in the supernatant, after shaking and equilibration for 2 h in mol/L potassium chloride solution (KCl), using a 1:2.5 soil:solution ratio. TOC was determined using the dry combustion following Dumas principle (ISO 10694; CMA/2/II/A.7; BOC). For the determination of TOC content, total inorganic carbon (TIC) compounds are removed in advance by treating a soil sample with hydrochloric acid. The TIC-free sample is then heated to 900 °C and the amount of organic matter in the sample is oxidized and converted to CO2. The amount of CO2 is measured by a solid state nondispersive infrared detector, and the results are reported as TOC content in both the mass and concentration of carbon. The available K, P, Ca, Na, and Mg were measured in ammonium lactate extract with inductively coupled plasma atomic emission spectroscopy (ISO 11885; CMA 2/I/B1).

2.4. Analyses

Two type of analyses were used, namely, univariate and multivariate, to establish relationships between the Ka and K-40 and Ka and gamma-ray spectra, respectively, as detailed below.

2.4.1. Univariate Analysis

The correlation between the Ka contents (mg 100 g−1) and K-40 values (%) produced by the gamma-ray sensor at the static position was evaluated using a simple non-linear regression. The 45 gamma-ray output readings of K-40 and the corresponding measured Ka values were fit to different polynomials, and the best fit that resulted in the highest R2, was a third order non-linear polynomial function (3DPF), which allowed the calculation of Ka values in (mg 100 g−1), as a function of the static and on-the-go measured K-40 (%).

2.4.2. Multivariate Analysis

A gamma-ray spectral dataset was established from measurements carried out at the three sampling fields and the target VH field. The Ka models were developed for the target field (e.g., VH field) in this study, based on the following data sets (Table 1):
  • Dataset collected from the VH field only, using the W-shape sampling method in Figure 3. This dataset was designated as single (target) field (SF) (n = 45),
  • Dataset combining samples from two fields, e.g., 45 samples from the VH field and 5 samples from the Bottelare field. This dataset was designated as single field-combined with Bottelare field (SF-CB) (n = 50 samples).
  • Spiking of soil samples from the VH field (25 samples) into the soil spectral library, collected from Bottelare and other three fields. This dataset was designated as single field-spectral library (SF-SL) (n = 138 samples).
The gamma-ray spectra were used instead of the sensor output reading of K-40 (%) to develop the PLSR calibration model of Ka. Before, PLSR, the gamma-ray spectra were first subjected to pre-processing. First, noise was removed at both edges of each spectrum, by cutting the spectra to 1000–3113 keV. Then, spectra were subjected to first derivation using a gap derivative [30], with a second-order polynomial approximation and windows of 5 keV. Finally, maximum normalization was followed, which is typically used to transform all data to approximately the same scale, or to obtain a more even distribution of the variances and the average values. The pre-processing of gamma-ray spectral data was carried out using prospectr-R package [31].
The pre-processed spectra were pulled together with the measured Ka in one matrix, and the output matrix was subjected to PLSR. PLSR is a widely used multivariate analysis method in spectroscopy, which was introduced by Wold et al. [32]. The algorithm uses a linear multivariate model to relate two data matrices, namely, the predictor variables, X (Gamma-ray spectra), and the response variables, Y (Ka). Information in the original X data is projected onto a small number of underlying orthogonal (“latent”) variables called latent variables. The processed gamma-ray spectra with 470 variables were used in this study. PLSR with leave-one-out cross-validation (LOOCV) was used to relate the variation in a single-component variable (Ka) to the variation in a multi-component variable (e.g., gamma-ray spectral variables), using the package “pls”, available in R software (R Core Team, 2013). The optimal number of latent variables was determined as the number of factors that resulted in the smallest root mean square error of cross-validation (RMSECV) and highest R2. Three PLSR analyses were run for the three calibration sets, namely, SF, SF-CB and SF-SL, and the quality of the output was compared to determine the best performing dataset.

2.4.3. Evaluation of Model Accuracy

Model accuracy for predicting Ka content was evaluated by means of R2, RMSECV, ratio of prediction deviation (RPD) (standard deviation of laboratory measured values divided by RMSE) and the ratio of performance to interquartile distance (RPIQ). In general, a good model prediction should correspond to high R2, RPD and RPIQ, and low RMSECV values. In particular, the model classification criterion adopted in this study were based on RPD values, which were divided into six classes: of excellent (RPD > 2.5), very good (RPD = 2.5–2.0), good (RPD = 2.0–1.8), fair (RPD = 1.8–1.4), poor (RPD = 1.4–1.0), and very poor model (RPD < 1.0) [33].

2.5. Development of Measured and On-The-Go Predicted Ka Map

Three types of soil maps have been produced, namely, a map of the measured Ka (n = 45), a map of on-the-go gamma-ray predicted Ka, resulted from the 3DPF, and a map of on-the-go predicted Ka, resulted from PLSR. In addition, the K-40 map was also developed and compared with the other three maps detailed above. Maps were developed with ArcGIS version 10.5 software (ESRI, Redlands, CA, USA) with kriging after semi-variograms analysis.

2.6. Development of K2O Fertilizer Recommendation Maps

Using the on-the-go predicted Ka values of all measured points, maps for K2O fertilizer recommendations were developed, using ArcGIS 10.5 software (ESRI, Redlands, CA, USA). Based on data of the measured Ka (n = 45), the formula (Equation (1)) for potassium fertilization recommendation was derived from the obtained correlation (R2 = 0.97) between Ka values in mg 100 g−1 and the recommendation in K2O in kg/ha, adopted by the soil survey of Belgium.
K 2 O =   0.0882 K a 2 1.8183 K a + 322.3

3. Results

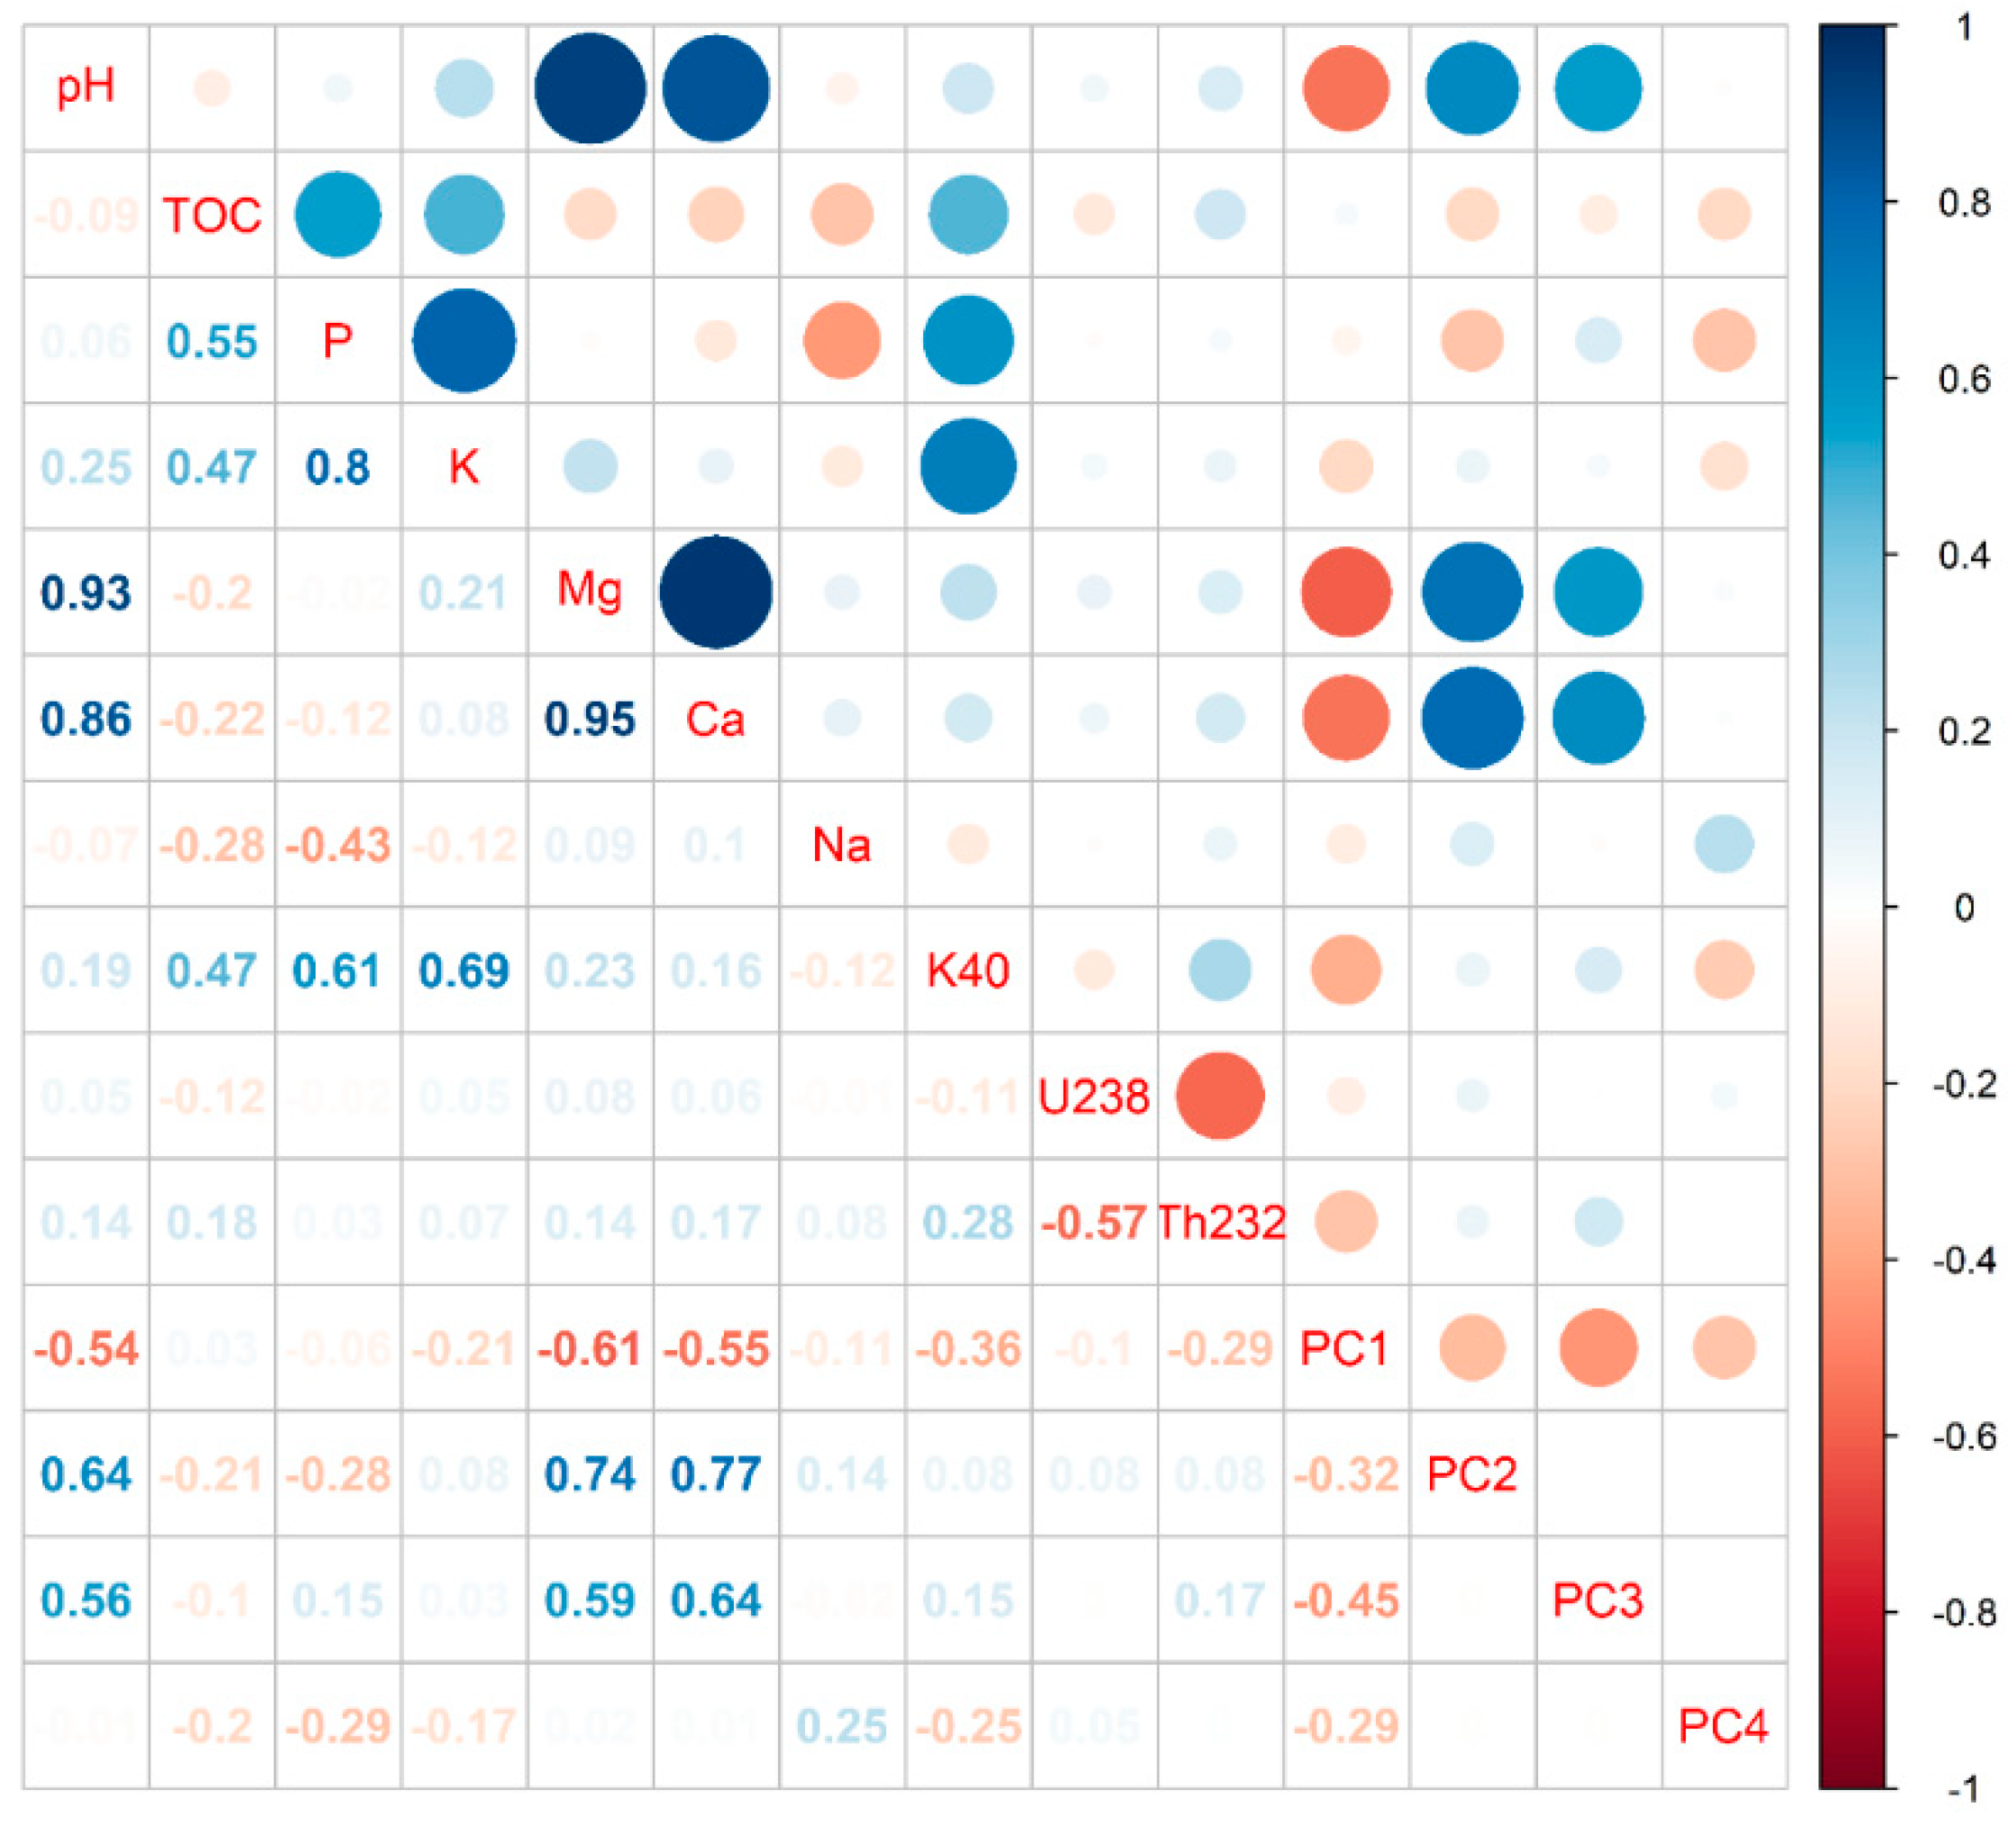
3.1. Soil and Spectral Analysis

The descriptive statistics of the measured soil properties are presented in Table 1. Results showed rather small variability within the target field (SF dataset), with rather small ranges between minimum and maximum values of all soil properties. For example, Ka content ranged between 19 mg 100 g−1 and 52 mg 100 g−1. This is also the case for Ka content of both SF-CB and SF-SL datasets that have small range with slightly lower minimum value of 10 mg 100 g−1 for SF-SL dataset. TOC varied between 0.8% and 2.0%, which also reflects the small variability of the silt loam soil texture. The measured K-40 ranged between 0.1% and 1.1% with average and standard deviation values of 0.47% and 0.16%, respectively (Table 1). The range and average values fall within the lowest range of those measured at a global scale (0.14–5.4%, and 0.2–5.2%), reported by other authors [34,35], and are almost one third of the world average values of 1.3% [36].
The correlation analysis between the measured soil properties and the sensor data are shown in Figure 4. The highest positive correlation (p < 0.001) was observed between Ca and Mg (Pearson correlation coefficient (r) = 0.95), followed successively by correlations between pH and Mg (r = 0.93), pH and Ca (r = 86) and Ka and P (r = 0.88). The correlation between Ka and other soil properties (e.g., pH, Mg, Ca, and Na) are very weak, except for TOC (r = 0.47). Another moderate correlation was observed between TOC and P (r = 0.55). The correlation between K-40 and Ka, P, and TOC were moderate but significant (p < 0.001), with r values of 0.69, 0.61, and 0.47, respectively. Very weak positive and negative correlations were observed between U-238 and the measured soil properties, and the same was observed for Th-232 data. Likewise, negative moderate correlations were observed between the first three principal components (PCs), obtained from a principal component analysis (accounting for 99% of variations in the spectral data) and the measured Ca, Mg, and pH values, while the correlations between PCs and Ka were very weak (Figure 4).

3.2. Modeling Results with the Univariate and Multivariate Analyses

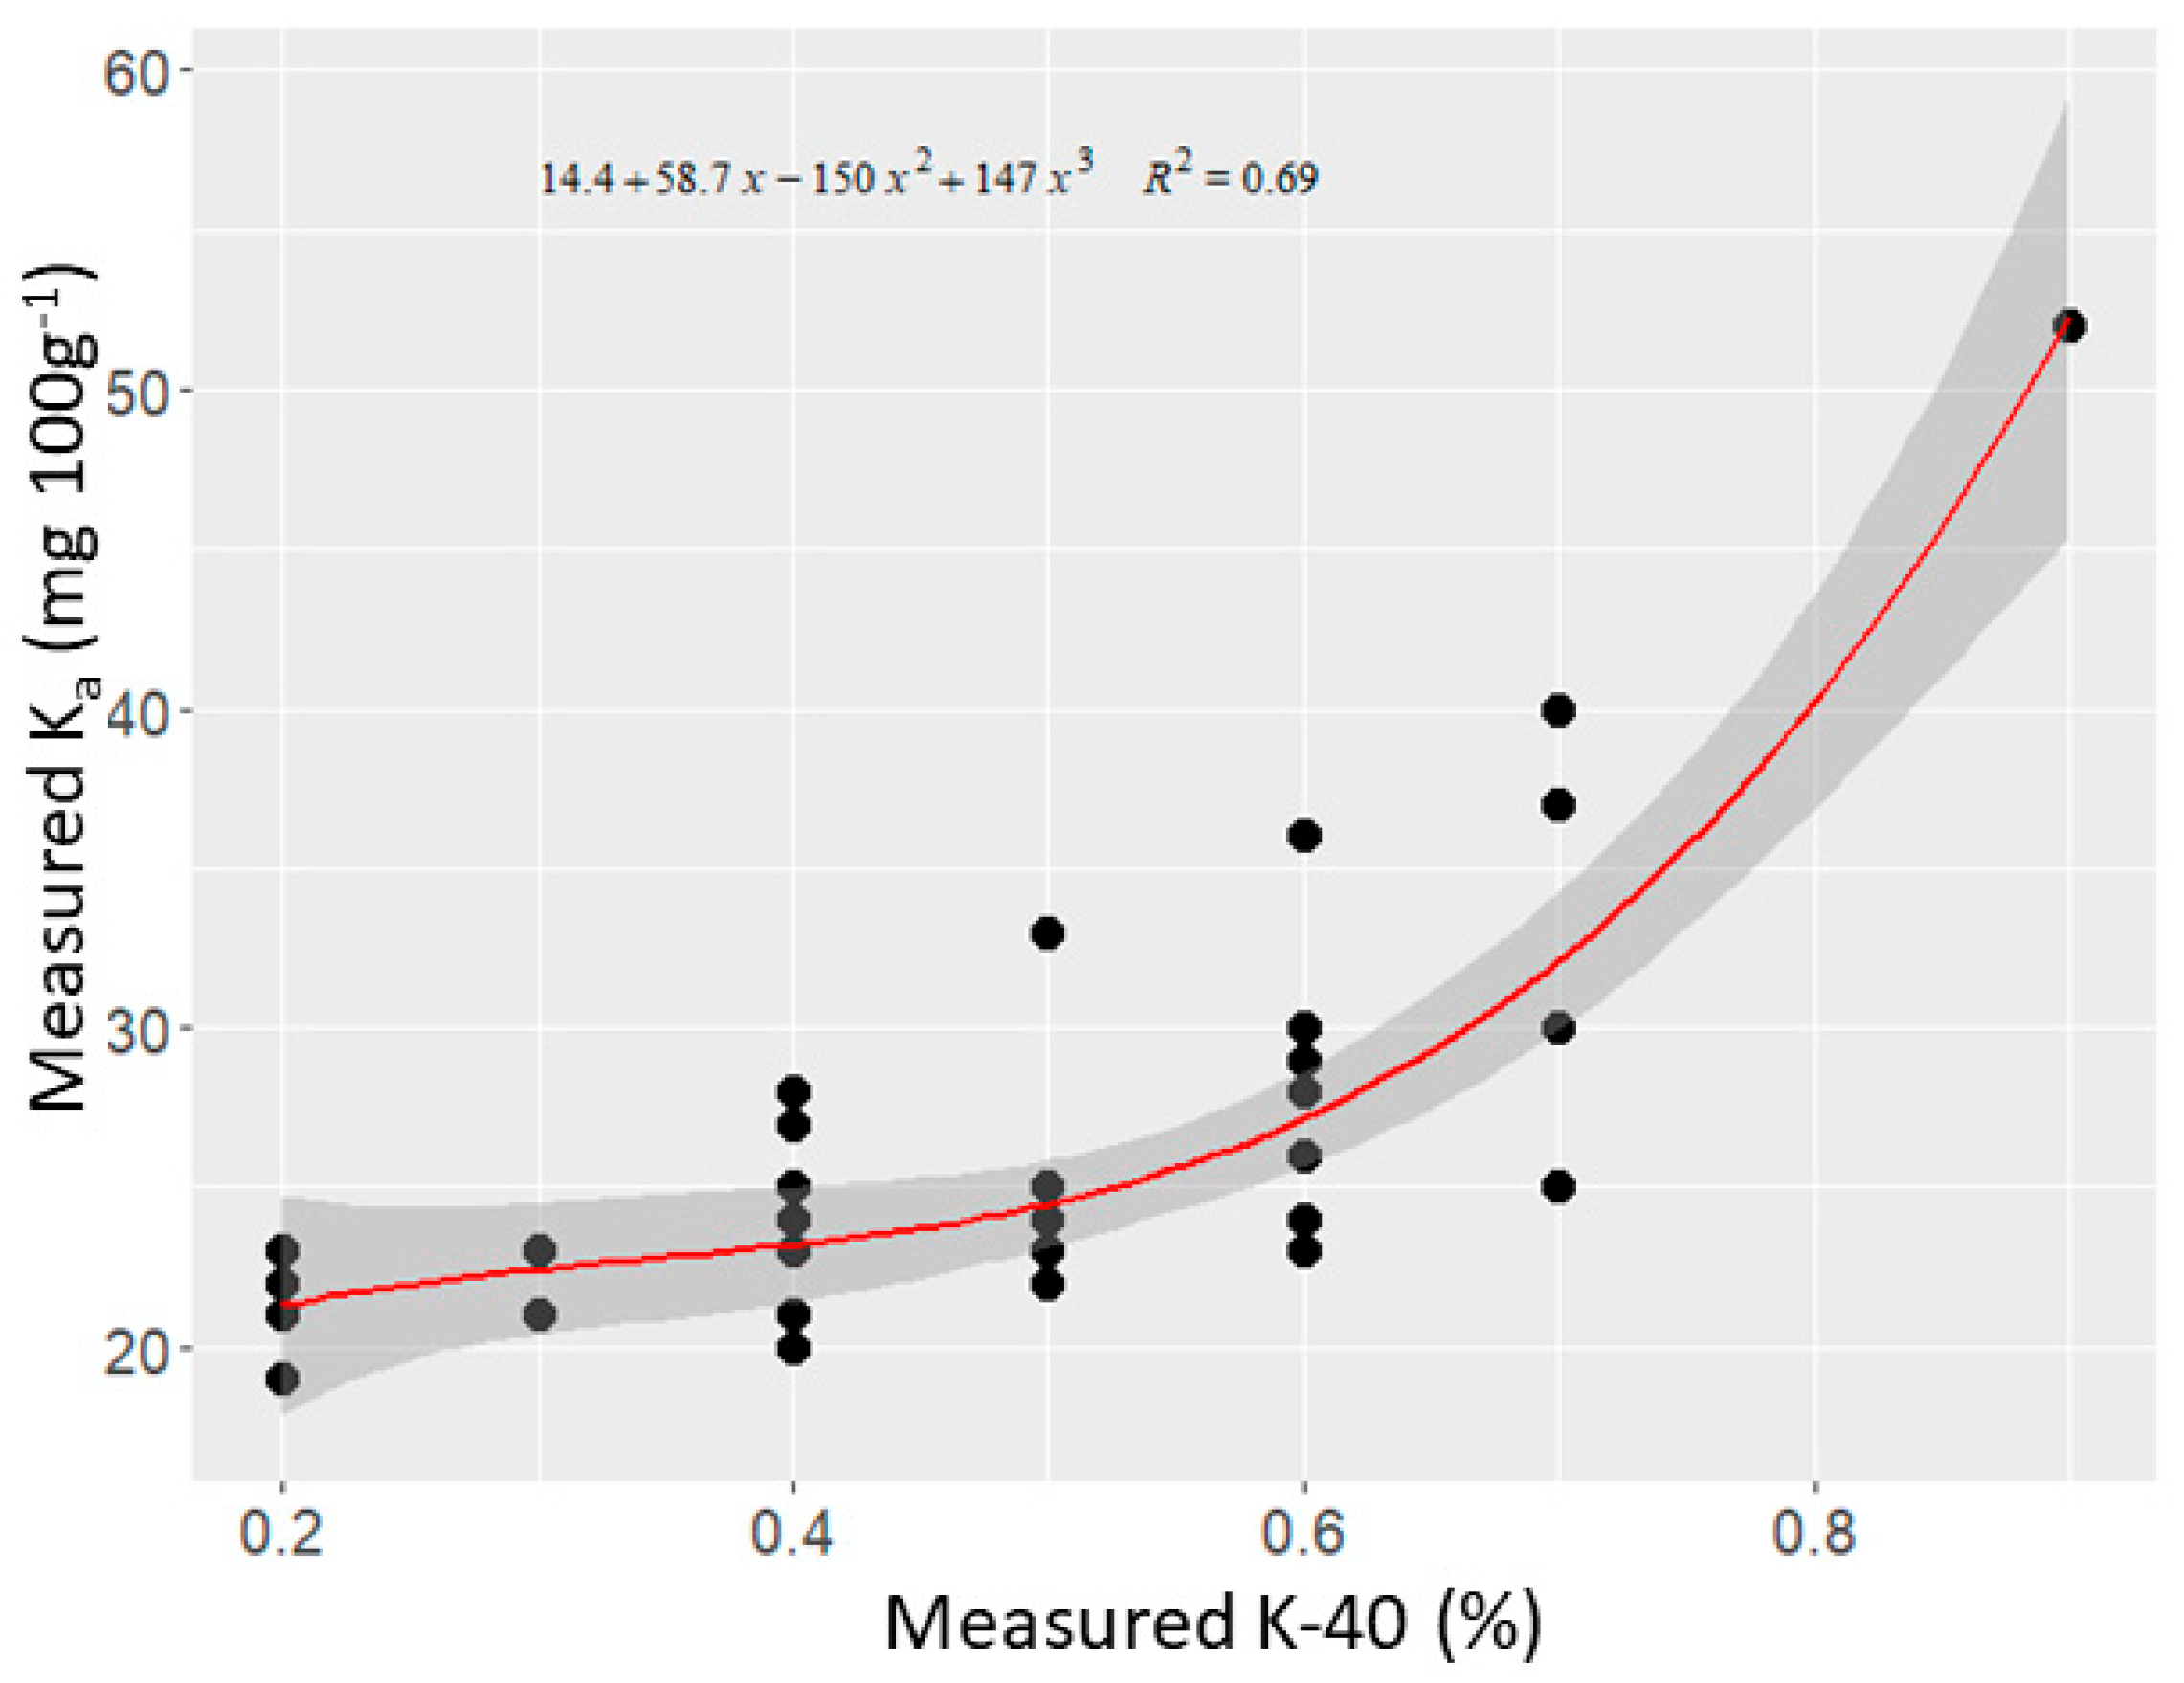
3.2.1. Univariate Regression Analysis

Different types of polynomials were tested, and the best performing one in terms of the highest R2 was chosen. The highest R2 of 0.69 was obtained with the 3DPF, as shown in Figure 5.

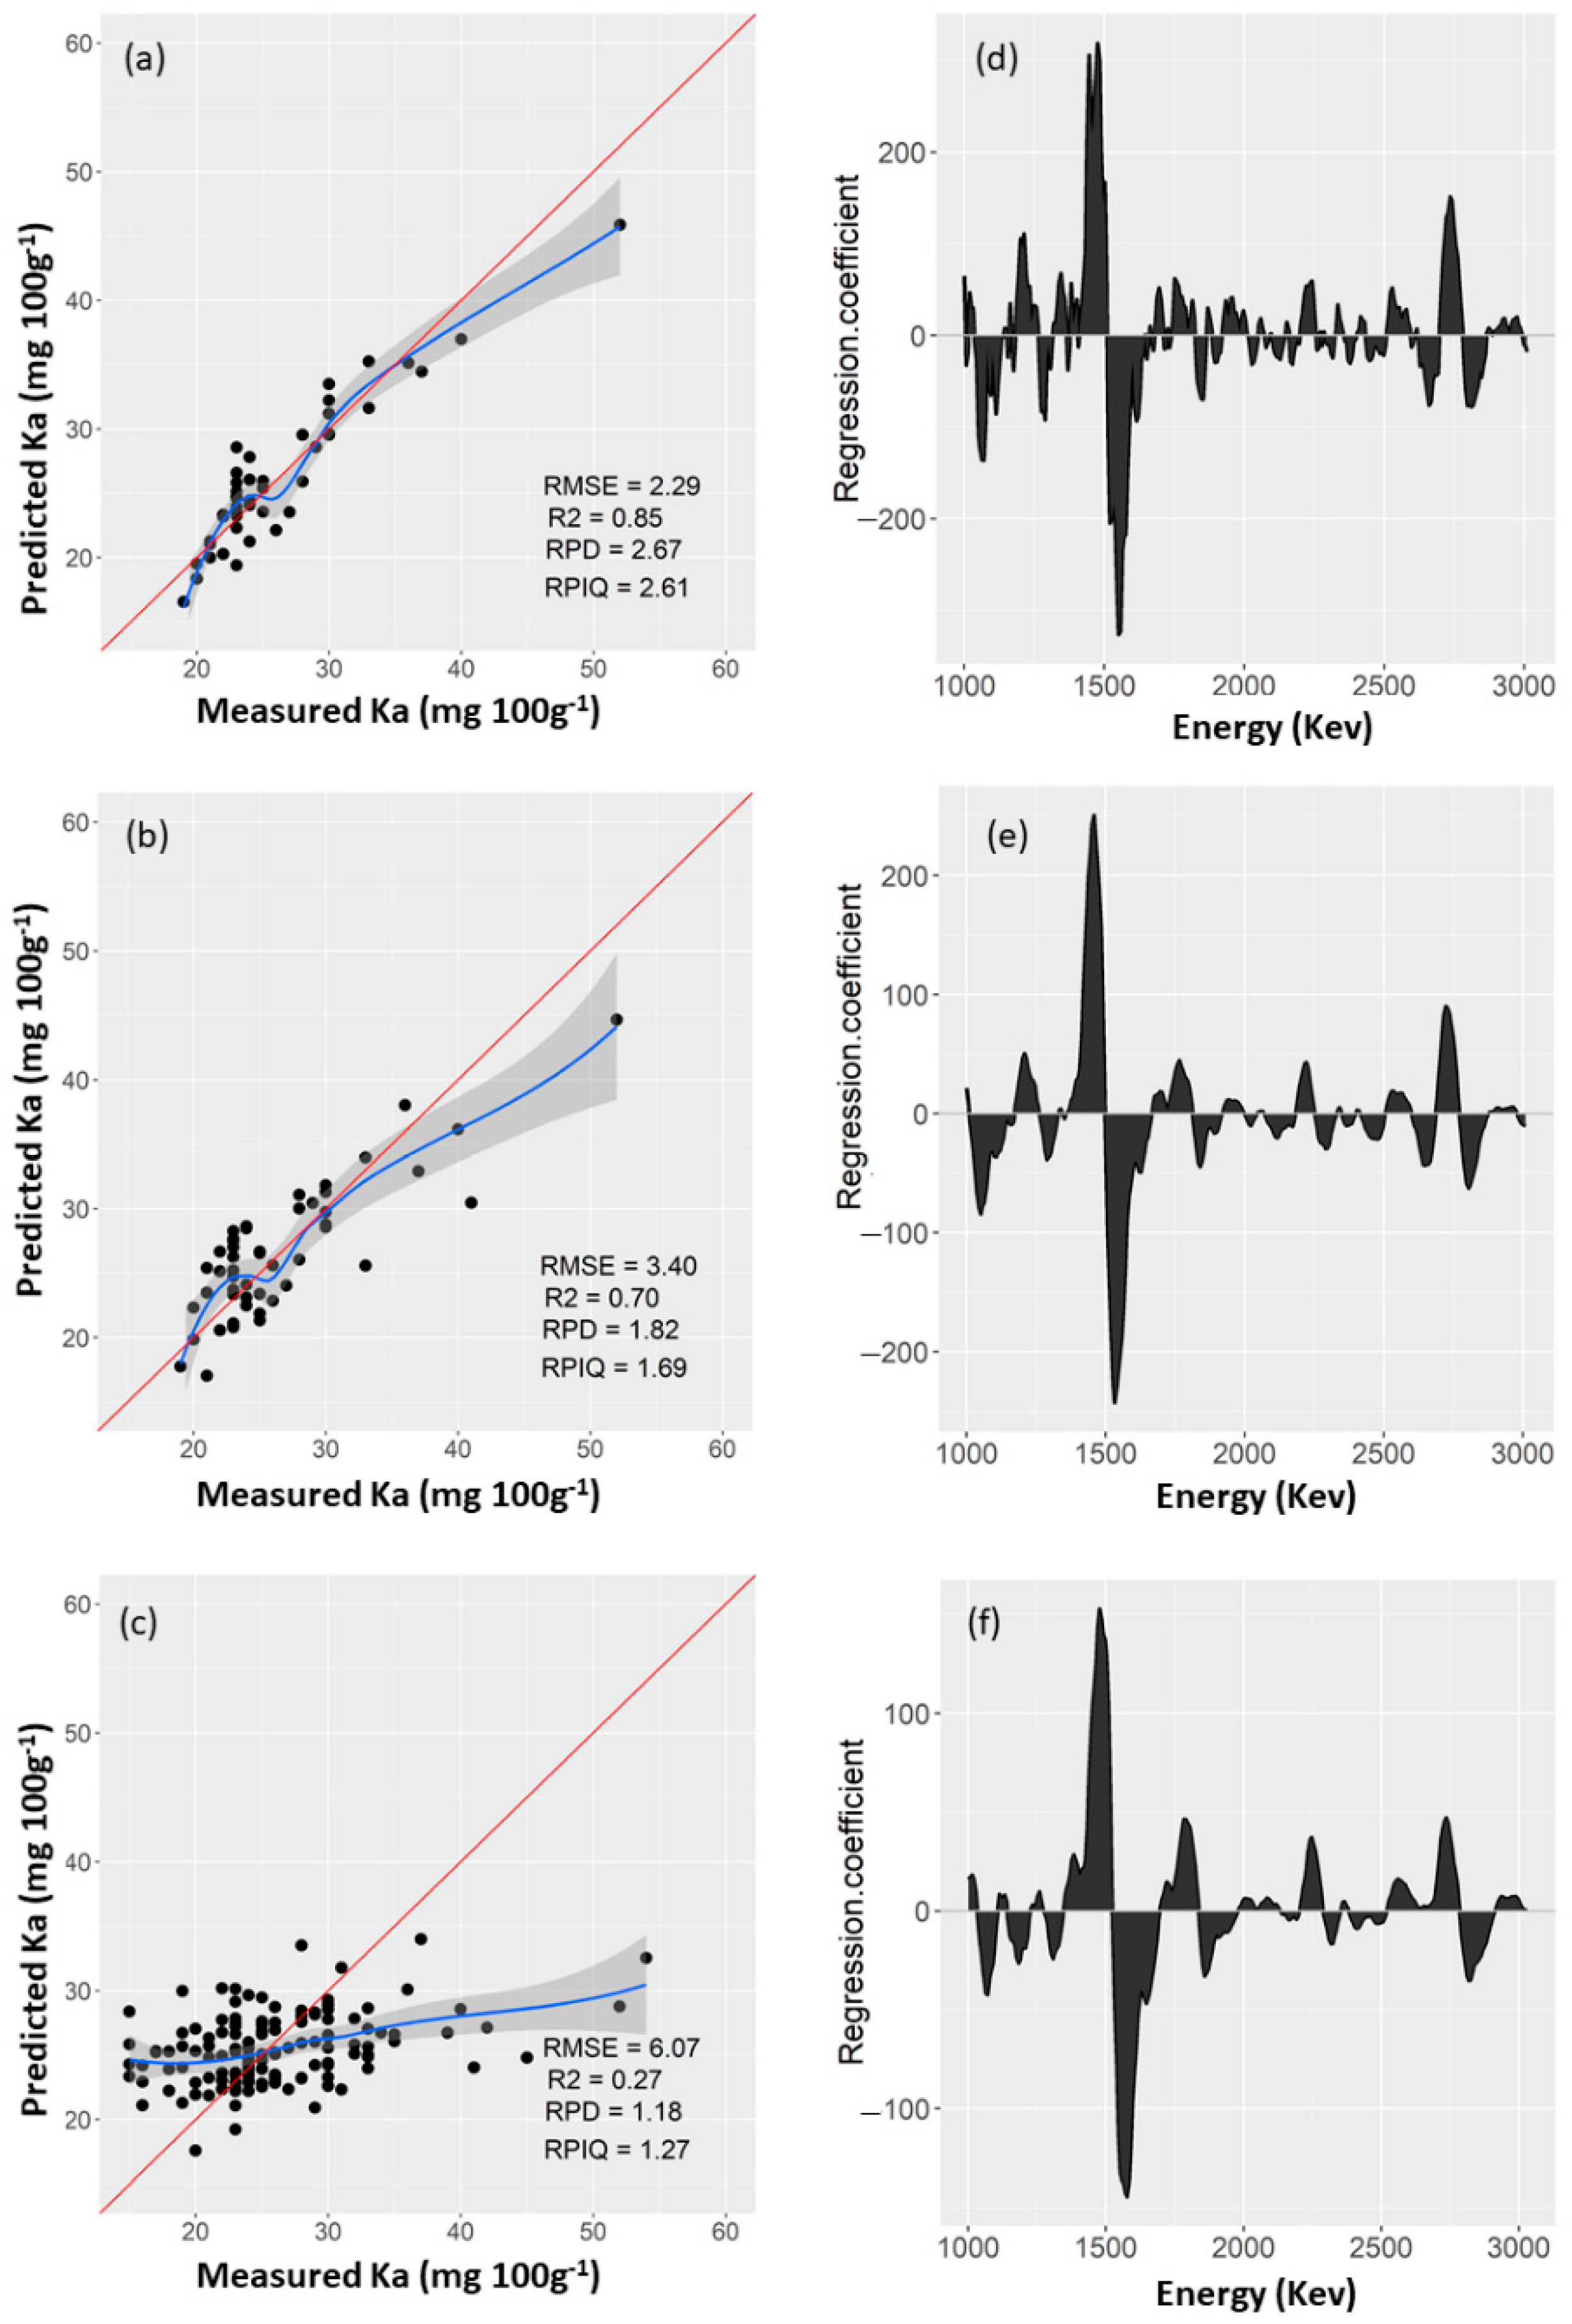
3.2.2. Multivariate Analysis
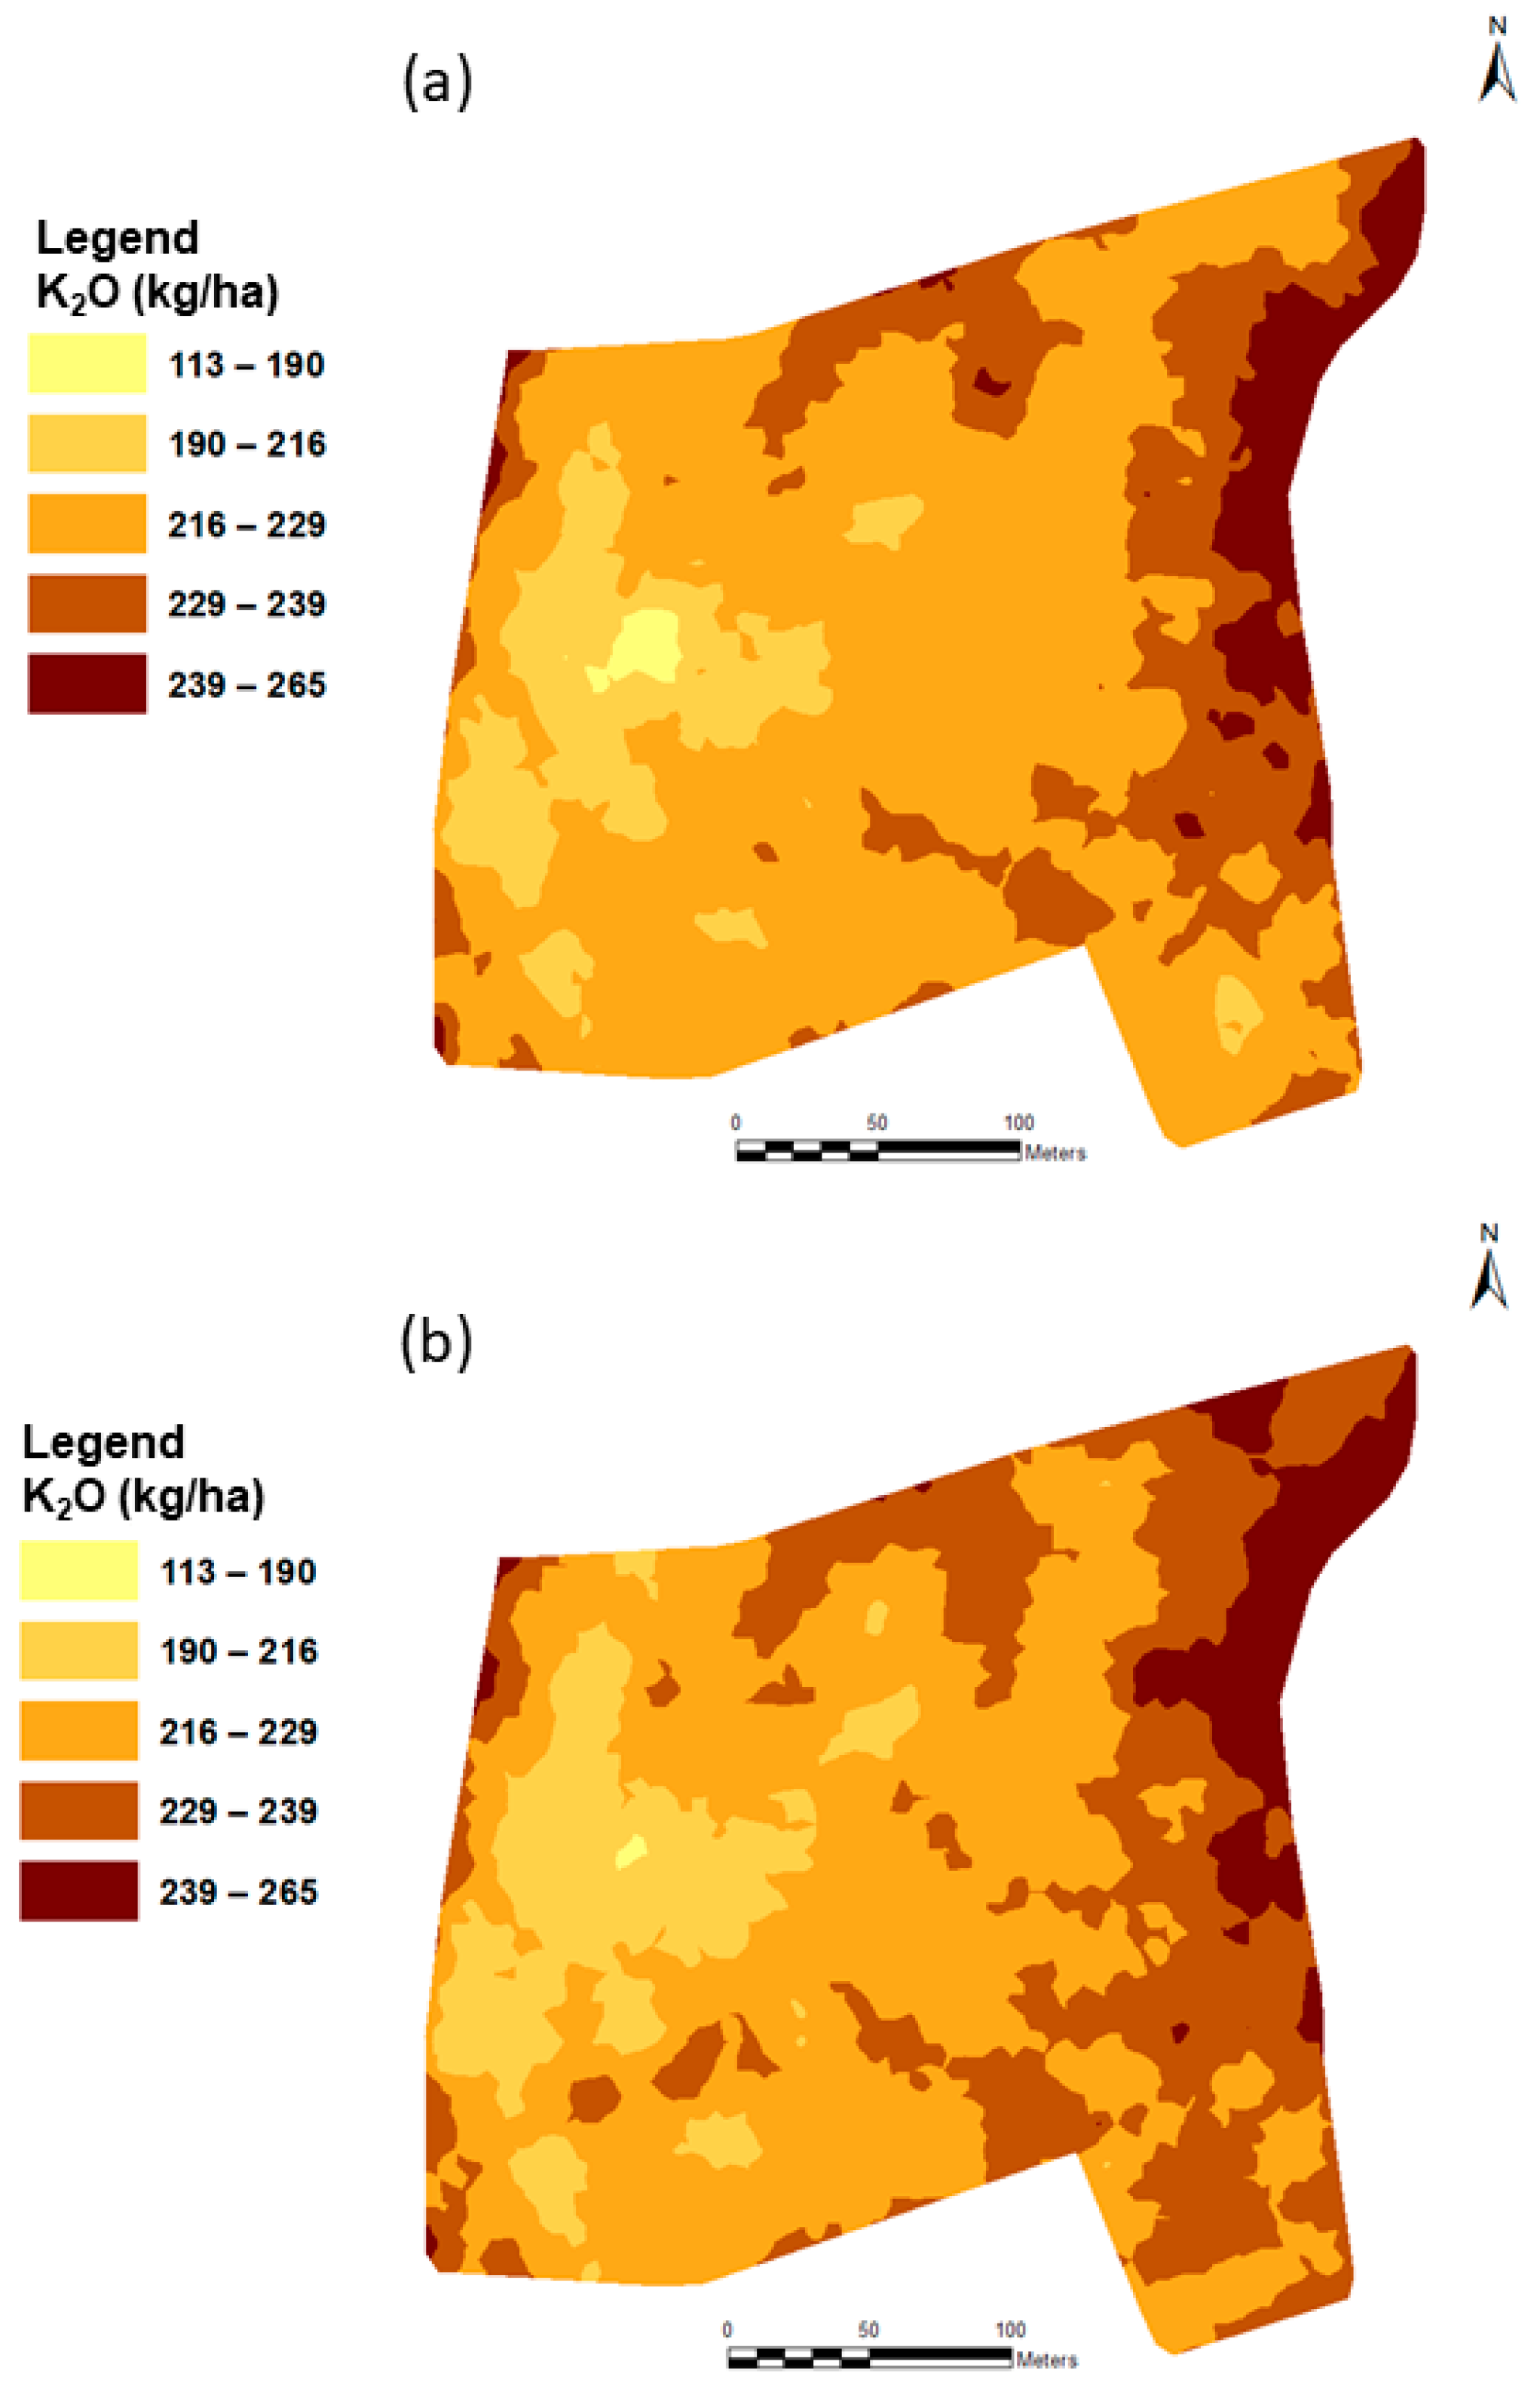
The PLSR calibration method considered in this study provides different prediction accuracies of the Ka, according to different dataset used (Table 2). The scatterplots for the measured versus predicted values are shown in the Figure 6. Examining Table 2 and Figure 6, one can conclude that the best result is achieved based on the SF dataset with R2 = 0.85, RMSECV = 2.29 mg 100 g−1, RPD = 2.67 and RPIQ = 2.61. Using the additional five samples from the Bottelare field (SF-CB) does not improve the accuracy but on the contrary, the accuracy deteriorated (R2 = 0.70, RMSECV = 3.4 mg 100 g−1, RPD = 1.82 and RPIQ = 1.69). The poorest modeling results were obtained with the SF-SL dataset with R2 = 0.27, RMSECV = 6.07 mg 100 g−1, RPD = 1.18, and RPIQ = 1.27.

3.3. Soil Maps

The collected soil samples (45) from the target HV field that were analyzed for Ka (Figure 7a) were used to develop the map of measured soil Ka (Figure 7b). This map was classified into six classes from a minimum of 19 mg 100 g−1 to a maximum of 52 mg 100 g−1, based on the geometric interval classification method. The same classification method was applied for all maps in order to allow for spatial comparison to be made. The measured Ka map shows the highest concentration at the western part of the field and this gradually decreases towards the eastern part.

3.3.1. Map of Measured Soil K-40 from Gamma-Ray Spectrometer Output

The number of on-the-go measured points in the target HV field of the 8.4 ha area is 3291, which is much larger than the number of points used in measured Ka (45 points), shown in Figure 7b. The on-the-go measured K-40 in Figure 7c shows six classes that range from 0% to 1.1%. The spatial distribution of K-40 is similar to that of the laboratory measured Ka, shown in Figure 7b, in that the zones in the field with high values of K-40 align with those with high concentrations of the laboratory measured Ka. It is clearly demonstrated, and in-line with the measured Ka map, that the highest K-40 concentration is in the bottom side of the western part of the field, and this gradually decreases towards the eastern end. Compared to the ECa map shown in Figure 3, one may observe spatial similarity, which is encouraging to suggest the potential use of the on-the-go gamma-ray technique for future mapping of not only Ka but perhaps, soil variability and texture, which is also reported in the literature as being possible.

3.3.2. On-The-Go Predicted Maps of Ka

Based on the 3DPF model in Figure 5, the on-the-go predicted Ka values are used to develop the on-the-go maps shown in Figure 7d, using all 3291 on-the-go collected readings. The spatial distribution is similar to those of K-40 (Figure 7c) and ECa maps (Figure 3). Most importantly, the spatial distribution of Ka is also similar to that of the measured map of Ka (Figure 7b). Again, the concentration of Ka increases from the eastern side towards the western side of the field, and is attributed to the increase in slope along this direction. It can also be noticed that a similar spatial distribution pattern of PLSR predicted by on-the-go Ka map—shown in Figure 7e—is observable not only in the on-the-go predicted map based on the 3DPF model, shown in Figure 7d, but also in the measured Ka map in Figure 7b. This is also in agreement with the spatial distribution of the ECa map shown in Figure 3. The spatial similarity of the measured versus predicted maps is, indeed, encouraging and suggests that the gamma-ray sensing technology holds promising potential for the measurement and mapping of Ka, if a proper sampling strategy is followed, where the sampling area (e.g., 10 m by 10 m) matches the active area, over which the natural radioactive electromagnetic waves are collected by the gamma-ray sensor during measurement.

3.4. Fertilization Recommendation

The amount of K2O fertilizer calculated by Equation (1) for different methods of Ka measurement is shown in Figure 8 and Table 3. This table compares recommendations for K2O between the laboratory measurement versus on-the-go predicted Ka. Table 3 also compares the calculated on-the-go K2O recommendation based on the 3DPF prediction versus PLSR prediction of Ka. Results show that the amount of K2O recommended based on the on-the-go predicted Ka with 3DPF is very similar (216.0 kg/ha or 1814.4 kg/field) to that of the measured Ka (217.2 kg/ha or 1824.5 kg/field). Only a slight decrease in the amount of recommended K2O of about 10.1 kg/field, is calculated, as compared to the homogeneous rate recommendation with the measured Ka. On the other hand, the recommendation based on the PLSR prediction has resulted in slightly higher amount of K2O of 218.7 kg/ha or 1837.0 kg/field. The PLSR recommendation (Figure 8b) was larger than that of the polynomial recommendation (Figure 8a).

4. Discussion

4.1. Univariate Analysis

The moderate correlation (e.g., r = 0.69) between K-40 and Ka obtained in the current study using 3DPF is expected and can be attributed to the dominant light soil texture (silt loam). Dierke and Werben [18] found a similar significant correlation between Ka and K-40 (r = 0.67, p < 0.05) in a cropping field with light sandy soil in Corrigin, Western Australia, concluding that K-40 can provide accurate estimates of Ka. The result of the univariate analysis is in line with the result reported by Dierke and Werben [18], using ordinary least squares regression of the logarithms transformation of Ka and K-40 with regression coefficient (rho) of 0.64. A higher correlation between Ka and K-40 (r2 = 0.93) has been reported by Wong et al. [14] and Pracilio et al. [15] for dry soils with a high range of clay content (around 35–37%) in Western Australia. However, Dierke and Werben [18] have found no correlation between K-40 and Ka in a site located at Saxony-Anhalt, central Germany, with a low range of Kt content (2.3–2.45%), concluding that K-40 could be a useful parameter for the estimation of Ka in soils, if Ka is a major proportion of the Kt. This indicates that successful univariate correlations between Ka and K-40 will depend mainly on the degree of variability in a field in addition to soil texture. A global correlation should be attempted to account for the different range of variability and soil types.
Several factors can influence the accuracy of gamma-ray measurements, such as soil moisture content (MC), air temperature, and background radiation [5]. Generally, high MC with increased soil bulk density can decrease the radiation flux, especially in K and Th decay series [37]. Water causes attenuates of radiation, and an increase in MC of 1% due to rainfall will decrease the measured nuclide concentration by the same amount [38]. Moreover, a negative linear relationship exists between MC and the measured nuclide concentration [39]. Therefore, summer (high temperature and dry soil) is the most suitable time to obtain the maximum gamma radiation from the soil. Furthermore, it is also recommended to avoid gamma-ray measurement directly or closely after irrigation, as the proportion between K-40 and Ka may well be significantly affected and this effect will also affect the univariate relationships established between K-40 and Ka.

4.2. Multivariate Analyses

Better results were obtained with the multivariate PLSR analysis, compared to the 3DPF model. The results obtained show the potential of the on-the-go gamma-ray for the prediction of Ka, even when a limited number of soil samples are used. However, results of the combined data set (SF-CF) of two fields illustrated in Table 2 and Figure 6b show deterioration of model prediction accuracy. This can be attributed to the fact that samples were collected from two different fields. Although the model developed for Ka based on the spiked data set (SF-SL), shown in Table 2 and Figure 6c, used the largest number of samples (138 samples), this model resulted in the poorest performance, which can be attributed to the different method of collecting soil samples in the target field (SF), compared to that in the three sampling fields. In the target field, each sample was a composite sample of five sub-samples collected with a W-shape sampling scheme (Figure 3) over 10 m by 10 m cells, whereas in the three sampling fields, a sample was collected along a 1.2 m travel distance of the sensor. The latter sampling mode (SF-CB and SF-SL) resulted in misrepresentation of the actual K-40 value, as the sensor collects natural radioactive waves over an area of about 10 m by 10 m. This miss-match of the sampling area suggests the need to collect a composite sample that is representative of the entire area of a corresponding cell (e.g., attainable with a W-shape sampling scheme), from which the gamma sensor collects magnetic waves over the same area.
Adopting the RPD classification system proposed by Viscarra Rossel et al. [33], reveals that the results of SF-PLSR model is excellent (RPD = 2.67), while the performance of the SF-CB and SF-SL are good and poor, respectively. The results of the SF model are better that those reported by Viscarra Rossel et al. [10] using bagging-PLSR at two different sites in New South Wales, Australia. They reported R2, RMSECV and RPD values of (0.61–0.03), 83.6–228.7 mg kg−1 and 1.63–0.93, respectively. From the current results, it seems that more research will be necessary to use a larger number of soil samples collected with a W-shape in the PLSR analysis, and that an independent validation set with samples not used in the calibration set (cross-validation) should be used to test the model accuracy and robustness.
The composition of parent material (e.g., mineralogy and geochemistry) and its weathering conditions affect the concentration of K-40, Th-223, and U-238 in soils [10]. Unfortunately, no data on the geochemistry and mineralogy of the soils of the studied fields are available. However, we can speculate that good calibrations were obtained for Ka content because of chemical weathering of K-feldspars minerals [40,41]. Additionally, Kt content is high due to the frequently applied K2O fertilizer in the target field. The positive PLSR regression coefficients peaks at 1460, 1760 and 2720 keV (Figure 6d–f) were obtained at energies that correspond to K-40, U-238 and Th-223, respectively, and are attributed to the fact that these elements are adsorbed onto clay particles and Fe oxides [10,42]. It can be clearly seen in Figure 6d that the largest positive peak is at around 1600 KeV, which is near the K-40 band at 1760 keV. The second largest positive correlation is around 2720 keV (Figure 6d), which is associated with the Th-223 band at 2600 keV. The regression coefficient peaks of the SF dataset are the largest (Figure 6d), compared to those of SF-CB (Figure 6e) and SF-SL (Figure 6f) sets, confirming the SF to be the best performing dataset in the current study.
It can be assumed that the correlations between K-40 and Ka vary depending on several factors including soil texture and pH. For PLSR, this is not an issue as K-40 was not used as a predictor, while for the univariate analysis this will be an issue and the degree of correlation between K-40 and Ka will affect the prediction results of Ka. In case the univariate analysis does not provide accurate correlations between K-40 and Ka, the PLSR can then be used.

4.3. Soil Maps

The measured Ka map shows the highest concentration at the western part of the field and this gradually decreases towards the eastern part. This gradual decrease is attributed to the slope that increases from the eastern part towards the western part of the field, indicating the potential wash of soil nutrients, including Ka, into the bottom western end of the field. However, the spatial distribution of the measured Ka is not greatly detailed, since the number of physical soil samples taken from the field is much less (e.g., 45 samples), compared to the on-the-go collected gamma-ray readings (3291) to be discussed below. Additionally, the spatial distribution of soil samples collected for laboratory analyses was not homogenous across the entire area of the field, which also affects the spatial distribution of Ka, something one should keep in mind when comparing the measured Ka map with the corresponding on-the-go predicted maps.
It is clearly demonstrated and in-line with the measured Ka map, that the highest on-the-go measured K-40 concentration is in the bottom side of the western part of the field, and this gradually decreases towards the eastern end. Compared to the spatial distribution of the measured ECa, one may observe spatial similarity, which is encouraging to suggest the potential use of the on-the-go gamma-ray technique for future mapping of not only Ka, but perhaps, soil variability and texture, which is also reported in the literature to be possible [12].
The spatial distribution of predicted Ka concentrations is similar to those of the measured Ka and K-40 values. The concentration of Ka increases from the eastern side towards the western side of the field, and is attributed to the increase in slope in this direction. It can also be noticed that a similar spatial distribution pattern exists between the PLSR predicted on-the-go map, the 3DPF predicted on-the-go map, and the measured Ka. This is also in agreement with the spatial distribution of the ECa map. The spatial similarity of the measured versus predicted maps is encouraging indeed and suggests that the gamma-ray sensing technology holds promising potential for the measurement and mapping of Ka, if a proper sampling strategy is followed, where the sampling area (e.g., 10 m by 10 m) matches the active area, over which the natural radioactive electromagnetic waves are collected by the gamma-ray sensor during the on-the-go measurement.

4.4. Fertilization Recommendation

It was noticed that the Ka maps derived from the on-the-go gamma-ray survey highlighted large areas of the field with relatively low Ka concentrations (Figure 7). An inadequate provision of Ka can influence the harvests of previous crops. Additionally, zones with a high concentration of Ka may receive over application of K2O if homogeneous fertilization is implemented. In fact, the homogeneous fertilization rate in the entire field will result in under- or over-application, hence, variable rate K2O fertilization can potentially optimize the amount of K added according to the crop need, where and when it is needed. This hypothesis was tested in this study.
The recommended amount of K2O, calculated based on the measured Ka using laboratory wet chemistry, was very similar to that predicted with both the 3DPF model and the PLSR model. However, the recommendation based on the PLSR prediction would consume a higher amount of K2O, than the other two methods. It is worth noting that the best performing PLSR model of the SF dataset was developed with a relatively small number of samples (45 samples), collected with the W-shape sampling scheme over a 10 m by 10 m area. This means that more samples (collected with the W-shape mode covering the entire cell area of 10 m by 10 m) should be added to increase the size of the calibration dataset to reach the requirement for a robust PLSR prediction model. Additionally, it is recommended that the PLSR model is validated independently by dividing a larger dataset into a calibration set and a validation set, a common practice adopted in spectral analyses in the literature. Due to the limited resources this was not possible in the current project, and a further study should be undertaken to complete this objective.

5. Conclusions

In this study, a gamma-ray spectrometer with a 4 L NaI(Tl)-crystal, automatic peak-stabilization detector was evaluated for the prediction and mapping available potassium (Ka) in a silt loam field of 8.4 ha area. Two models were used to predict Ka across the field, namely, a simple third order polynomial function (3DPF) and a partial least squares regression (PLSR). Results indicated that gamma-ray spectrometry holds promising potential to measure Ka, if a correct sampling scheme is adopted. The best sampling scheme in this study was the W-shape sampling method, covering 10 m by 10 m area, the same size of area, over which the passive gamma-ray electromagnetic waves were collected. The number of samples has little influence, compared to the method of sampling. Although a relatively small number of samples (45 samples) were used for the development of the best performing PLSR calibration model of the single field dataset (based on W-shape sampling method), the cross-validation analysis resulted in a very good performance with a coefficient of determination (R2) of 0.85, a ratio of prediction deviation (RPD) of 2.67, a root mean square error of cross-validation (RMSECV) of 2.29 mg 100 g−1 and a ratio of performance to interquartile distance (RPIQ) of 2.61. Adopting the W-shape sampling method is suggested, using a larger number of soil samples in order to develop a robust PLSR calibration model of Ka. The model should be validated independently, by using samples that are not used in the calibration stage.
The observed clear similarity between the laboratory measured and both on-the-go predicted Ka maps with the 3DPF polynomial and PLSR models proves that both models are in agreement and both are valid to predict Ka at the field scale. Recommendation maps of K2O fertilization also show similarity between both methods with no significant difference in the amount of fertilizer used. However, in order to evaluate the economic and environmental benefits of site specific K2O applications based on the gamma-ray survey, agronomic, cost–benefit and environmental analyses will all be needed to optimize the method to predict Ka with gamma-ray spectroscopy.

Author Contributions

All the authors substantially contributed to this article. A.M.M. conceptualized the paper, set up sample design and methodology, while A.M.K. and S.N. collected data, conducted data analysis and wrote a draft of the manuscript. S.N. contributed to writing, reviewing and editing the manuscript. In addition, corresponding author, Mouazen, A.M.M. reviewed and edited the paper. He is the Odysseus project coordinator, who secured the project fund. All authors have read and agreed to the published version of the manuscript.

Funding

This research was funded by Research Foundation-Flanders (FWO) for Odysseus I SiTeMan, grant number [Nr. G0F9216N].

Informed Consent Statement

Not applicable.

Data Availability Statement

Not applicable.

Acknowledgments

Authors acknowledge the financial support received from the Research Foundation-Flanders (FWO) for Odysseus I SiTeMan Project (Nr. G0F9216N).

Conflicts of Interest

The authors declare no conflict of interest.

References

  1. Meena, V.S.; Bahadur, I.; Maurya, B.R.; Kumar, A.; Meena, R.K.; Meena, S.K.; Verma, J.P. Potassium-solubilizing microorganism in evergreen agriculture: An overview. In Potassium Solubilizing Microorganisms for Sustainable Agriculture; Springer: New Delhi, India, 2006; pp. 1–20. [Google Scholar]
  2. Sparks, D.L. Potassium Dynamics in Soils. Adv. Soil Sci. 1987, 6, 1–63. [Google Scholar]
  3. Zörb, C.; Senbayram, M.; Peiter, E. Potassium in agriculture—Status and perspectives. J. Plant Physiol. 2014, 171, 656–669. [Google Scholar] [CrossRef]
  4. Stenberg, B.; Viscarra Rossel, R.A.; Mouazen, A.M.; Wetterlind, J. Visible and Near Infrared Spectroscopy in Soil Science. Adv. Agron. 2010, 107, 163–215. [Google Scholar]
  5. Kuang, B.; Mahmood, H.; Quraishi, Z.; Hoogmoed, W.; Mouazen, A.; Van Henten, E.J. Sensing Soil Properties in the Laboratory, In Situ, and On-Line. Adv. Agron. 2012, 14, 155–224. [Google Scholar]
  6. Farrell, R.E.; Scott, A.D. Ion-selective electrode determinations of exchangeable potassium in soils. Soil Sci. Soc. Am. J. 1987, 51, 594–598. [Google Scholar] [CrossRef]
  7. Brouder, S.M.; Thom, M.; Adamchuk, V.I.; Morgan, M.T. Potential uses of ion-selective K electrodes in soil fertility management. Commun. Soil Sci. Plant Anal. 2003, 34, 2699–2726. [Google Scholar] [CrossRef]
  8. Soriano-Disla, J.M.; Janik, L.J.; Viscarra Rossel, R.A.; Macdonald, L.M.; McLaughlin, M.J. The performance of visible, near-, and mid-infrared reflectance spectroscopy for prediction of soil physical, chemical, and biological properties. Appl. Spectrosc. Rev. 2014, 49, 139–186. [Google Scholar] [CrossRef]
  9. Adamchuk, V.I.; Lund, E.; Sethuramasamyraja, B.; Dobermann, A.; Marx, D.B. Direct measurement of soil chemical properties on-the-go using ion selective electrodes. Comput. Electron. Agric. 2005, 48, 272–294. [Google Scholar] [CrossRef]
  10. Rossel, R.A.V.; Taylor, H.J.; McBratney, A.B. Multivariate calibration of hyperspectral γ-ray energy spectra for proximal soil sensing. Eur. J. Soil Sci. 2007, 58, 343–353. [Google Scholar] [CrossRef]
  11. Priori, S.; Bianconi, N.; Costantini, E.A.C. Can γ-radiometrics predict soil textural data and stoniness in different parent materials? A comparison of two machine-learning methods. Geoderma 2014, 226, 354–364. [Google Scholar] [CrossRef]
  12. Heggemann, T.; Welp, G.; Amelung, W.; Angst, G.; Franz, S.; Koszinski, S.; Schmidt, K.; Pätzold, S. Proximal gamma-ray spectrometry for site-independent in situ prediction of soil texture on ten heterogeneous fields in Germany using support vector machines. Soil Tillage Res. 2017, 168, 99–109. [Google Scholar] [CrossRef]
  13. Van Egmond, F.M.; Loonstra, E.H.; Limburg, J. Gamma-ray Sensor for Topsoil Mapping: The Mole. In Proximal Soil Sensing, 1st ed.; Rossel, R.A.V., McBratney, A.B., Minasny, B., Eds.; Springer: Berlin/Heidelberg, Germany, 2010; pp. 323–332. [Google Scholar]
  14. Wong, M.T.F.; Harper, R.J. Use of on-ground gamma-ray spectrometry to measure plant-available potassium and other topsoil attributes. Aust. J. Soil Res. 1999, 37, 267–277. [Google Scholar] [CrossRef]
  15. Pracilio, G.; Adams, M.L.; Smettem, K.R.J.; Harper, R.J. Determination of spatial distribution patterns of clay and plant available potassium contents in surface soils at the farm scale using high resolution gamma ray spectrometry. Plant Soil. 2006, 282, 67–82. [Google Scholar] [CrossRef]
  16. Taylor, M.J.; Smettem, K.; Pracilio, G.; Verboom, W. Relationships between soil properties and high-resolution radiometrics, central eastern Wheatbelt, western Australia. Explor. Geophys. 2002, 33, 95–102. [Google Scholar] [CrossRef]
  17. Mahmood, H.S.; Hoogmoed, W.B.; van Henten, E.J. Proximal gamma-ray spectroscopy to predict soil propertiesusing windows and full-spectrum analysis methods. Sensors 2013, 13, 16263–16280. [Google Scholar] [CrossRef] [PubMed] [Green Version]
  18. Dierke, C.; Werben, U. Relationships between gamma-ray data and soil properties at an agricultural test site. Geoderma 2013, 199, 90–98. [Google Scholar] [CrossRef]
  19. Castrignano, A.; Wong, M.T.F.; Stelluti, M.; De Benedetto, D.; Sollitto, D. Use of EMI, gamma-ray emission and GPS height as multi-sensor data for soil characterisation. Geoderma 2012, 175, 78–89. [Google Scholar] [CrossRef]
  20. Royal Meteorological Institute of Belgium (RMI). Klimaatatlas, May 2015. Available online: www.meteo.be/klimaatlas (accessed on 20 August 2019).
  21. Baeyens, L.; Dudal, R. Verklarende Tekst en Het Kaartblad Duisburg 103W Comité Voor Het Opnemen Van de Bodemkaart Van Belgë, Ghent; Ghent University: Gent, Belgium, 1959. [Google Scholar]
  22. Dondeyne, S.; Vanierscot, L.; Langohr, R.; Van Ranst, E.; Deckers, J. The Soil Map of the Flemish Region Converted to the 3rd Edition of the World Reference Base for Soil Resources; Ghent University: Gent, Belgium, 2014. [Google Scholar]
  23. Duivenstijn, A.J.; Venverloo, L. Practical gamma spectrometry. Charles Thomas Springf. 1963, III, 156. [Google Scholar]
  24. Sudduth, K.A.; Kitchen, N.R.; Drummond, S.T. Soil conductivity sensing on claypan soils: Comparison of electromagnetic in duction and direct methods. In Proceedings of the 4th International Conference on Precision Agriculture, St. Paul, MN, USA, 19–22 July 1999; Robert, P.C., Ed.; ASA, CSSA, and SSSA: Madison, WI, USA, 1999; pp. 979–990. [Google Scholar]
  25. Franzen, D.W.; Kitchen, N.R. Developing management zones to target nitrogen applications. In Site-Specific Management Guidelines.SSMG-5; Potash and Phosphate Inst.: Norcross, GA, USA, 1999. [Google Scholar]
  26. Heiniger, R.; Mcbride, R.; Clay, D. Using Soil Electrical Conductivity to Improve Nutrient Management. Agron. J. 2003, 95, 508–519. [Google Scholar] [CrossRef]
  27. Jaynes, D.B.; Colvin, T.S.; Ambuel, J. Yield mapping by electromagnetic induction. In Proceedings of the International Conference Site-Specific Management for Agricultural Systems, Minneapolis, MN, USA, 27–30 March 1995; Robert, P.C., Ed.; ASA, CSSA, and SSSA: Madison, WI, USA, 1995; pp. 383–394. [Google Scholar]
  28. Sudduth, K.A.; Kitchen, N.R.; Hughes, D.F.; Drummond, S.T. Electromagnetic induction sensing as an indicator of productivity on claypan soils. In Proceedings of the 3rd International Conference on Precision Agriculture, Minneapolis, MN, USA, 23–26 June 1996; Robert, P.C., Ed.; ASA, CSSA, and SSSA: Madison, WI, USA, 1996; pp. 671–681. [Google Scholar]
  29. Kitchen, N.R.; Sudduth, K.A.; Drummond, S.T. Soil electrical conductivity as a crop productivity measure for claypan soils. J. Prod. Agric. 1999, 12, 607–617. [Google Scholar] [CrossRef]
  30. Martens, H.; Næs, T. Multivariate Calibration; John Wiley & Sons: Hoboken, NJ, USA, 1989. [Google Scholar]
  31. Stevens, A.; Ramirez-Lopez, L.; Vignette, R. An Introduction to the Prospectr Package. 2013. Available online: https://github.com/antoinestevens/prospectr (accessed on 21 July 2019).
  32. Wold, S.; Sjostrom, M.; Eriksson, L. PLS-Regression: A Basic Tool of Chemometrics. Chemom. Intell. Lab. Syst. 2001, 58, 109–130. [Google Scholar] [CrossRef]
  33. Rossel, R.A.V.; McGlynn, R.N.; McBratney, A.B. Determining the composition of mineral-organic mixes using UV–vis–NIR diffuse reflectance spectroscopy. Geoderma 2006, 137, 70–82. [Google Scholar] [CrossRef]
  34. Chiozzi, P.; Pasquale, V.; Verdoya, M. Naturally occurring radioactivity at the Alps-Apennines transition. Radiat. Meas. 2002, 35, 147–154. [Google Scholar] [CrossRef]
  35. Baeza, A.; Del-Rio, M.; Miro, C. Natural radioactivity in soils of the province of Caceres (Spain). Radiat. Prot. Dosim. 1992, 45, 261–263. [Google Scholar] [CrossRef]
  36. UNSCEAR. Sources and effects of ionizing radiation. In Report to General Assembly, with Scientific Annexes; United Nations: New York, NY, USA, 2000. [Google Scholar]
  37. Grasty, R.L. Applications of gamma radiation in remote sensing. In Remote Sensing for Environmental Science; Schanda, E., Ed.; Springer: New York, NY, USA, 1997; pp. 257–276. [Google Scholar]
  38. Cook, S.E.; Corner, R.J.; Groves, P.R.; Grealish, G.J. Use of airborne gamma radiometric data for soil mapping. Aust. J. Soil Res. 1996, 34, 183–194. [Google Scholar] [CrossRef]
  39. de Groot, A.V.; van der Graaf, E.R.; de Meijer, R.J.; Maučec, M. Sensitivity of in-situ γ-ray spectra to soil density and water content. Nucl. Instrum. Methods Phys. Res. Sect. A Accel. Spectrometers Detect. Assoc. Equip. 2009, 600, 519–523. [Google Scholar] [CrossRef]
  40. Manning, D.A.C. Mineral sources of potassium for plant nutrition. A review. Agron. Sustain. Dev. 2010, 30, 281–294. [Google Scholar] [CrossRef] [Green Version]
  41. Ciceri, D.; Allanore, A. Microfluidic leaching of soil minerals: Release of K+ from K feldspar. PLoS ONE 2015, 10, e0139979. [Google Scholar] [CrossRef]
  42. Megumi, K.; Mamuro, T. Concentrations of uranium series nuclides in soil particles in relation to their size. J. Geophys. Res. 1977, 82, 353–356. [Google Scholar] [CrossRef]
Figure 1. Location and map of the studied field (a) and on-the-go measurement lines and locations of sampling points (b).
Sustainability 13 00661 g001
Figure 2. Measurement setup using a portable gamma-ray spectrometer attached to a tractor.
Sustainability 13 00661 g002
Figure 3. Map of the apparent electrical conductivity (ECa) of the studied field, and sampling points, from which soil samples will be collected during gamma-ray measurement.
Sustainability 13 00661 g003
Figure 4. Correlogram of the different soil properties (e.g., available potassium (K), sodium (Na), phosphorous (P), calcium (Ca), magnesium (Mg), pH, total organic carbon (TOC) and cation exchange capacity (CEC)) with gamma sensor outputs (e.g., K-40, U-238, Th-232, and principal components (PC1,2,3,4) of the principal components analysis). The absolute value of corresponding correlation coefficients is represented in the lower triangular matrix. The upper triangular matrix was visualized in circles, and the larger the size of circles the larger is the absolute value of corresponding correlation coefficients and vice-versa. The blue color represents positive values while the red color represents negative values.
Sustainability 13 00661 g004
Figure 5. The third order polynomial function (3DPF) that correlates the gamma-ray potassium (K-40) (%) and laboratory measured available potassium (Ka) (mg 100 g−1) using samples collected from the target Voor de Hoeve (VH) field.
Sustainability 13 00661 g005
Figure 6. Scatter plot of cross-validation results of measured available potassium (Ka) against predicted values based on partial least squares regression (PLSR) analysis using samples collected from different gamma-ray spectral datasets: (a) SF (single (Voor de Hoeve) target field), (b) SF-CB (45 samples from SF and 5 samples from Bottelare field) and (c) SF-SL (25 samples from SF + 113 samples from Bottelare field and other three fields). Regression coefficients plots are shown for the three datasets, respectively, in (df).
Sustainability 13 00661 g006
Figure 7. Soil maps of the target field: (a) locations of physical soil samples collected (b) map of laboratory measured soil available potassium (Ka), (c) map for gamma-ray potassium (K-40), (d) on-the-go predicted map of Ka based on third order polynomial function (3DPF), and (e) on-the-go predicted map of Ka based on partial least squares regression (PLSR) model.
Sustainability 13 00661 g007
Figure 8. Recommendation maps of K2O fertilization (a) developed based on on-the-go available potassium (Ka) predicted using the third polynomial function (3PLF) and (b) developed based on gamma-ray spectral analysis with partial least squares regression (PLSR).
Sustainability 13 00661 g008
Table 1. Summary statistics of laboratory measured available potassium (Ka) of soil samples, collected from (a) SF (a single Voor de Hoeve target field), (b) SF-CB (45 samples from SF spiked with 5 samples from Bottelare field), and (c) SF-SL (25 samples from SF spiked into 113 samples collected from Bottelare field and three other fields from a spectral library).
Dataset NoMinMedianMeanMax1stQ3rdQSD
(a) SFK-40 (%)450.100.500.471.100.400.600.16
Ka (mg 100 g−1)4519.024.026.252.023.029.06.1
pH456.06.46.67.76.27.10.5
TOC (%)450.81.01.12.01.01.10.2
P (mg 100 g−1)459.015.016.029.014.018.04.2
Mg (mg 100 g−1)4510.014.018.744.012.026.09.4
Ca (mg 100 g−1)45144.0194.0285.8962.0174.0338.0184.2
Na (mg 100 g−1)451.32.32.33.21.92.60.5
(b) SF-CBKa (mg 100 g−1)5019.024.026.452.023.028.76.2
(c) SF-SLKa (mg 100 g−1)13810.024.125.454.022.029.07.1
N = number of samples; Min. = Minimum; 1st Qu. = first quartile; 3rd Qu. = third quartile; SD = standard deviation; TOC: total organic carbon.
Table 2. Cross-validation results obtained from partial least squares regression (PLSR) analysis for the prediction of available potassium (Ka) (mg 100 g−1), using samples collected from different gamma-ray spectral datasets: (a) SF (single (Voor de Hoeve) target field), (b) SF-CB (45 samples from SF + 5 samples from Bottelare field), and (c) SF-SL (25 samples from Voor de Hoeve target field + 113 samples from Bottelare field and the other three fields).
Data SetRMSECV (mg 100 g−1)R2RPDRPIQ
(a) SF2.290.852.672.61
(b) SF-CB3.400.701.821.69
(c) SF-SL6.070.271.181.27
Note: RMSECV is root mean square error in cross-validation; RPD is ratio of prediction deviation; and RPIQ is ratio of performance to inter-quartile range.
Table 3. The amount of K2O fertilizer needed per hectare and per field calculated for different method of available potassium (Ka) measurement.
Recommendation MethodApplication MethodApplied Amount (kg/ha)Applied Amount (kg/Field)
Traditional soil analysisHomogeneous rate217.21824.5
Third order polynomial function (3DPF)Variable rate216.01814.4
=Partial least squares regression (PLSR) modelVariable218.71837.0
Publisher’s Note: MDPI stays neutral with regard to jurisdictional claims in published maps and institutional affiliations.

